


Spatial and Temporal Variability of Precipitation Complexity in Northeast Brazil

 , , , and
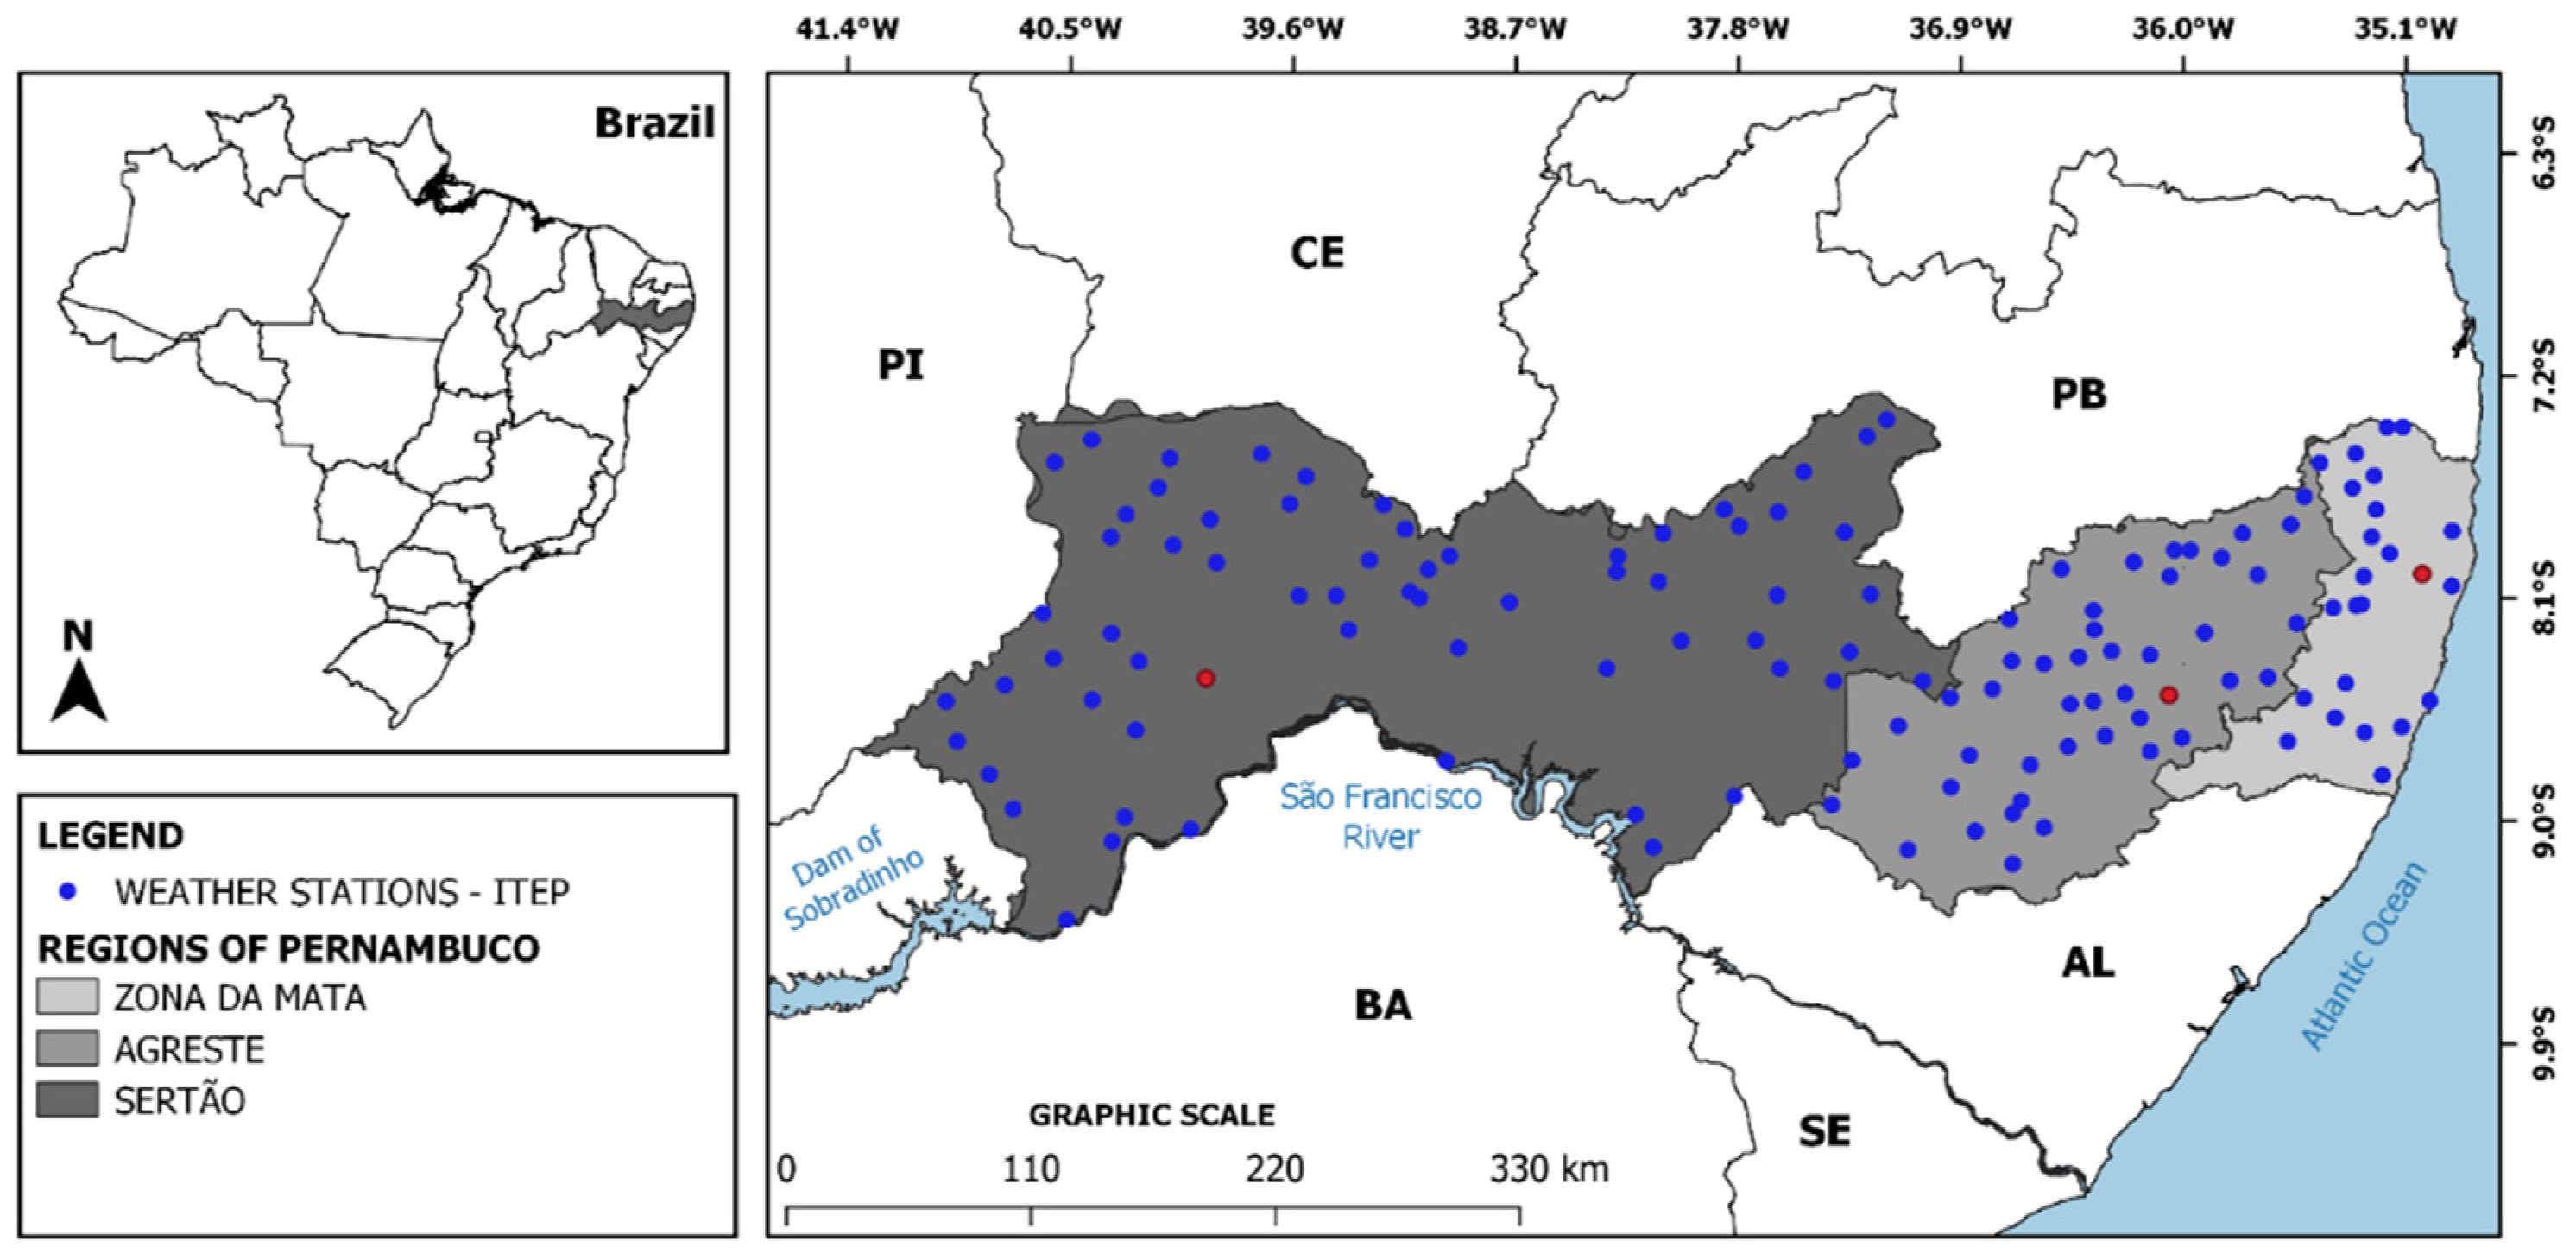
Abstract
1. Introduction
2. Materials and Methods
2.1. Study Area and Dataset
2.2. Sample Entropy (SampEn)
2.3. Time-Dependent SampEn
3. Results and Discussions
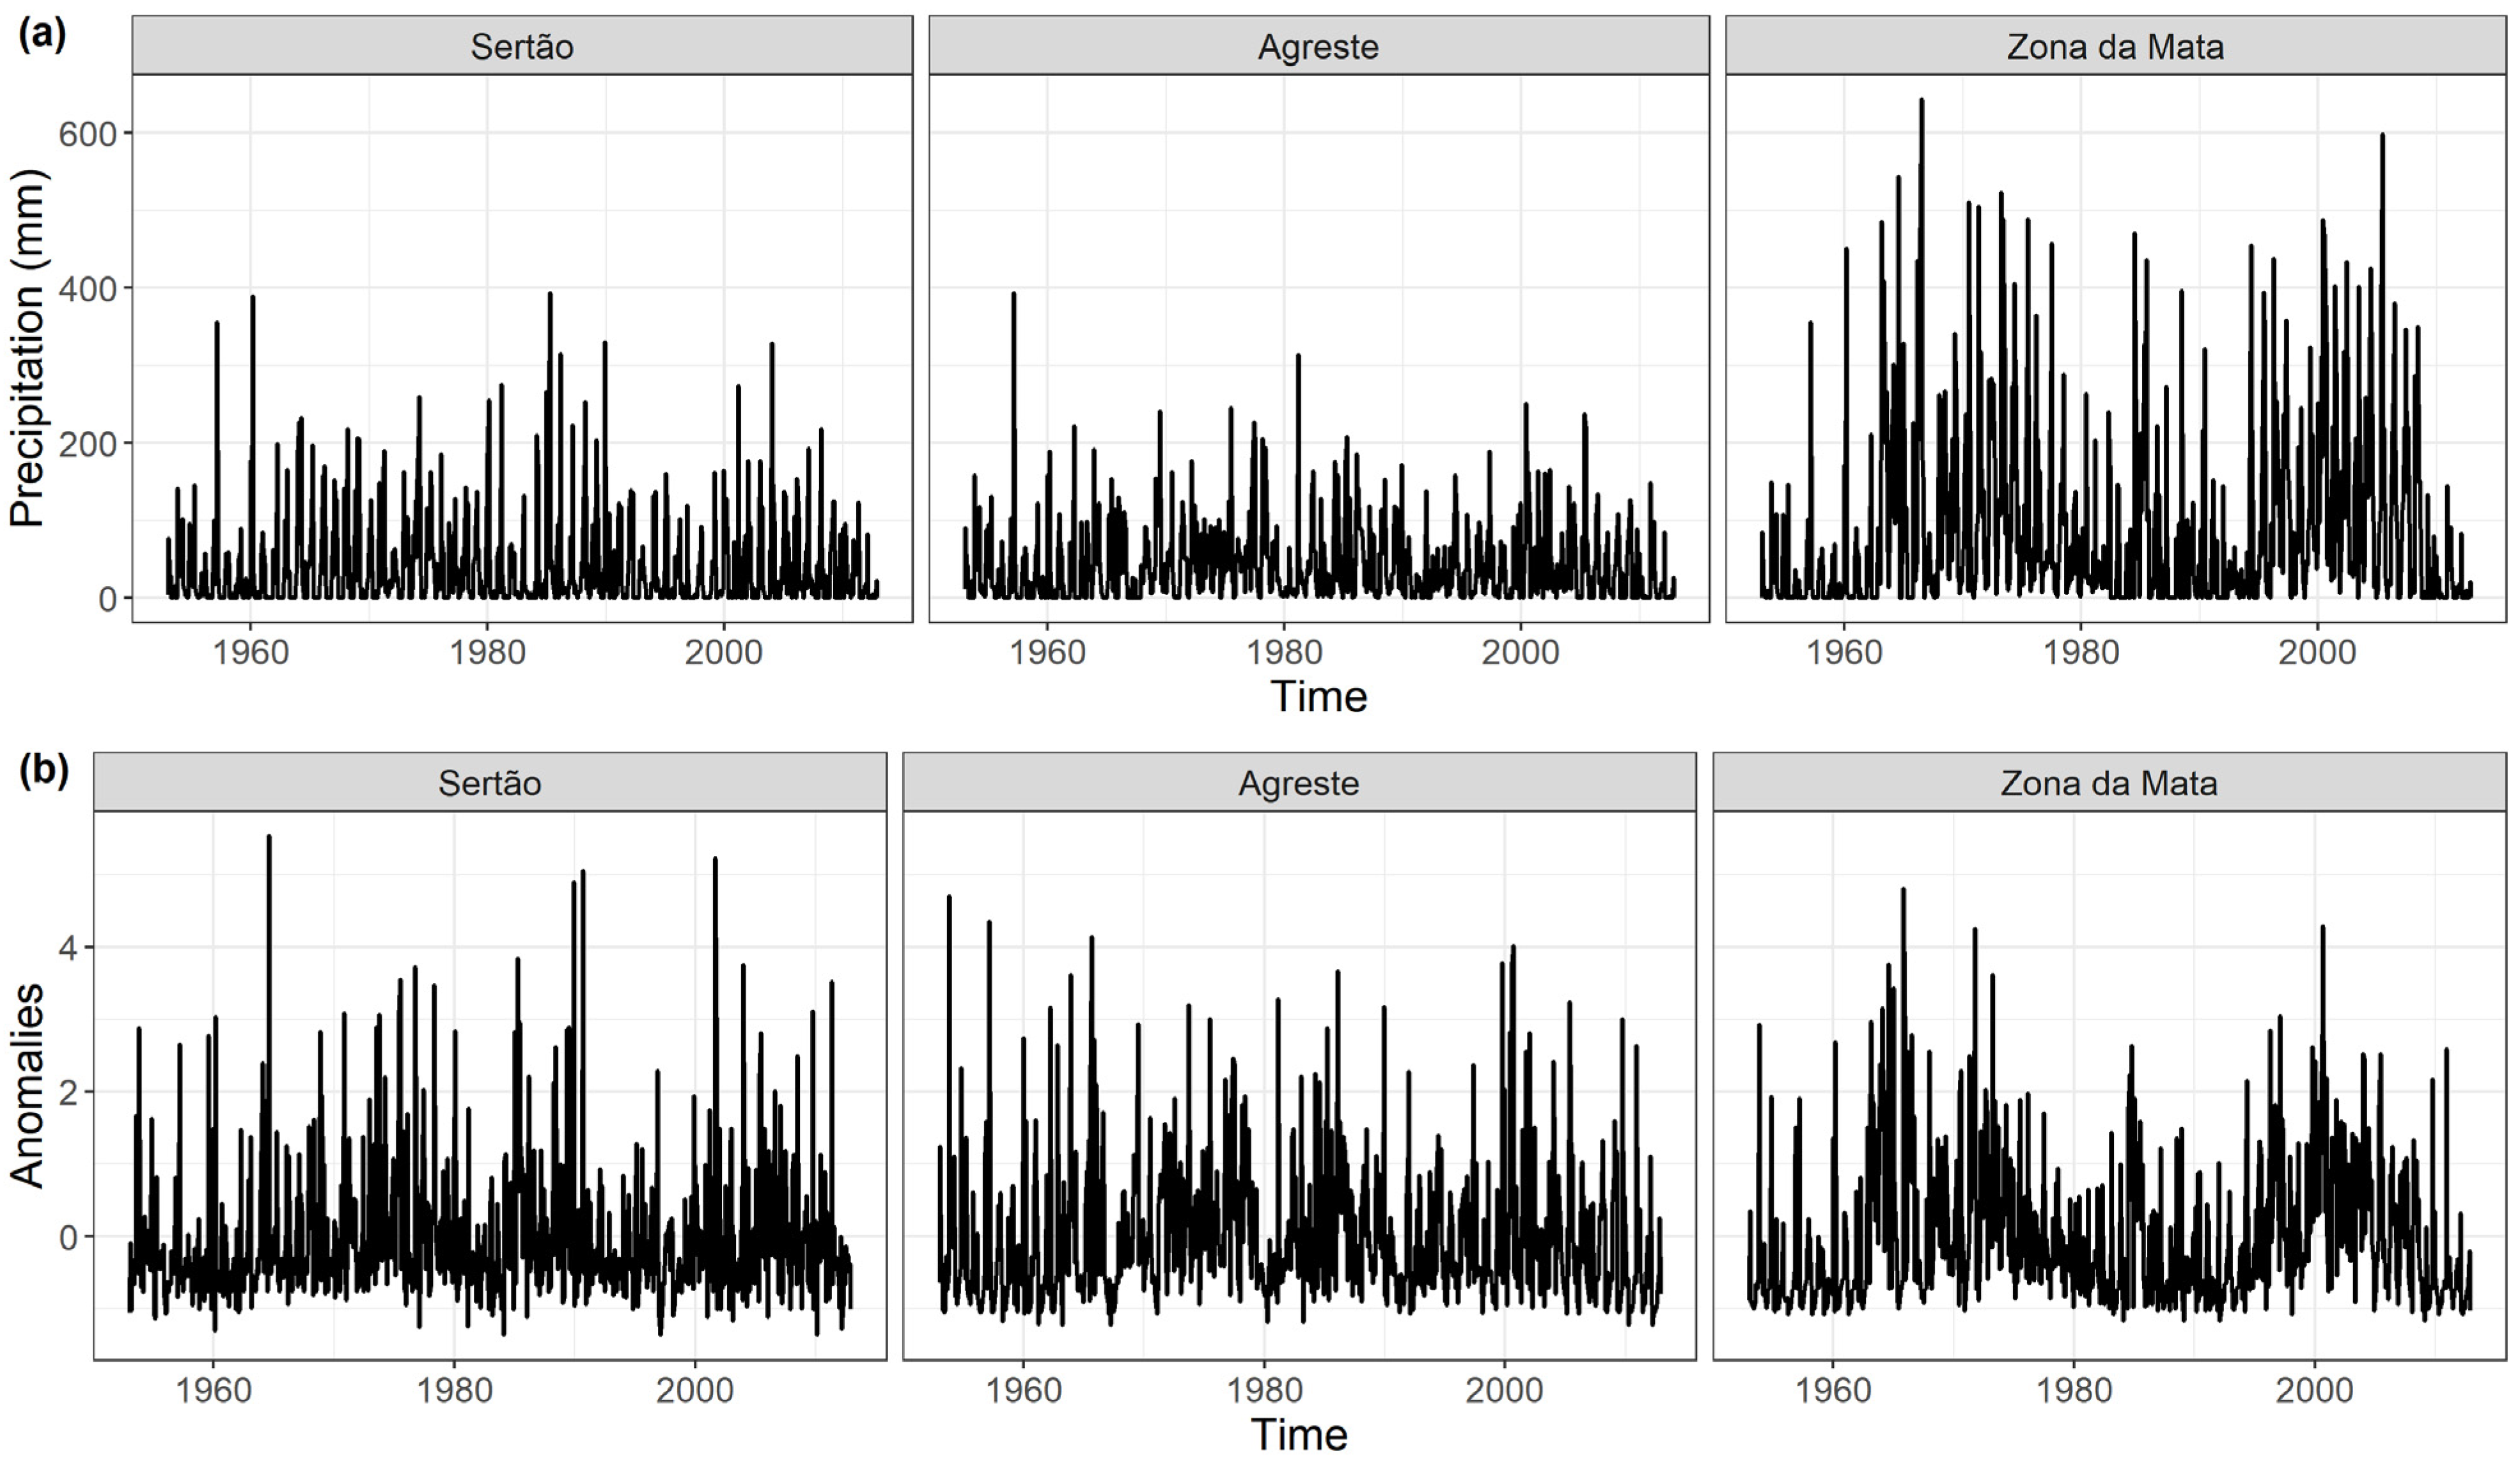
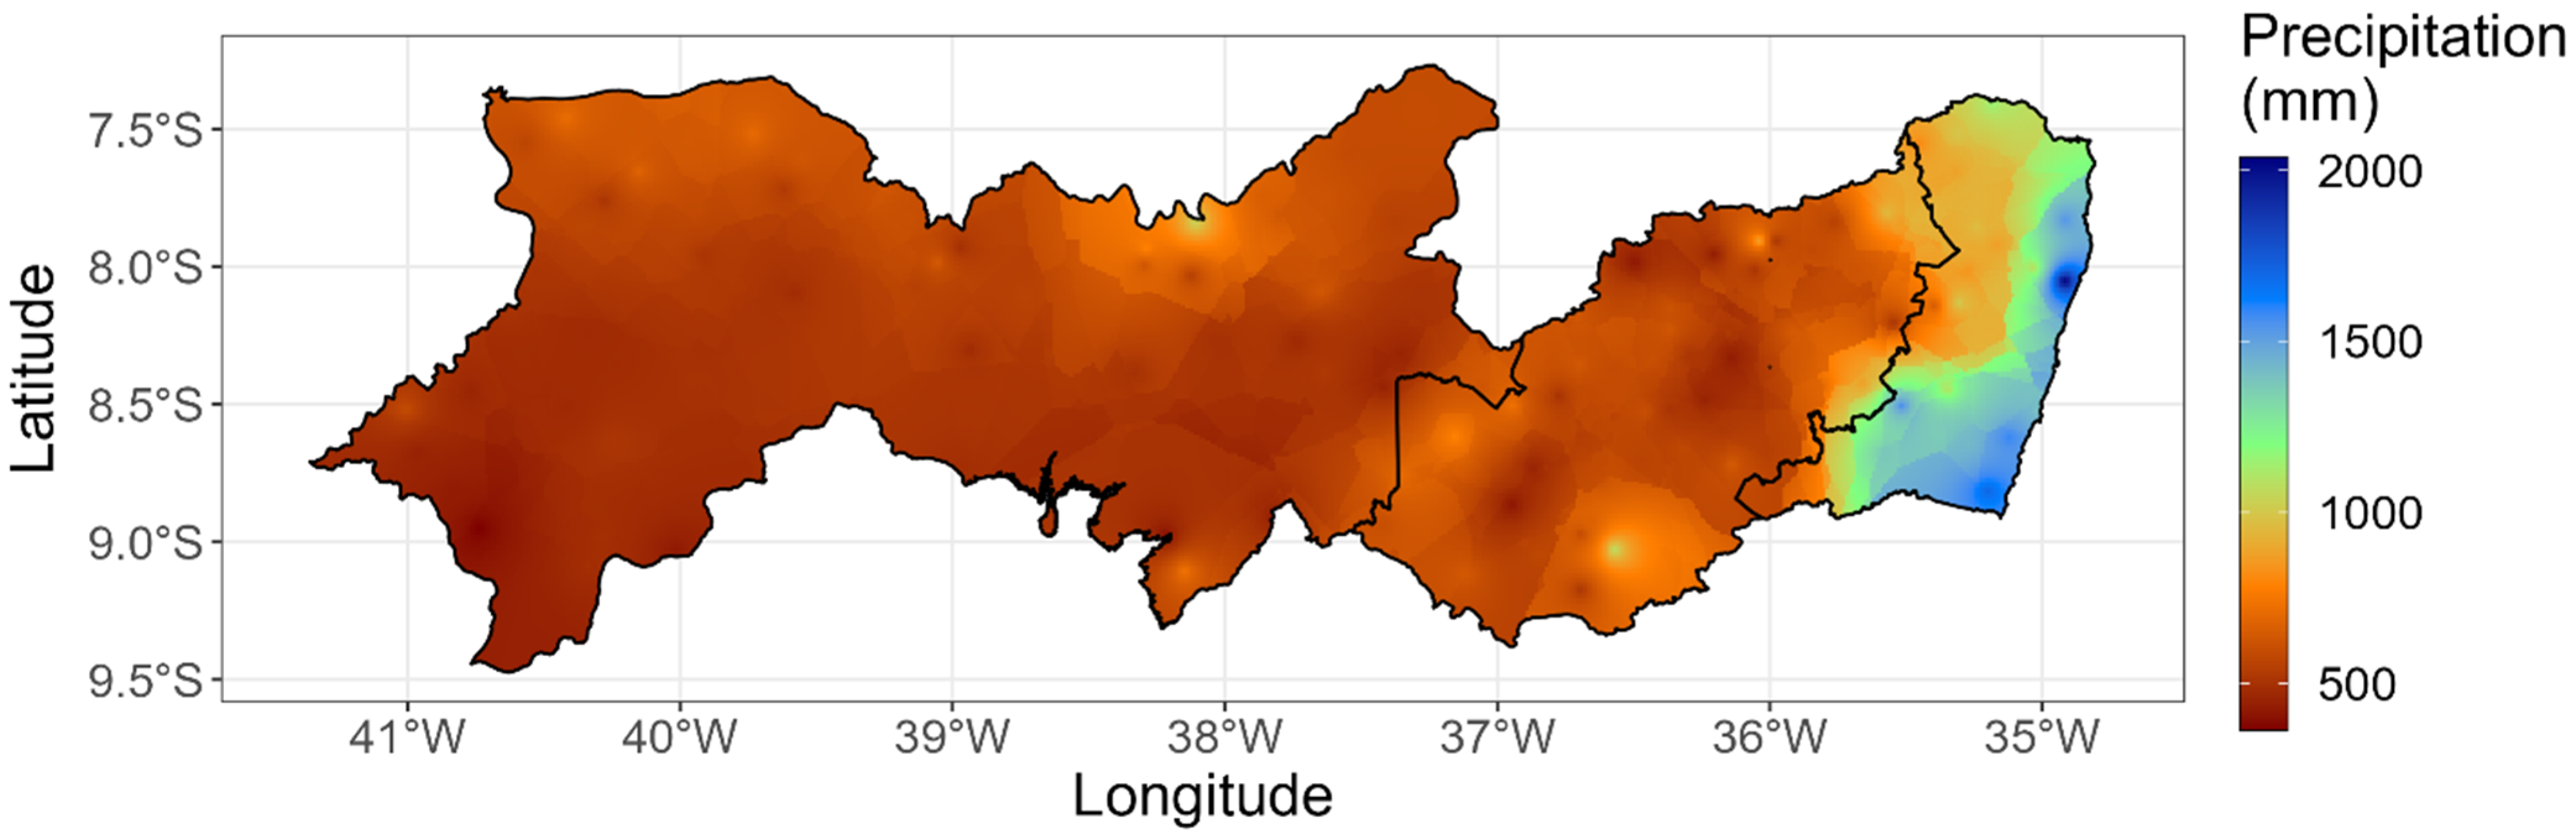
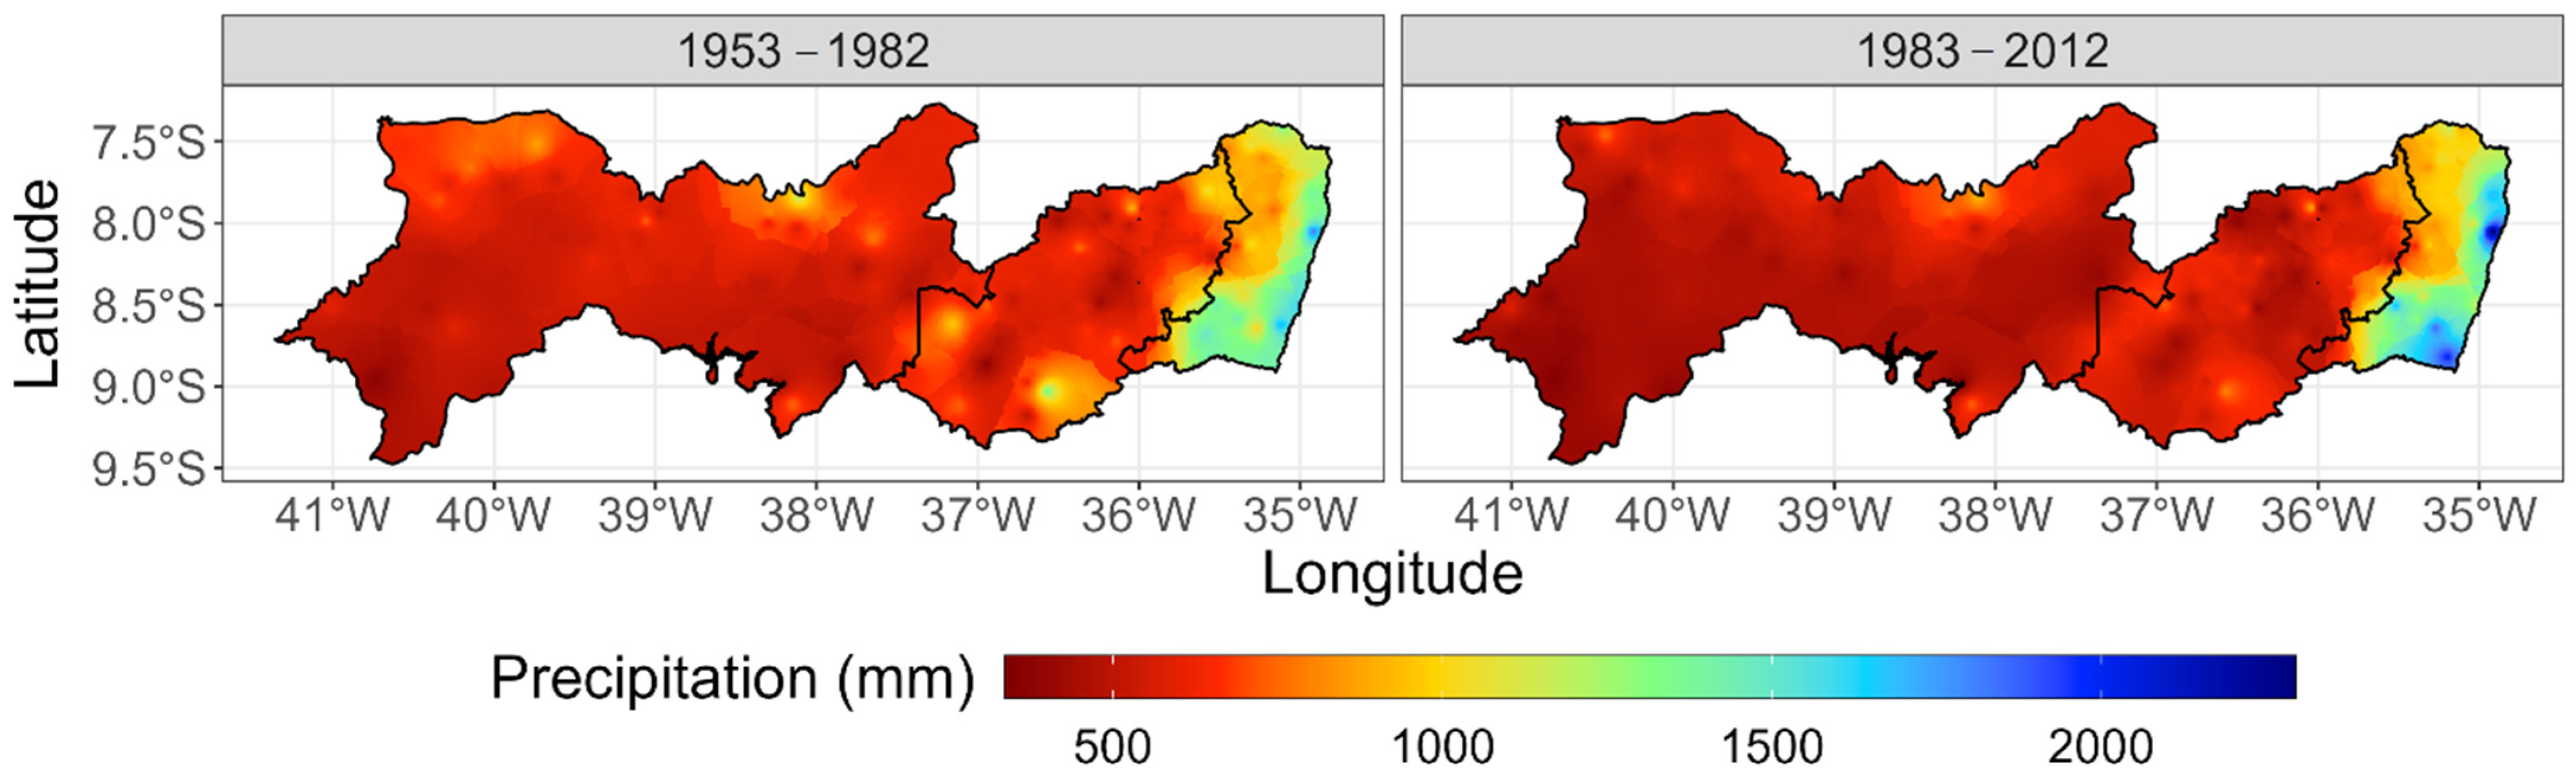
3.1. Spatio-Temporal Exploratory Data Analysis
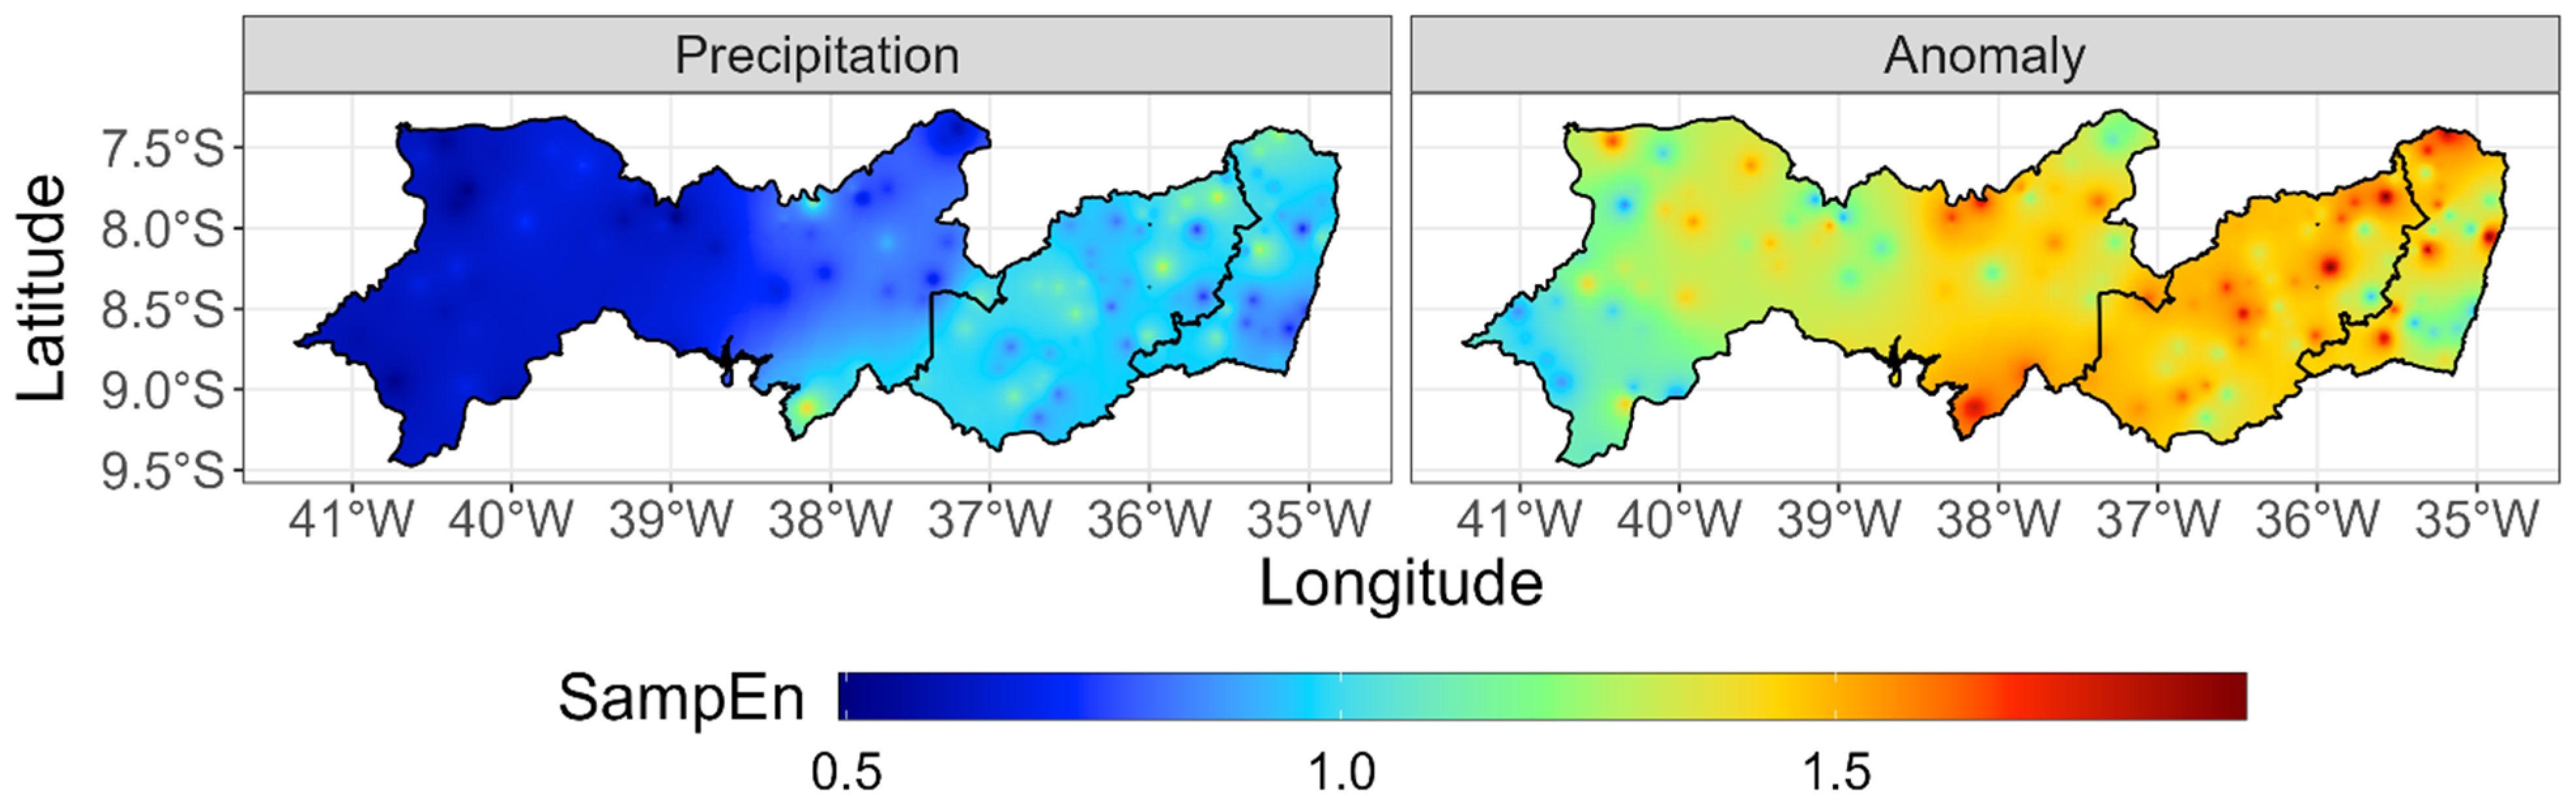
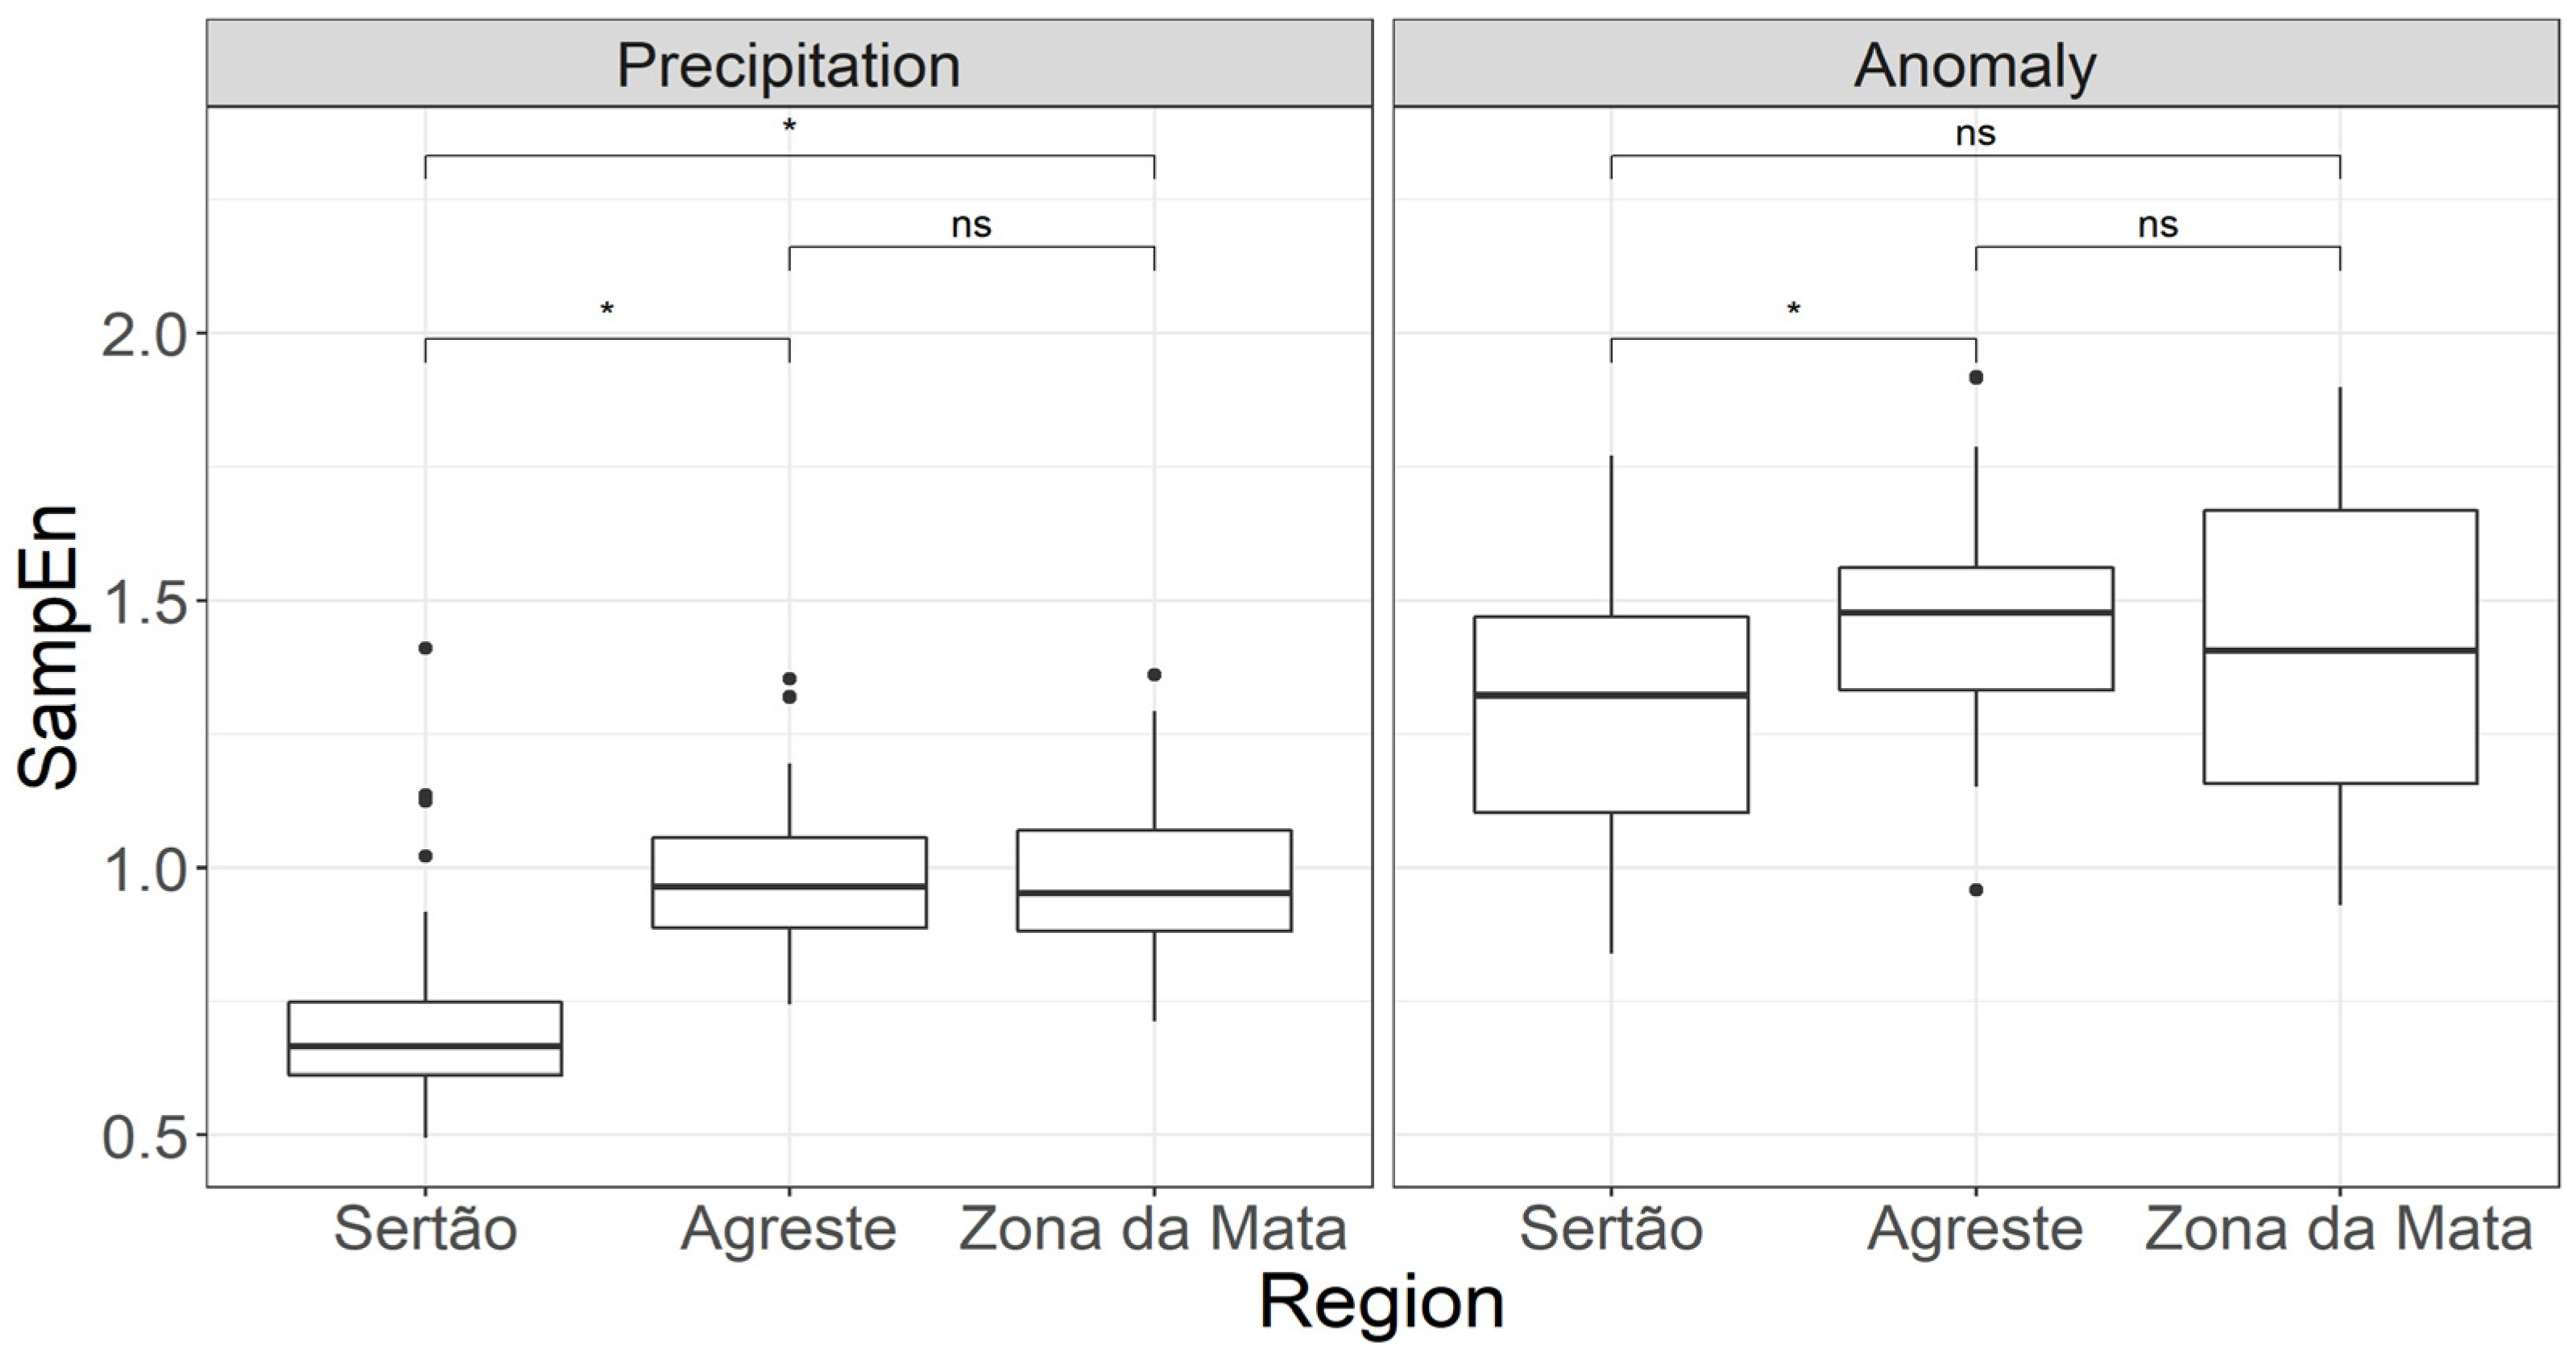
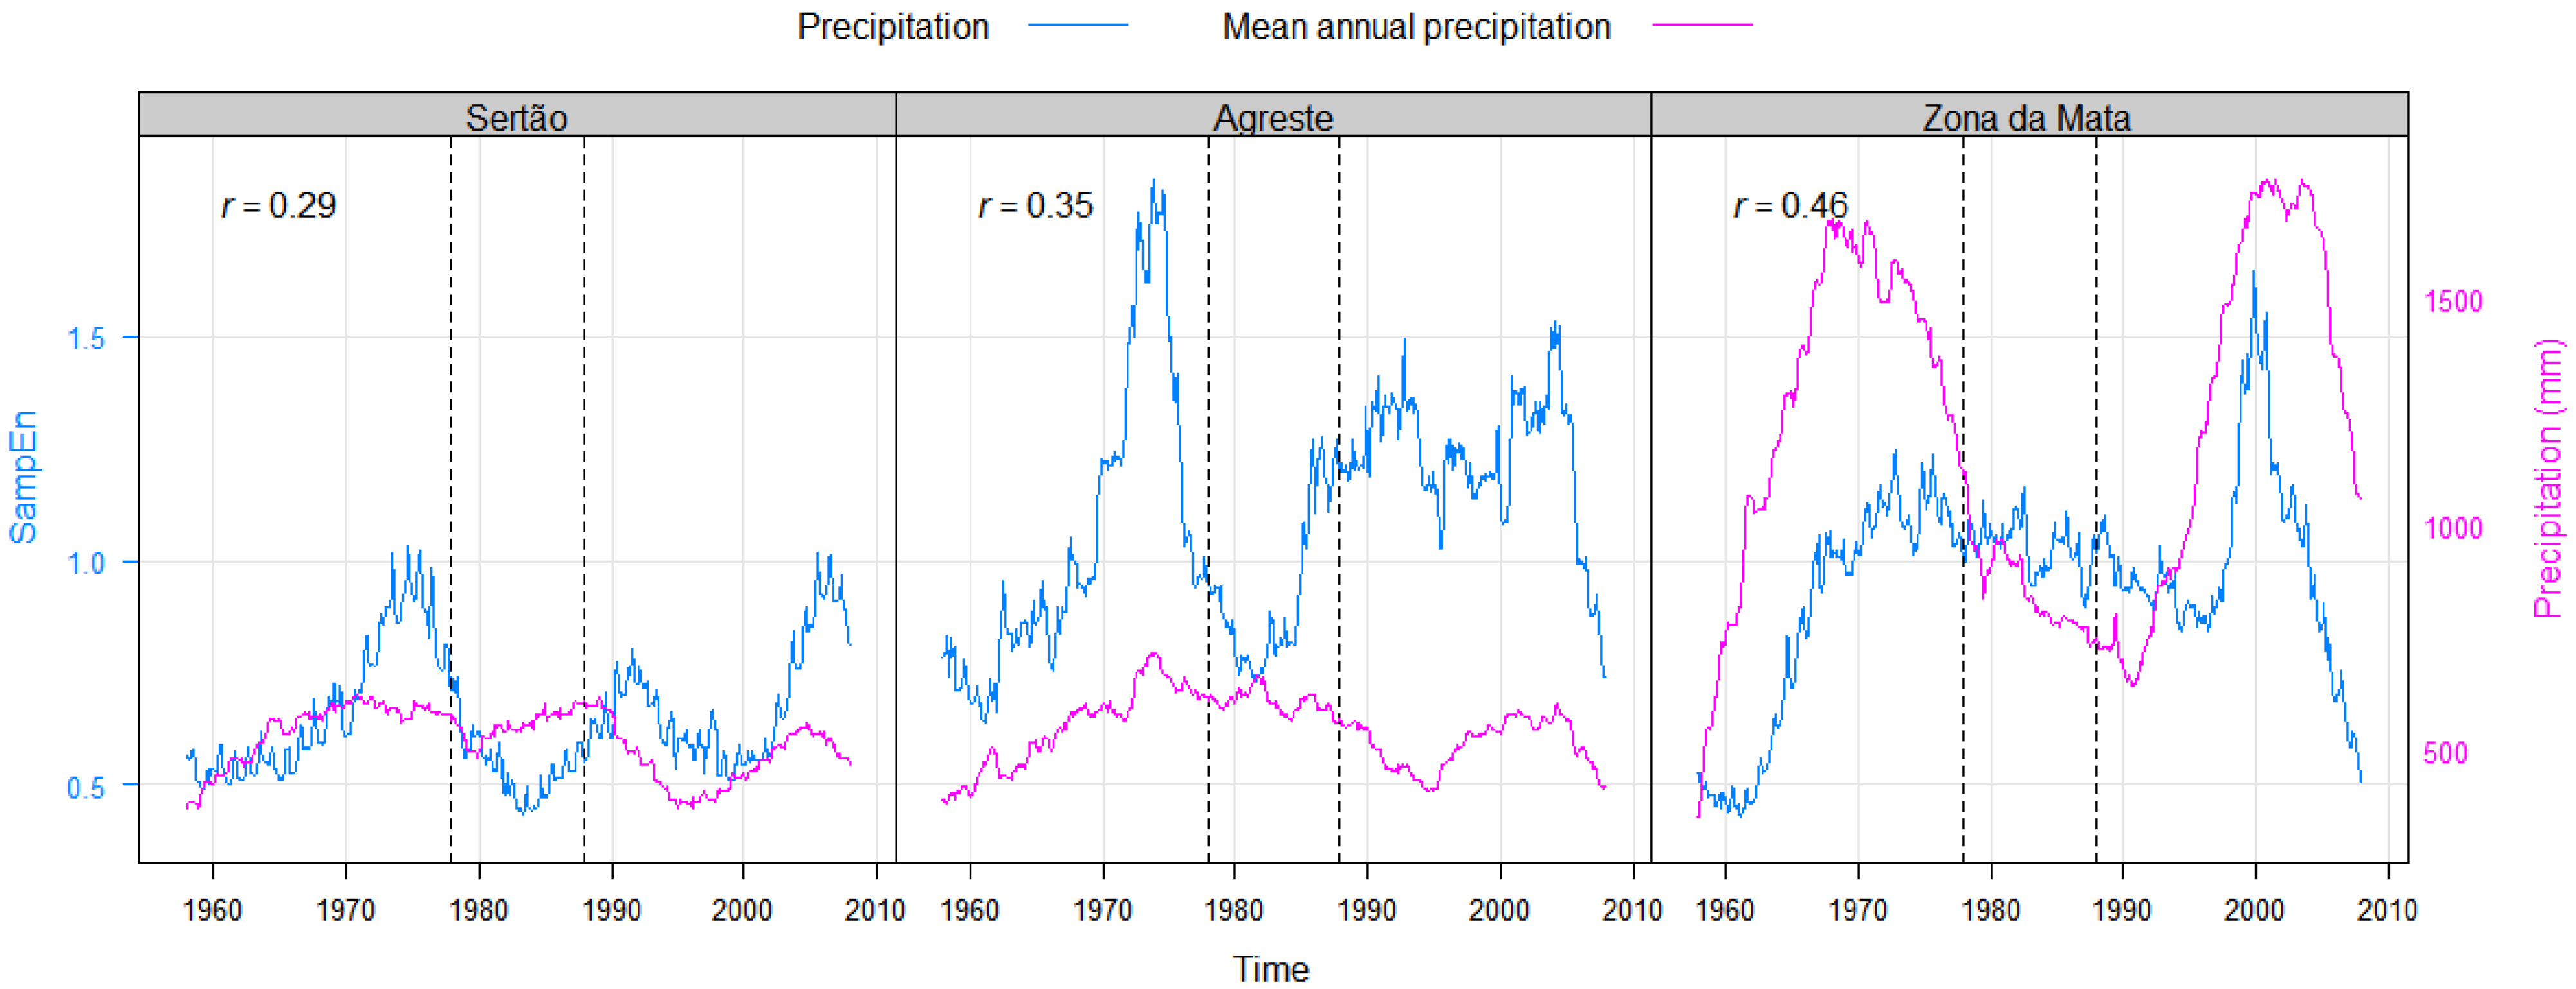
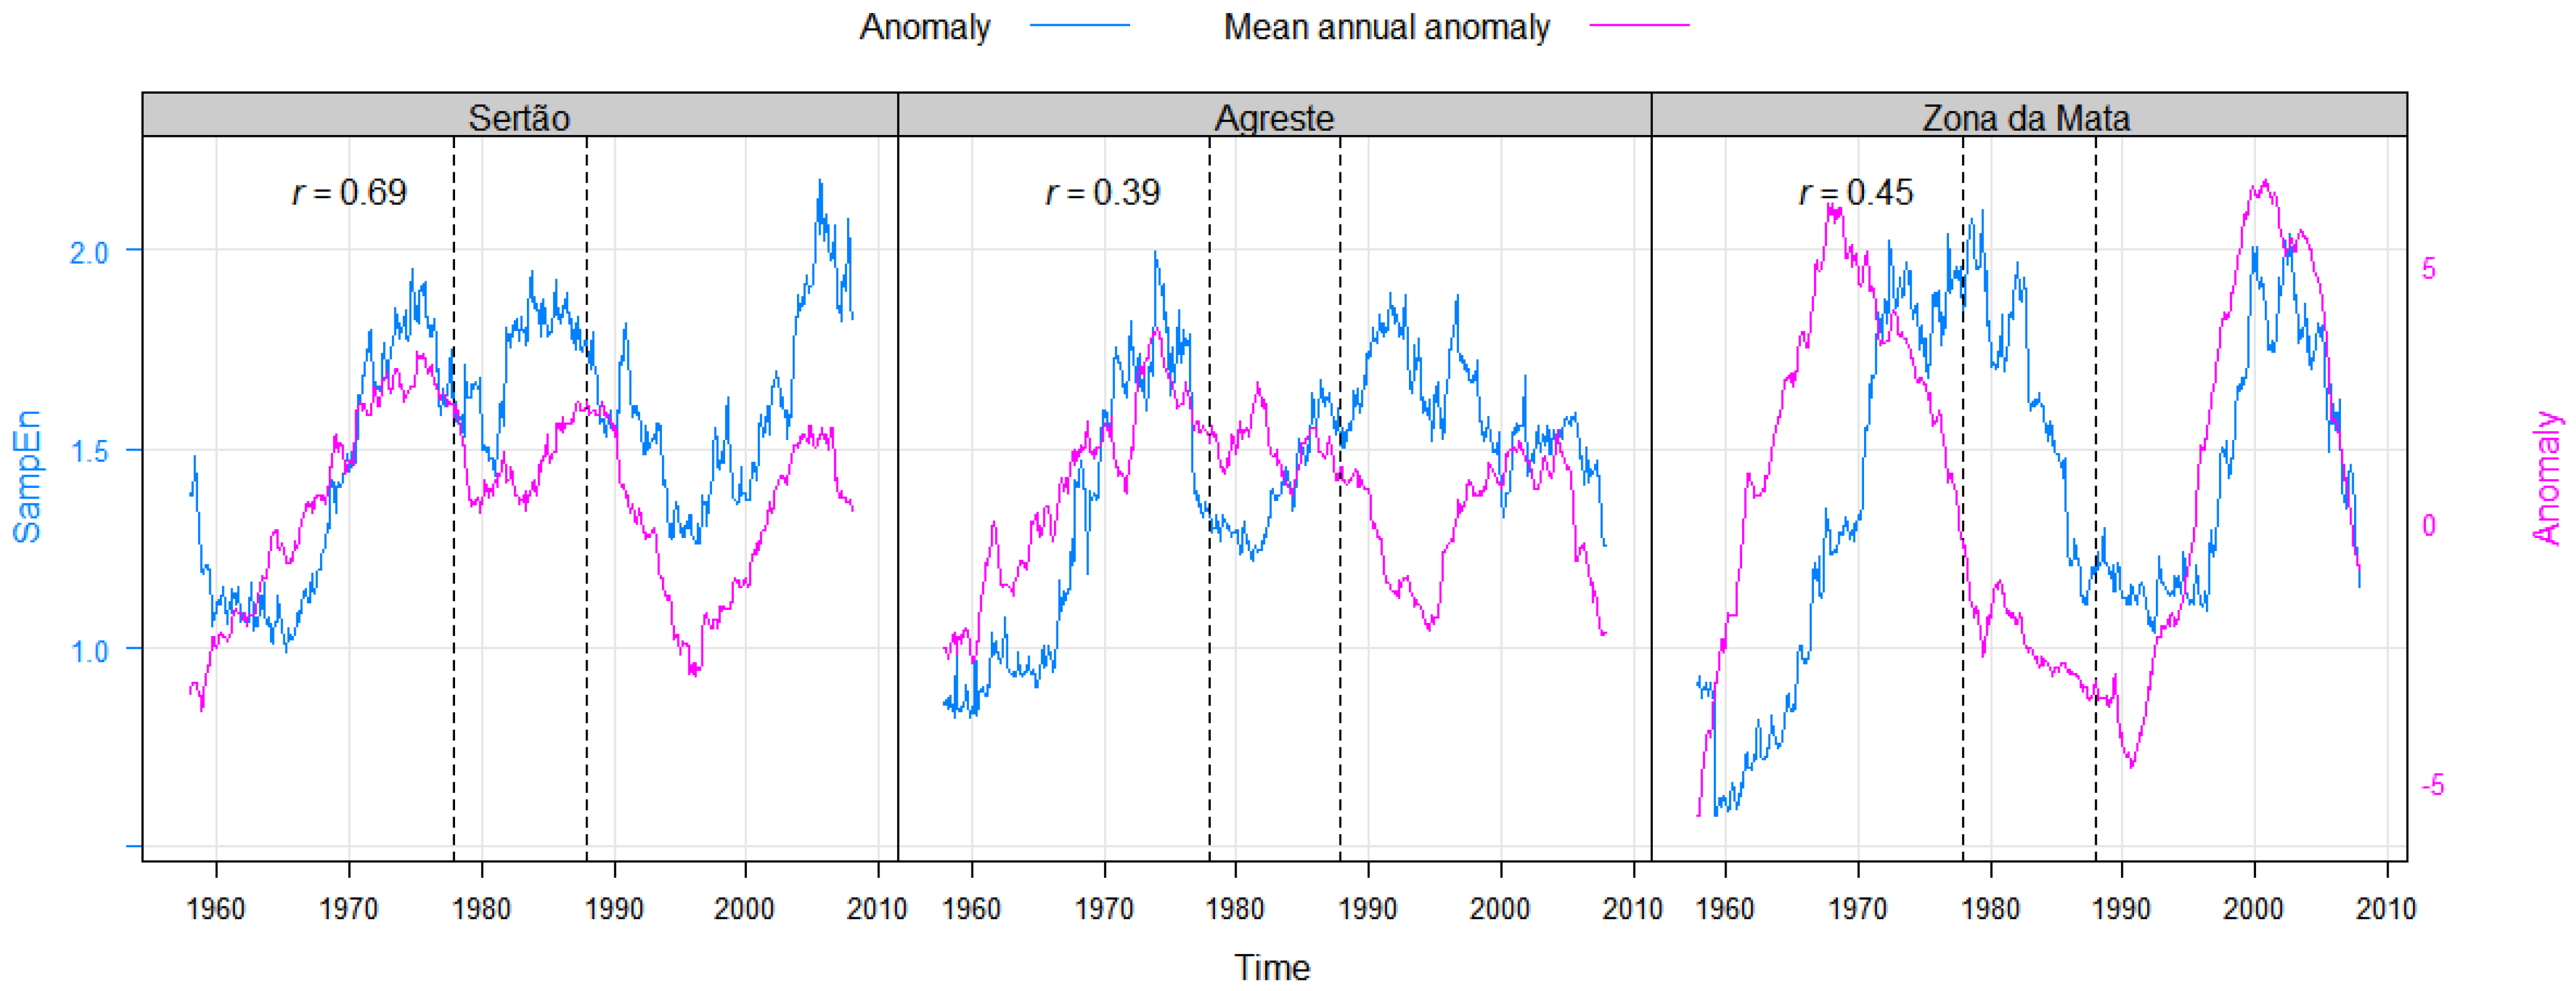
3.2. SampEn (1953–2012)
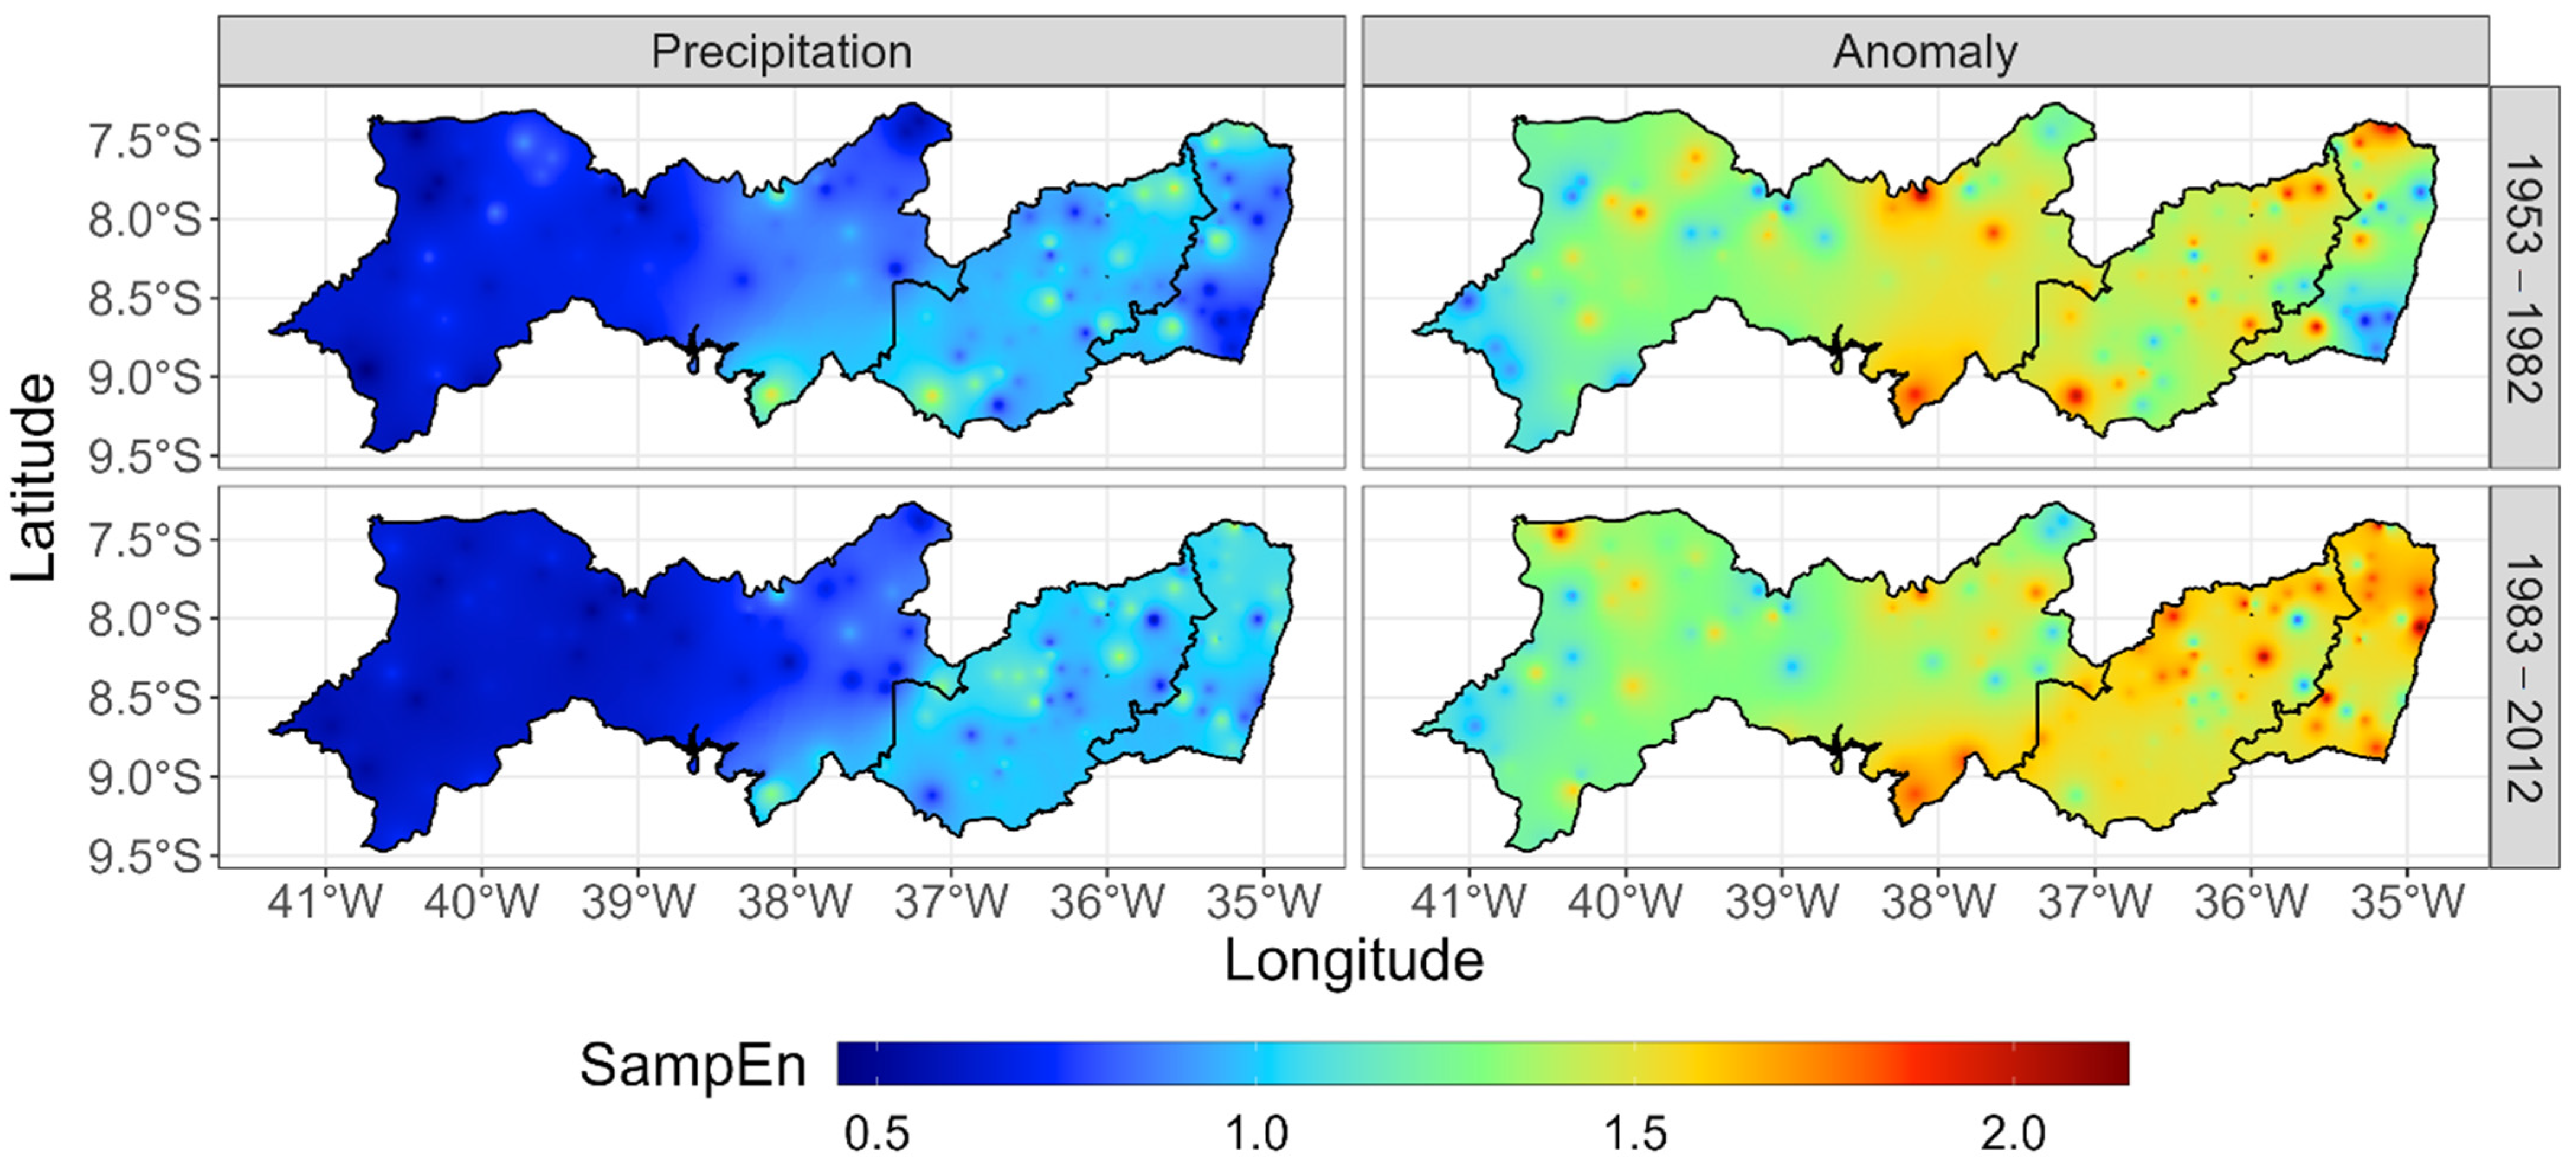
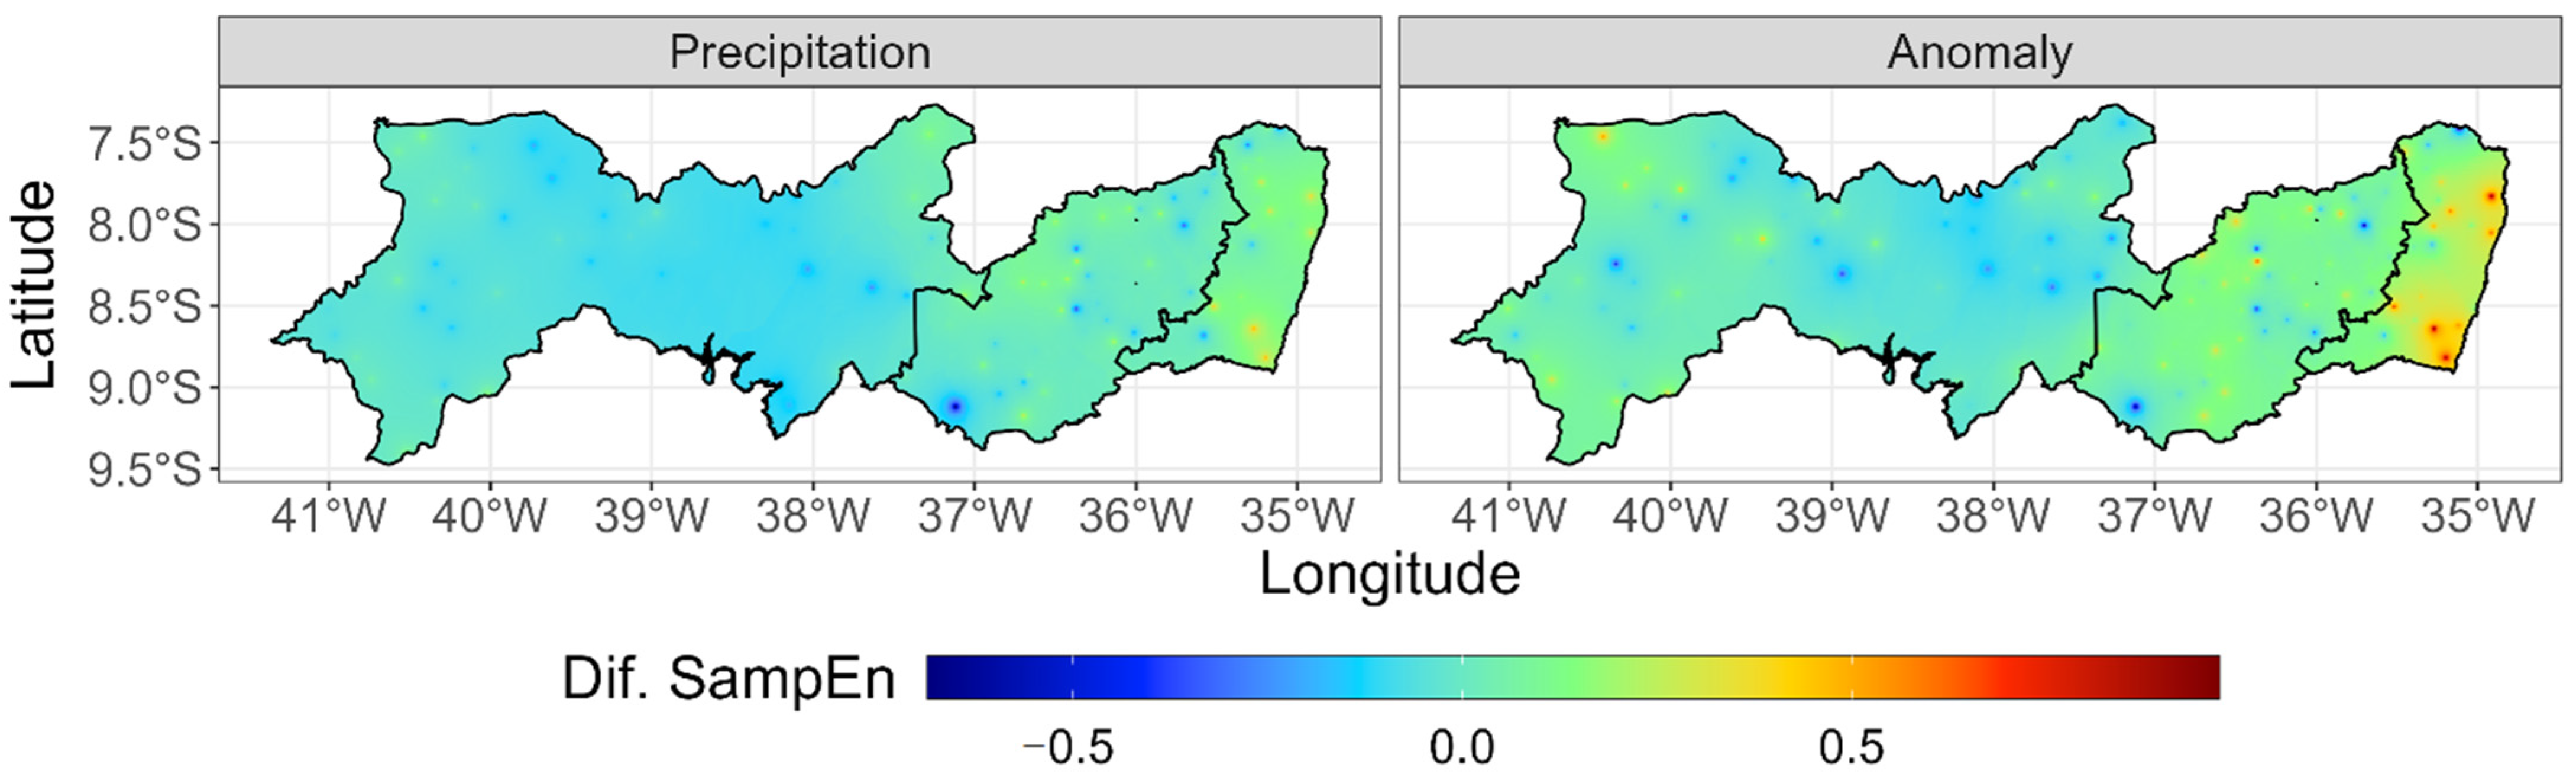
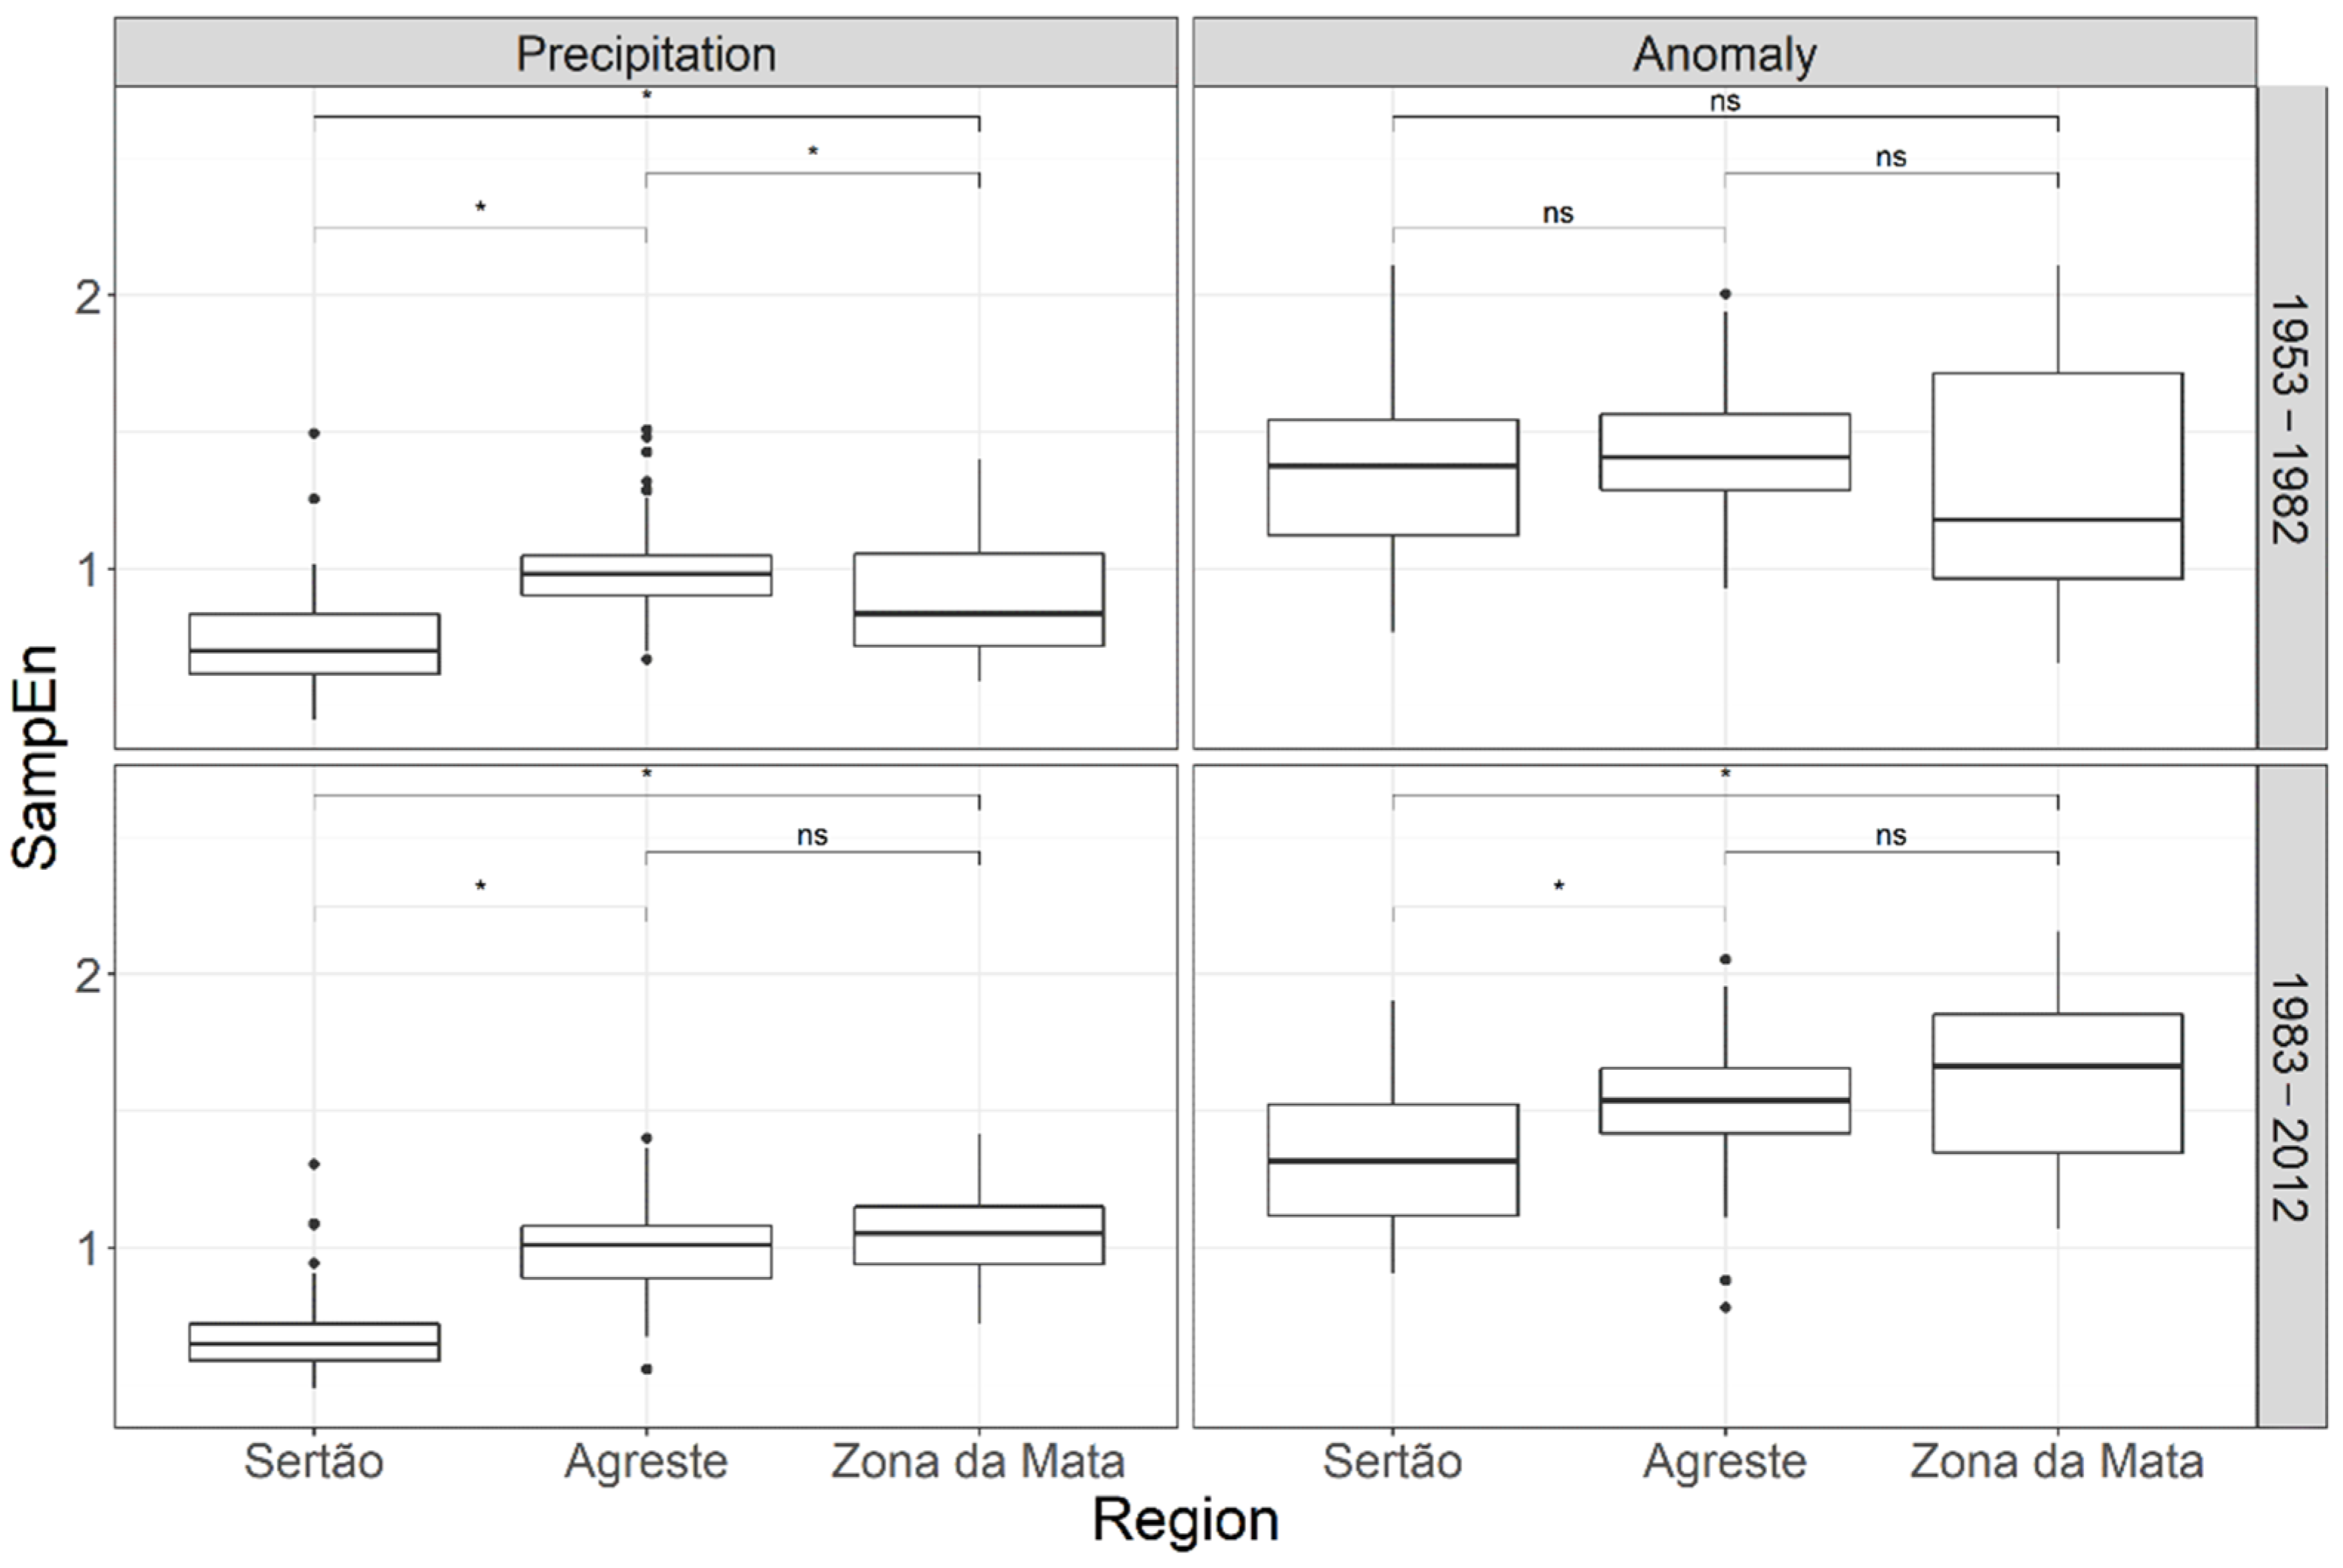
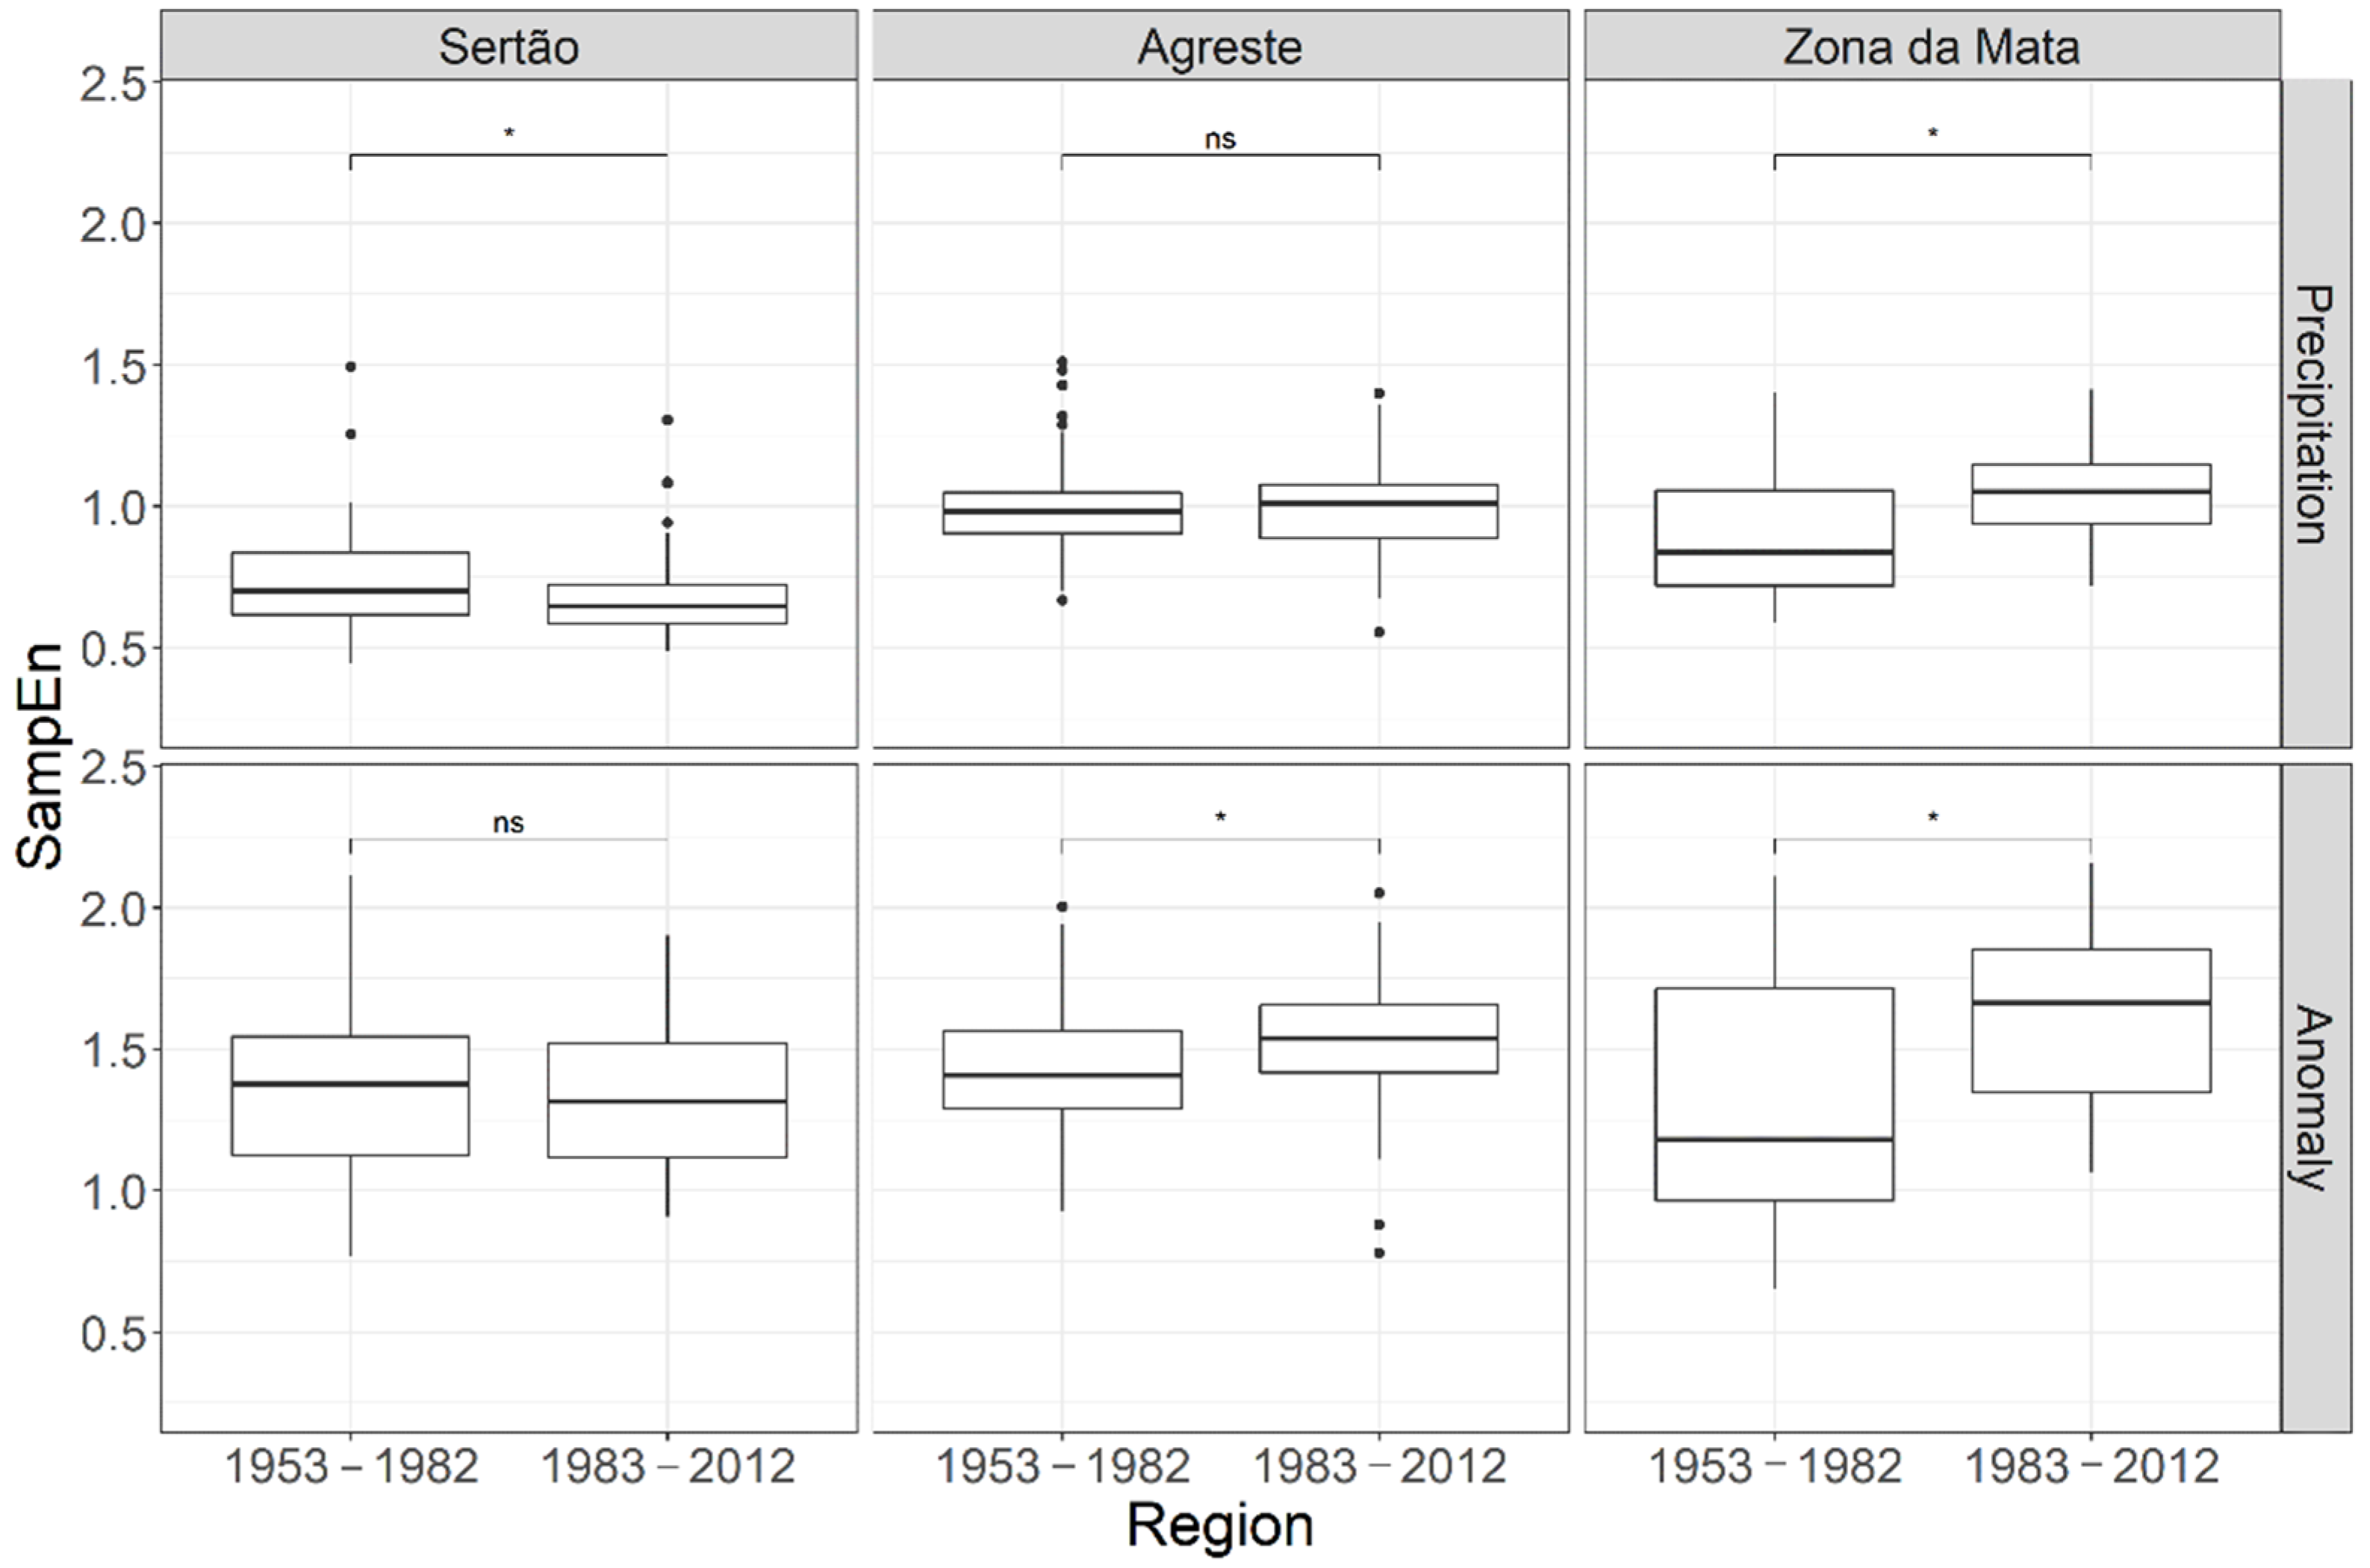
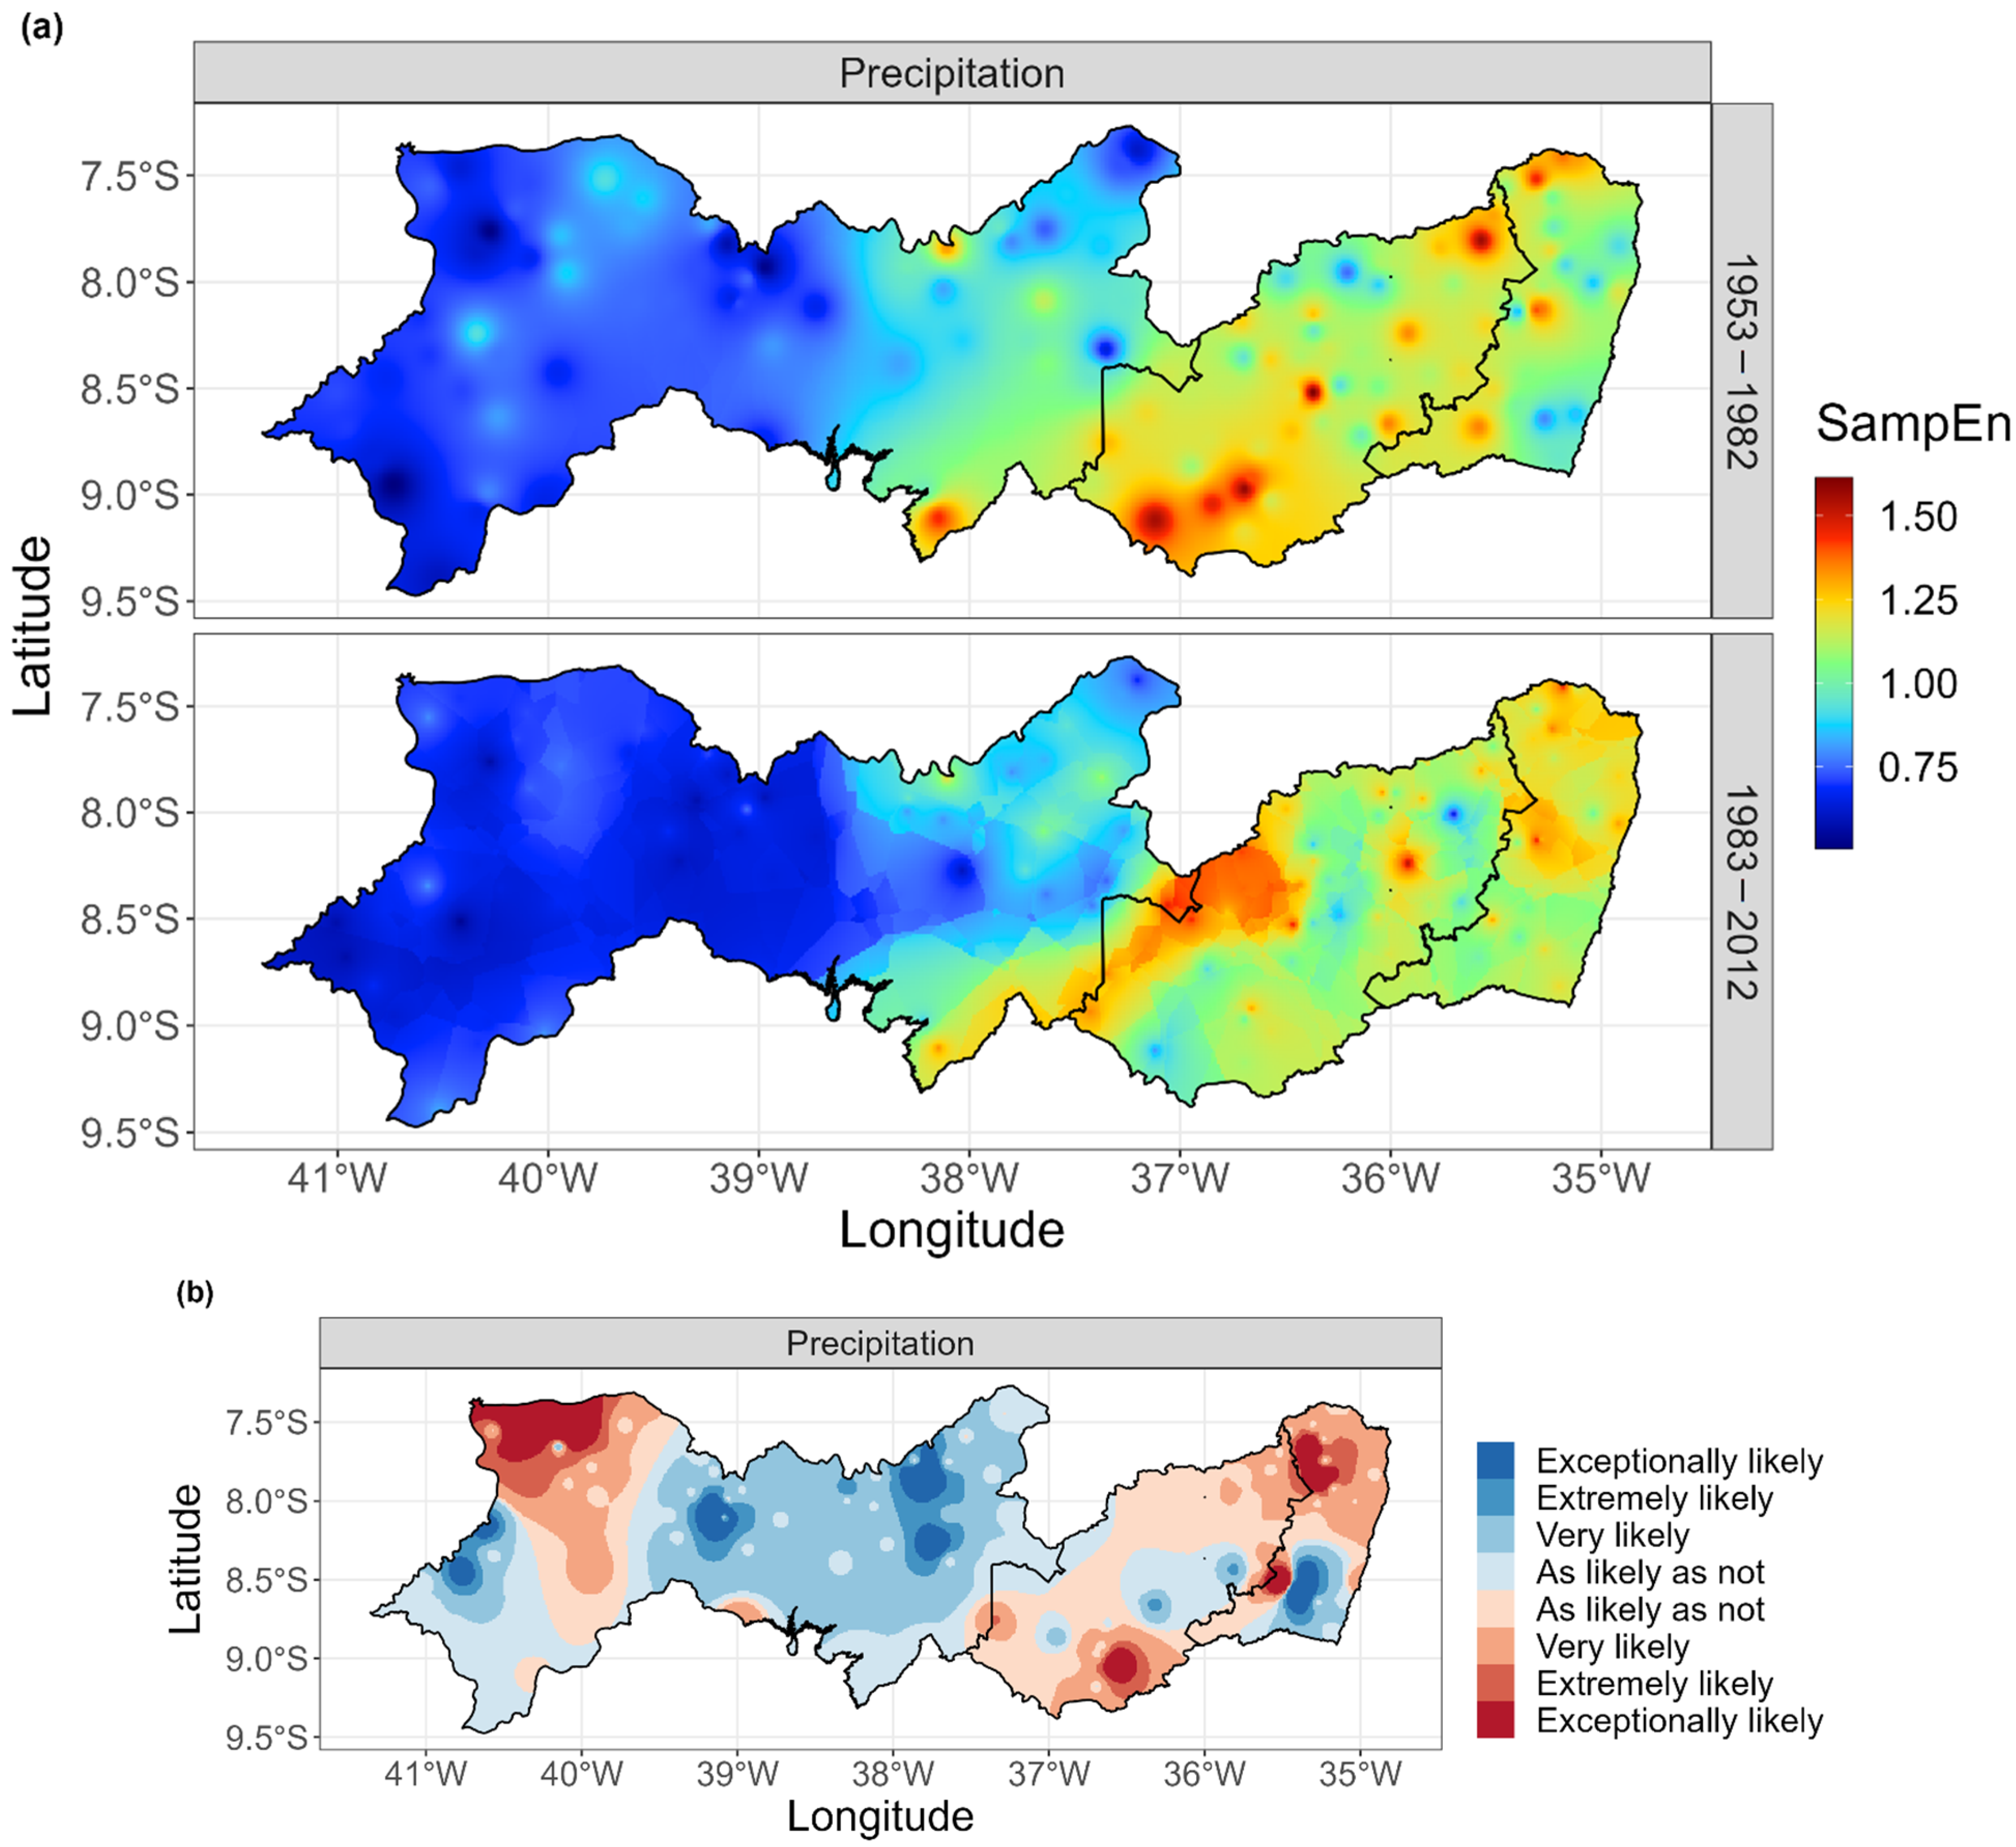
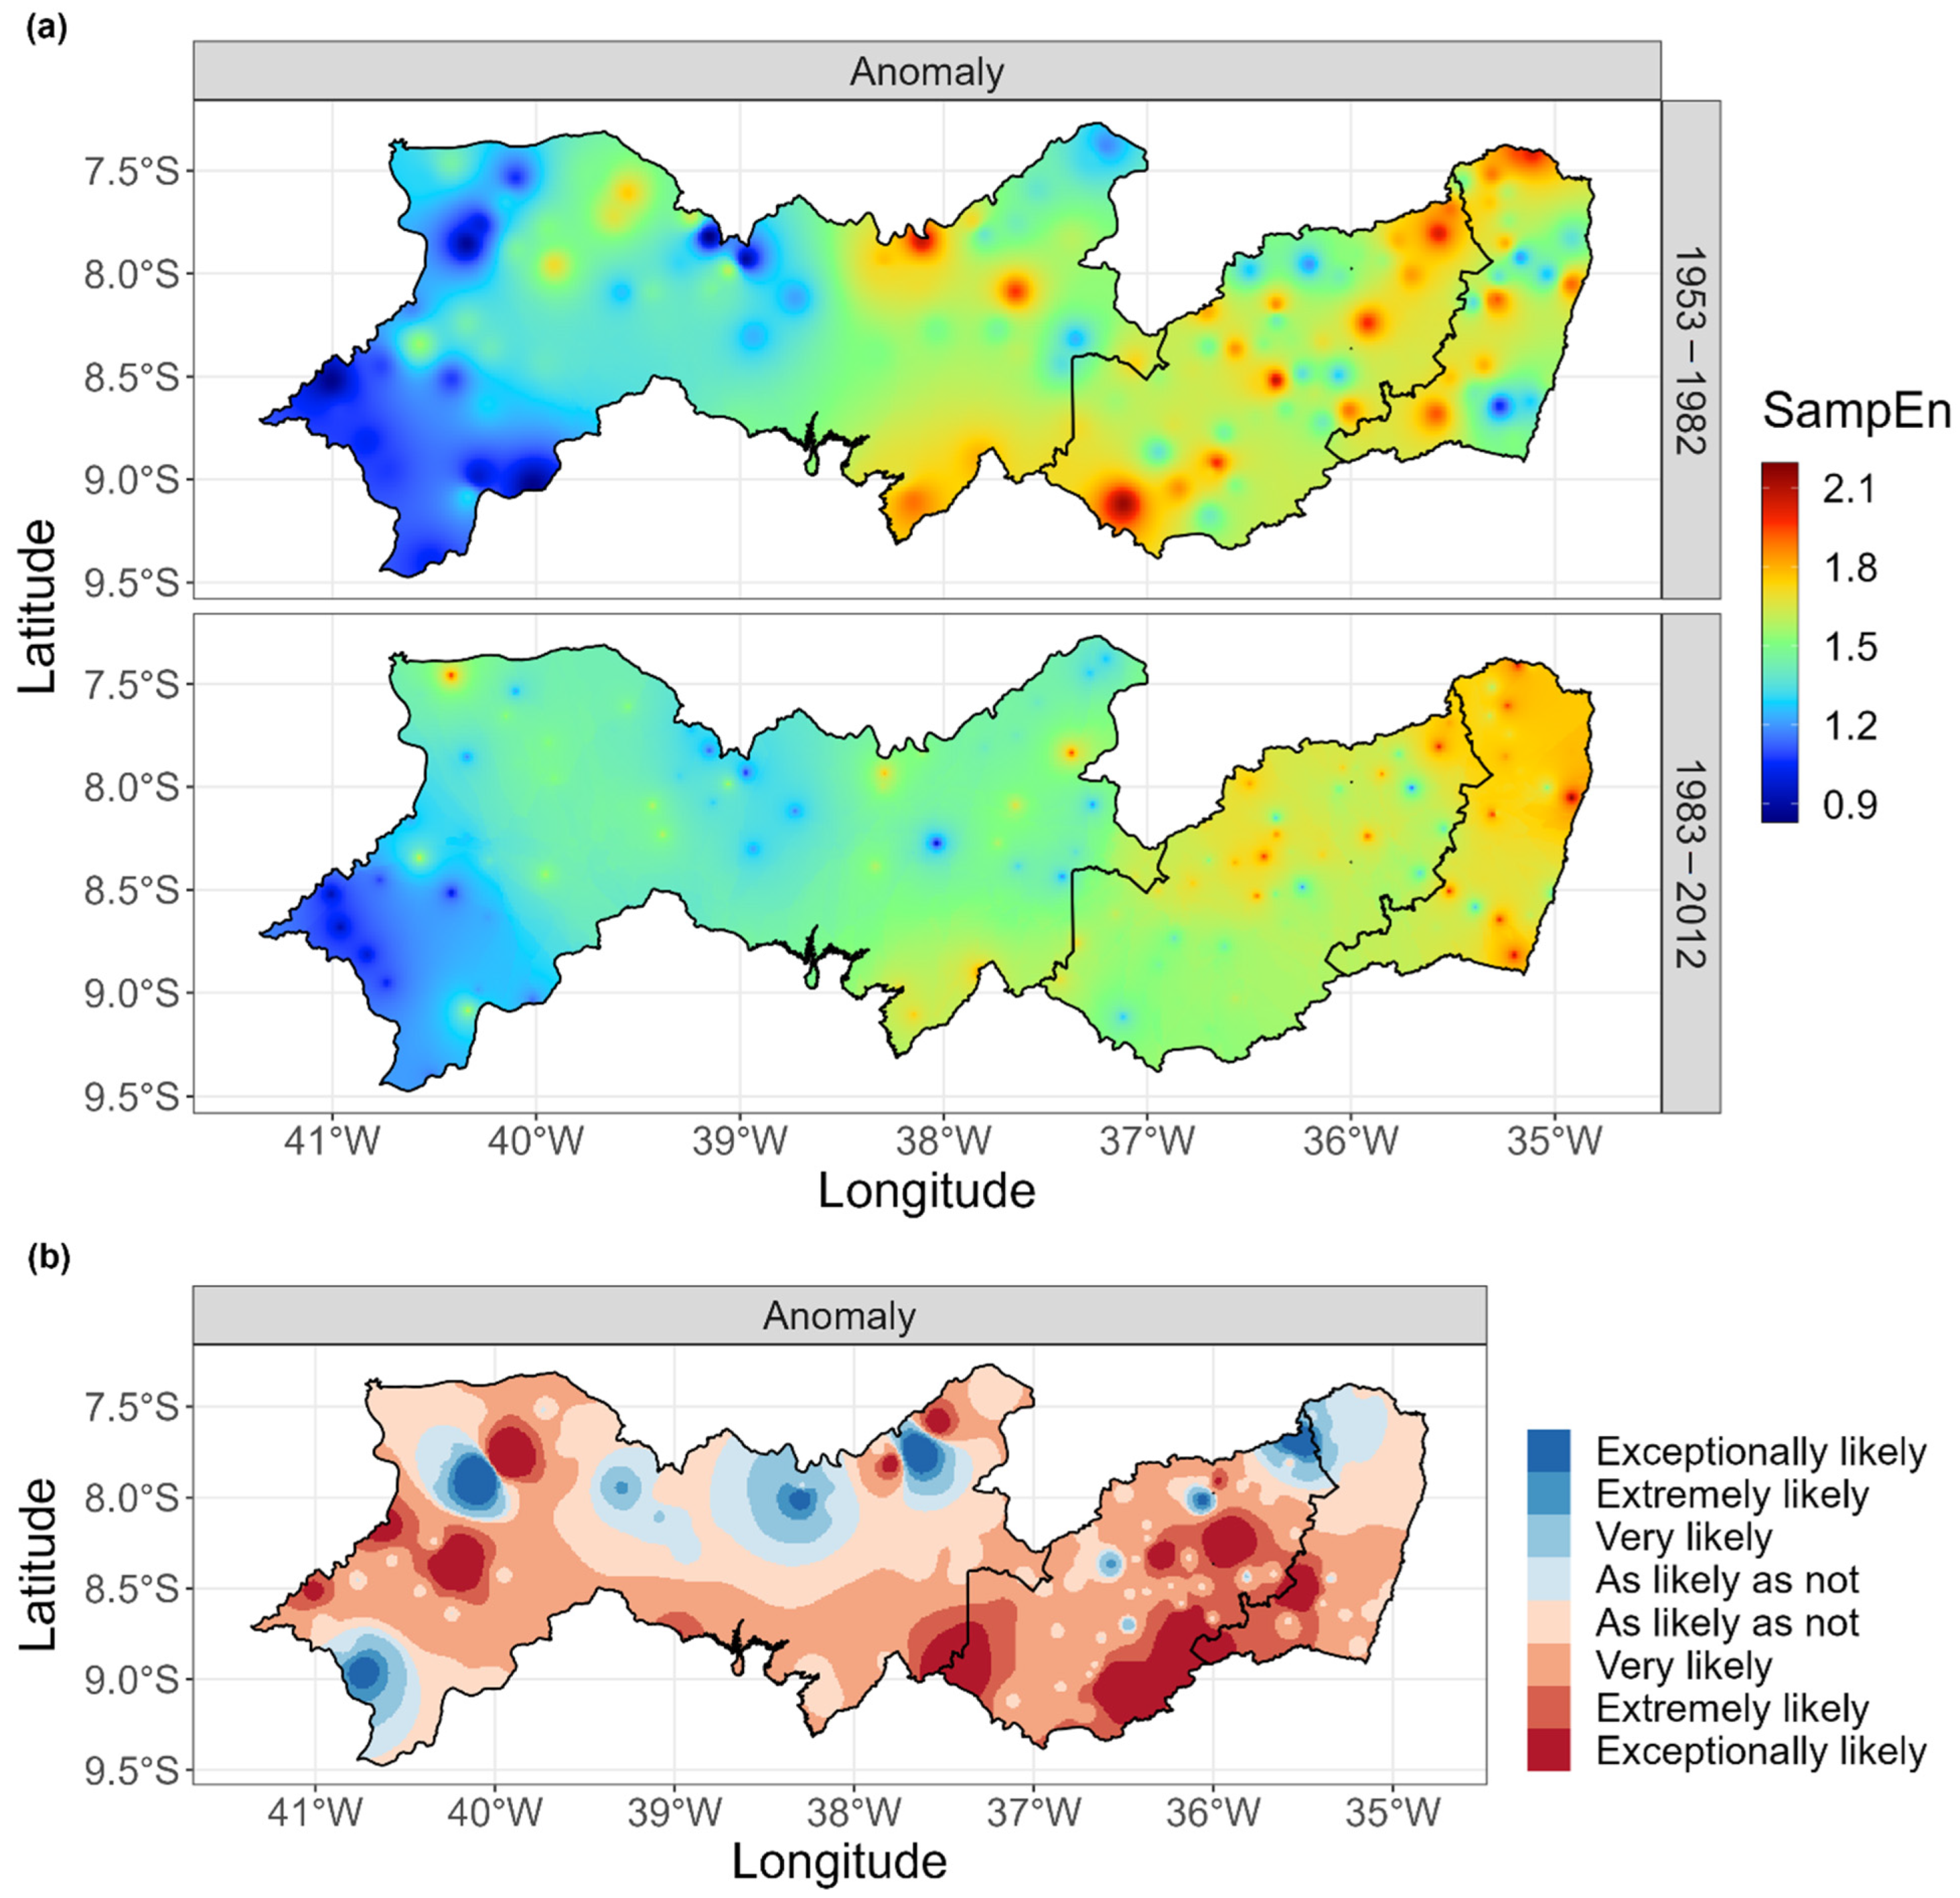
3.3. SampEn: Comparing Subperiods of 1953–1982 and 1983–2012
4. Conclusions
Author Contributions
Funding
Institutional Review Board Statement
Informed Consent Statement
Data Availability Statement
Acknowledgments
Conflicts of Interest
References
- Chadwick, R.; Good, P.; Martin, G.; Rowell, D.P. Large rainfall changes consistently projected over substantial areas of tropical land. Nat. Clim. Chang. 2016, 6, 177–181. [Google Scholar] [CrossRef]
- Chretien, J.-P.; Anyamba, A.; Small, J.; Britch, S.; Sanchez, J.L.; Halbach, A.C.; Tucker, C.; Linthicum, K.J. Global Climate Anomalies and Potential Infectious Disease Risks: 2014–2015. PLoS Curr. 2015, 7. [Google Scholar] [CrossRef] [PubMed]
- Stan, K.; Sanchez-Azofeifa, A. Tropical Dry Forest Diversity, Climatic Response, and Resilience in a Changing Climate. Forests 2019, 10, 443. [Google Scholar] [CrossRef]
- D’Odorico, P.; Bhattachan, A. Hydrologic variability in dryland regions: Impacts on ecosystem dynamics and food security. Philos. Trans. R. Soc. B Biol. Sci. 2012, 367, 3145–3157. [Google Scholar] [CrossRef] [PubMed]
- Marengo, J.A.; Torres, R.R.; Alves, L.M. Drought in Northeast Brazil—Past, present, and future. Theor. Appl. Climatol. 2017, 129, 1189–1200. [Google Scholar] [CrossRef]
- Marengo, J.A.; Bernasconi, M. Regional differences in aridity/drought conditions over Northeast Brazil: Present state and future projections. Clim. Change 2015, 129, 103–115. [Google Scholar] [CrossRef]
- Robertson, A.W.; Kirshner, S.; Smyth, P. Downscaling of Daily Rainfall Occurrence over Northeast Brazil Using a Hidden Markov Model. J. Clim. 2004, 17, 4407–4424. [Google Scholar] [CrossRef]
- Giannini, A.; Saravanan, R.; Chang, P. The preconditioning role of Tropical Atlantic Variability in the development of the ENSO teleconnection: Implications for the prediction of Nordeste rainfall. Clim. Dyn. 2004, 22, 839–855. [Google Scholar] [CrossRef]
- Dore, M.H.I. Climate change and changes in global precipitation patterns: What do we know? Environ. Int. 2005, 31, 1167–1181. [Google Scholar] [CrossRef]
- Sun, Q.; Zhang, X.; Zwiers, F.; Westra, S.; Alexander, L. V A Global, Continental, and Regional Analysis of Changes in Extreme Precipitation. J. Clim. 2021, 34, 243–258. [Google Scholar] [CrossRef]
- Alexander, L.V.; Zhang, X.; Peterson, T.C.; Caesar, J.; Gleason, B.; Klein Tank, A.M.G.; Haylock, M.; Collins, D.; Trewin, B.; Rahimzadeh, F.; et al. Global observed changes in daily climate extremes of temperature and precipitation. J. Geophys. Res. 2006, 111, D05109. [Google Scholar] [CrossRef]
- Sun, W.; Mu, X.; Song, X.; Wu, D.; Cheng, A.; Qiu, B. Changes in extreme temperature and precipitation events in the Loess Plateau (China) during 1960–2013 under global warming. Atmos. Res. 2016, 168, 33–48. [Google Scholar] [CrossRef]
- Regoto, P.; Dereczynski, C.; Chou, S.C.; Bazzanela, A.C. Observed changes in air temperature and precipitation extremes over Brazil. Int. J. Climatol. 2021, 41, 5125–5142. [Google Scholar] [CrossRef]
- Marengo, J.A. Interdecadal variability and trends of rainfall across the Amazon basin. Theor. Appl. Climatol. 2004, 78, 79–96. [Google Scholar] [CrossRef]
- Sansigolo, C.A.; Kayano, M.T. Trends of seasonal maximum and minimum temperatures and precipitation in Southern Brazil for the 1913–2006 period. Theor. Appl. Climatol. 2010, 101, 209–216. [Google Scholar] [CrossRef]
- Hastenrath, S. Exploring the climate problems of Brazil’s Nordeste: A review. Clim. Change 2012, 112, 243–251. [Google Scholar] [CrossRef]
- Uvo, C.B.; Repelli, C.A.; Zebiak, S.E.; Kushnir, Y. The Relationships between Tropical Pacific and Atlantic SST and Northeast Brazil Monthly Precipitation. J. Clim. 1998, 11, 551–562. [Google Scholar] [CrossRef]
- Oliveira, P.T.; Santos e Silva, C.M.; Lima, K.C. Climatology and trend analysis of extreme precipitation in subregions of Northeast Brazil. Theor. Appl. Climatol. 2017, 130, 77–90. [Google Scholar] [CrossRef]
- Lyra, G.B.; Oliveira-Júnior, J.F.; Zeri, M. Cluster analysis applied to the spatial and temporal variability of monthly rainfall in Alagoas state, Northeast of Brazil. Int. J. Climatol. 2014, 34, 3546–3558. [Google Scholar] [CrossRef]
- de Medeiros, E.S.; de Lima, R.R.; de Olinda, R.A.; de Santos, C.A.C. Modeling Spatiotemporal Rainfall Variability in Paraíba, Brazil. Water 2019, 11, 1843. [Google Scholar] [CrossRef]
- da Silva, M.V.; Pandorfi, H.; Jardim, A.M.d.R.F.; Oliveira-Júnior, J.F.d.; Divincula, J.S.d.; Giongo, P.R.; Silva, T.G.F.d.; Almeida, G.L.P.d.; Moura, G.B.d.A.; Lopes, P.M.O. Spatial modeling of rainfall patterns and groundwater on the coast of northeastern Brazil. Urban Clim. 2021, 38, 100911. [Google Scholar] [CrossRef]
- Fuwape, I.A.; Ogunjo, S.T.; Oluyamo, S.S.; Rabiu, A.B. Spatial variation of deterministic chaos in mean daily temperature and rainfall over Nigeria. Theor. Appl. Climatol. 2017, 130, 119–132. [Google Scholar] [CrossRef]
- Sivakumar, B. Nonlinear dynamics and chaos in hydrologic systems: Latest developments and a look forward. Stoch. Environ. Res. Risk Assess. 2009, 23, 1027–1036. [Google Scholar] [CrossRef]
- Sivakumar, B. Fractal analysis of rainfall observed in two different climatic regions. Hydrol. Sci. J. 2000, 45, 727–738. [Google Scholar] [CrossRef][Green Version]
- Kantelhardt, J.W.; Koscielny-Bunde, E.; Rybski, D.; Braun, P.; Bunde, A.; Havlin, S. Long-term persistence and multifractality of precipitation and river runoff records. J. Geophys. Res. Atmos. 2006, 111, 1–13. [Google Scholar] [CrossRef]
- Adarsh, S.; Nourani, V.; Archana, D.S.; Dharan, D.S. Multifractal description of daily rainfall fields over India. J. Hydrol. 2020, 586, 124913. [Google Scholar] [CrossRef]
- Mishra, A.K.; Özger, M.; Singh, V.P. An entropy-based investigation into the variability of precipitation. J. Hydrol. 2009, 370, 139–154. [Google Scholar] [CrossRef]
- Xavier, S.F.A.; da Silva Jale, J.; Stosic, T.; dos Santos, C.A.C.; Singh, V.P. An application of sample entropy to precipitation in Paraíba State, Brazil. Theor. Appl. Climatol. 2019, 136, 429–440. [Google Scholar] [CrossRef]
- Malik, N.; Bookhagen, B.; Marwan, N.; Kurths, J. Analysis of spatial and temporal extreme monsoonal rainfall over South Asia using complex networks. Clim. Dyn. 2012, 39, 971–987. [Google Scholar] [CrossRef]
- Boers, N.; Goswami, B.; Rheinwalt, A.; Bookhagen, B.; Hoskins, B.; Kurths, J. Complex networks reveal global pattern of extreme-rainfall teleconnections. Nature 2019, 566, 373–377. [Google Scholar] [CrossRef]
- Naufan, I.; Sivakumar, B.; Woldemeskel, F.M.; Raghavan, S.V.; Vu, M.T.; Liong, S.-Y. Spatial connections in regional climate model rainfall outputs at different temporal scales: Application of network theory. J. Hydrol. 2018, 556, 1232–1243. [Google Scholar] [CrossRef]
- Zhang, Q.; Zhou, Y.; Singh, V.P.; Chen, X. The influence of dam and lakes on the Yangtze River streamflow: Long-range correlation and complexity analyses. Hydrol. Process. 2012, 26, 436–444. [Google Scholar] [CrossRef]
- Stosic, T.; Telesca, L.; de Souza Ferreira, D.V.; Stosic, B. Investigating anthropically induced effects in streamflow dynamics by using permutation entropy and statistical complexity analysis: A case study. J. Hydrol. 2016, 540, 1136–1145. [Google Scholar] [CrossRef]
- Ma, W.; Kang, Y.; Song, S. Analysis of Streamflow Complexity Based on Entropies in the Weihe River Basin, China. Entropy 2019, 22, 38. [Google Scholar] [CrossRef] [PubMed]
- Richman, J.S.; Moorman, J.R. Physiological time-series analysis using approximate entropy and sample entropy. Am. J. Physiol. Heart Circ. Physiol. 2000, 278, H2039–H2049. [Google Scholar] [CrossRef] [PubMed]
- Delgado-Bonal, A.; Marshak, A. Approximate Entropy and Sample Entropy: A Comprehensive Tutorial. Entropy 2019, 21, 541. [Google Scholar] [CrossRef]
- Zhang, L.; Li, T.; Liu, D.; Fu, Q.; Li, M.; Faiz, M.A.; Ali, S.; Khan, M.I. Spatial variability and possible cause analysis of regional precipitation complexity based on optimized sample entropy. Q. J. R. Meteorol. Soc. 2020, 146, 3384–3398. [Google Scholar] [CrossRef]
- Zhou, X.; Lei, W. Spatial patterns of sample entropy based on daily precipitation time series in China and their implications for land surface hydrological interactions. Int. J. Climatol. 2020, 40, 1669–1685. [Google Scholar] [CrossRef]
- Du, L.; Li, X.; Yang, M.; Sivakumar, B.; Zhu, Y.; Pan, X.; Li, Z.; Sang, Y.-F. Assessment of spatiotemporal variability of precipitation using entropy indexes: A case study of Beijing, China. Stoch. Environ. Res. Risk Assess. 2022, 36, 939–953. [Google Scholar] [CrossRef]
- Zhang, L.; Li, H.; Liu, D.; Fu, Q.; Li, M.; Faiz, M.A.; Khan, M.I.; Li, T. Identification and application of the most suitable entropy model for precipitation complexity measurement. Atmos. Res. 2019, 221, 88–97. [Google Scholar] [CrossRef]
- Alvares, C.A.; Stape, J.L.; Sentelhas, P.C.; de Moraes Gonçalves, J.L.; Sparovek, G. Köppen’s climate classification map for Brazil. Meteorol. Z. 2013, 22, 711–728. [Google Scholar] [CrossRef]
- da Silva, A.S.A.; Stosic, B.; Menezes, R.S.C.; Singh, V.P. Comparison of Interpolation Methods for Spatial Distribution of Monthly Precipitation in the State of Pernambuco, Brazil. J. Hydrol. Eng. 2019, 24. [Google Scholar] [CrossRef]
- Lake, D.E.; Richman, J.S.; Griffin, M.P.; Moorman, J.R. Sample entropy analysis of neonatal heart rate variability. Am. J. Physiol. Integr. Comp. Physiol. 2002, 283, R789–R797. [Google Scholar] [CrossRef] [PubMed]
- Namazi, H. Complexity-based analysis of the correlation between stride interval variability and muscle reaction at different walking speeds. Biomed. Signal Process. Control 2021, 69, 102956. [Google Scholar] [CrossRef]
- Balasis, G.; Daglis, I.A.; Papadimitriou, C.; Kalimeri, M.; Anastasiadis, A.; Eftaxias, K. Investigating dynamical complexity in the magnetosphere using various entropy measures. J. Geophys. Res. Space Phys. 2009, 114. [Google Scholar] [CrossRef]
- Zhao, Z.H.; Yang, S. Sample entropy-based roller bearing fault diagnosis method. J. Vib. Shock 2012, 31, 136–140. [Google Scholar]
- Efremidze, L.; Stanley, D.J.; Kownatzki, C. Entropy trading strategies reveal inefficiencies in Japanese stock market. Int. Rev. Econ. Financ. 2021, 75, 464–477. [Google Scholar] [CrossRef]
- Batra, L.; Taneja, H.C. Evaluating volatile stock markets using information theoretic measures. Phys. A Stat. Mech. Its Appl. 2020, 537, 122711. [Google Scholar] [CrossRef]
- Mann, H.B.; Whitney, D.R. On a Test of Whether one of Two Random Variables is Stochastically Larger than the Other. Ann. Math. Stat. 1947, 18, 50–60. [Google Scholar] [CrossRef]
- CPTEC INPE. Available online: http://enos.cptec.inpe.br/ (accessed on 1 March 2022).
- Kayano, M.T.; Andreoli, R.V. Relationships between rainfall anomalies over northeastern Brazil and the El Niño–Southern Oscillation. J. Geophys. Res. 2006, 111, D13101. [Google Scholar] [CrossRef]
- de Luis, M.; González-Hidalgo, J.C.; Brunetti, M.; Longares, L.A. Precipitation concentration changes in Spain 1946–2005. Nat. Hazards Earth Syst. Sci. 2011, 11, 1259–1265. [Google Scholar] [CrossRef]


Publisher’s Note: MDPI stays neutral with regard to jurisdictional claims in published maps and institutional affiliations. |
© 2022 by the authors. Licensee MDPI, Basel, Switzerland. This article is an open access article distributed under the terms and conditions of the Creative Commons Attribution (CC BY) license (https://creativecommons.org/licenses/by/4.0/).
Share and Cite
Silva, A.S.A.d.; Barreto, I.D.d.C.; Cunha-Filho, M.; Menezes, R.S.C.; Stosic, B.; Stosic, T. Spatial and Temporal Variability of Precipitation Complexity in Northeast Brazil. Sustainability 2022, 14, 13467. https://doi.org/10.3390/su142013467
Silva ASAd, Barreto IDdC, Cunha-Filho M, Menezes RSC, Stosic B, Stosic T. Spatial and Temporal Variability of Precipitation Complexity in Northeast Brazil. Sustainability. 2022; 14(20):13467. https://doi.org/10.3390/su142013467
Chicago/Turabian StyleSilva, Antonio Samuel Alves da, Ikaro Daniel de Carvalho Barreto, Moacyr Cunha-Filho, Rômulo Simões Cezar Menezes, Borko Stosic, and Tatijana Stosic. 2022. "Spatial and Temporal Variability of Precipitation Complexity in Northeast Brazil" Sustainability 14, no. 20: 13467. https://doi.org/10.3390/su142013467
APA StyleSilva, A. S. A. d., Barreto, I. D. d. C., Cunha-Filho, M., Menezes, R. S. C., Stosic, B., & Stosic, T. (2022). Spatial and Temporal Variability of Precipitation Complexity in Northeast Brazil. Sustainability, 14(20), 13467. https://doi.org/10.3390/su142013467