Abstract
The Italian Recovery and Resilience Plan promotes, among its many actions, the use of hydrogen by the deployment of refuelling stations for heavy-duty vehicles, predicting a 5–7% penetration rate of fuel cell electric vehicles (FCEVs) for long-distance freight transport. In this work, the impact of this action on the reduction of greenhouse gas emissions and consumption was estimated, assuming the plan’s objectives are met. To achieve this aim, a national simulation model of the road freight transport system was implemented, consisting of a graph of the national road network and an inter-provincial origin-destination matrix; the graph was based on data available from OpenStreetMap, while the interprovincial matrix was estimated from the interregional matrix with the use of two linear regression models, one for emitted goods and one for attracted goods. The simulation of the system made it possible to estimate the impact of this action on CO2 emissions and fuel consumption under three different scenarios. From 2025 to 2040, a reduction in CO2 emissions ranging from around 9 to around 16.5 million tonnes was estimated, and a reduction in consumption ranging from around 3 billion to around 5.6 billion litres of diesel. These results show how this action can be seen as one of the bricks contributing to the fight against global warming.
1. Introduction
In addition to its strictly health-related consequences, the COVID-19 pandemic had a strong impact on the global and EU member countries’ economies. The need to support economic recovery led the European Union to launch a major funding programme in 2021, totalling EUR 750 billion, called Next Generation EU (NGEU) [1]. Within this financing programme, the largest part of the funds, EUR 672.5 billion (312.5 billion in grants and 360 billion in loans), is allocated to the Recovery and Resilience Facility (RRF). To access these funds, the European Union required member states to submit their National Recovery and Resilience Plans (NRRPs) outlining their planned investments and national reforms agenda. In the European Commission’s guidelines [2], ‘Recharge and Refuel’ is listed as one of the seven areas on which investments should be concentrated, and includes sustainable mobility.
Italy decided to use its entire national allocation under the European Recovery and Resilience Facility (RRF), including its loan component: EUR 191.5 billion or 10.7 per cent of the national GDP in 2019. In addition, Italy has allocated national resources (Supplementary Fund) of EUR 30.6 billion to further strengthen a vast programme of reforms and investments aimed at promoting the recovery of the Italian economy [3], while addressing some structural weaknesses and pursuing important objectives such as green transition and digital transformation. The measures in this plan are to be completed by 2026. The Italian NRRP is organised into 6 Missions; among these, Mission 2 ‘Green Revolution and Ecological Transition’ includes measures concerning sustainable mobility. The largest share of funds is allocated to this mission (EUR 59.47 billion, about 31% of the total NRRP funds). Within this mission, EUR 23.8 billion is allocated to ‘M2C2. Renewable energy, hydrogen grid and sustainable mobility’ within which there is a specific field of intervention ‘Investment 3.3: Experimentation of hydrogen for road transport’. This area of intervention refers to the use of hydrogen-powered freight road vehicles and provides for the creation of 40 hydrogen refuelling stations, strategically located throughout the country, along the routes most densely travelled by long-haul freight vehicles. The plan forecasts a penetration rate of fuel cell heavy-duty vehicles of 5–7% by 2030.
In the scientific literature, some researchers highlighted the recommendations of other countries in response to the pandemic for the renewable energy sector [4,5] and evaluated the impact of the pandemic on transportation energy consumption [6,7] and pollution [8,9].
Fuel cell electric vehicles (FCEVs) use hydrogen to produce electricity on board the vehicle itself; the electricity thus produced is used to power an electric motor. Fuel cells produce electricity by combining hydrogen, stored on board the vehicle, with oxygen; the electricity is produced without emitting CO2, only water vapour. The production of hydrogen and its transport (from the well to the tank) still produces greenhouse gas emissions; these emissions are lower the higher the percentage of hydrogen produced from renewable sources (green hydrogen).
In the case of applications to the automotive sector, the main strengths are: (a) zero tailpipe emissions, both greenhouse gases and pollutants; (b) high vehicle autonomy; (c) refuelling times similar to those of a conventional fuel vehicle; (d) high durability of fuel cells; (e) hydrogen can be produced using renewable sources. The main weaknesses can be summarised as: (a) high vehicle cost, which is also higher than battery electric vehicles; (b) the limited number of refuelling stations; (c) vehicle safety issues (high flammability of hydrogen); (d) lower energy efficiency compared to battery electric vehicles.
Fuel cell vehicles are still uncommon, although they have been extensively tested; most vehicles are registered in the United States [10]. If we refer to a macro-area, the Asia-Pacific region has the largest number of vehicles and refuelling stations [10], mainly due to developments in China, Korea and Japan.
Research on this type of vehicle is growing and nearing maturity [11]. In addition to fuel cell vehicles, hybrid vehicles are also being developed in which batteries are used in addition to cells, with plug-in power, with the advantage of having a single electric motor that can draw on two power sources (plug-in hydrogen fuel cell hybrid vehicles, PHFCVs). A comparison between PHFCVs and BEVs (Battery Electric Vehicles) was provided by Offer et al. [12] who pointed out that life cycle costs are similar. Research in this field is mainly directed at finding optimal energy management and generation systems. From this point of view, the possibility of combining fuel cells with supercapacitors has been examined [13]. Various works have examined the optimal energy management of different power sources to improve the performance and durability of storage systems [14,15,16]. A comprehensive review on the challenges and opportunities of fuel cell technology for the transportation sector can be found in [17,18].
The main applications of FCEVs are for passenger cars, while only more recently has attention been turned to freight vehicles [19]. Some researchers investigated the impact of fuel cell technology adoption on the whole road transport. Liu et al. [20] evaluated the reduction in GHG emissions of the deployment of FCEV for the whole fleet in China showing a reduction of about 13% in the optimistic scenario. A similar study was conducted to evaluate the impact on CO2 emissions in Germany assuming a complete transition of road transport to fuel cell vehicles [21].
Focusing on freight transportation, a review of works on the decarbonisation of the road freight sector was carried out by Meyer [22], while the potential of battery, fuel cell and catenary electric freight vehicles for reducing emissions of greenhouse gases and other pollutants was studied by Breuer et al. [23]. The importance of freight transport in fighting climate change was highlighted in [24] and an analysis of the feasibility of using FCEVs for freight transport can be found in [25]. Green freight vehicles are already used, albeit not widely, for urban freight distribution [26]. The impact of the adoption of electric freight vehicles was analysed in [27] where a CO2 emissions reduction of more than 50% between 2012 and 2050 is estimated to be possibly achieved with the joint diffusion of BEVs and FCEVs.
Focusing on its use in the freight transport sector, the future of hydrogen as a significant alternative fuel for heavy-duty vehicles is highlighted in [28] and current research topics are reported in [29]. A modelling approach is proposed in [30] to investigate the potential demand of hydrogen for freight road transport in California and infrastructure investments required to meet that demand. In [31], a case study in Switzerland was carried out to evaluate the strengths and weaknesses of hydrogen usage. An assessment of emissions reduction induced by the conversion of diesel/natural gas-powered to hydrogen-powered heavy-duty vehicles in China was conducted in [32].
Regarding impacts on costs, the cost of the deployment of a hydrogen refuelling network in Germany was estimated in [33] comparing the pipeline-distribution system with a decentralized one by 2050. Noll et al. [34] made a comparative analysis in terms of the total cost of ownership of the main low-emission technologies in Europe showing that heavy-duty FCEVs are currently uncompetitive in all segments due to high powertrain costs. Accordingly, a choice experiment in China [35] showed that truck drivers are not very willing to buy heavy-duty FCEVs putting a limit on the accepted price of about 50% higher than diesel heavy-duty vehicles. Thus, incentives from governments are necessary to increase their market penetration. A case study in China [36] focused on the effect of government subsidies for the penetration of long-haul heavy-duty FCEV providing a simulation tool that validated the current government initiatives but pointing out some limits of the incentives’ mechanism.
This paper aims to estimate the possible impact on fuel consumption and GHG emissions from the implementation of the NRRP investment programme on FCEVs applied to long-distance freight transport. This study contributes to the literature mainly from two points of view. First, the study considers the contribution of one of the Italian NRRP’s actions on energy savings and greenhouse gas emissions; to our knowledge, similar nationwide studies have not yet been developed in Italy. Secondly, the proposed approach can be applied to different spatial scales and countries, modifying the input data and simulation models used, allowing similar assessments in other contexts.
2. Estimation of Road Freight Demand in Italy
The estimation of road freight traffic flows requires the construction of a transportation supply model, the estimation of transportation demand and the application of an assignment procedure (supply/demand interaction). In this work, provincial zoning was used: the Italian territory was partitioned into 107 zones, one for each Province (see Figure 1). The defined zoning does not allow for the simulation of trips with origin and destination within the same Province; this issue is not critical because FCEVs, as also specified by the NRRP, are expected on long-distance trips and, therefore, trips within the same Province should be eliminated from the calculation of vehicle-km/year anyway. Therefore, it is possible to use this zoning regardless of the size of the provinces.
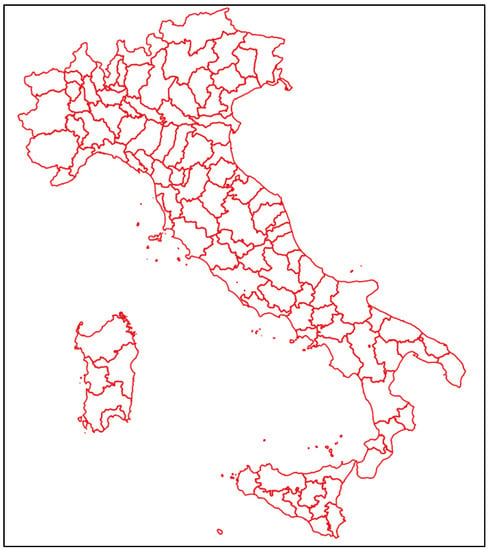
Figure 1.
Zoning at the provincial level, Italy (based on ISTAT shapefile [37]).
The estimation of road freight transport is limited to domestic long-distance trips (both origin and destination within the national territory), given the nature of the study. In fact, the use on the international routes of FCEVs for freight transport is influenced by the spread of vehicles and refuelling stations in other European countries, on which reliable forecasts of development are not possible; therefore, the use of FCEVs was assumed to be limited to domestic transport, probably underestimating, at least in part, the impacts on the reduction of fuel consumption and GHG emissions.
Having established the territorial level of zoning, the estimated freight transport demand was obtained from the matrix surveyed by ISTAT [38] for the year 2019. This matrix, based on a regional territorial division, provides the total goods traded by road among the 20 Italian regions in terms of tons/year; no similar matrices are available for more detailed territorial divisions. The 2019 data were used because they precede any ‘disruptions’ that may have been induced by the COVID-19 emergency; it is believed that these disruptions can be reabsorbed in the coming years, given that the study is based on a time horizon that will vary between 2025 and 2040. This time horizon was chosen assuming that refuelling stations could be available from 2025 and that the NRRP’s forecast of FCEV freight vehicle penetration to 2030 would be respected. In addition, the study assessed the effects in the following 10 years, up to 2040, considering that longer-term forecasts may not be valid, given the continuous evolution of available technologies and the unpredictable variation of national and international socio-economic conditions.
The estimation of freight road traffic flows requires an interprovincial origin-destination (OD) matrix; indeed, it is believed that the interregional matrix, as produced by ISTAT [38], does not allow sufficient precision, given the large size of the Italian regions. Estimating flows on a regional basis would lead to two types of inaccuracies: (1) area centroids would not correctly represent the origins and destinations of trips, overestimating some distances and underestimating others; (2) trips between different provinces in the same region would not be represented on the network.
To transform the interregional matrix into the interprovincial one, two linear regression models were calibrated; these models relate the goods emitted and attracted by each region to the number of manufacturing employees in that region. The choice of this variable in the model resulted from several attempts in which other classifications (total employees, trade employees, population, etc.) were experimented with; manufacturing employees represented the most suitable variable for representing the phenomenon. The calibration data and obtained results (see Table 1 and Figure 2) show that the direct proportionality between goods generated/attracted and employees in this macro commodity area works well.

Table 1.
Data and results of the calibrated models (source of input data [38]).
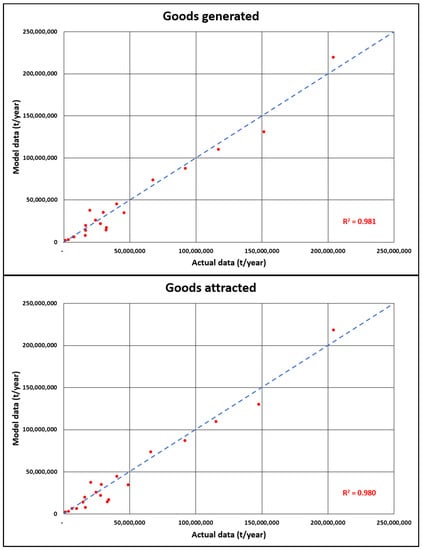
Figure 2.
Scatter plots of the results obtained from the calibration of the two linear regression models.
Using these results, the regional matrix was transformed into a provincial OD matrix by dividing each cell of the regional matrix into several cells of the provincial one proportionally to the manufacturing employees in each province. This procedure transformed the regional OD matrix, of size 20 × 20, into the provincial OD matrix, of size 107 × 107. The adopted procedure is summarized in Figure 3.
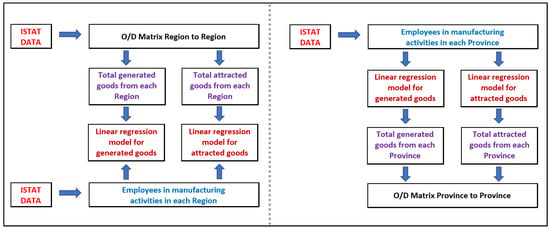
Figure 3.
Block diagram of the procedure for estimating the OD matrix.
In this way, the effect of distance between areas has been neglected; this assumption is assumed to be valid because the regional matrix already implicitly takes into account the distance effect (distance between regions) and, therefore, any potential influence could result in variations only relative to the location of provinces within the same region. In particular, this effect is negligible for long-distance freight transport, for which variations of the order of 100 km do not create substantial differences in the distribution of goods.
Finally, the provincial OD matrix thus generated is expressed in tons/year; it was transformed into terms of vehicles/year assuming an average load per vehicle of 9 tons, as reported in the National Transportation Account [39]. This matrix will be used in the assignment procedure in the next section to estimate flows on the national road network.
3. Transportation Supply Model and Freight Traffic Flow Estimation
The transportation supply model consists of a graph of the Italian main road network. The graph is representative of all highways, roads of national importance, and some other road infrastructure necessary to connect the zones of the study area; additionally, all the ramps connecting the different road infrastructures are included.
The supply model consists of 25,599 real links and 44,941 real nodes; to these are added 107 centroid nodes, one for each province, and 406 connectors, which are needed to link area centroids to the real road network. There are 6 links representing maritime services, totalling 480 km. The network is representative of more than 49,000 km of roads. The graph is depicted in Figure 4, while the various types of links are reported in Table 2.
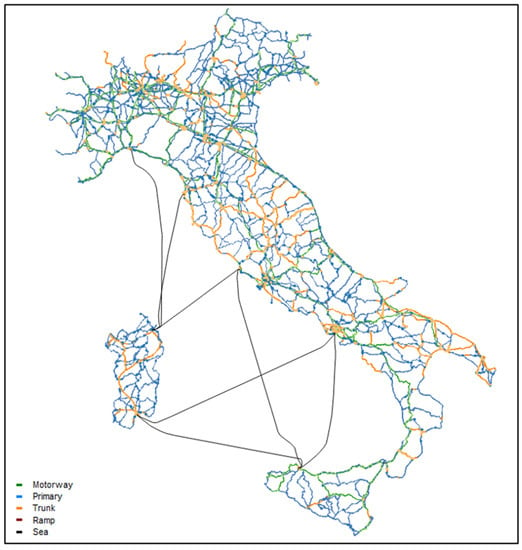
Figure 4.
The considered graph of the Italian main road network (elaboration of authors from OpenStreetMap data provided by Geofabrik GmbH [40]).

Table 2.
Characteristics of the considered links.
Since the objective is to simulate only long-distance freight traffic, moreover with an annual time horizon, the road network was assumed to be uncongested, i.e., with generalised cost values not dependent on freight vehicle flows. Indeed, the assumption of a congested network would not be applicable, both because hourly traffic is not simulated, which would be necessary to consider the effects of congestion, and because travel times would depend not only on freight vehicle flows but also on car flows since road infrastructure is shared.
The road links were classified into 6 categories and an average speed was assigned to each of them as shown in Table 3; on toll motorway links, the monetary cost was assumed to be 0.165 €/km, which is the average value in Italy for freight vehicles with 4 axles and 5 or more axles.

Table 3.
Average speeds related to heavy-duty vehicles on each link type.
Traffic flows were estimated by assigning the OD matrix to the road network thus constructed. The graphical representation of the result of the assignment is shown in Figure 5, while Table 4 summarises the results on the different link types. These data are used in the next section to estimate fuel consumption and greenhouse gas emissions.
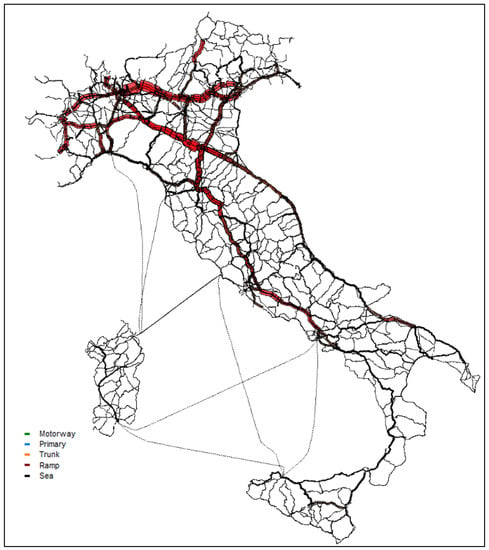
Figure 5.
Representation of the resulting road traffic flows of long-haul heavy-duty vehicles (elaboration of authors).

Table 4.
Summary results.
4. Estimation of Impacts on Fuel Consumption and CO2 Emissions
The impacts on fuel consumption and CO2 emissions were estimated by assuming three different scenarios of penetration of FCEVs in the heavy goods traffic flow, replacing diesel-powered vehicles. The scenarios refer to different penetration rate trends, with the same initial linear trend, as estimated in the NRRP, of 5–7% by 2030. The common trend considers a linearly increasing rate from 1.2% in 2025 to 7% in 2030 (NRRP estimate) with a resulting average annual rate of increase of 1.16%. From 2030 to 2040, the three scenarios differ in their annual growth rate, assuming:
- zero growth in the penetration rate for the ‘pessimistic’ scenario: the penetration rate remains constant at 7% after 2030;
- constant growth in the penetration rate of 1.16% for the ‘linear’ scenario;
- constant growth in the penetration rate of 1.50% for the ‘optimistic’ scenario.
To these scenarios is added a ‘no-FCEV’ baseline scenario that considers the projection to 2040 of the current state without FCEVs according to the Italian Institute for Environmental Protection and Research (ISPRA) [41].
The resulting trends in vehicle-km for the three penetration scenarios from 2025 to 2040 are shown in Figure 6. These values are estimated from the vehicle-km for heavy-duty diesel vehicles (see Table 4), so the resulting trend in the ‘pessimistic’ scenario is decreasing after 2030. It is pointed out again that these scenarios refer to the replacement of heavy-duty diesel vehicles, to which the GHG emission is referred.
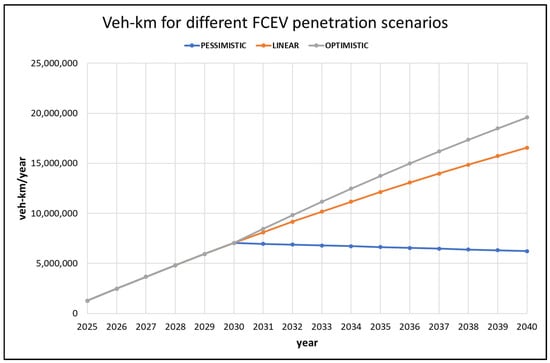
Figure 6.
Trend of vehicle-km/year referring to the three FCEV penetration scenarios.
The Tier 2 approach of the Corinair method [42] was applied, therefore, considering an average emission factor for heavy-duty diesel vehicles, assumed to be 718.16 g/vehicle-km as elaborated from [41], and vehicle-km of the aggregated vehicle category. The resulting CO2 emission values, in tonnes, for the three considered scenarios, together with the projection without FCEVs, are shown in Table 5 and Figure 7, respectively. The corresponding emission reductions (compared to the no-FCEV scenario) and the trend of the reduction percentage compared to 2019 are shown in Table 6 and Figure 8, respectively.

Table 5.
Total annual CO2 emissions for each considered scenario.
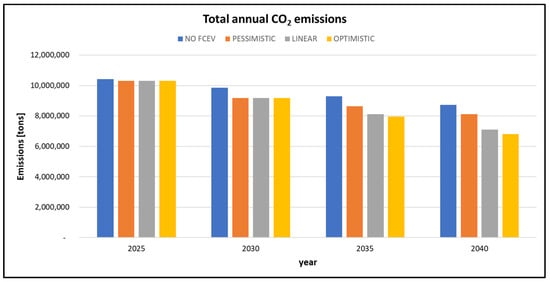
Figure 7.
Total annual CO2 emissions for each considered scenario.

Table 6.
Reduction in CO2 emissions compared to the no-FCEV scenario.
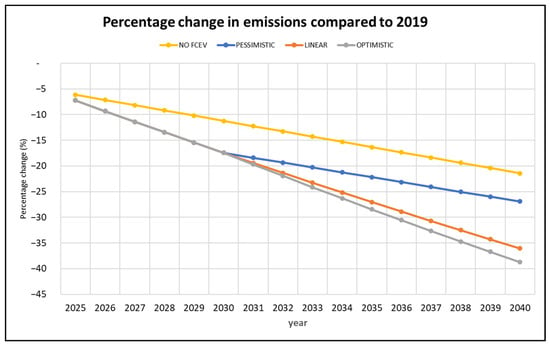
Figure 8.
Percentage reductions in CO2 compared to 2019 for each considered scenario.
The penetration of FCEVs in the fleet of heavy-duty diesel vehicles acts as an accelerator in reducing GHG emissions. Actually, if there were no FCEVs, the maximum reduction achievable in 2040 would be 21.4%, again compared to 2019, while with the introduction of FCEVs, the reduction would be between 26.9% (pessimistic scenario) and 38.7% (optimistic scenario). As a result, the total emission savings, compared to the no-FCEV scenario, range from 8.9 to 16.4 million tonnes of CO2 until 2040, corresponding to savings percentages of 5.8% to 10.7%. Compared with the existing literature, these findings are almost in line with other studies carried out for other countries and with different assumptions. In particular, Liu et al. [20] estimated an emissions’ decrease in China by nearly one-fifth under the most optimistic scenario, i.e., FCEV penetration rate of 3.5% and 5.8% in 2040 and 2050, respectively. In the case study of Germany, Weger et al. [21] estimated a high decrease in emissions of 57 million tonnes of CO2 by assuming a shift of the whole HDV fleet to green hydrogen in the next 15 years.
In the analyses carried out about the reduction in pollutant emissions, it was assumed that all hydrogen used to power the vehicles is produced from renewable energy sources (green hydrogen); otherwise, the CO2 emissions required to produce the hydrogen would have to be assessed.
Regarding fuel consumption, the average consumption factors in L/vehicle-km shown in Table 7 were considered, calculated on the basis of the consumption in g/vehicle-km using the Corinair method and the specific weight of diesel equal to 830 g/L. The same table shows the vehicle-km rates for each category obtained from the same database provided by ISPRA [41], based on which the weighted average consumption of 0.244 L/vehicle-km was calculated.

Table 7.
Consumption factors and vehicle-km proportions for diesel heavy goods vehicles.
Similar to the emission assessment, the resulting total fuel consumption values in litres in the considered scenarios are shown in Table 8. In Table 9, the actual annual fuel reductions in the different penetration scenarios compared to the ‘no-FCEV’ scenario from 2025 to 2040 are reported and their resulting trend is shown in Figure 9.

Table 8.
Annual fuel consumption.

Table 9.
Reduction in fuel consumption w.r.t the ‘no-FCEV’ scenario.
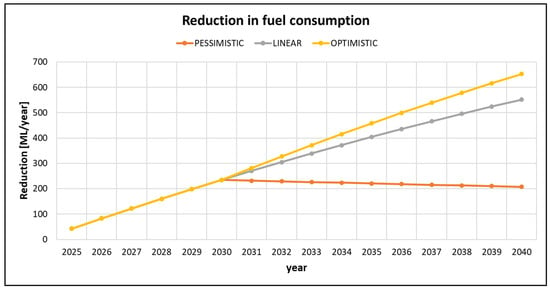
Figure 9.
Fuel consumption reduction trend with respect to (w.r.t.) the ‘no-FCEV’ scenario.
It emerges that the penetration of FCEVs into diesel heavy-duty vehicle fleets would result in significant fuel consumption savings in the order of millions of litres up to a value of between 208 (pessimistic scenario) and 652 (optimistic scenario) million litres in 2040. Total fuel consumption savings from 2025 to 2040 are estimated to range from 3.04 to 5.58 billion litres of diesel.
5. Conclusions
This paper aimed at assessing the impact of the introduction of fuel cell technology in the Italian heavy-duty vehicle fleet according to the targets fixed by the Italian National Recovery and Resilience Plan (NRRP). Thus, according to the plan, this study used as the main assumption the achievement of a 5–7% penetration rate (by 2030) of fuel cell electric vehicles (FCEVs) for long-distance freight transport. The impact assessment was carried out in terms of total CO2 emissions and fuel consumption savings. To this aim, we constructed a supply model of the Italian main road network and estimated the freight demand at a provincial level of detail starting from a regional matrix of goods exchange between Italian regions. We then proposed a procedure to transform the regional OD matrix into a provincial OD matrix of heavy-duty vehicle flows for long-haul transport. All data elaborated in this study come from national databases related to the pre-COVID period (until 2019) to exclude the strong changes induced by the pandemic, assuming all disruptions will be reabsorbed in the coming years. The evaluation was carried out over a 15-year time horizon, from 2025 to 2040, considering the exclusive use of green hydrogen.
The obtained results show how the use of FCEVs for freight transport can contribute to reducing fuel consumption and emissions, adding another brick to Europe’s goals to combat global warming. In particular, we evaluated the impacts in different scenarios: no-FCEV, pessimistic, linear and optimistic. The estimated CO2 emissions savings range from 5.8% to 10.7% compared to the no-FCEV scenario (from around 9 to around 16.5 million tonnes), assumed as the baseline of the current status, projected up to the year 2040. Moreover, in terms of fuel consumption savings, the penetration of FCEV into long-haul freight transport could contribute to reducing diesel consumption by from 3.0 to 5.6 billion litres, accelerating the transition towards less dependence on fossil fuels.
It is also believed that the introduction of refuelling stations will also encourage a greater spread of hydrogen-powered cars, use of which is practically negligible in Italy, leading to a further reduction in emissions and consumption of traditional fuels.
It must be emphasised that the calculations were carried out under the assumption that hydrogen is entirely produced from renewable sources (green hydrogen); otherwise, there is practically no appreciable benefit on overall CO2 emissions, and, in some cases, counterproductive effects could occur. A spread of FCEV cars would, in any case, maintain an advantage in terms of air pollution in cities, as there are no local emissions of pollutants.
A more detailed study will be possible once the location of the refuelling stations is known; with this information, it will be possible to identify which trips can use hydrogen power and which cannot or can only partially use it. Another limitation of the study, which can be solved with further research, concerns the assumption of an uncongested network, which prevents the use of more detailed consumption and emission models, as it is not possible to estimate the actual travel speed on each link. Finally, it is believed that the results obtained cannot be extended or generalised to other territorial contexts; indeed, the share of road freight transport is different among countries, as are the average mileages travelled and the quantities of goods exchanged. The proposed procedure, as already noted, can be replicated in other territorial contexts, but the results obtained in this work cannot be extended parametrically.
The following policy recommendations can be drawn from the study: (i) it is crucial to study the location of refuelling stations, maximising the routes that can take advantage of this possibility; (ii) in the initial phases, it is necessary to incentivise the purchase of freight FCEVs, so that operators have an immediate advantage; (iii) it is necessary to incentivise the purchase and use of FCEV cars, also by providing refuelling stations in urban areas.
Future research can be directed to evaluate the possible effects of the spread of passenger FCEVs in Italy and to evaluate the diffusion of FCEVs for freight transport on a European scale. In addition, it will be possible to study the optimal location of refuelling stations. Finally, a study on a congested network and mixed traffic (interaction between freight vehicles and cars), with the knowledge of the location of the refuelling stations, would allow a more precise evaluation of the results.
Author Contributions
Conceptualization, M.G. and M.M.; methodology, M.G. and M.M.; model, M.G.; numerical results, M.M.; resources, M.G.; data curation, M.G. and M.M.; writing—original draft preparation, M.G.; writing—review and editing, M.M. All authors have read and agreed to the published version of the manuscript.
Funding
This research was partially funded by the research projects E-Mobility and Antifane, co-financed by the European Union, the Italian State and the Campania Region, under the POR Campania FESR 2014–2020, and by the University of Sannio (FRA 2021). Some results were presented at the international conference EURO 2022, Aalto University, Espoo Finland, 3–6 July 2022.
Data Availability Statement
All available data are quoted in the References.
Conflicts of Interest
The authors declare no conflict of interest.
References
- European Commission. NextGenerationEU: Next Steps for RRF. 2020. Available online: https://ec.europa.eu/commission/presscorner/detail/en/IP_20_1658 (accessed on 7 September 2022).
- European Commission. Guidance to member States Recovery and Resilient Plans. SWD (2021) 12 Final. Available online: https://ec.europa.eu/info/sites/default/files/document_travail_service_part1_v2_en.pdf (accessed on 7 September 2022).
- Italia Domani. Piano Nazionale di Ripresa e Resilienza. 2021. Available online: https://www.governo.it/sites/governo.it/files/PNRR.pdf (accessed on 7 September 2022).
- Amir, M.; Zubair, S. Assessment of renewable energy: Status, challenges, COVID-19 impacts, opportunities, and sustainable energy solutions in Africa. Energy Built Environ. 2022, 3, 348–362. [Google Scholar] [CrossRef]
- Li, K.; Qi, S.; Shi, X. The COVID-19 pandemic and energy transitions: Evidence from low-carbon power generation in China. J. Clean. Prod. 2022, 368, 132994. [Google Scholar] [CrossRef] [PubMed]
- Gürbüz, H.; Söhret, Y.; Ekici, S. Evaluating effects of the COVID-19 pandemic period on energy consumption and enviro-economic indicators of Turkish road transportation. Energy Sources Part A Recovery Util. Environ. Eff. 2021. [Google Scholar] [CrossRef]
- Du, J.; Rakha, H.A.; Filali, F.; Eldardiry, H. COVID-19 pandemic impacts on traffic system delay, fuel consumption and emissions. Int. J. Transp. Sci. 2021, 10, 184–196. [Google Scholar] [CrossRef]
- Ekici, S.; ¸Söhret, Y.; Gürbüz, H. Influence of COVID-19 on air pollution caused by commercial flights in Turkey. Energy Sources Part A Recovery Util. Environ. Eff. 2021. [Google Scholar] [CrossRef]
- Ghiasi, B.; Alisoltani, T.; Jalali, F.; Tahsinpour, H. Effect of COVID-19 on transportation air pollution by moderation and mediation analysis in Queens, New York. Air Qual. Atmos. Health 2022, 15, 289–297. [Google Scholar] [CrossRef]
- International Energy Agency. Advanced Fuel Cells Technology Collaboration Programme—Report on Mobile Fuel Cell Application: Tracking Market Trends. Available online: https://www.ieafuelcell.com/fileadmin/publications/2020_AFCTCP_Mobile_FC_Application_Tracking_Market_Trends_2020.pdf (accessed on 7 September 2022).
- Alvarez-Meaza, I.; Zarrabeitia-Bilbao, E.; Rio-Belver, R.M.; Garechana-Anacabe, G. Fuel-Cell Electric Vehicles: Plotting a Scientific and Technological Knowledge Map. Sustainability 2020, 12, 2334. [Google Scholar] [CrossRef]
- Offer, G.J.; Howey, D.; Contestabile, M.; Clague, R.; Brandon, N.P. Comparative analysis of battery electric, hydrogen fuel cell and hybrid vehicles in a future sustainable road transport system. Energy Policy 2010, 38, 24–29. [Google Scholar] [CrossRef]
- Fathabadi, H. Fuel cell hybrid electric vehicle (FCHEV): Novel fuel cell/SC hybrid power generation system. Energy Convers. Manag. 2018, 156, 192–201. [Google Scholar] [CrossRef]
- Zhou, D.; Ravey, A.; Al-Durra, A.; Gao, F. A comparative study of extremum seeking methods applied to online energy management strategy of fuel cell hybrid electric vehicles. Energy Convers. Manag. 2017, 151, 778–790. [Google Scholar] [CrossRef]
- Zhou, Y.; Ravey, A.; Péra, M.-C. Multi-objective energy management for fuel cell electric vehicles using online-learning enhanced Markov speed predictor. Energy Convers. Manag. 2020, 213, 112821. [Google Scholar] [CrossRef]
- Koubaa, R.; Bacha, S.; Smaoui, M.; Krichen, L. Robust optimization based energy management of a fuel cell/ultra-capacitor hybrid electric vehicle under uncertainty. Energy 2020, 200, 117530. [Google Scholar] [CrossRef]
- Dash, S.K.; Chakraborty, S.; Roccotelli, M.; Sahu, U.K. Hydrogen Fuel for Future Mobility: Challenges and Future Aspects. Sustainability 2022, 14, 8285. [Google Scholar] [CrossRef]
- Wanniarachchi, S.; Hewage, K.; Wirasinghe, C.; Chhipi-Shrestha, G.; Karunathilake, H.; Sadiq, R. Transforming road freight transportation from fossils to hydrogen: Opportunities and challenges. Int. J. Sustain. Transp. 2022, 1–21. [Google Scholar] [CrossRef]
- Bethoux, O. Hydrogen Fuel Cell Road Vehicles: State of the Art and Perspectives. Energies 2020, 13, 5843. [Google Scholar] [CrossRef]
- Liu, F.; Zhao, F.; Liu, Z.; Hao, H. The impact of fuel cell vehicle deployment on road transport greenhouse gas emissions: The China case. Int. J. Hydrog. Energy 2018, 43, 22604–22621. [Google Scholar] [CrossRef]
- Weger, L.B.; Leitão, J.; Lawrence, M.G. Expected impacts on greenhouse gas and air pollutant emissions due to a possible transition towards a hydrogen economy in German road transport. Int. J. Hydrog. Energy 2021, 46, 5875–5890. [Google Scholar] [CrossRef]
- Meyer, T. Decarbonizing road freight transportation—A bibliometric and network analysis. Transp. Res. D 2020, 89, 102619. [Google Scholar] [CrossRef]
- Breuer, J.L.; Samsun, R.C.; Stolten, D.; Peters, R. How to reduce the greenhouse gas emissions and air pollution caused by light and heavy duty vehicles with battery-electric, fuel cell-electric and catenary trucks. Environ. Int. 2021, 152, 106474. [Google Scholar] [CrossRef]
- Carrara, S.; Longden, T. Freight futures: The potential impact of road freight on climate policy. Transp. Res. D 2017, 55, 359–372. [Google Scholar] [CrossRef]
- Forrest, K.; Kinnon, M.M.; Tarroja, B.; Samuelsen, S. Estimating the technical feasibility of fuel cell and battery electric vehicles for the medium and heavy duty sectors in California. Appl. Energy 2020, 276, 115439. [Google Scholar] [CrossRef]
- Napoli, G.; Micari, S.; Dispenza, G.; Andaloro, L.; Antonucci, V.; Polimeni, A. Freight distribution with electric vehicles: A case study in Sicily. RES, infrastructures and vehicle routing. Transp. Eng. 2021, 3, 100047. [Google Scholar] [CrossRef]
- Gonzalez Palencia, J.C.; Araki, M.; Shiga, S. Energy consumption and CO2 emissions reduction potential of electric-drive vehicle diffusion in a road freight vehicle fleet. Energy Procedia 2017, 142, 2936–2941. [Google Scholar] [CrossRef]
- Moriarty, P.; Honnery, D. Prospects for hydrogen as a transport fuel. Int. J. Hydrog. Energy 2019, 44, 16029–16037. [Google Scholar] [CrossRef]
- De las Nieves Camacho, M.; Jurburg, D.; Tanco, M. Hydrogen fuel cell heavy-duty trucks: Review of main research topics. Int. J. Hydrog. Energy 2022, 47, 29505–29525. [Google Scholar] [CrossRef]
- Vijayakumar, V.; Jenn, A.; Fulton, L. Low carbon scenario analysis of a hydrogen-based energy transition for on-road transportation in California. Energies 2021, 14, 7163. [Google Scholar] [CrossRef]
- Çabukoglu, E.; Georges, G.; Küng, L.; Pareschi, G.; Boulouchos, K. Fuel cell electric vehicles: An option to decarbonize heavy-duty transport? Results from a Swiss case-study. Transp. Res. D 2019, 70, 35–48. [Google Scholar] [CrossRef]
- Liu, F.; Maurezall, D.L.; Zhao, F.; Hao, H. Deployment of fuel cell vehicles in China: Greenhouse gas emission reductions from converting the heavy-duty truck fleet from diesel and natural gas to hydrogen. Int. J. Hydrog. Energy 2021, 46, 17982–17997. [Google Scholar] [CrossRef]
- Nugroho, R.; Rose, P.K.; Gnann, T.; Wei, M. Cost of a potential hydrogen-refueling network for heavy-duty vehicles with long-haul application in Germany 2050. Int. J. Hydrog. Energy 2021, 46, 35459–35478. [Google Scholar] [CrossRef]
- Noll, B.; del Val, S.; Schmidt, T.S.; Steffen, B. Analyzing the competitiveness of low-carbon drive-technologies in road-freight: A total cost of ownership analysis in Europe. Appl. Energy 2022, 306, 118079. [Google Scholar] [CrossRef]
- Yan, J.; Zhao, J. Willingness to pay for heavy-duty hydrogen fuel cell trucks and factors affecting the purchase choices in China. Int. J. Hydrog. Energy 2022, 47, 24619–24634. [Google Scholar] [CrossRef]
- Yan, J.; Wang, G.; Chen, S.; Zhang, H.; Qian, J.; Mao, Y. Harnessing freight platforms to promote the penetration of long-haul heavy-duty hydrogen fuel-cell trucks. Energy 2022, 254, 124225. [Google Scholar] [CrossRef]
- ISTAT. Confini delle Unità Amministrative a Fini Statistici al 1° Gennaio 2022. Available online: https://www.istat.it/it/archivio/222527 (accessed on 7 September 2022).
- ISTAT. Matrice Trasporto Merci su Strada 2019. Available online: http://dati.istat.it/ (accessed on 7 September 2022).
- Istituto Poligrafico Zecca dello Stato. Conto Nazionale delle Infrastrutture e dei Trasporti—Anni 2018–2019; Istituto Poligrafico Zecca dello Stato: Rome, Italy, 2021. [Google Scholar]
- Geofabrik. OpenStreetMap Data, Italy. Available online: http://download.geofabrik.de/europe/italy.html (accessed on 7 September 2022).
- ISPRA. Serie Storiche delle Emissioni Nazionali di Inquinanti Atmosferici 1990–2019. Available online: http://emissioni.sina.isprambiente.it/serie-storiche-emissioni/ (accessed on 7 September 2022).
- EMEP/EEA. Air Pollutant Emission Inventory Guidebook 2019. Available online: https://www.eea.europa.eu//publications/emep-eea-guidebook-2019 (accessed on 7 September 2022).
Publisher’s Note: MDPI stays neutral with regard to jurisdictional claims in published maps and institutional affiliations. |
© 2022 by the authors. Licensee MDPI, Basel, Switzerland. This article is an open access article distributed under the terms and conditions of the Creative Commons Attribution (CC BY) license (https://creativecommons.org/licenses/by/4.0/).