
A Tier-Wise Method for Evaluating Uncertainty in Life Cycle Assessment

 ,
,  ,
, 
Abstract
1. Introduction
- ➢
- To summarize the sources and types of uncertainty;
- ➢
- To list the possible ways to treat uncertainty in LCA;
- ➢
- To characterize the common and best practices found in the previous literature;
- ➢
- To discuss the pro and cons of applying the available approaches;
- ➢
- To propose a tier-wise framework for uncertainty treatment.
2. Methodology
- Step 1: Questions preparation
- -
- What are the main classes and types of uncertainty considered in LCA studies?
- -
- What types of methods were chosen for uncertainty treatment in LCA studies?
- -
- What are the pros and cons of using these approaches for uncertainty treatment?
- -
- How was the uncertainty characterized and reported in the literature?
- -
- The answers to these questions are provided in the results and discussion sections.
- Step 2: Literature identification
- Step 3: Inclusion or exclusion criteria
- -
- Only reference documents, peer-reviewed research articles (i.e., proposed methodologies or methods, and review articles and/or case studies), dissertation, and book chapters were selected;
- -
- The articles in which uncertainty treatment approaches were not considered were excluded.
- Step 4: Classification and analysis
3. Results and Discussion
3.1. Uncertainty Classification
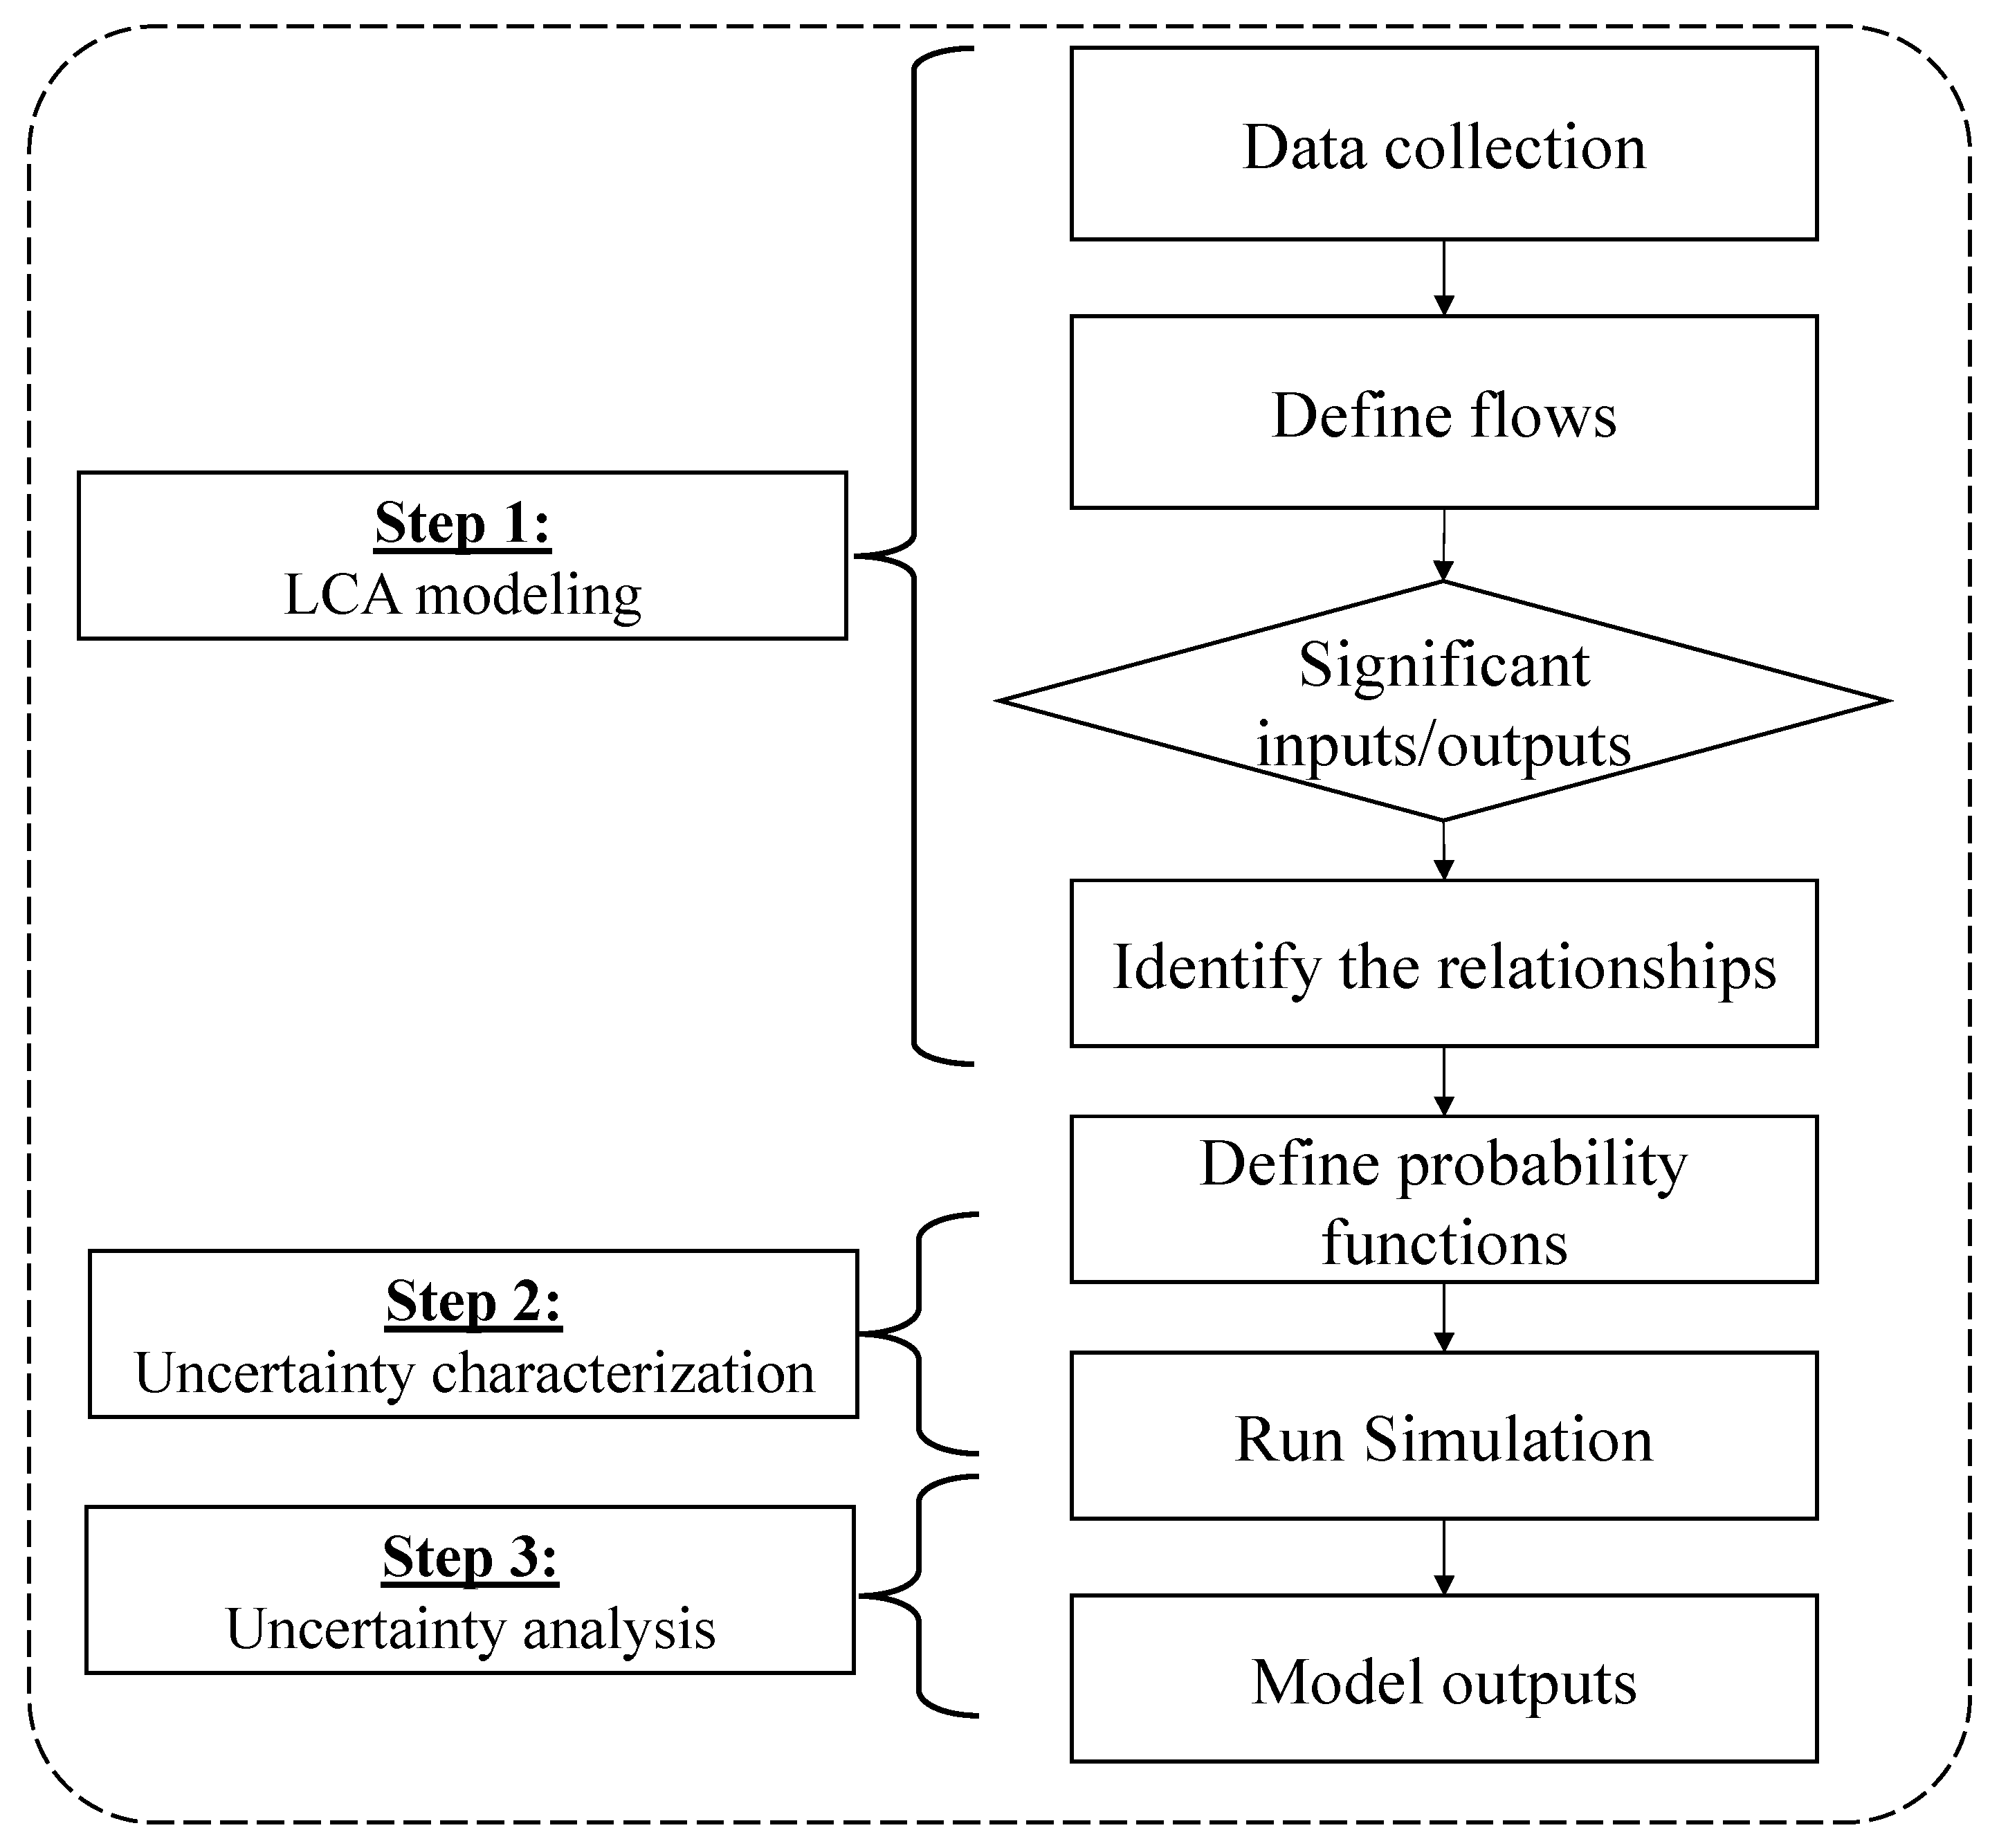
3.2. Uncertainty Propagation
3.2.1. Parameter Uncertainty
Pedigree Matrix
Sampling Methods
Analytical Methods
Statistical Methods
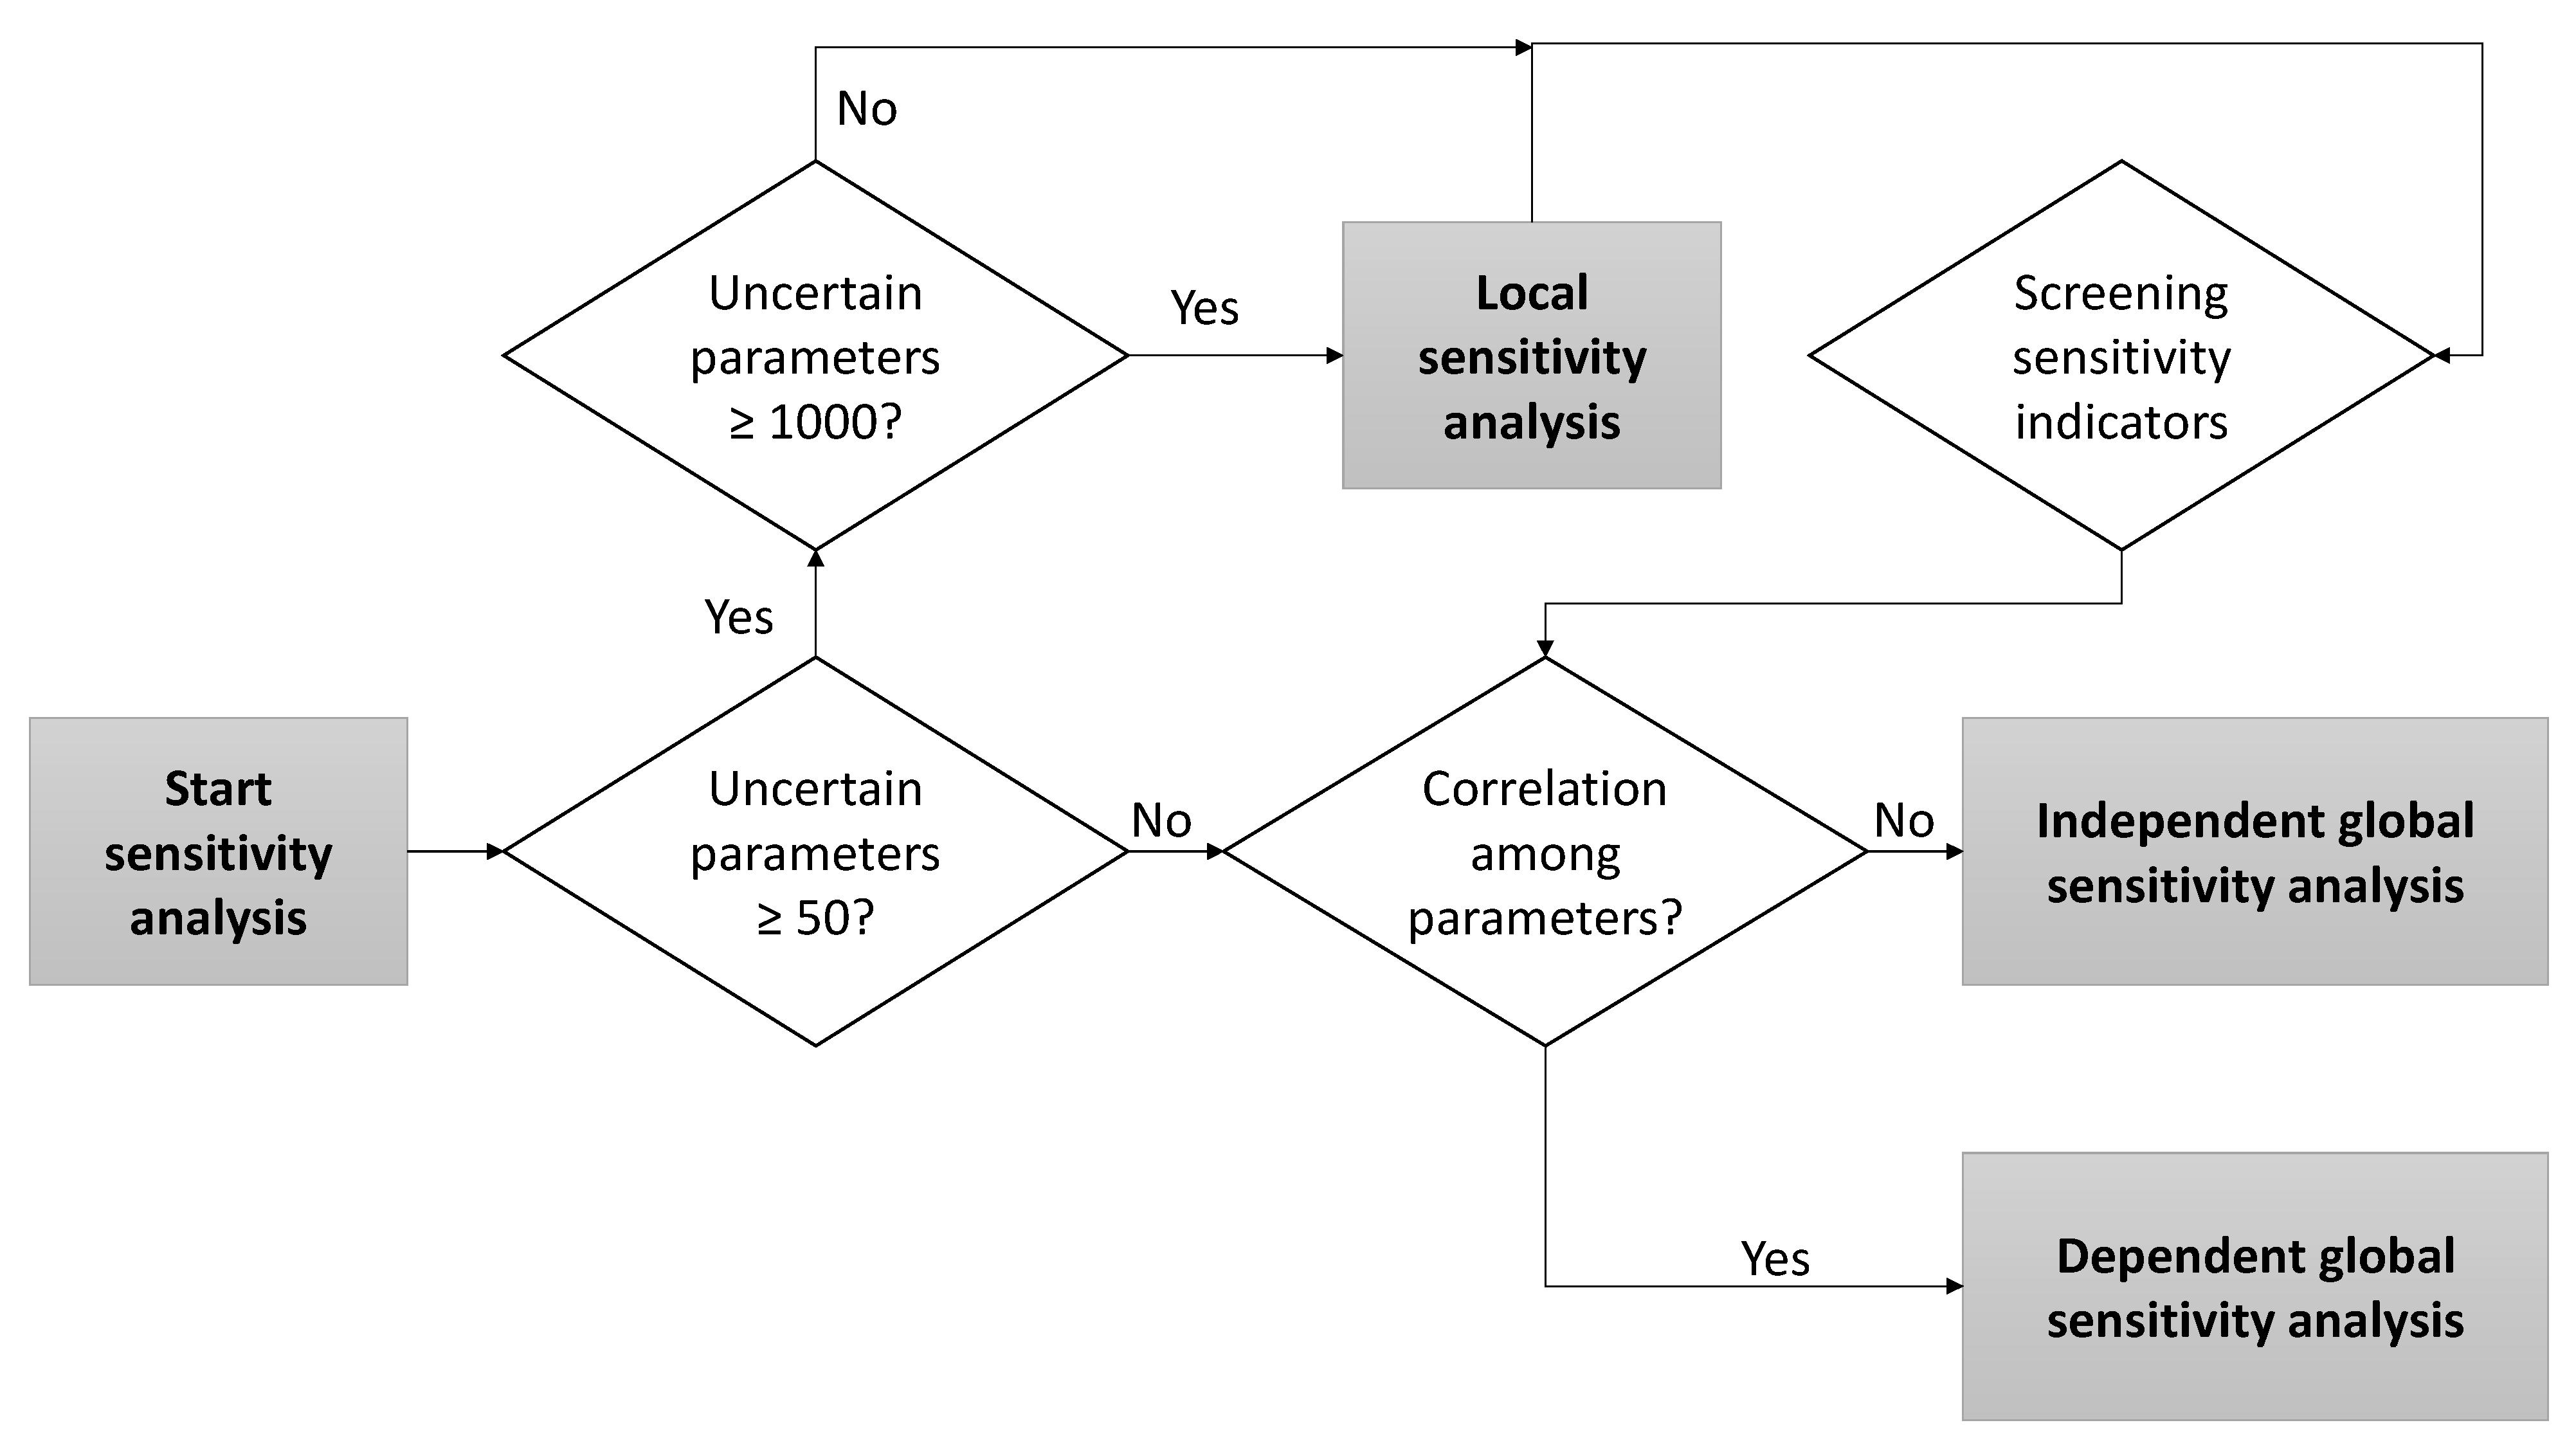
Sensitivity Analysis
3.2.2. Scenario Uncertainty
3.2.3. Model Uncertainty
3.3. Uncertainty Characterization
3.4. Uncertainty Reporting
3.5. Uncertainty Management Strategies
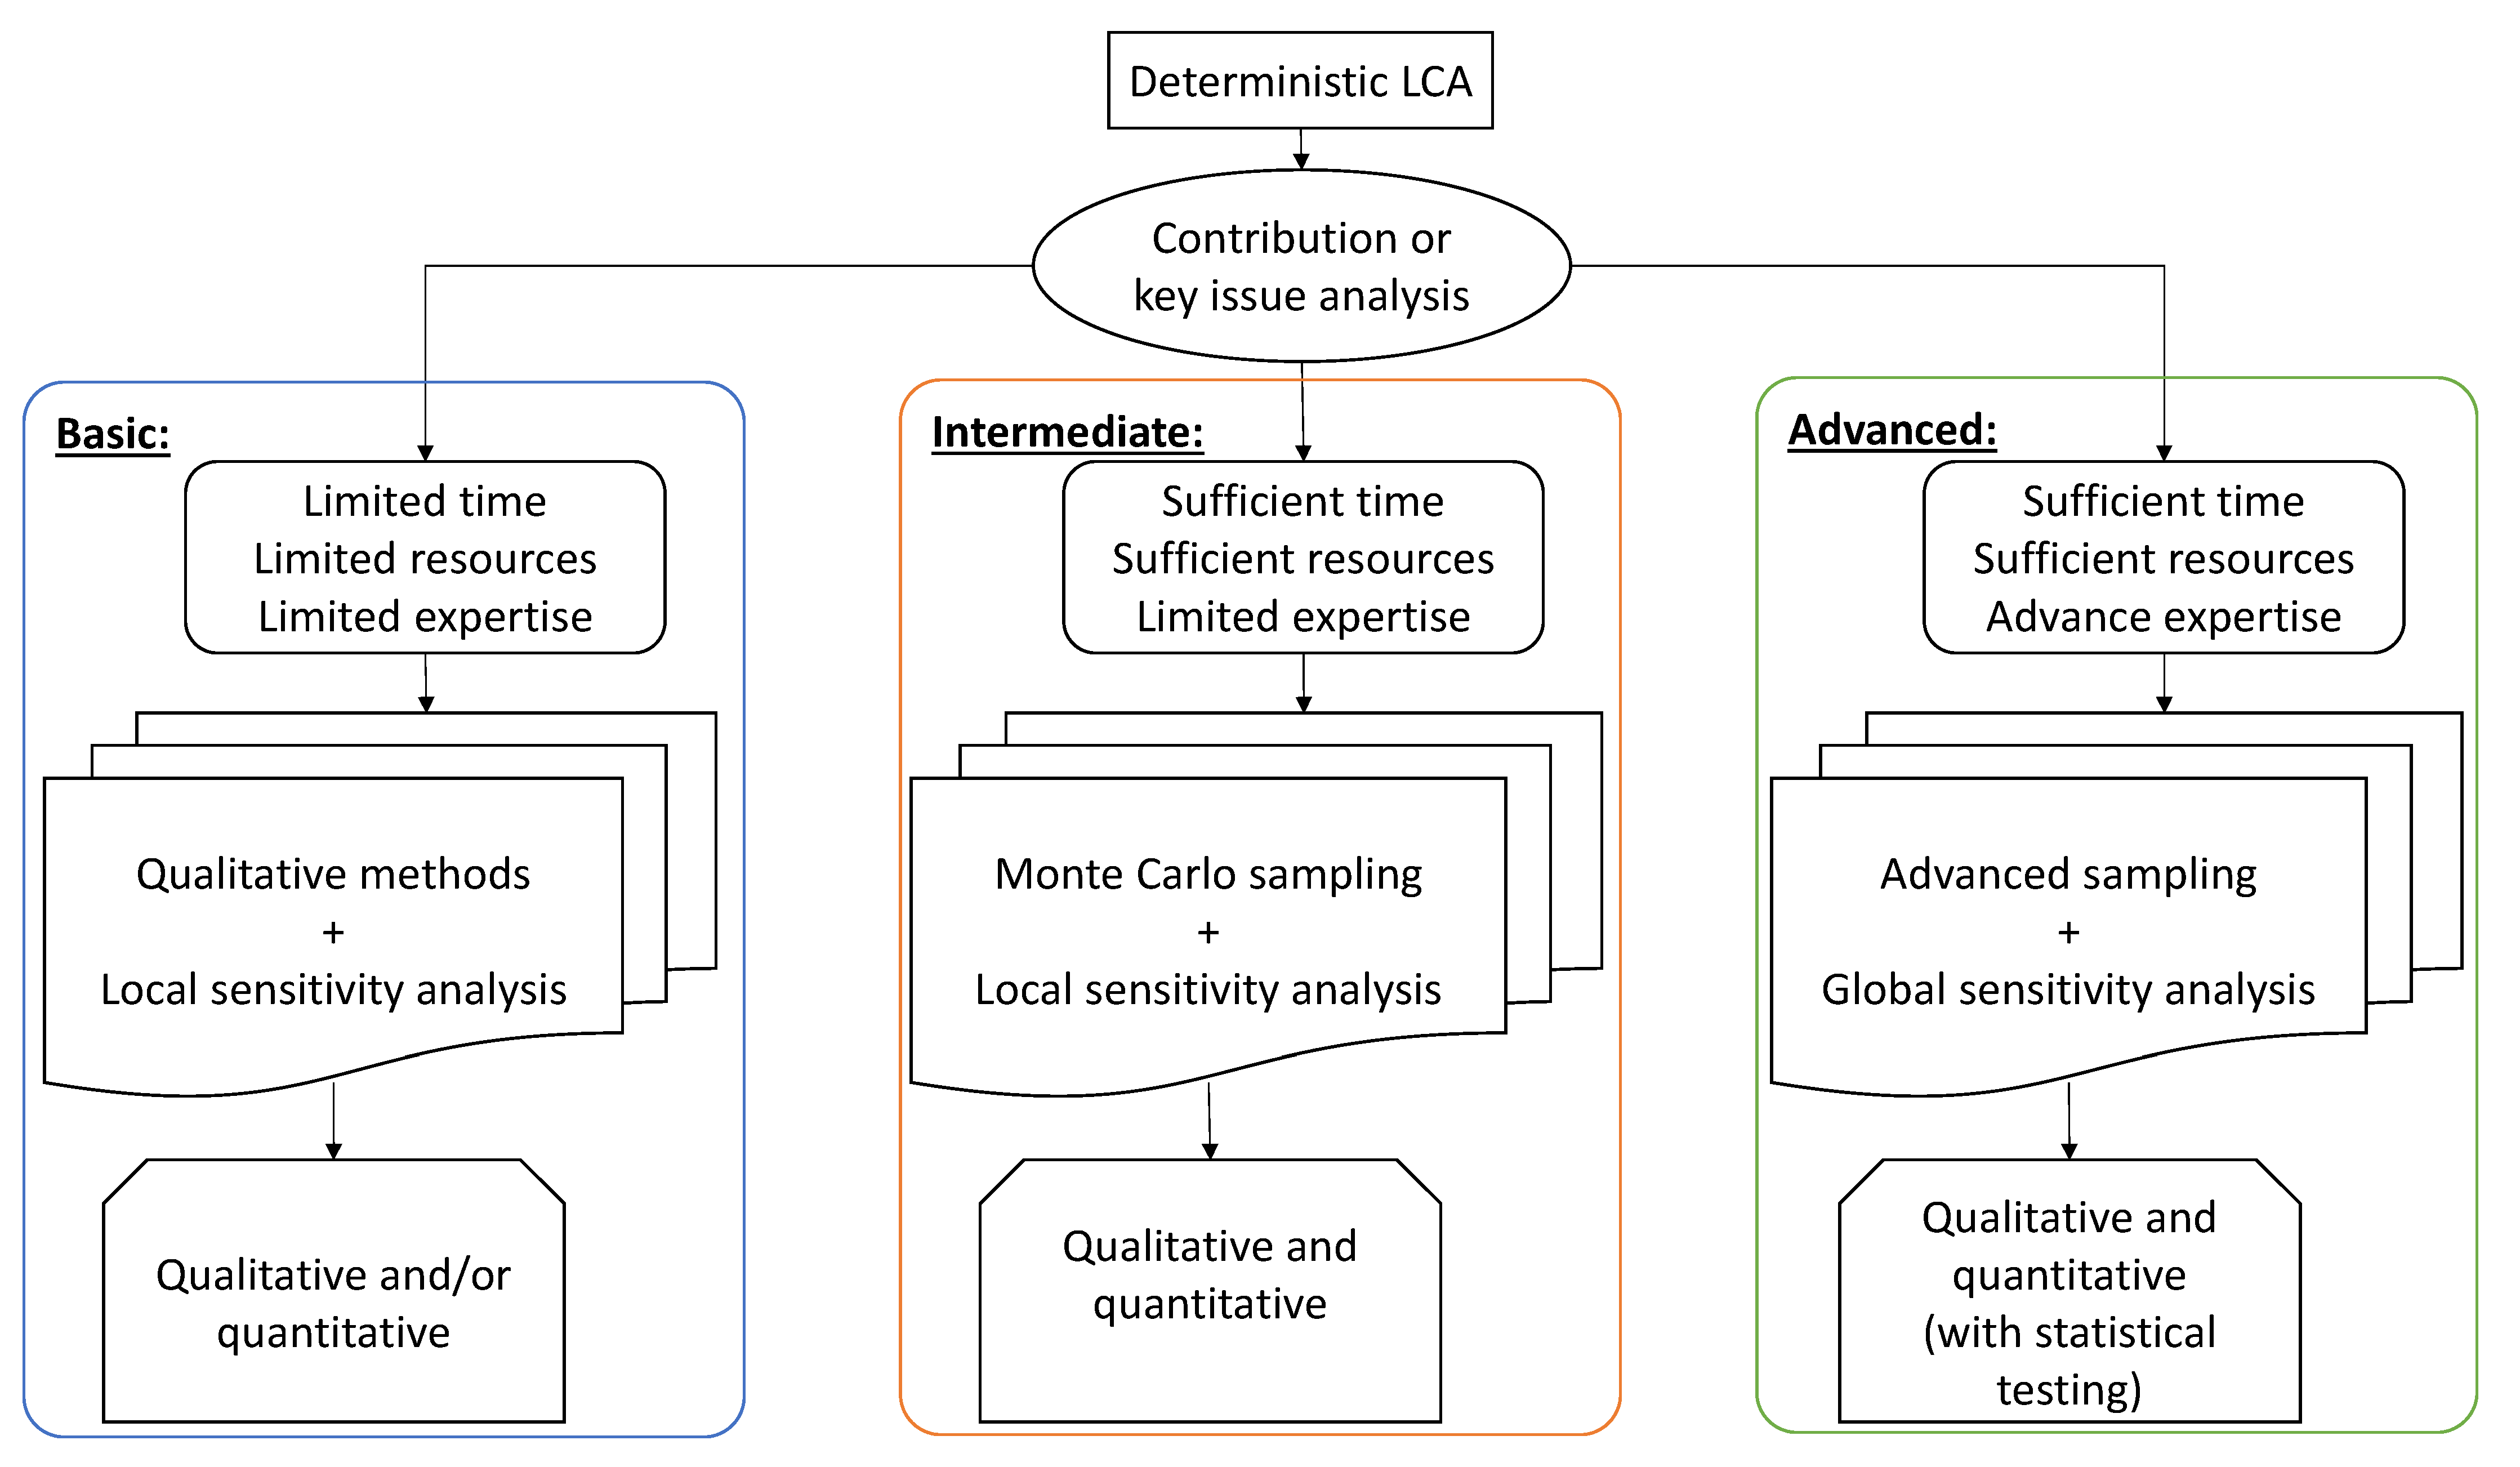
4. Conclusions
- -
- Both quantitative and qualitative characterization of uncertainty should be done by the LCA practitioners. Furthermore, parameter, scenario, and model uncertainties should also be reported in the LCA studies. When excluding any type of uncertainty, justification should be provided.
- -
- Although model uncertainty cannot be propagated as parameter or scenario uncertainty, an assessment of model uncertainty may be commenced by comparing the outcomes of midpoint and endpoint indicators. If the results vary, a more extensive investigation should be conducted.
- -
- LCA practitioners should not rely just on a single method (e.g., Monte Carlo sampling or Latin Hypercube sampling) and indicator (i.e., probability distribution, fuzzy intervals, variance, and intervals) for uncertainty propagation and characterization, respectively. Before making the final decision related to the methods or indicators, multiple options should be employed for the sake of unbiased interpretation.
- -
- Usually, the advanced and reliable approaches are rarely applied by practitioners due to a lack of knowledge, time, data, or tools. LCA software should be improved and must include the new methods (not limited to Monte Carlo sampling).
- -
- Various techniques such as histograms, error bars, distribution functions, etc. have been used for uncertainty communication. As LCA results are not limited only to the LCA community, uncertainty reporting must be done in a way that is easily understandable by non-experts as well.
Author Contributions
Funding
Institutional Review Board Statement
Informed Consent Statement
Data Availability Statement
Acknowledgments
Conflicts of Interest
References
- Klöpffer, W.; Grahl, B. Life Cycle Assessment (LCA): A Guide to Best Practice; Wiley-VCH Verlag GmbH & Co. KGaA: Weinheim, Germany, 2014. [Google Scholar]
- Groen, E.A. An Uncertain Climate: The Value of Uncertainty and Sensitivity Analysis in Environmental Impact Assessment of Food. Doctoral Dissertation, Wageningen University, Wageningen, The Netherlands, 2016. [Google Scholar]
- Curran, M.A. Life Cycle Assessment Handbook: A Guide for Environmentally Sustainable Products; Scrivener Publishing LLC: Cincinnati, OH, USA, 2012. [Google Scholar]
- Cooper, J.S.; Fava, J.A. Life-Cycle Assessment Practitioner Survey: Summary of Results. J. Ind. Ecol. 2006, 10, 12–14. [Google Scholar] [CrossRef]
- ISO 14044:2006; Environmental Management—Life Cycle Assessment—Requirements and Guidelines. International Organization for Standardization: Geneva, Switzerland, 2016.
- ISO 14040:2006; Environmental Management—Life Cycle Assessment—Principles and Framework. International Organization for Standardization: Geneva, Switzerland, 2016.
- Henriksson, P.J.G.; Guinée, J.B.; Heijungs, R.; de Koning, A.; Green, D.M. A Protocol for Horizontal Averaging of Unit Process Data-Including Estimates for Uncertainty. Int. J. Life Cycle Assess. 2013, 19, 429–436. [Google Scholar] [CrossRef]
- Weidema, B. Has ISO 14040/44 Failed Its Role as a Standard for Life Cycle Assessment? J. Ind. Ecol. 2014, 18, 324–326. [Google Scholar] [CrossRef]
- Schaubroeck, T.; Schrijvers, D.; Schaubroeck, S.; Moretti, C.; Zamagni, A.; Pelletie, N.; Huppes, G.; Brandão, M. Definition of Product System and Solving Multifunctionality in ISO 14040-14044: Inconsistencies and Proposed Amendments-Toward a More Open and General LCA Framework. Front. Sustain. 2022, 3, 778100. [Google Scholar] [CrossRef]
- Björklund, A.E. Survey of Approaches to Improve Reliability in LCA. Int. J. Life Cycle Assess. 2002, 7, 64–72. [Google Scholar] [CrossRef]
- Ciroth, A.; Muller, S.; Weidema, B.; Lesage, P. Empirically Based Uncertainty Factors for the Pedigree Matrix in Ecoinvent. Int. J. Life Cycle Assess. 2013, 21, 1338–1348. [Google Scholar] [CrossRef]
- Roy, P.O.; Azevedo, L.B.; Margni, M.; van Zelm, R.; Deschênes, L.; Huijbregts, M.A.J. Characterization Factors for Terrestrial Acidification at the Global Scale: A Systematic Analysis of Spatial Variability and Uncertainty. Sci. Total Environ. 2014, 500–501, 270–276. [Google Scholar] [CrossRef]
- Ullah, A.; Silalertruksa, T.; Gheewala, S.H. Epistemic Uncertainty and Stochastic Analysis in the Sugarcane Production Systems in Thailand—Quantifying the Confidence in Comparative Results. J. Clean. Prod. 2020, 277, 124095. [Google Scholar] [CrossRef]
- Ekvall, T. SETAC Summaries. J. Clean. Prod. 2005, 13, 1351–1358. [Google Scholar] [CrossRef]
- Rosenbaum, R.K.; Georgiadis, S.; Fantke, P.; Rosenbaum, R.K.; Georgiadis, S.; Fantke, P. Uncertainty Management and Sensitivity Analysis. In Life Cycle Assessment; Springer: Cham, Switzerland, 2018. [Google Scholar] [CrossRef]
- Heijungs, R.; Huijbregts, M.A.J. A Review of Approaches to Treat Uncertainty in LCA. In Proceedings of the International Congress on Environmental Modelling and Software (iEMSs), Osnabrück, Germany, 14–17 June 2004. [Google Scholar]
- Mendoza Beltrán, M.A. Deepening the Uncertainty Dimension of Environmental Life Cycle Assessment Addressing Choice, Future and Interpretation Uncertainties. Doctoral Dissertation, Leiden University, Leiden, The Netherlands, 2018. [Google Scholar]
- Igos, E.; Benetto, E.; Meyer, R.; Baustert, P.; Othoniel, B. How to Treat Uncertainties in Life Cycle Assessment Studies? Int. J. Life Cycle Assess. 2018, 24, 794–807. [Google Scholar] [CrossRef]
- Bamber, N.; Turner, I.; Arulnathan, V.; Li, Y.; Zargar Ershadi, S.; Smart, A.; Pelletier, N. Comparing Sources and Analysis of Uncertainty in Consequential and Attributional Life Cycle Assessment: Review of Current Practice and Recommendations. Int. J. Life Cycle Assess. 2020, 25, 168–180. [Google Scholar] [CrossRef]
- Lloyd, S.M.; Ries, R. Characterizing, Propagating, and Analyzing Uncertainty in Life-Cycle Assessment. J. Ind. Ecol. 2007, 11, 161–181. [Google Scholar] [CrossRef]
- Huijbregts, M.A.J. Application of Uncertainty and Variability in LCA. Int. J. Life Cycle Assess. 1998, 3, 273–280. [Google Scholar] [CrossRef]
- Huijbregts, M.A.J.; Gilijamse, W.; Ragas, A.M.J.; Reijnders, L. Evaluating Uncertainty in Environmental Life-Cycle Assessment. A Case Study Comparing Two Insulation Options for a Dutch One-Family Dwelling. Environ. Sci. Technol. 2003, 37, 2600–2608. [Google Scholar] [CrossRef] [PubMed]
- Clavreul, J.; Guyonnet, D.; Christensen, T.H. Quantifying Uncertainty in LCA-Modelling of Waste Management Systems. Waste Manag. 2012, 32, 2482–2495. [Google Scholar] [CrossRef]
- Groen, E.A.; Heijungs, R.; Bokkers, E.A.M.; de Boer, I.J.M. Methods for Uncertainty Propagation in Life Cycle Assessment. Environ. Model. Softw. 2014, 62, 316–325. [Google Scholar] [CrossRef]
- Basset-Mens, C.; Van Der Werf, H.M.G.; Durand, P.; Leterme, P. Implications of Uncertainty and Variability in the Life Cycle Assessment of Pig Production Systems. Int. J. Life Cycle Assess. 2006, 11, 298–304. [Google Scholar] [CrossRef]
- Bisinella, V.; Conradsen, K.; Christensen, T.H.; Astrup, T.F. A Global Approach for Sparse Representation of Uncertainty in Life Cycle Assessments of Waste Management Systems. Int. J. Life Cycle Assess. 2016, 21, 378–394. [Google Scholar] [CrossRef]
- Weidema, B.P.; Wesnaes, M.S. Data Quality Management for Life Cycle Inventories-an Example of Using Data Quality Indicators. J. Clean. Prod 1996, 4, 167–174. [Google Scholar] [CrossRef]
- Huijbregts, M.A.J.; Norris, G.; Bretz, R.; Ciroth, A.; Maurice, B.; von Bahr, B.; Weidema, B.; de Beaufort, A.S.H. Framework for Modelling Data Uncertainty in Life Cycle Inventories. Int. J. Life Cycle Assess. 2001, 6, 127–132. [Google Scholar] [CrossRef]
- Frischknecht, R.; Jungbluth, N.; Althaus, H.; Doka, G.; Dones, R.; Heck, T.; Hellweg, S.; Hischier, R.; Nemecek, T.; Rebitzer, G.; et al. Overview and Methodology. In Ecoinvent Report No. 1; Swiss Centre for Life Cycle Inventories: Dübendorf, Switzerland, 2007; pp. 1–77. [Google Scholar]
- Wedema, B.P.; Bauer, C.; Hischier, R.; Mutel, C.; Nemecek, T.; Reinhard, J.; Vadenbo, C.O.; Wenet, G.; Weidema, B.P.; Bauer, C.; et al. Data Quality Guideline for the Ecoinvent Database Version 3. Ecoinvent Report 1 (V3). Swiss Cent. Life Cycle Invent. 2013, 3, 169. [Google Scholar]
- Yang, Y.; Tao, M.; Suh, S. Geographic Variability of Agriculture Requires Sector-Specific Uncertainty Characterization. Int. J. Life Cycle Assess. 2017, 23, 1581–1589. [Google Scholar] [CrossRef]
- Qin, Y.; Cucurachi, S.; Suh, S. Perceived Uncertainties of Characterization in LCA: A Survey. Int. J. Life Cycle Assess. 2020, 25, 1846–1858. [Google Scholar] [CrossRef]
- Morris, M.D.; Mitchell, T.J. Exploratory Designs for Computational Experiments. J. Stat. Plan. Inference 1995, 43, 381–402. [Google Scholar] [CrossRef]
- Tarantola, S.; Becker, W.; Zeitz, D. A Comparison of Two Sampling Methods for Global Sensitivity Analysis. Comput. Phys. Commun. 2012, 183, 1061–1072. [Google Scholar] [CrossRef]
- Sobol’, I.M. On the Distribution of Points in a Cube and the Approximate Evaluation of Integrals. USSR Comput. Math. Math. Phys. 1967, 7, 86–112. [Google Scholar] [CrossRef]
- Heijungs, R. On the Number of Monte Carlo Runs in Comparative Probabilistic LCA. Int. J. Life Cycle Assess. 2019, 25, 394–402. [Google Scholar] [CrossRef]
- Bojacá, C.R.; Schrevens, E. Parameter Uncertainty in LCA: Stochastic Sampling under Correlation. Int. J. Life Cycle Assess. 2010, 15, 238–246. [Google Scholar] [CrossRef]
- Morgan, M.G.; Henrion, M.; Small, M. Uncertainty: A Guide to Dealing with Uncertainty in Quantitative Risk and Policy Analysis; Cambridge University Press: Cambridge, UK, 1990. [Google Scholar]
- Heijungs, R. A Generic Method for the Identification of Options for Cleaner Products. Ecol. Econ. 1994, 10, 69–81. [Google Scholar] [CrossRef]
- Ciroth, A. Refining the Pedigree Matrix Approach in Ecoinvent: Towards Empirical Uncertainty Factors; LCA Discussion Forum: Zürich, Switzerland, 2013. [Google Scholar]
- Hong, J.; Shaked, S.; Rosenbaum, R.K.; Jolliet, O. Analytical Uncertainty Propagation in Life Cycle Inventory and Impact Assessment: Application to an Automobile Front Panel. Int. J. Life Cycle Assess. 2010, 15, 499–510. [Google Scholar] [CrossRef]
- Imbeault-Tétreault, H.; Jolliet, O.; Deschênes, L.; Rosenbaum, R.K. Analytical Propagation of Uncertainty in Life Cycle Assessment Using Matrix Formulation. J. Ind. Ecol. 2013, 17, 485–492. [Google Scholar] [CrossRef]
- Heijungs, R.; Lenzen, M. Error Propagation Methods for LCA-a Comparison. Int. J. Life Cycle Assess. 2014, 19, 1445–1461. [Google Scholar] [CrossRef]
- Groen, E.A.; Heijungs, R. Ignoring Correlation in Uncertainty and Sensitivity Analysis in Life Cycle Assessment: What Is the Risk? Environ. Impact Assess. Rev. 2016, 62, 98–109. [Google Scholar] [CrossRef]
- Lo, S.C.; Ma, H.W.; Lo, S.L. Quantifying and Reducing Uncertainty in Life Cycle Assessment Using the Bayesian Monte Carlo Method. Sci. Total Environ. 2005, 340, 23–33. [Google Scholar] [CrossRef]
- Cruze, N.; Goel, P.K.; Bakshi, B.R. On the “Rigorous Proof of Fuzzy Error Propagation with Matrix-Based LCI”. Int. J. Life Cycle Assess. 2013, 18, 516–519. [Google Scholar] [CrossRef]
- Weckenmann, A.; Schwan, A. Environmental Life Cycle Assessment with Support of Fuzzy-Sets. Int. J. Life Cycle Assess. 2001, 6, 13–18. [Google Scholar] [CrossRef]
- Tan, R.R. Using Fuzzy Numbers to Propagate Uncertainty in Matrix-Based LCI. Int. J. Life Cycle Assess. 2008, 7, 585–592. [Google Scholar] [CrossRef]
- Heijungs, R.; Kleijn, R. Numerical Approaches towards Life Cycle Interpretation Five Examples. Int. J. Life Cycle Assess. 2001, 6, 141–148. [Google Scholar] [CrossRef]
- Wei, W.; Larrey-Lassalle, P.; Faure, T.; Dumoulin, N.; Roux, P.; Mathias, J.D. How to Conduct a Proper Sensitivity Analysis in Life Cycle Assessment: Taking into Account Correlations within LCI Data and Interactions within the LCA Calculation Model. Environ. Sci. Technol. 2015, 49, 377–385. [Google Scholar] [CrossRef]
- Geisler, G.; Hellweg, S.; Hungerbühler, K. Uncertainty Analysis in Life Cycle Assessment (LCA): Case Study on Plant—Protection Products and Implications for Decision Making (3 Pp). Int. J. Life Cycle Assess. 2005, 10, 192.1–192.3. [Google Scholar] [CrossRef]
- Mutel, C.L.; De Baan, L.; Hellweg, S. Two-Step Sensitivity Testing of Parametrized and Regionalized Life Cycle Assessments: Methodology and Case Study. Environ. Sci. Technol. 2013, 47, 5660–5667. [Google Scholar] [CrossRef] [PubMed]
- Ylmén, P.; Berlin, J.; Mjörnell, K.; Arfvidsson, J. Managing Choice Uncertainties in Life-Cycle Assessment as a Decision-Support Tool for Building Design: A Case Study on Building Framework. Sustainability 2020, 12, 5130. [Google Scholar] [CrossRef]
- Mendoza Beltran, A.; Chiantore, M.; Pecorino, D.; Corner, R.A.; Ferreira, J.G.; Cò, R.; Fanciulli, L.; Guinée, J.B. Accounting for Inventory Data and Methodological Choice Uncertainty in a Comparative Life Cycle Assessment: The Case of Integrated Multi-Trophic Aquaculture in an Offshore Mediterranean Enterprise. Int. J. Life Cycle Assess. 2017, 23, 1063–1077. [Google Scholar] [CrossRef]
- Cherubini, E.; Franco, D.; Zanghelini, G.M.; Soares, S.R. Uncertainty in LCA Case Study Due to Allocation Approaches and Life Cycle Impact Assessment Methods. Int. J. Life Cycle Assess. 2018, 23, 2055–2070. [Google Scholar] [CrossRef]
- Lacirignola, M.; Blanc, P.; Girard, R.; Pérez-López, P.; Blanc, I. LCA of Emerging Technologies: Addressing High Uncertainty on Inputs’ Variability When Performing Global Sensitivity Analysis. Sci. Total Environ. 2017, 578, 268–280. [Google Scholar] [CrossRef]
- Qin, Y.; Suh, S. What Distribution Function Do Life Cycle Inventories Follow? Int. J. Life Cycle Assess. 2017, 22, 1138–1145. [Google Scholar] [CrossRef]
- Heijungs, R.; Henriksson, P.J.G.; Guinée, J.B. Pre-Calculated LCI Systems with Uncertainties Cannot Be Used in Comparative LCA. Int. J. Life Cycle Assess. 2017, 22, 461. [Google Scholar] [CrossRef]
- Suh, S.; Qin, Y. Pre-Calculated LCIs with Uncertainties Revisited. Int. J. Life Cycle Assess. 2017, 22, 827–831. [Google Scholar] [CrossRef]
- Muller, S.; Mutel, C.; Lesage, P.; Samson, R. Effects of Distribution Choice on the Modeling of Life Cycle Inventory Uncertainty: An Assessment on the Ecoinvent v2.2 Database. J. Ind. Ecol. 2018, 22, 300–313. [Google Scholar] [CrossRef]
- Allegrini, E.; Butera, S.; Kosson, D.S.; Van Zomeren, A.; Van der Sloot, H.A.; Astrup, T.F. Life Cycle Assessment and Residue Leaching: The Importance of Parameter, Scenario and Leaching Data Selection. Waste Manag. 2015, 38, 474–485. [Google Scholar] [CrossRef]


| Reference | Type | Summary of the Content |
|---|---|---|
| Huijbregts [21] | Methodologies or Methods | Proposed a framework and classification of uncertainties. |
| Huijbregts et al. [22] | Case study (article) | Offers a broad approach for quantifying LCA uncertainties (i.e., parameter, scenario, and model) and illustrates it with a case study. |
| ISO 14040 [6] and ISO 14044 [5] | Reference documents | Provides a standard definition of uncertainty analysis in LCA but does not stipulate a framework for treatment while explicitly mentioning the treatment process as “Either ranges or probability distributions are used to determine uncertainty in the results”. |
| Lloyd and Ries [20] | Review article | Surveyed 24 LCA studies that employed quantitative uncertainty analysis and summarized the available practices for uncertainty characterization and propagation. |
| Clavreul et al. [23] | Case study | The uncertainties particular to waste in LCA contexts were presented, as well as numerous approaches for uncertainty analysis. In addition, a comprehensive methodology for quantifying the uncertainty was also proposed. |
| Groen [2] | Dissertation | An in-depth analysis of variability and uncertainty in the LCA outcomes, using multiple approaches. |
| Igos et al. [18] | Review article | The approaches for identifying, characterizing, propagating (uncertainty analysis), understanding the impacts (sensitivity analysis), and communicating uncertainty were discussed. |
| Rosenbaum et al. [15] | Book chapter | Discusses how to assess, analyze, and convey uncertainties in LCA contexts. |
| Mendoza Beltran [17] | Dissertation | A deeper picture of the significance of multiple sources of uncertainty in LCA is offered by highlighting various sources of uncertainty. |
| Bamber et al. [19] | Review article | Common sources of uncertainty and techniques to address them were outlined, and their frequency of use was assessed. |
| Author(s) | Classification | Description |
|---|---|---|
| Huijbregts [21] | Parameter uncertainty | Defined as error in parametric quantities, inadequate or outdated measurements (corresponding to unrepresentativeness of the data), or no data (generally corresponding to lack of data). |
| Scenario uncertainty | Defined as the structuring of several options in order to compare results for various normative choices connected with functional units, weighting factors, and/or allocation procedures, and so on. | |
| Model uncertainty | Model uncertainty is introduced due to emissions aggregation in the inventory analysis and deriving characterization factors using linear modeling. | |
| Basset-Mens et al. [25] | Intra-system variability | Uncertainty inside a considered system. |
| Intersystem variability | Uncertainty between different systems under consideration. | |
| Clavreul et al. [23] | Epistemic uncertainty | The insufficient knowledge, which is simply referred to as uncertainty. |
| Stochastic uncertainty | Spatial, temporal, and technological unpredictability (mostly known as variability). | |
| Igos et al. [18] | Quantity uncertainty | Further classified into epistemic (lack of data) and ontic (variability) uncertainty. |
| Model structure and context uncertainty | The formulation of alternate scenarios to analyze findings based on different assumptions is a popular way to differentiate the two (e.g., allocation procedures, geographic resolution, or supplier choice). |
| Approaches | Pros | Cons |
|---|---|---|
| Sampling methods | The sampling methods produce more (directly) usable information than other methods (i.e., fuzzy interval or analytical approaches). Small and large uncertainty ranges can also be handled. If correlations exist between parameters, then it is technically easy to deal with. | It is time intensive as sometimes hours to days are required for simulations. More information related to the parameters (e.g., parameters/inputs and distribution type) is required. Advanced sampling methods (i.e., Latin Hypercube sampling, and Quasi-Monte Carlo sampling) are not available in LCA software. |
| Analytical methods | It may require complex mathematical equations, though uncertainty propagation is efficient and straightforward to apply with this approach. Computationally quick. Type of distribution and input parameters are not required. The correlation among the parameters can also be noted. | Fairly inflexible and confined to simple models. Less broadly applicable than Monte Carlo sampling method. It only works with small uncertainty ranges and provides lesser information than the sampling methods. |
| Statistical methods | This is preferable to sampling methods in terms of calculation time. It enables subjective uncertainty estimations to be addressed using normal statistical computing processes. When used with other approaches, it can provide more information. | This method is not yet fully functional in LCA and provides less information than analytical and sampling procedures. |
| Sensitivity analysis | Local sensitivity analysis is a promising approach for LCA practitioners just because of its simplicity and compatibility with LCA software. Global sensitivity analysis can provide a robust analysis regarding output sensitivity by studying the whole input space. | Local sensitivity analysis could be time extensive if there are many parameters. Global sensitivity analysis requires a large amount of data and a long computation time based on the probability distribution of inputs. Furthermore, it is not yet operational in LCA software. |
| Approach | Pros | Cons |
|---|---|---|
| Qualitative | It enables quick integration of outcomes and drawn conclusions, particularly for non-quantitative data, and is easier to remember for most readers than numerical data. | Many of the terms used to characterize uncertainty qualitatively are erroneous and sensitive to human perception and interpretation. |
| Descriptive | It may also be easily coupled with the results and conclusions, which is particularly beneficial when dealing with quantitative data. | This approach is susceptible to several anomalies while defining the terms clearly, use them consistently, and link them to numerical data if available. |
| Graphical | This has the benefit of presenting a large dataset in a compact and organized manner, allowing us to report sufficient uncertainty information in a short time and on a single graph. | Graphical depictions of uncertainty can be deceptive, easily misinterpreted, or unnecessarily intricate at times. |
| Numerical | This method is particularly useful in inner layers of data, e.g., in a report appendix. | Communicating uncertainties with “false precision” displaying too many numbers is a typical error. This technique necessitates a highly precise quantification of uncertainty, which is unlikely to be justified in the context of an LCA. |
Publisher’s Note: MDPI stays neutral with regard to jurisdictional claims in published maps and institutional affiliations. |
© 2022 by the authors. Licensee MDPI, Basel, Switzerland. This article is an open access article distributed under the terms and conditions of the Creative Commons Attribution (CC BY) license (https://creativecommons.org/licenses/by/4.0/).
Share and Cite
Mahmood, A.; Varabuntoonvit, V.; Mungkalasiri, J.; Silalertruksa, T.; Gheewala, S.H. A Tier-Wise Method for Evaluating Uncertainty in Life Cycle Assessment. Sustainability 2022, 14, 13400. https://doi.org/10.3390/su142013400
Mahmood A, Varabuntoonvit V, Mungkalasiri J, Silalertruksa T, Gheewala SH. A Tier-Wise Method for Evaluating Uncertainty in Life Cycle Assessment. Sustainability. 2022; 14(20):13400. https://doi.org/10.3390/su142013400
Chicago/Turabian StyleMahmood, Awais, Viganda Varabuntoonvit, Jitti Mungkalasiri, Thapat Silalertruksa, and Shabbir H. Gheewala. 2022. "A Tier-Wise Method for Evaluating Uncertainty in Life Cycle Assessment" Sustainability 14, no. 20: 13400. https://doi.org/10.3390/su142013400
APA StyleMahmood, A., Varabuntoonvit, V., Mungkalasiri, J., Silalertruksa, T., & Gheewala, S. H. (2022). A Tier-Wise Method for Evaluating Uncertainty in Life Cycle Assessment. Sustainability, 14(20), 13400. https://doi.org/10.3390/su142013400