

Prospective Life Cycle Costing of Electricity Generation from Municipal Solid Waste in Nigeria


Abstract
1. Introduction
2. Materials and Methods
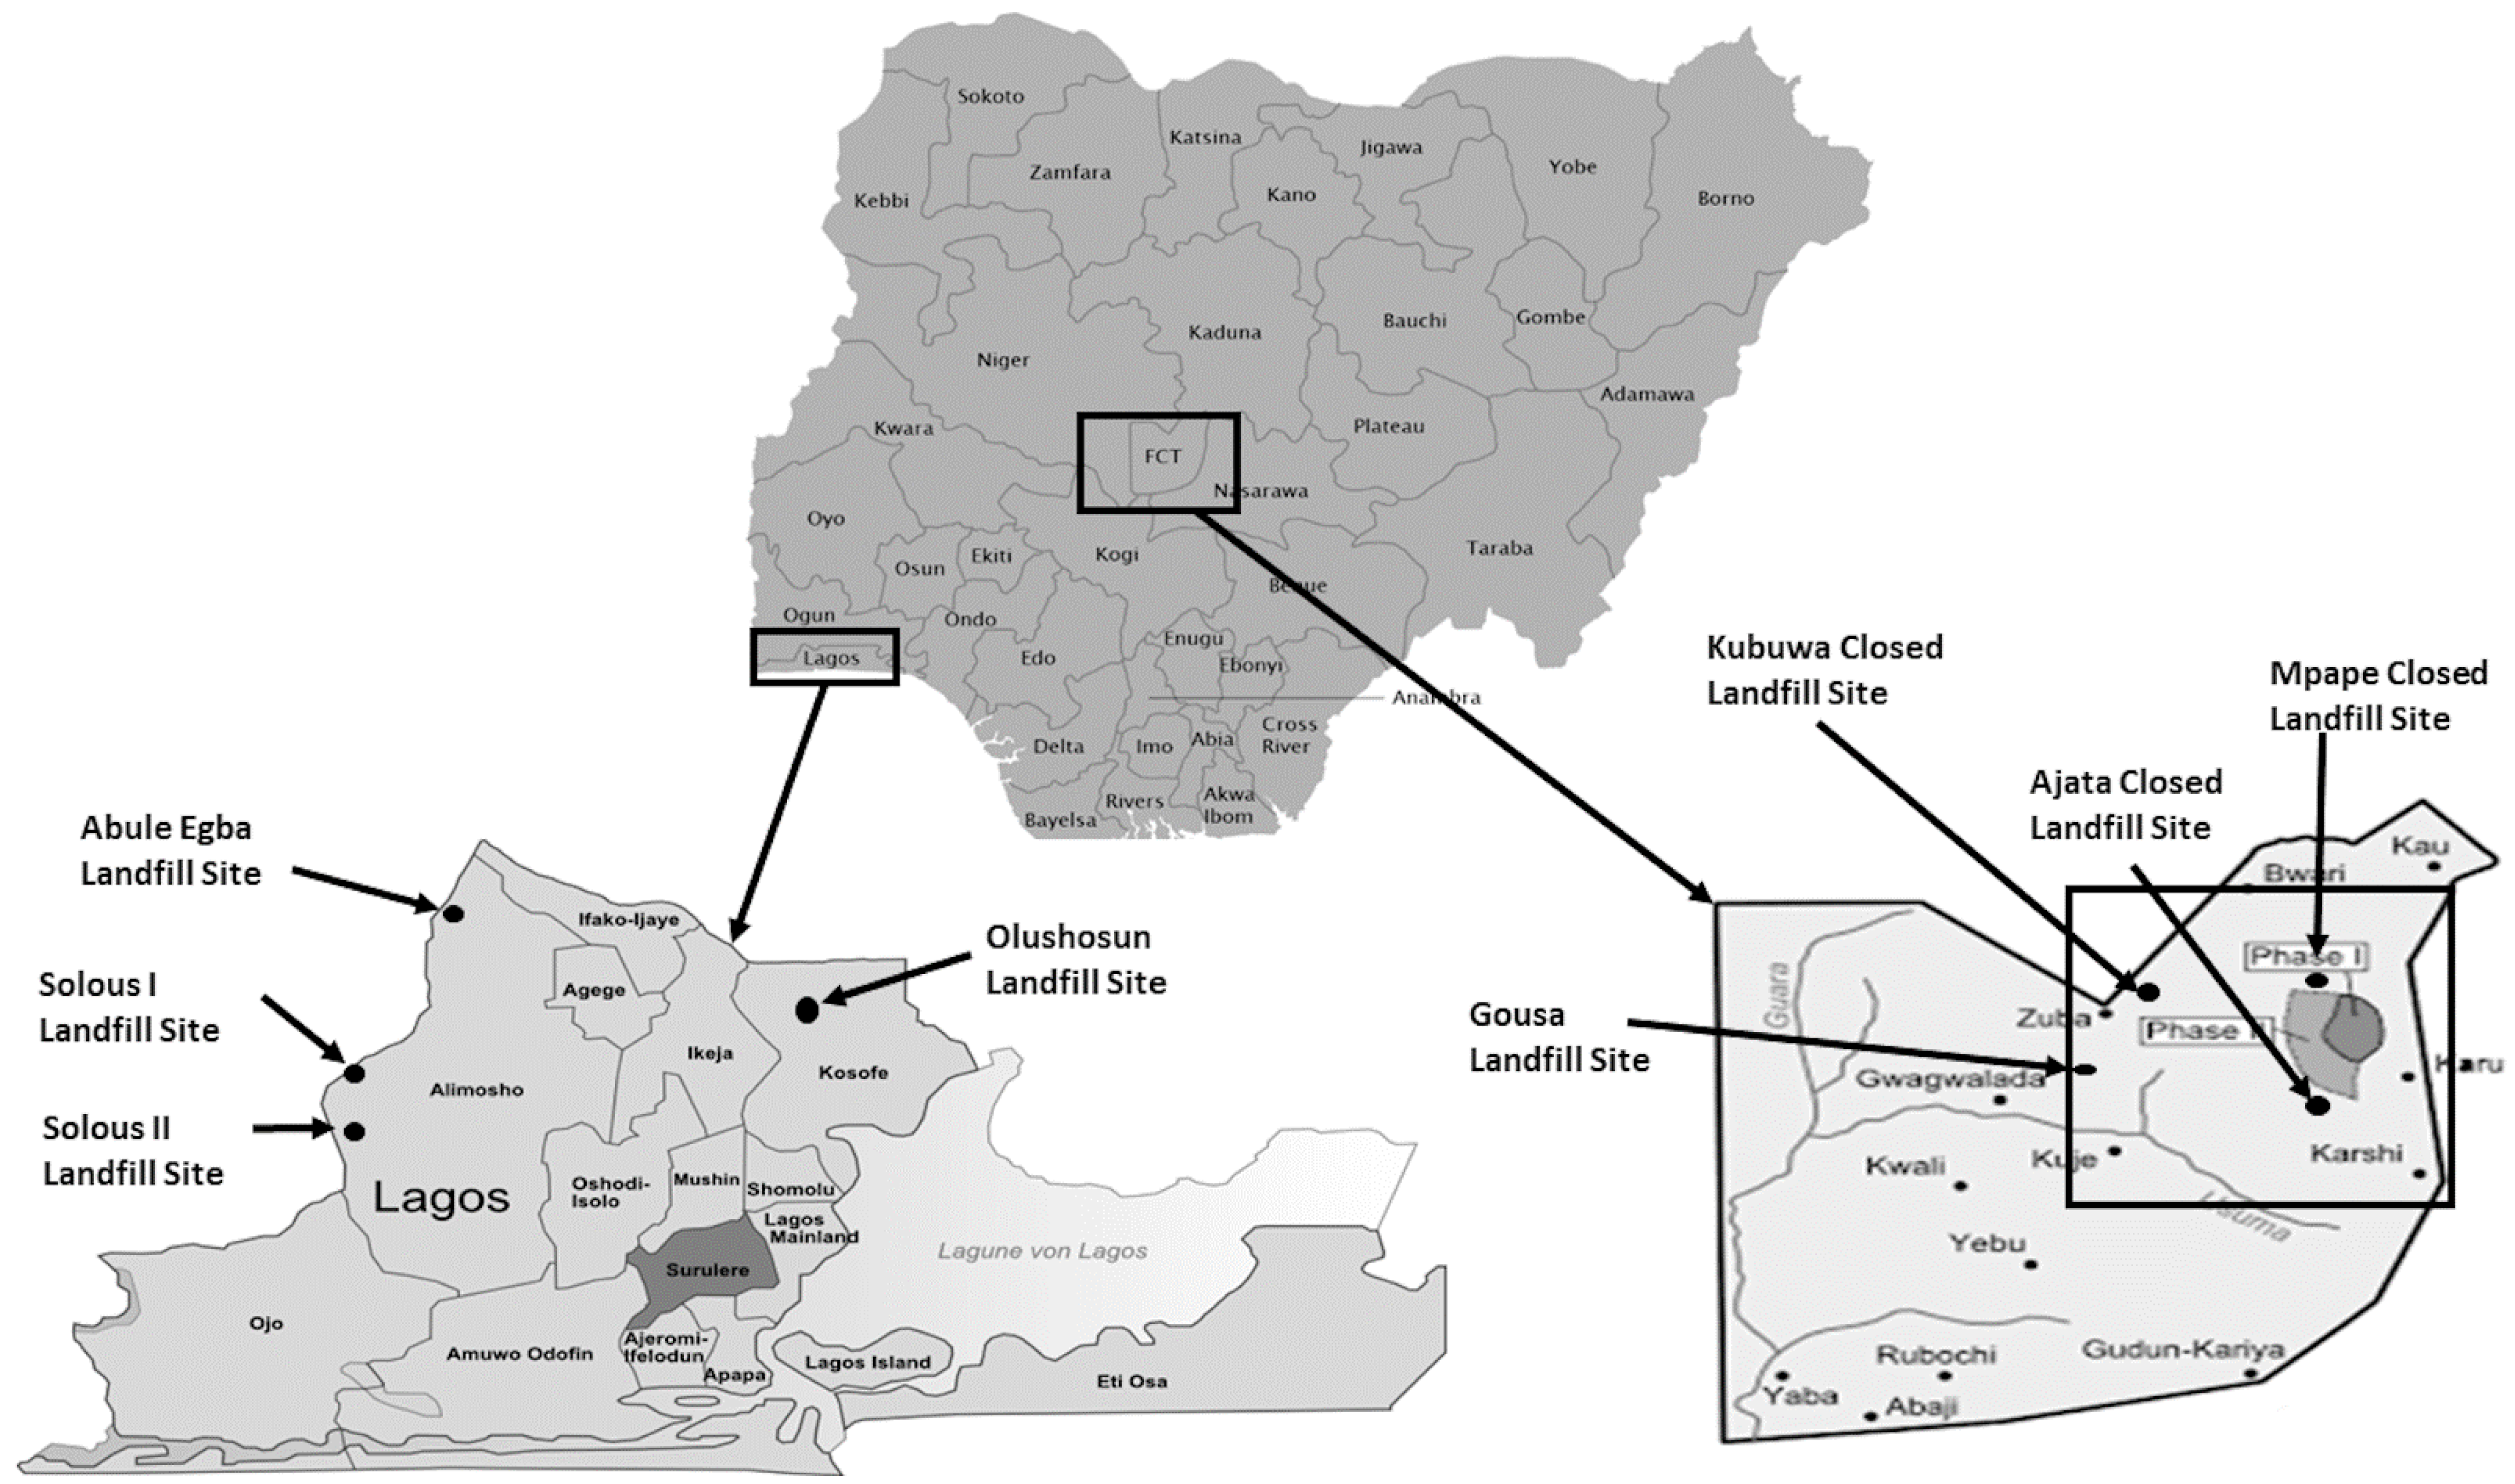
2.1. Lagos and Abuja
2.2. LCC
2.2.1. Goal and Scope Definition and Functional Unit
2.2.2. Inventory Analysis
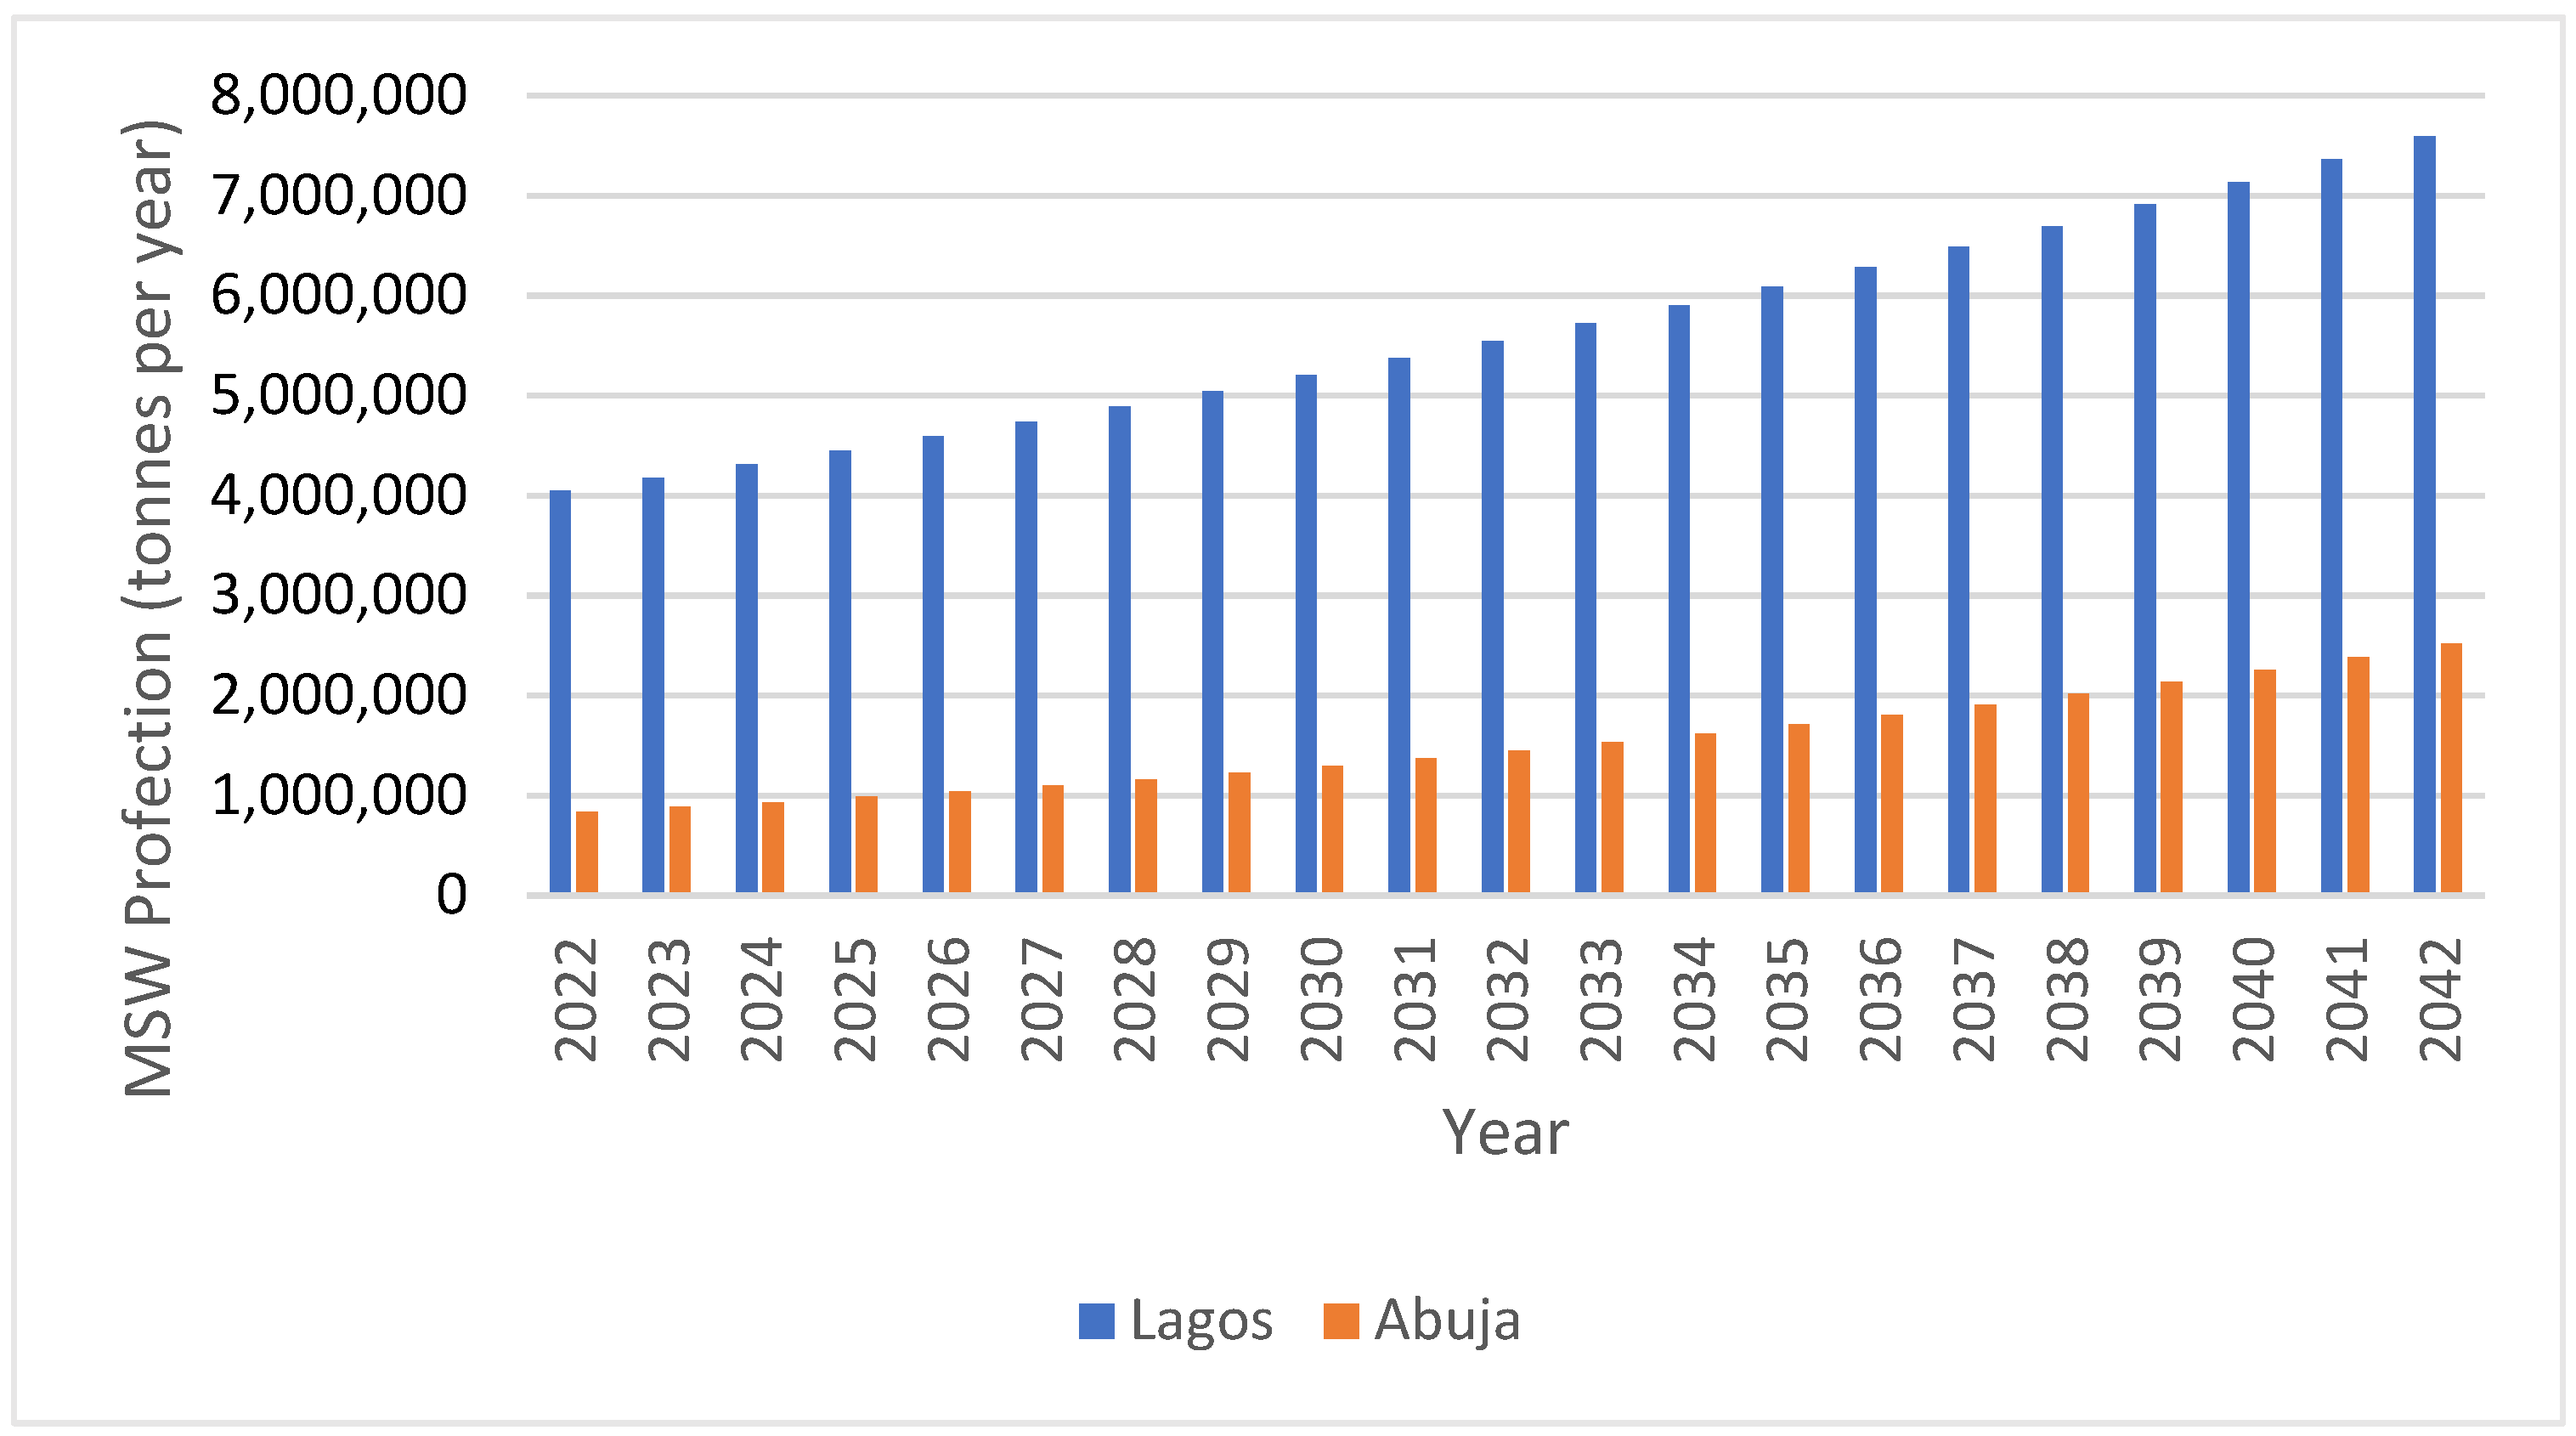
2.2.3. Population and MSW Growth and Electricity Generation Potential
- A methane correction factor (MCF) of 0.6 was employed as the landfills in Lagos and Abuja were considered to be unmanaged.
- The fraction of degradable organic carbon dissimilated (DOCF) was taken to be 0.77.
- The oxidation factor (OX) was assumed to be zero.
- The fraction of MSW disposed at landfill (MSWF) was taken to be 100%.
- The fraction by volume of CH4 in landfill gas (F) was assumed to be 50%.
- Recovered methane (R) was assumed to be zero.
2.2.4. Economic Evaluation of WtE Systems
2.2.5. Cost Structure for WtE Systems
2.2.6. Interpretation
3. Results
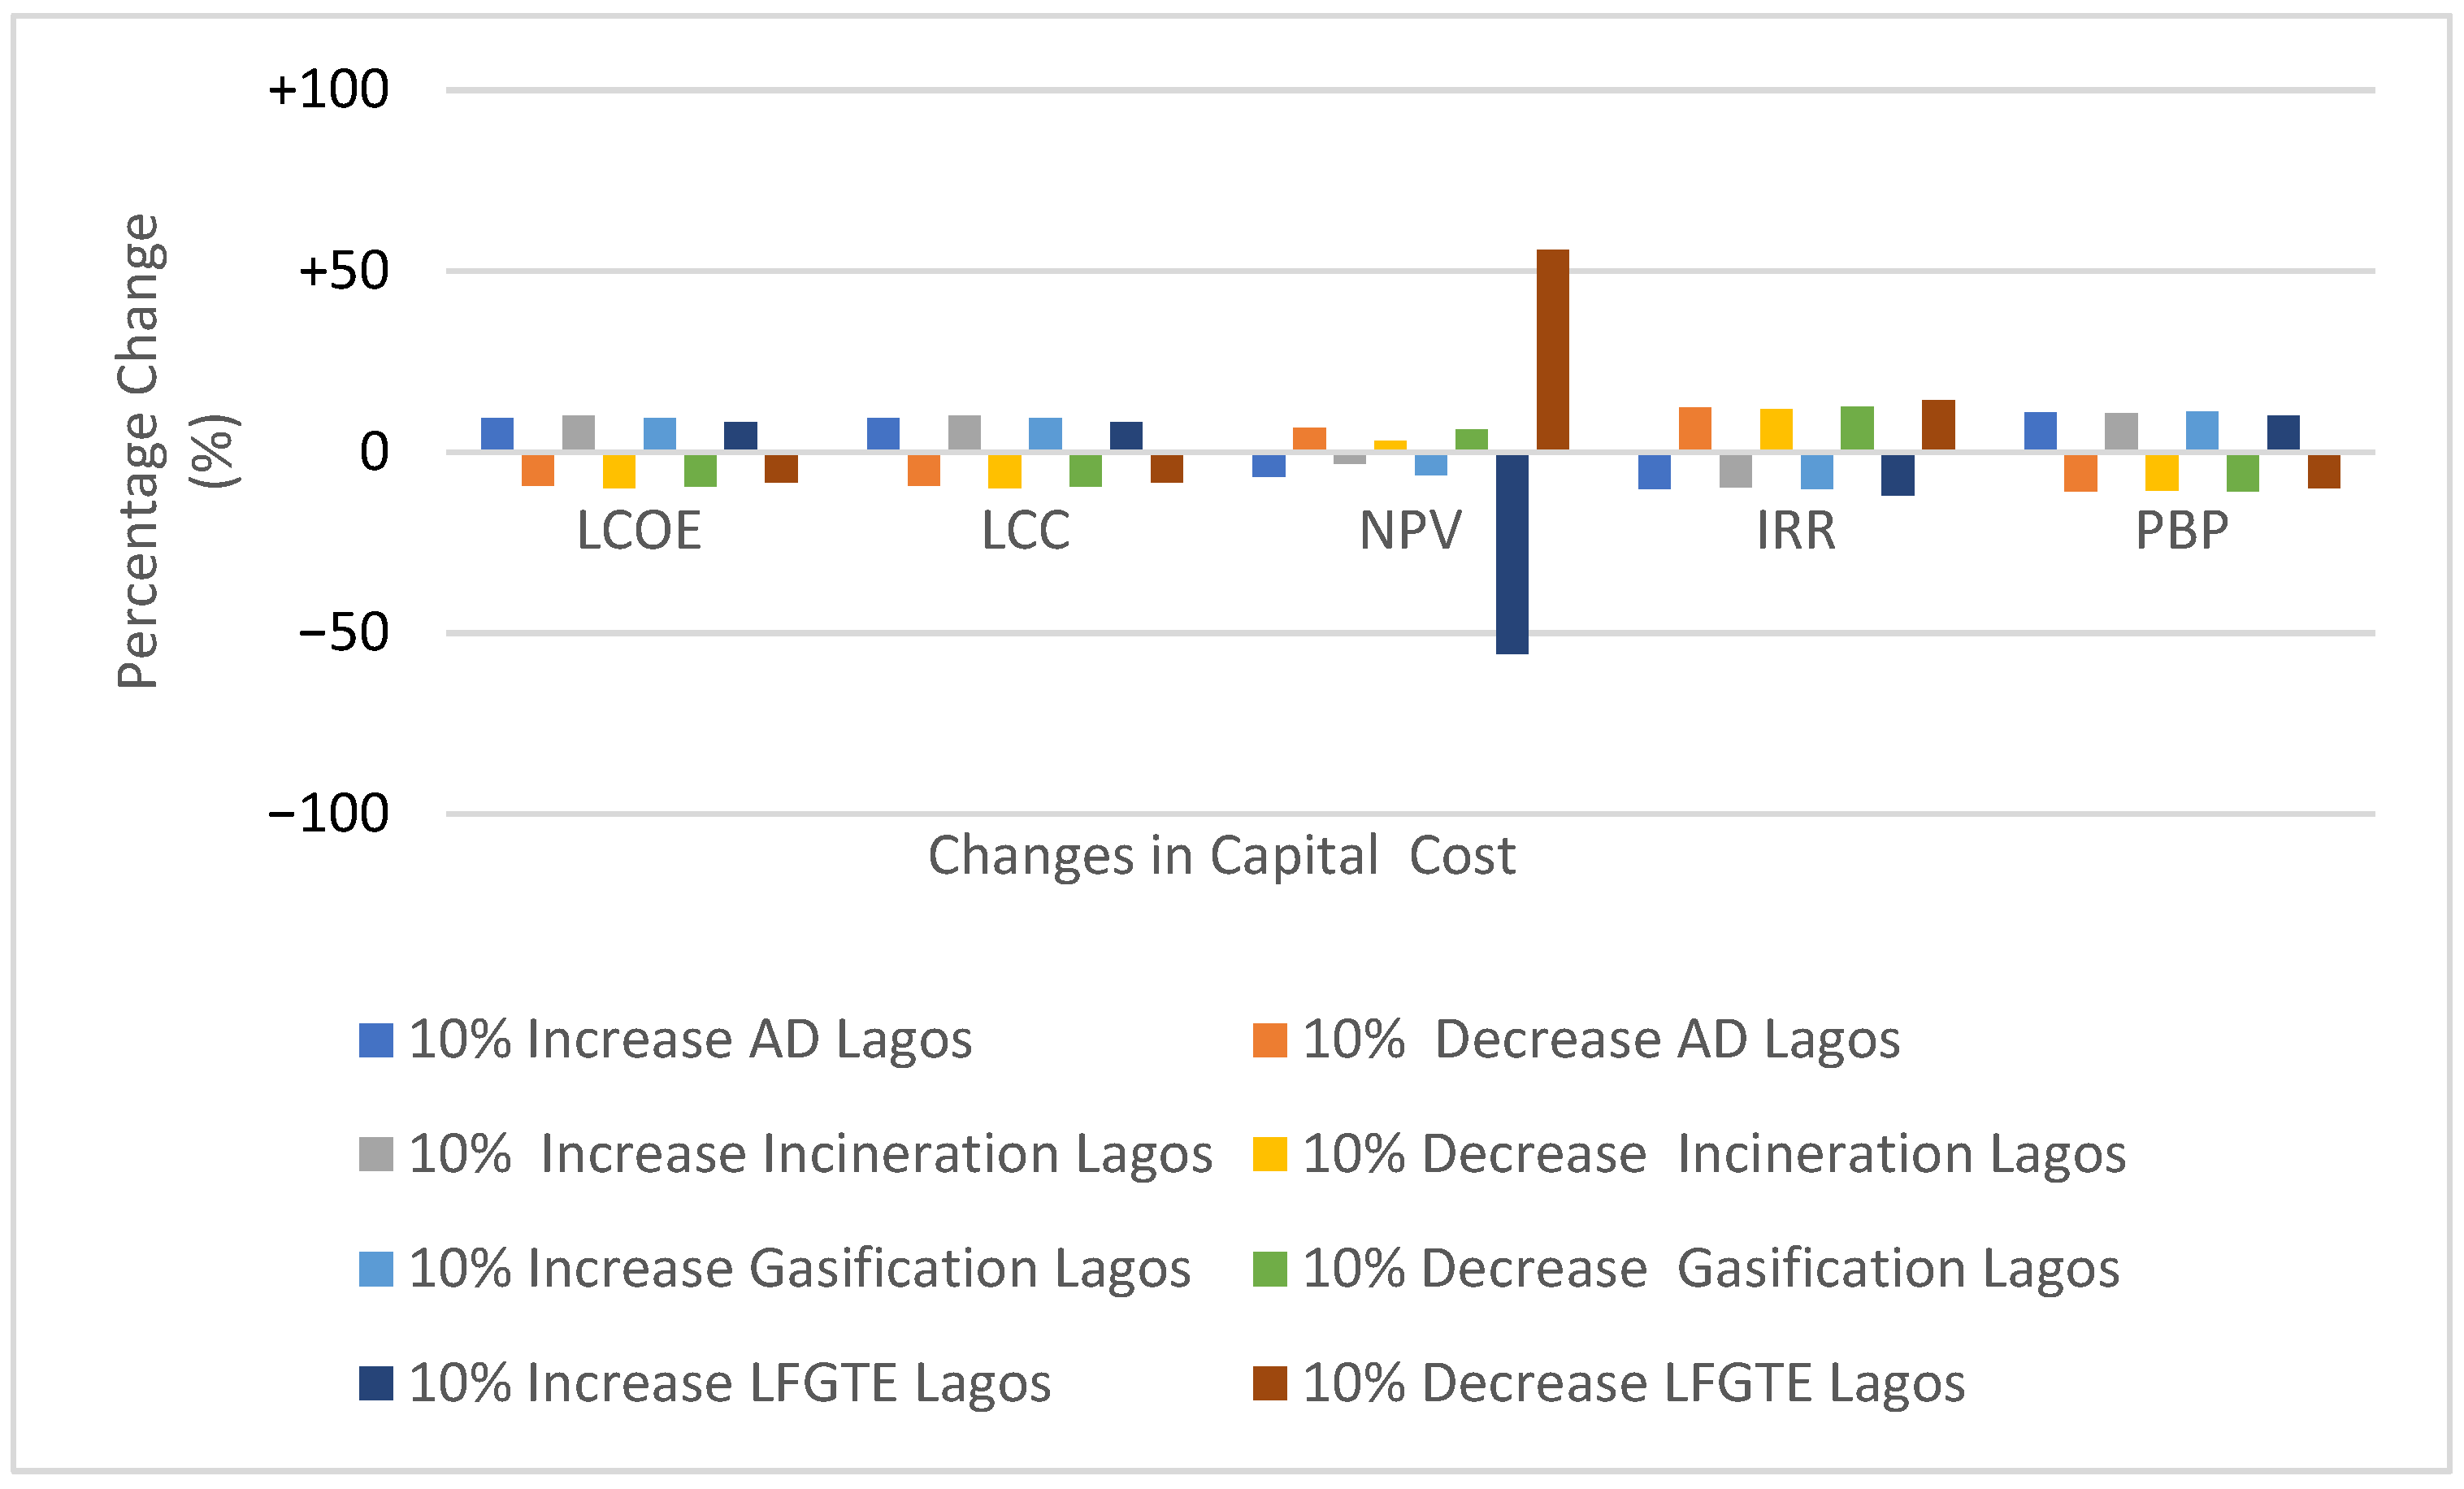
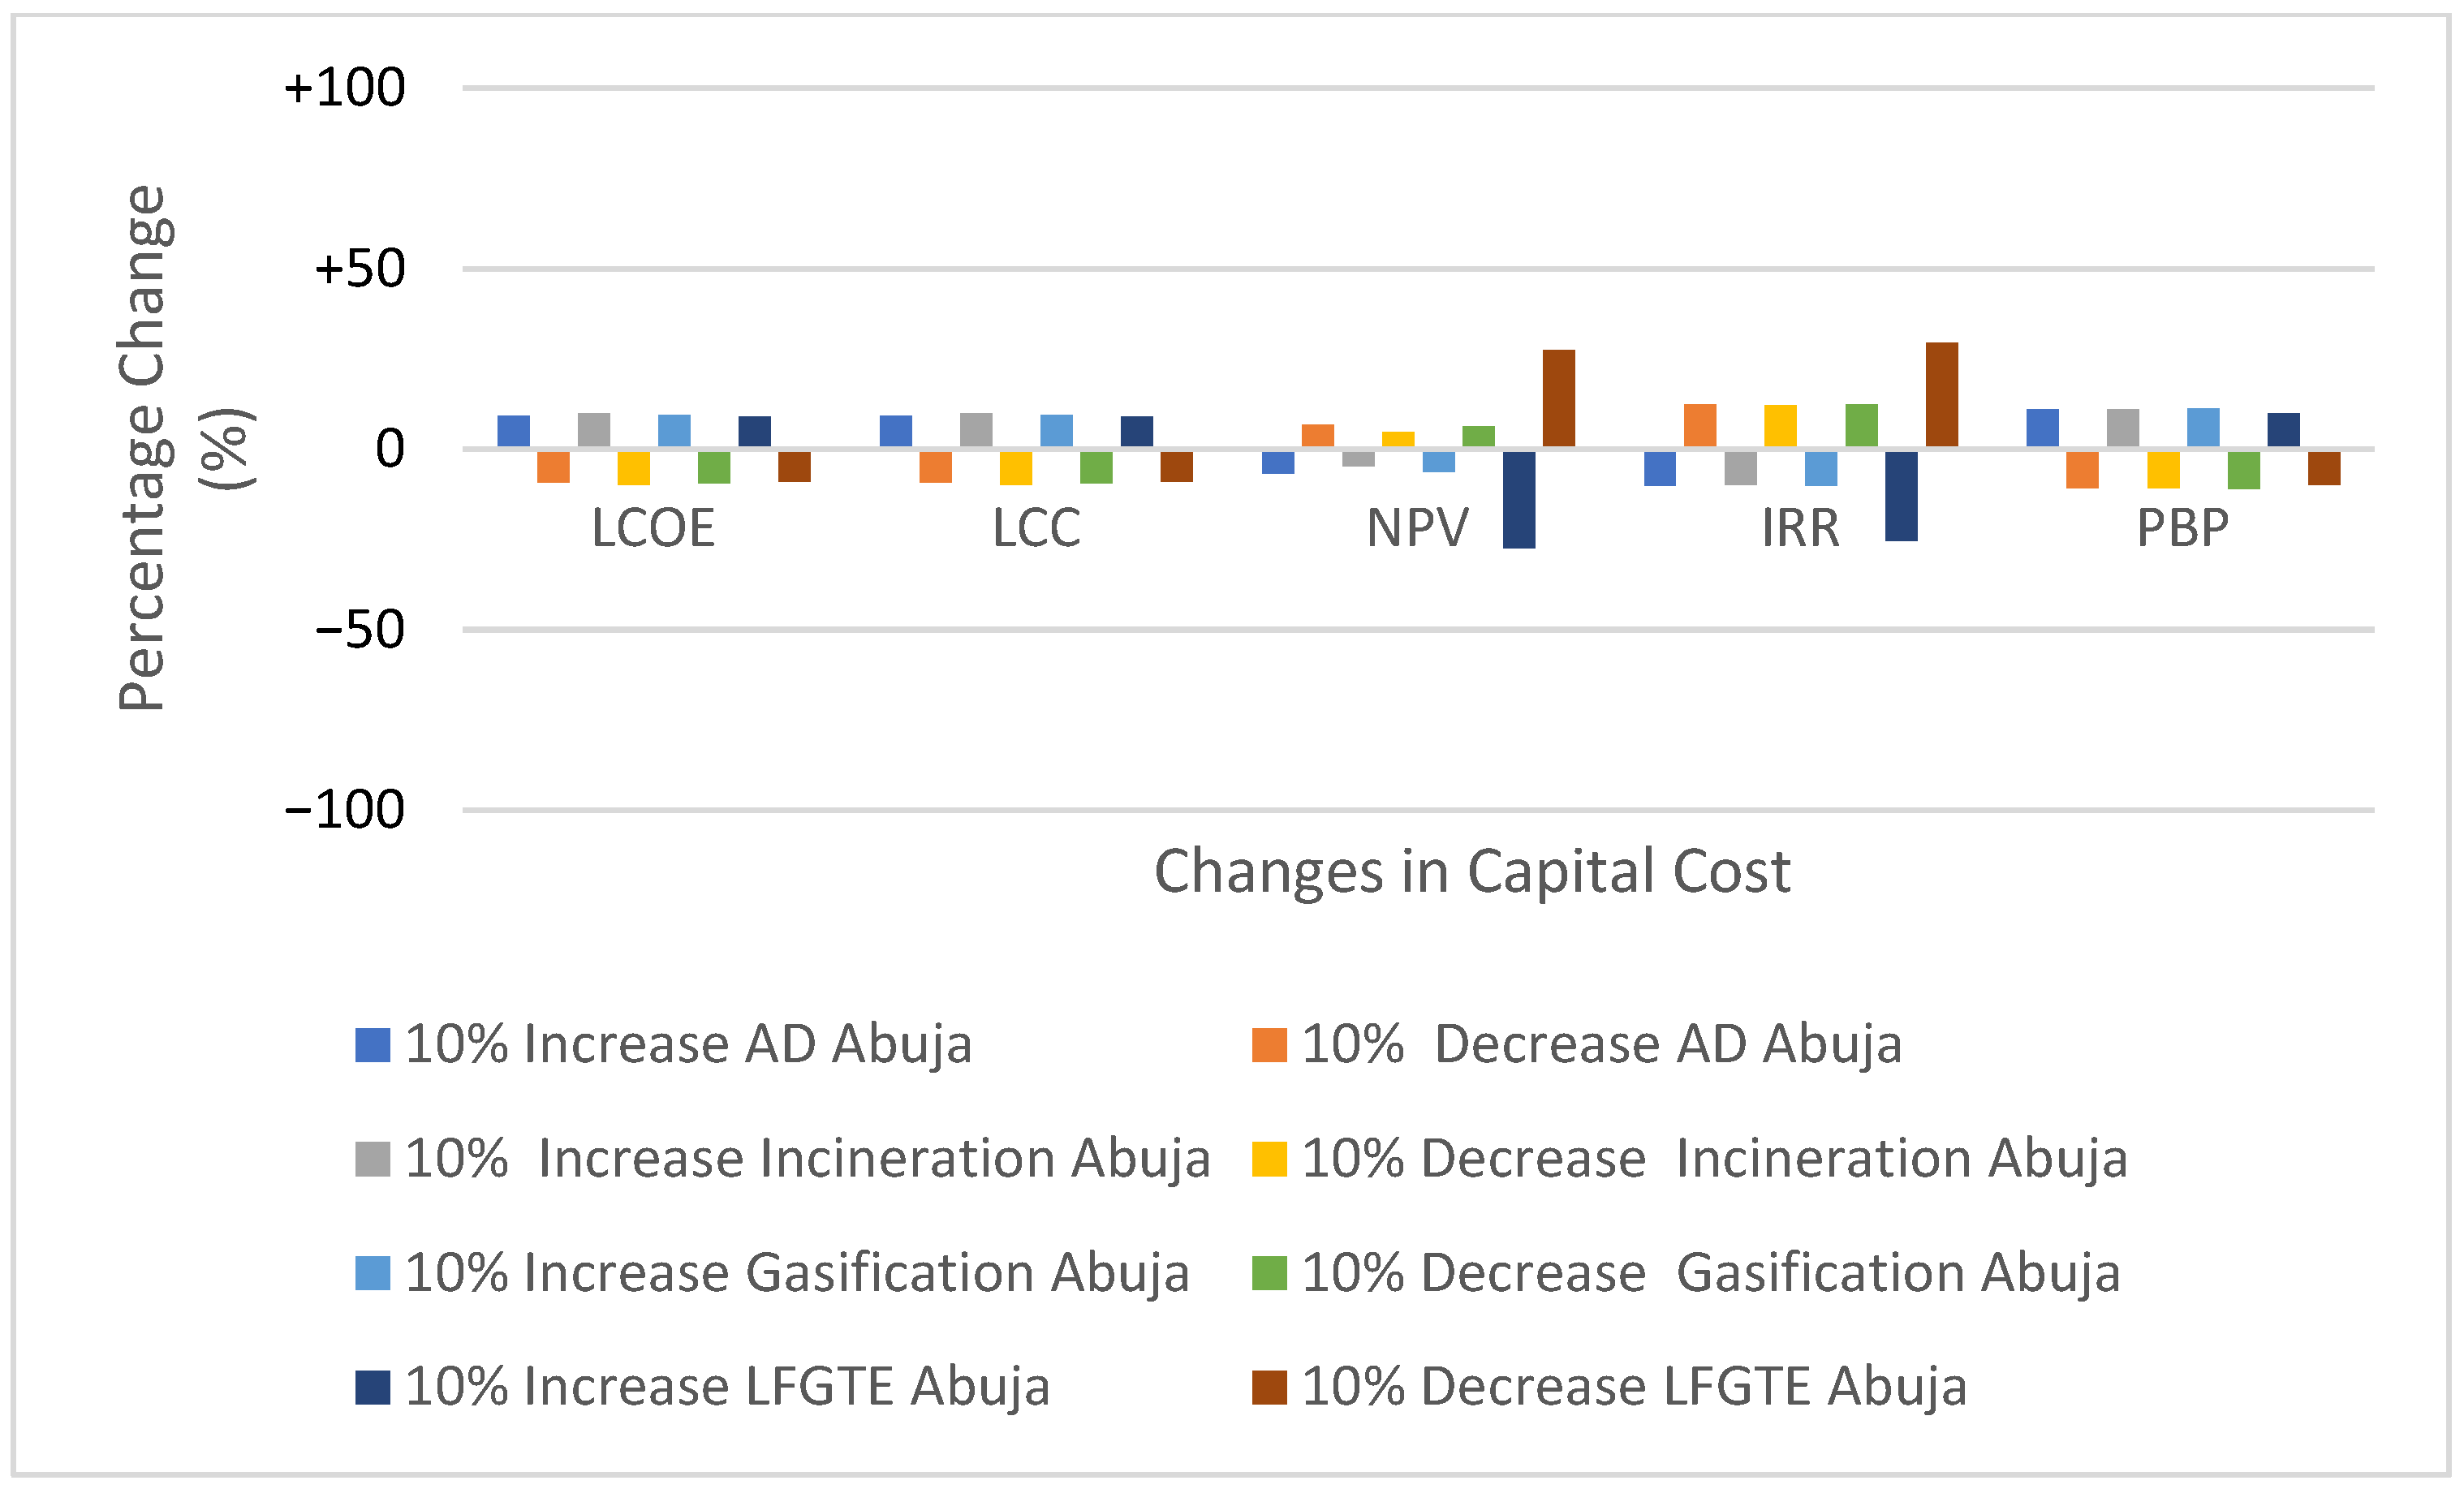
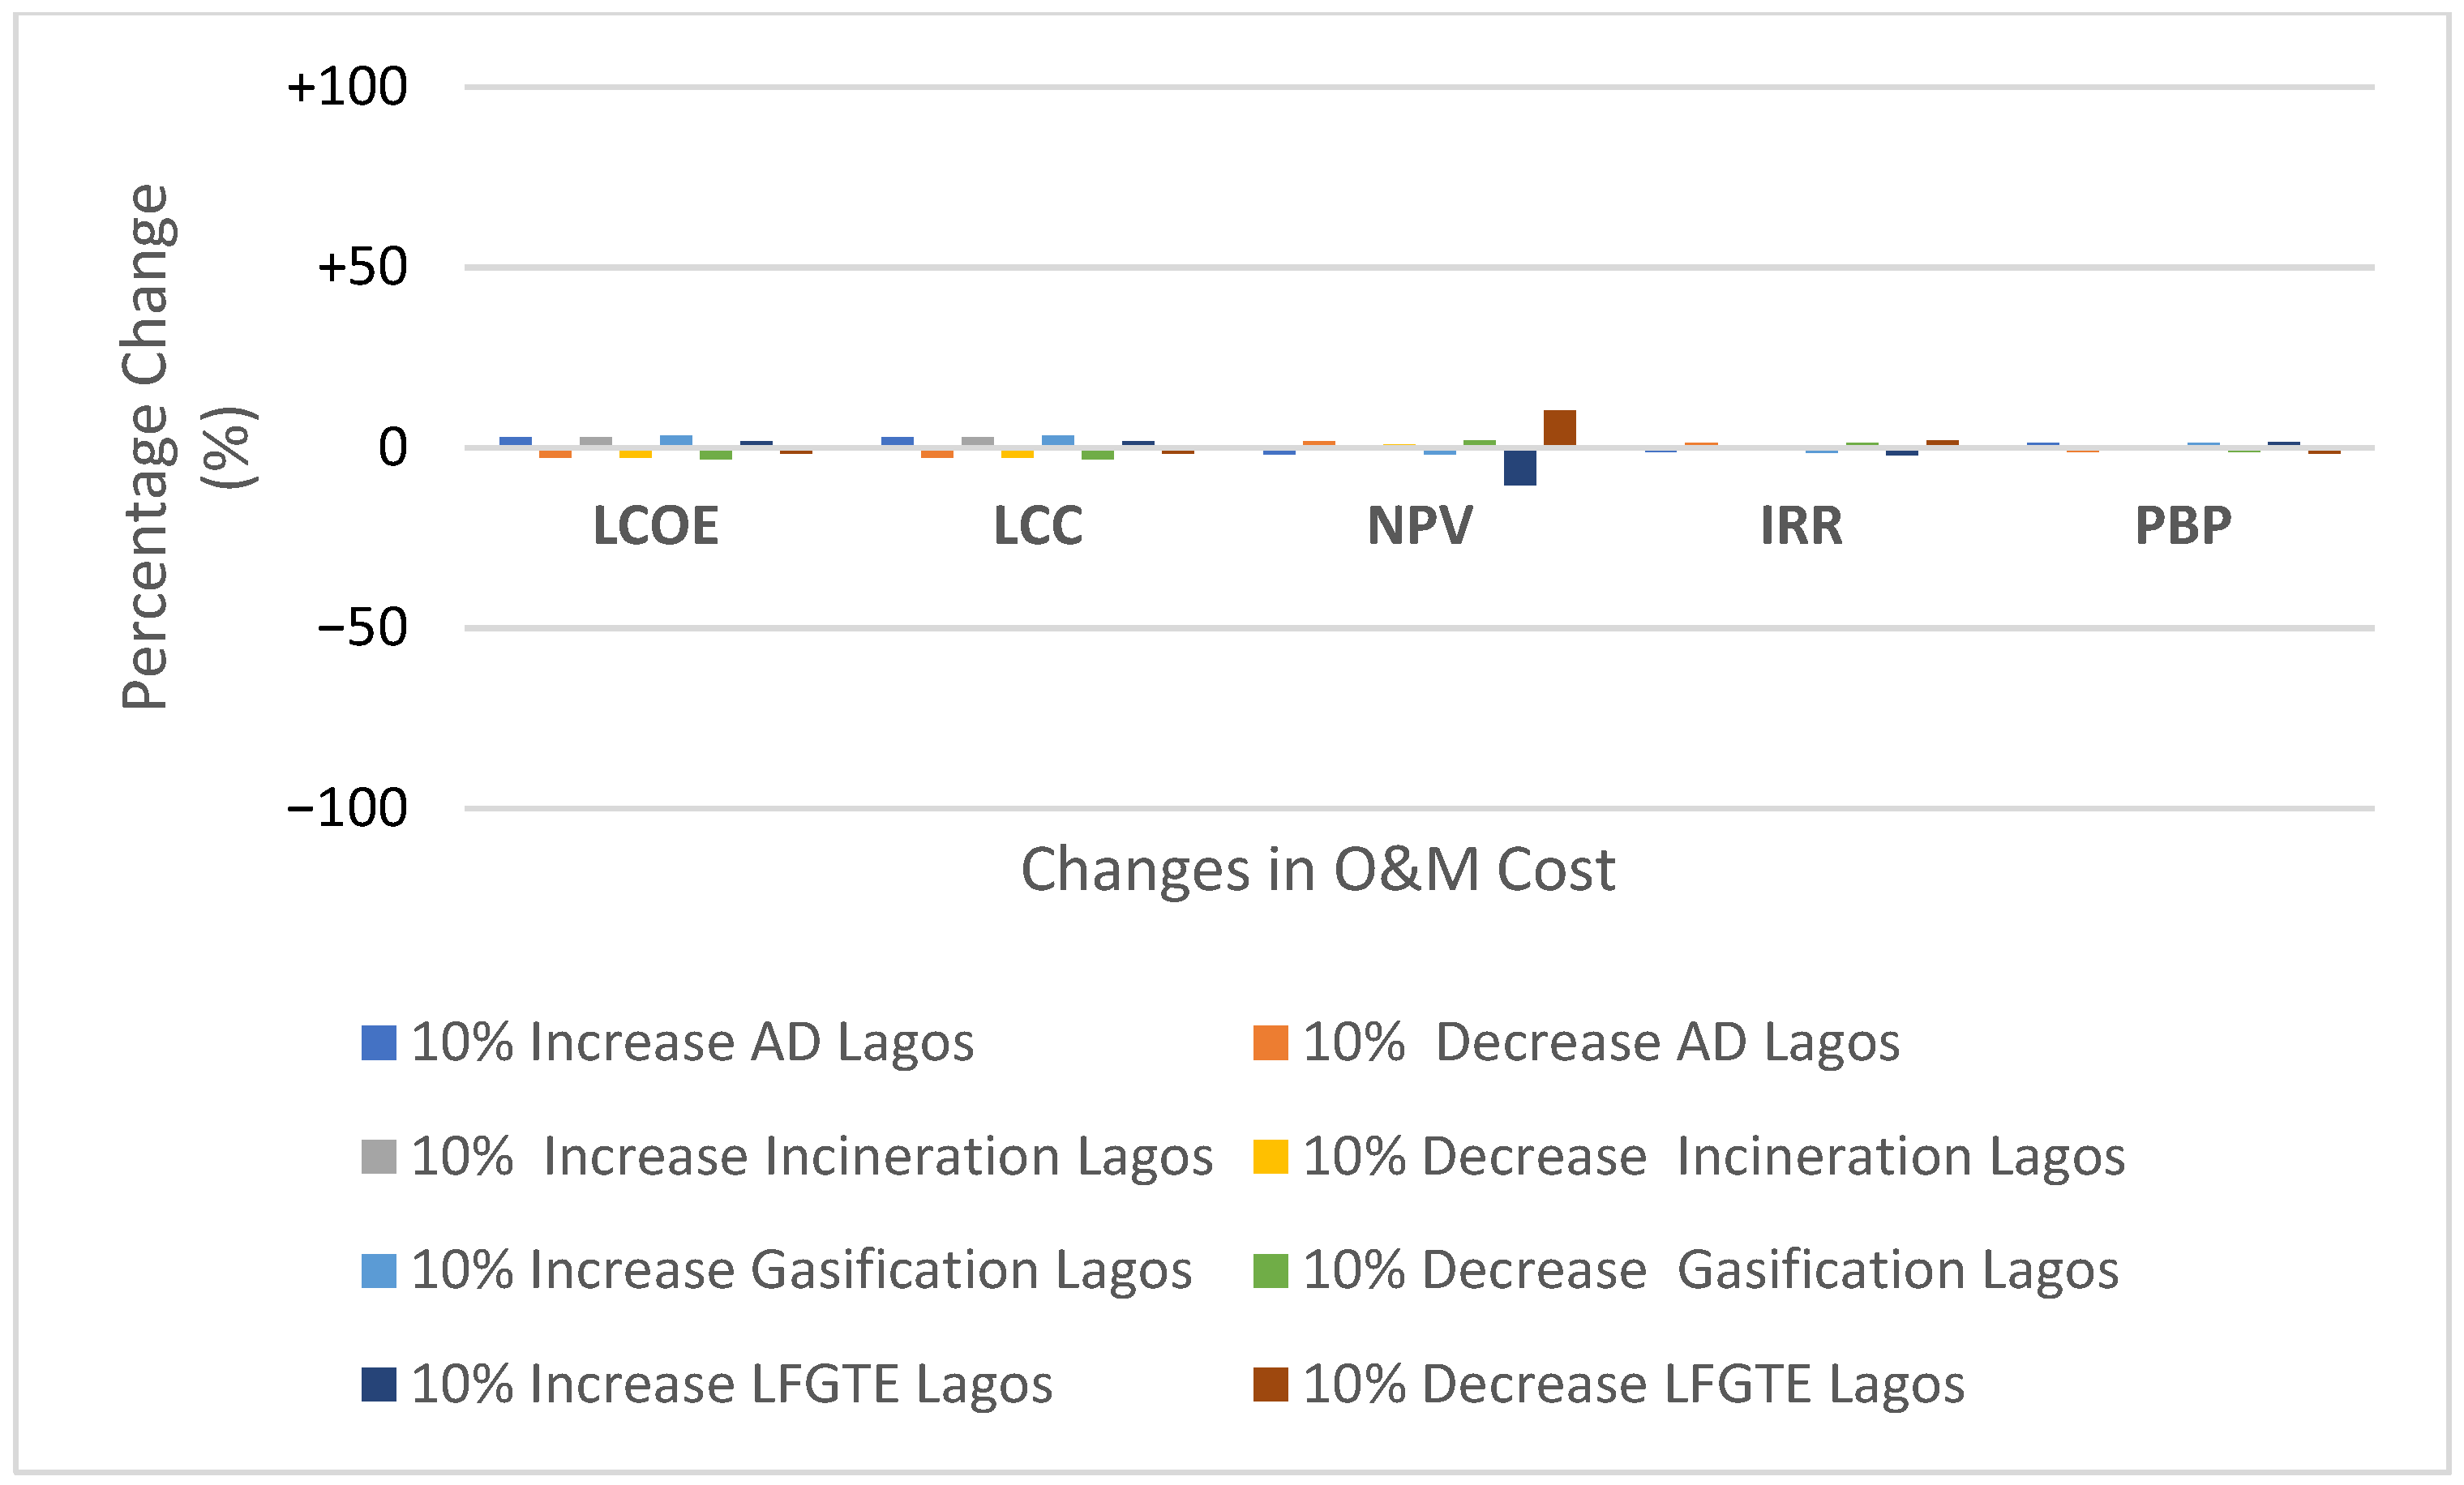
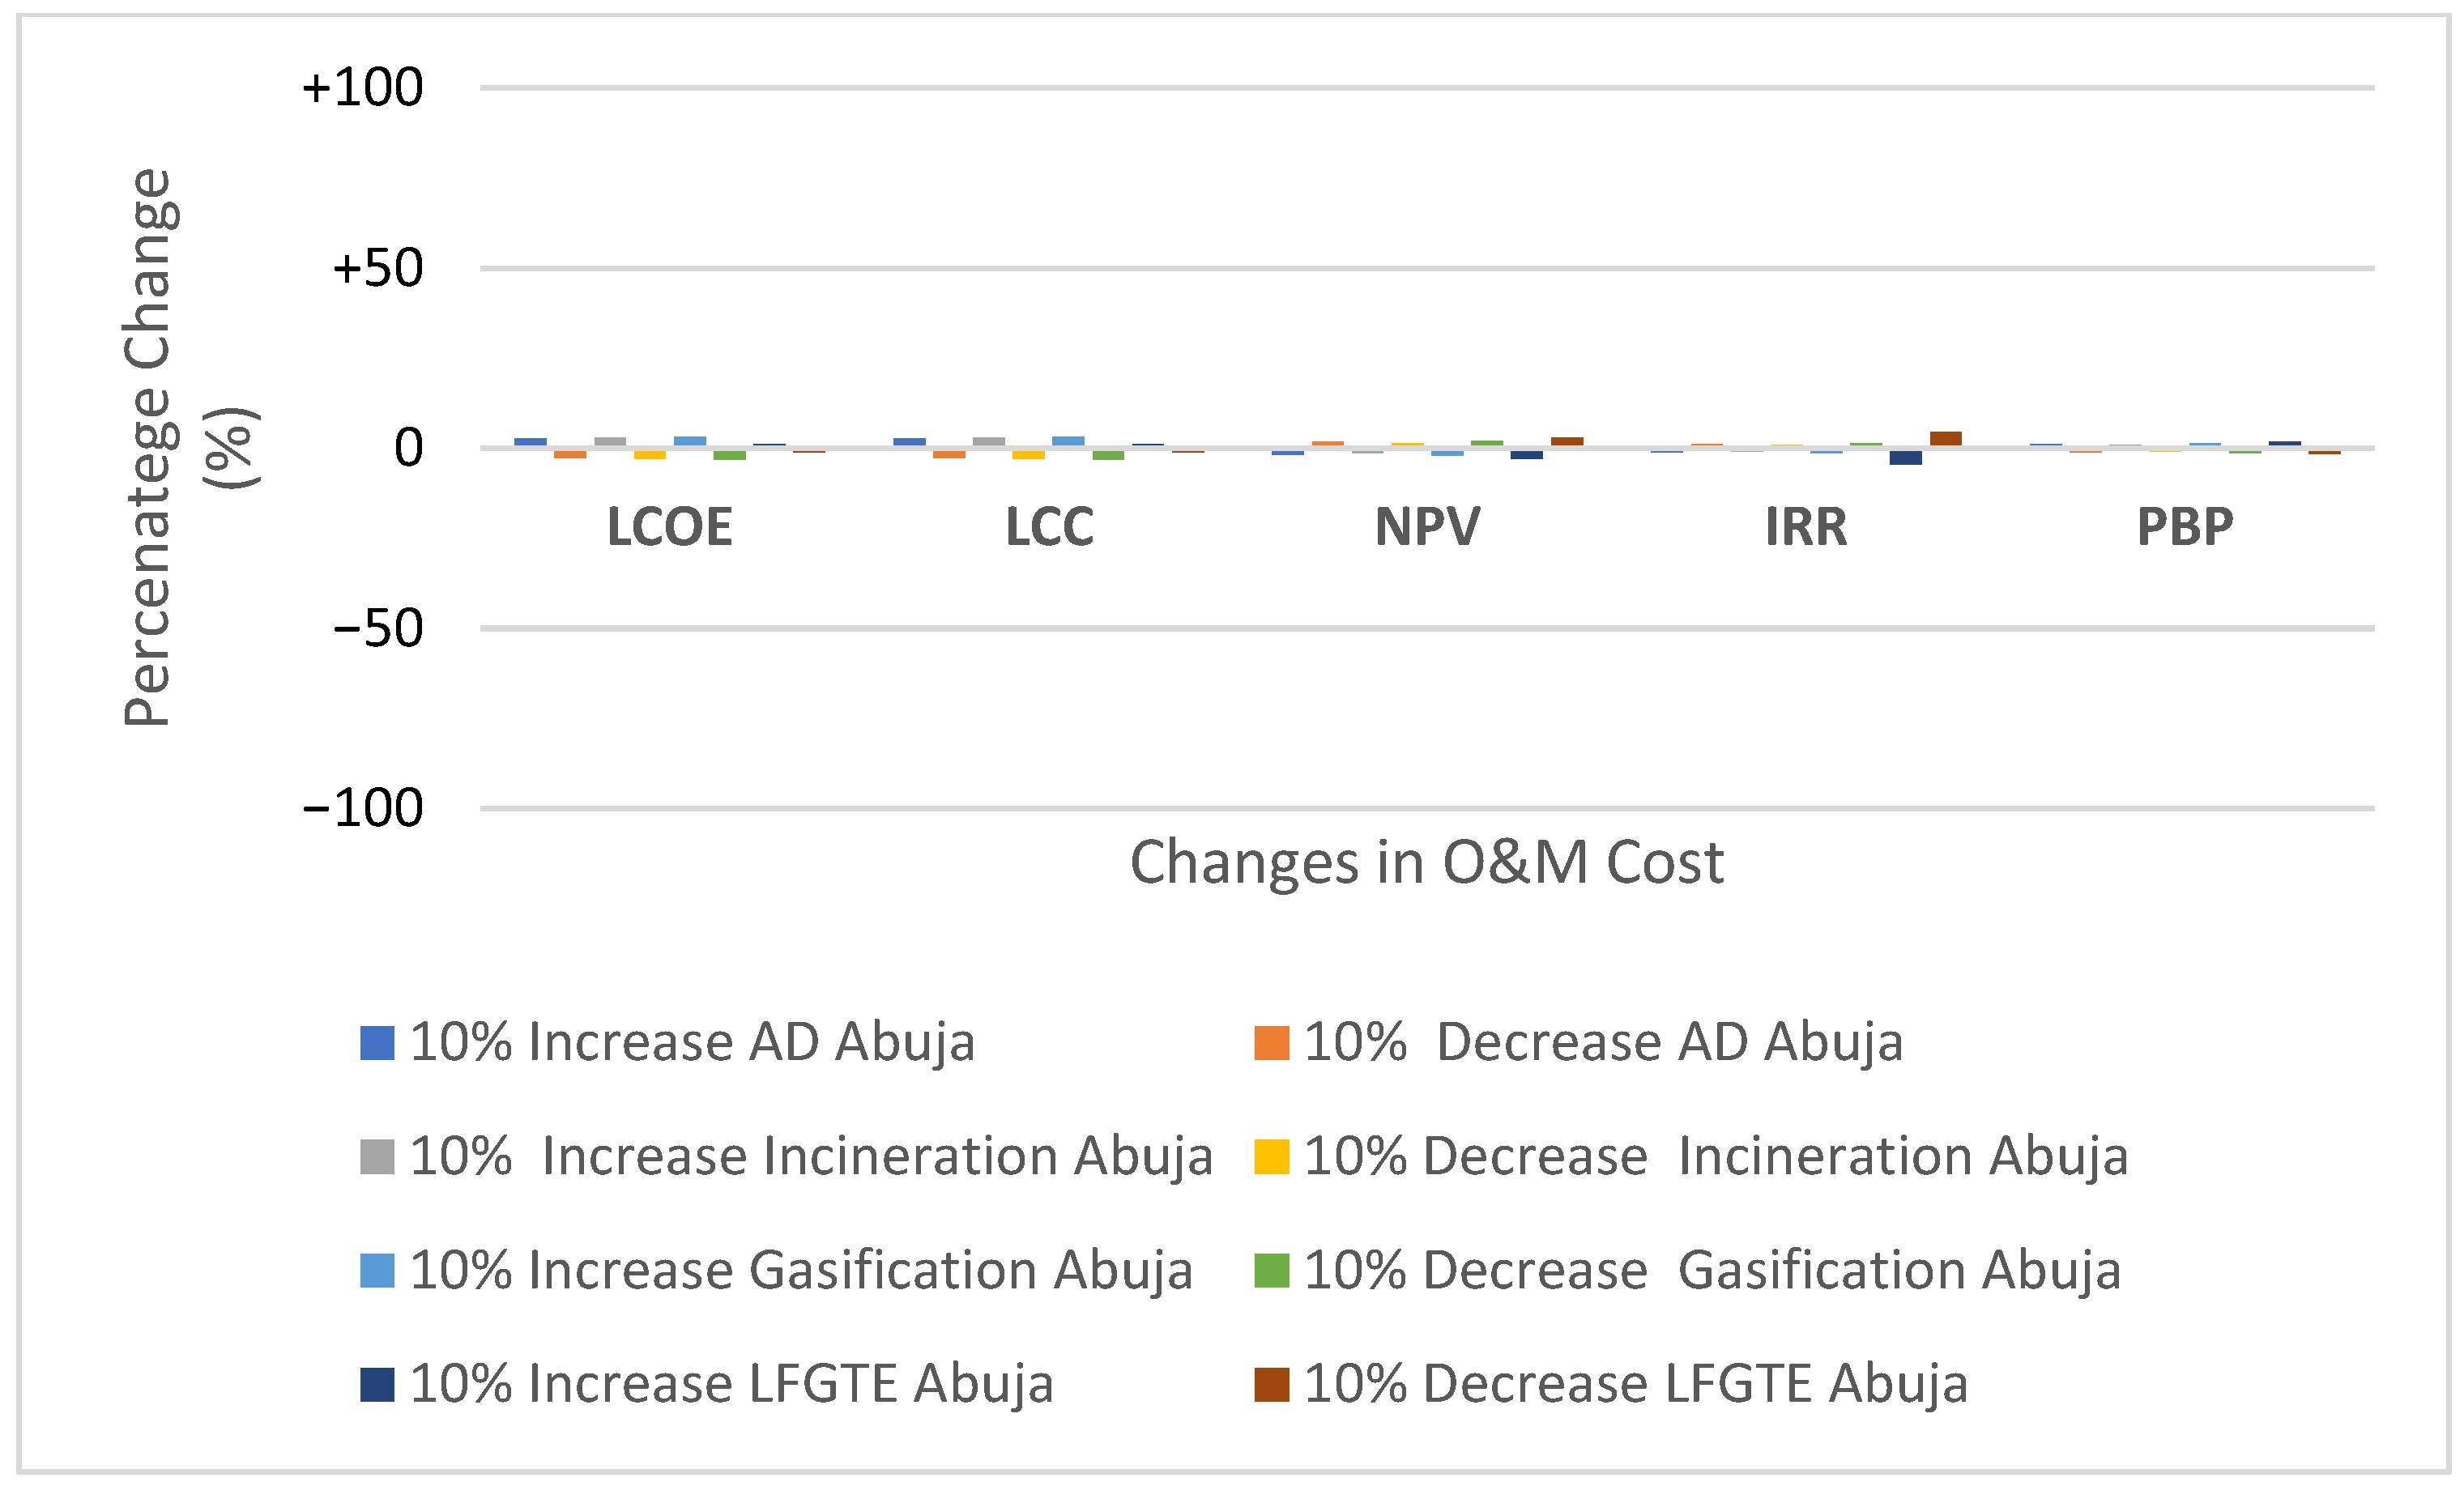
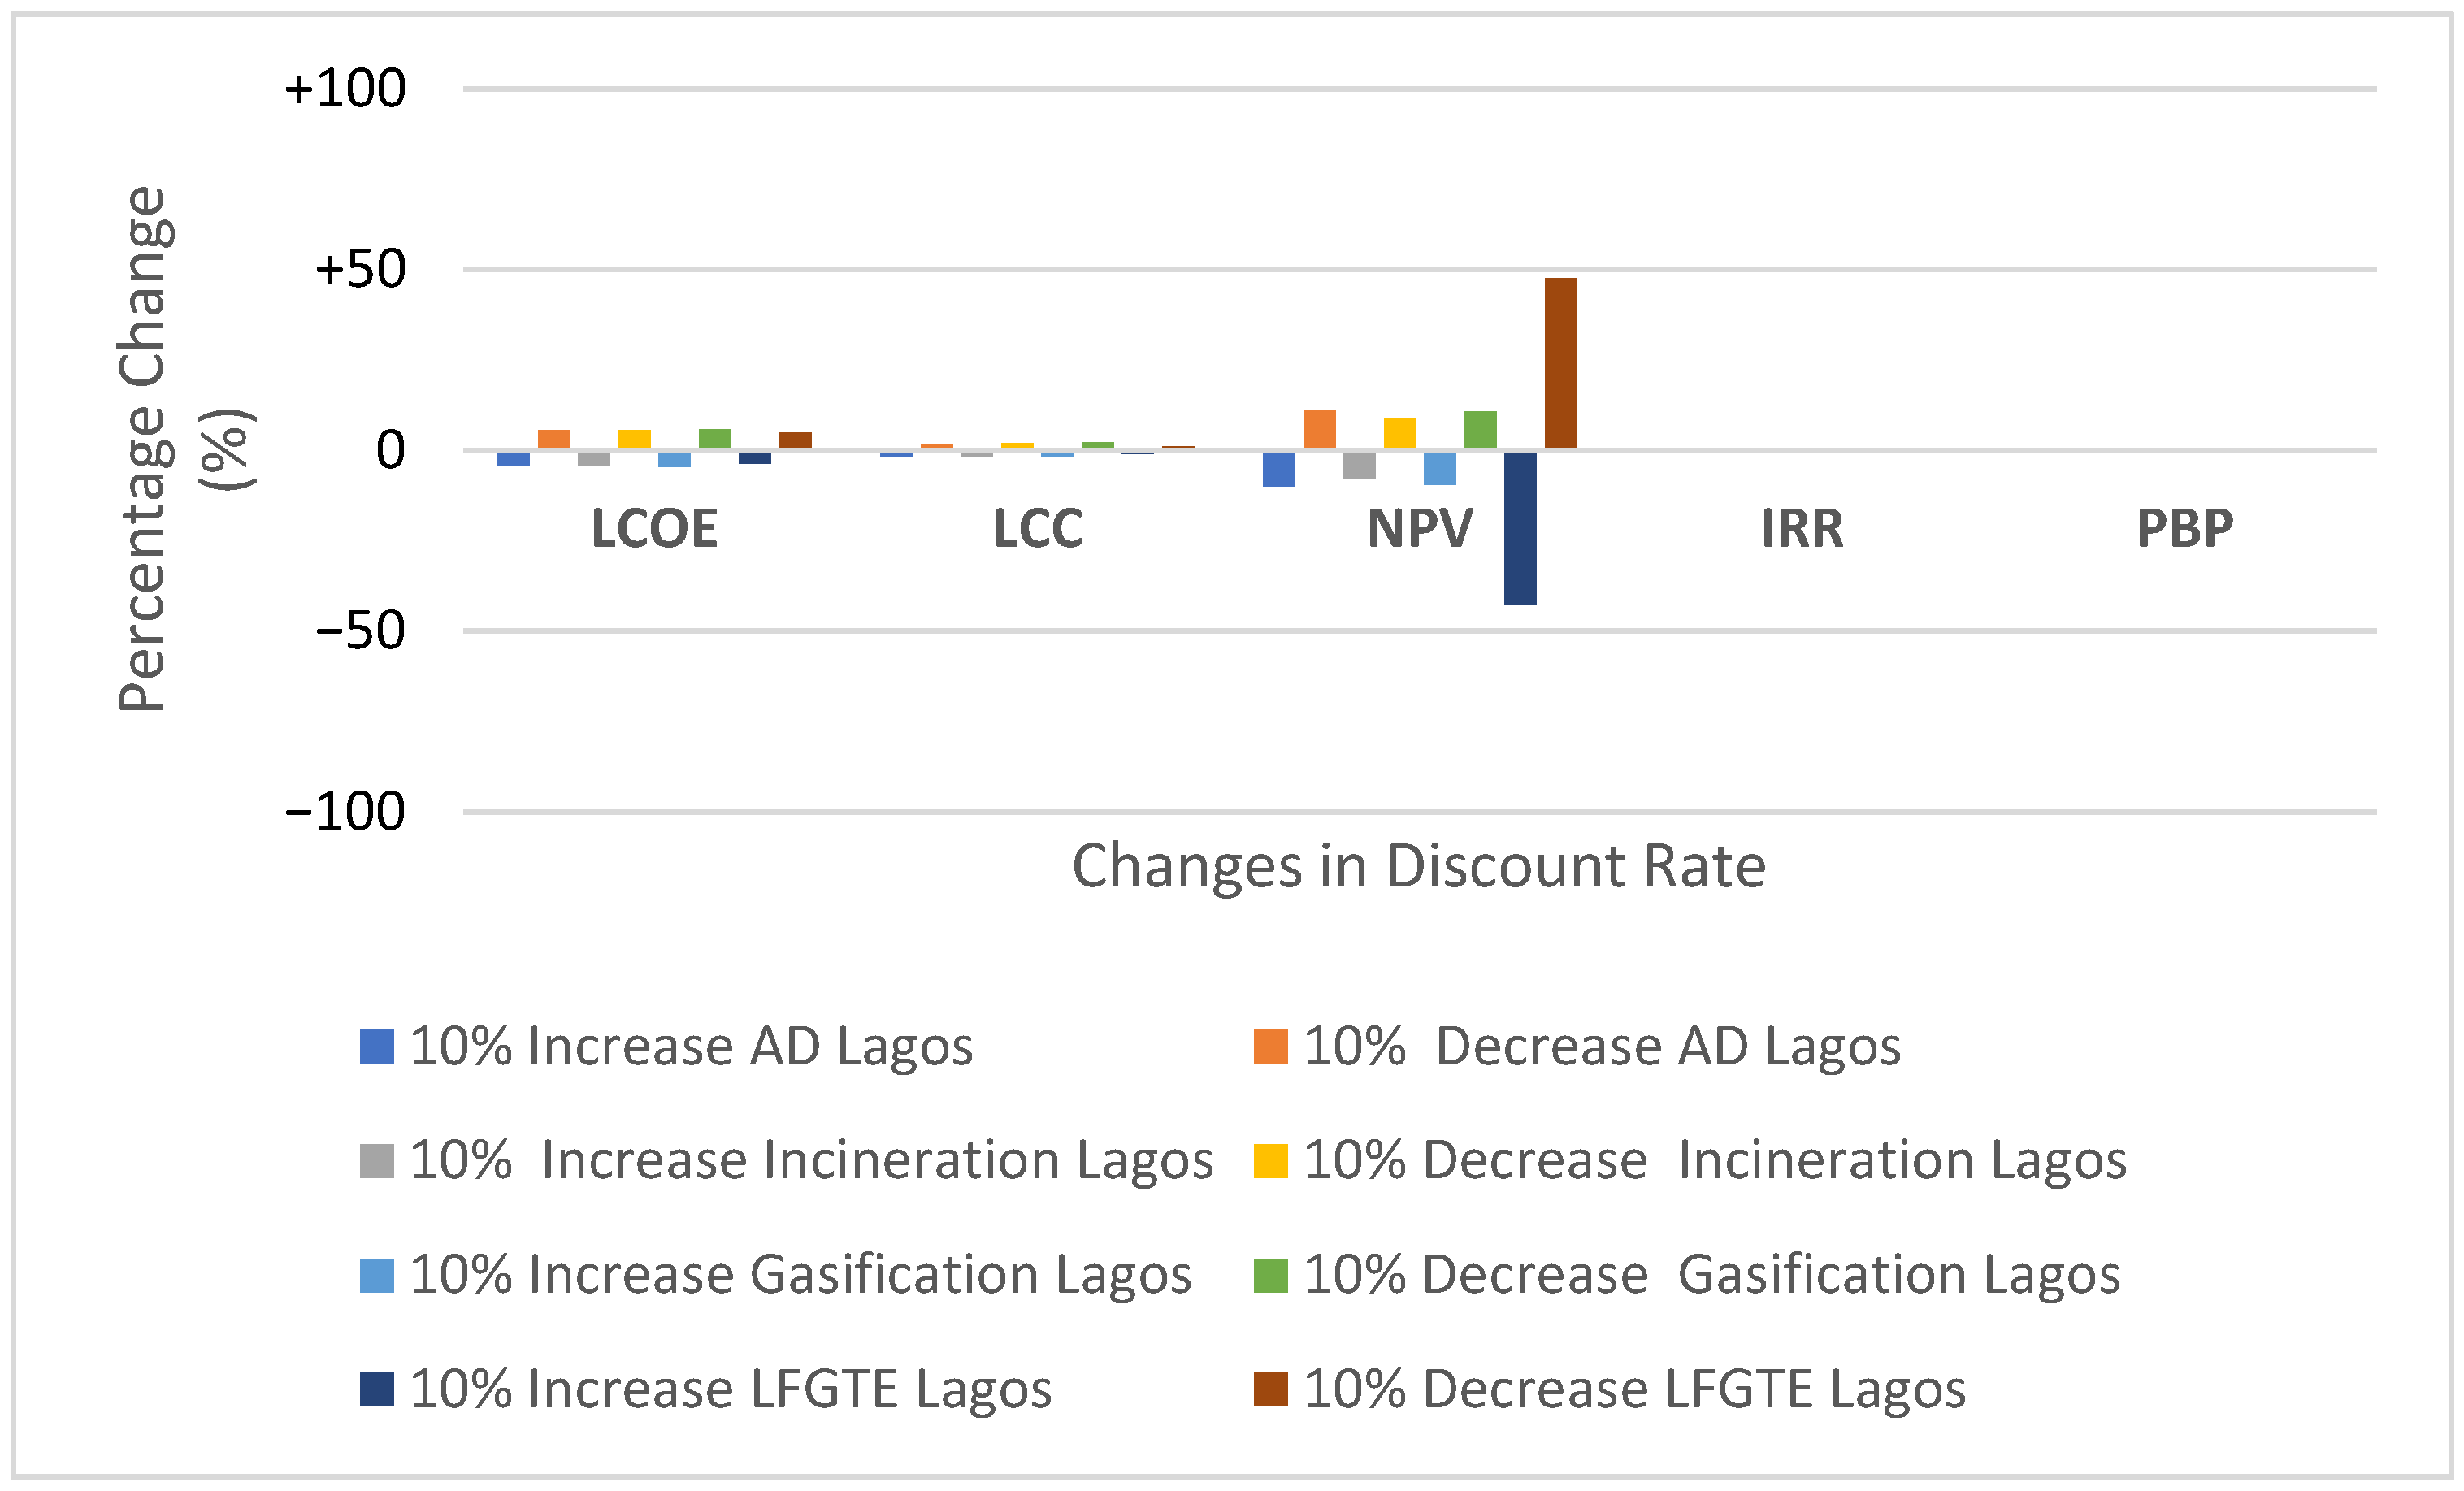
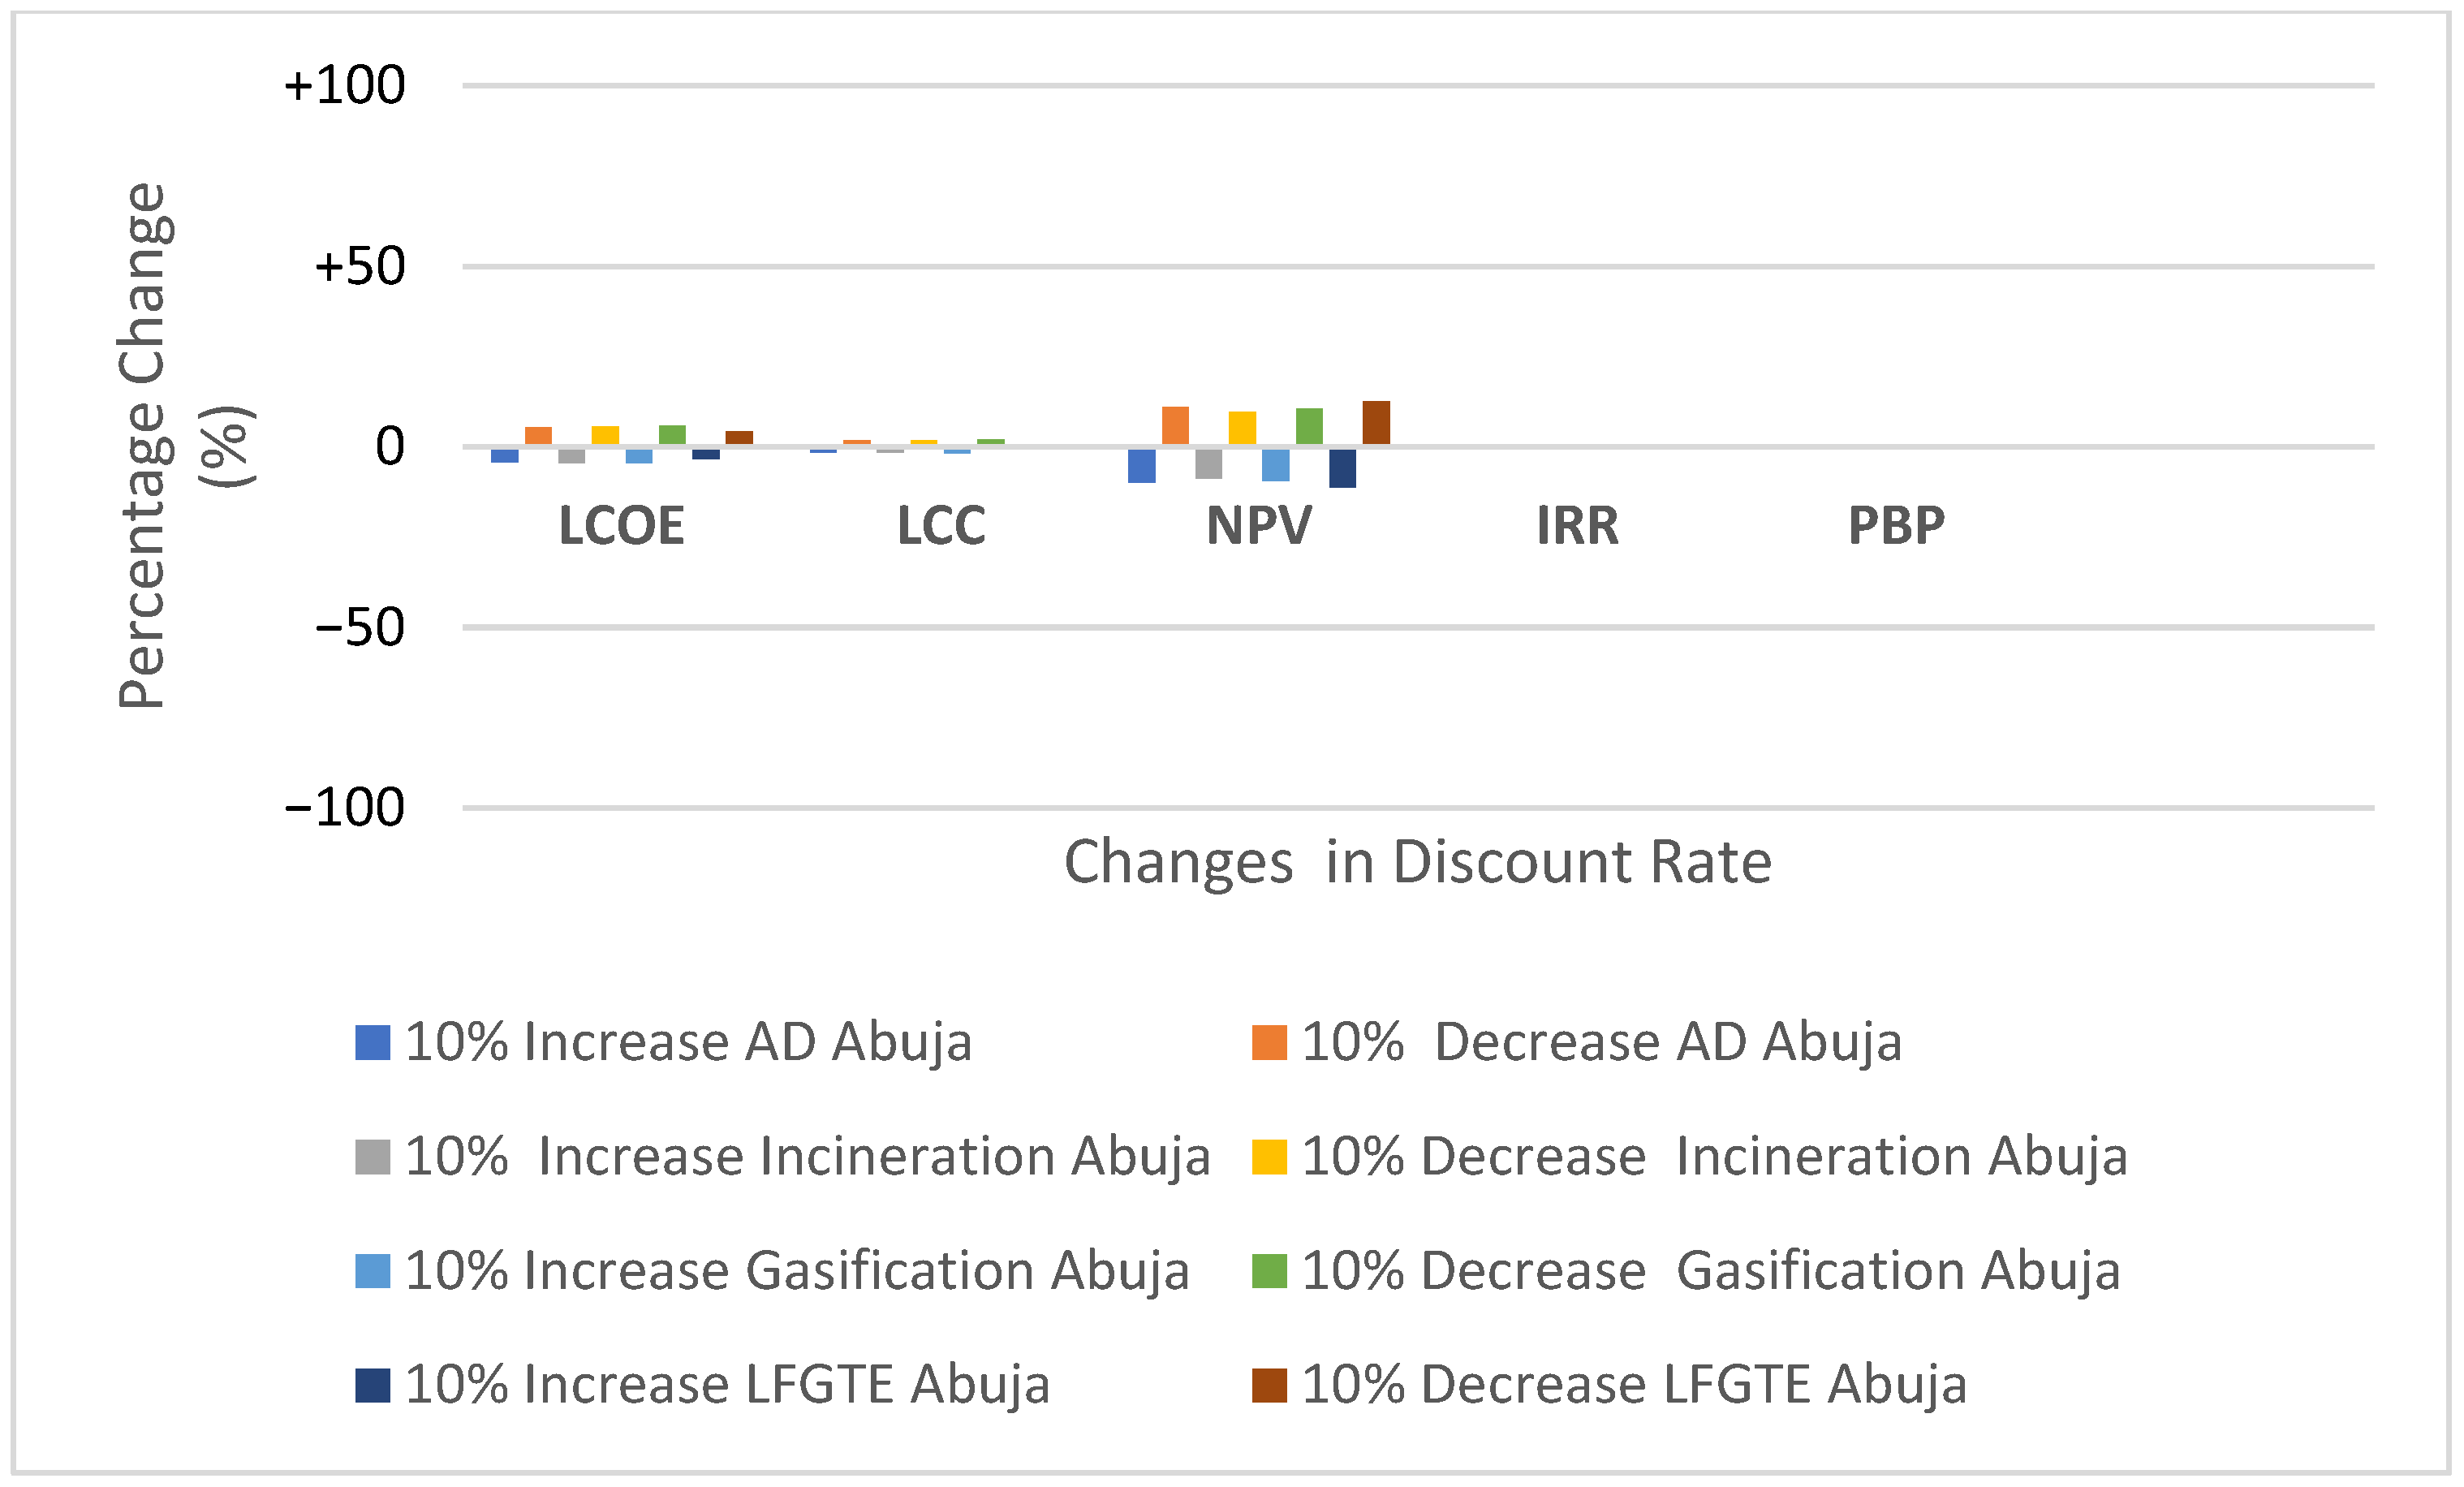
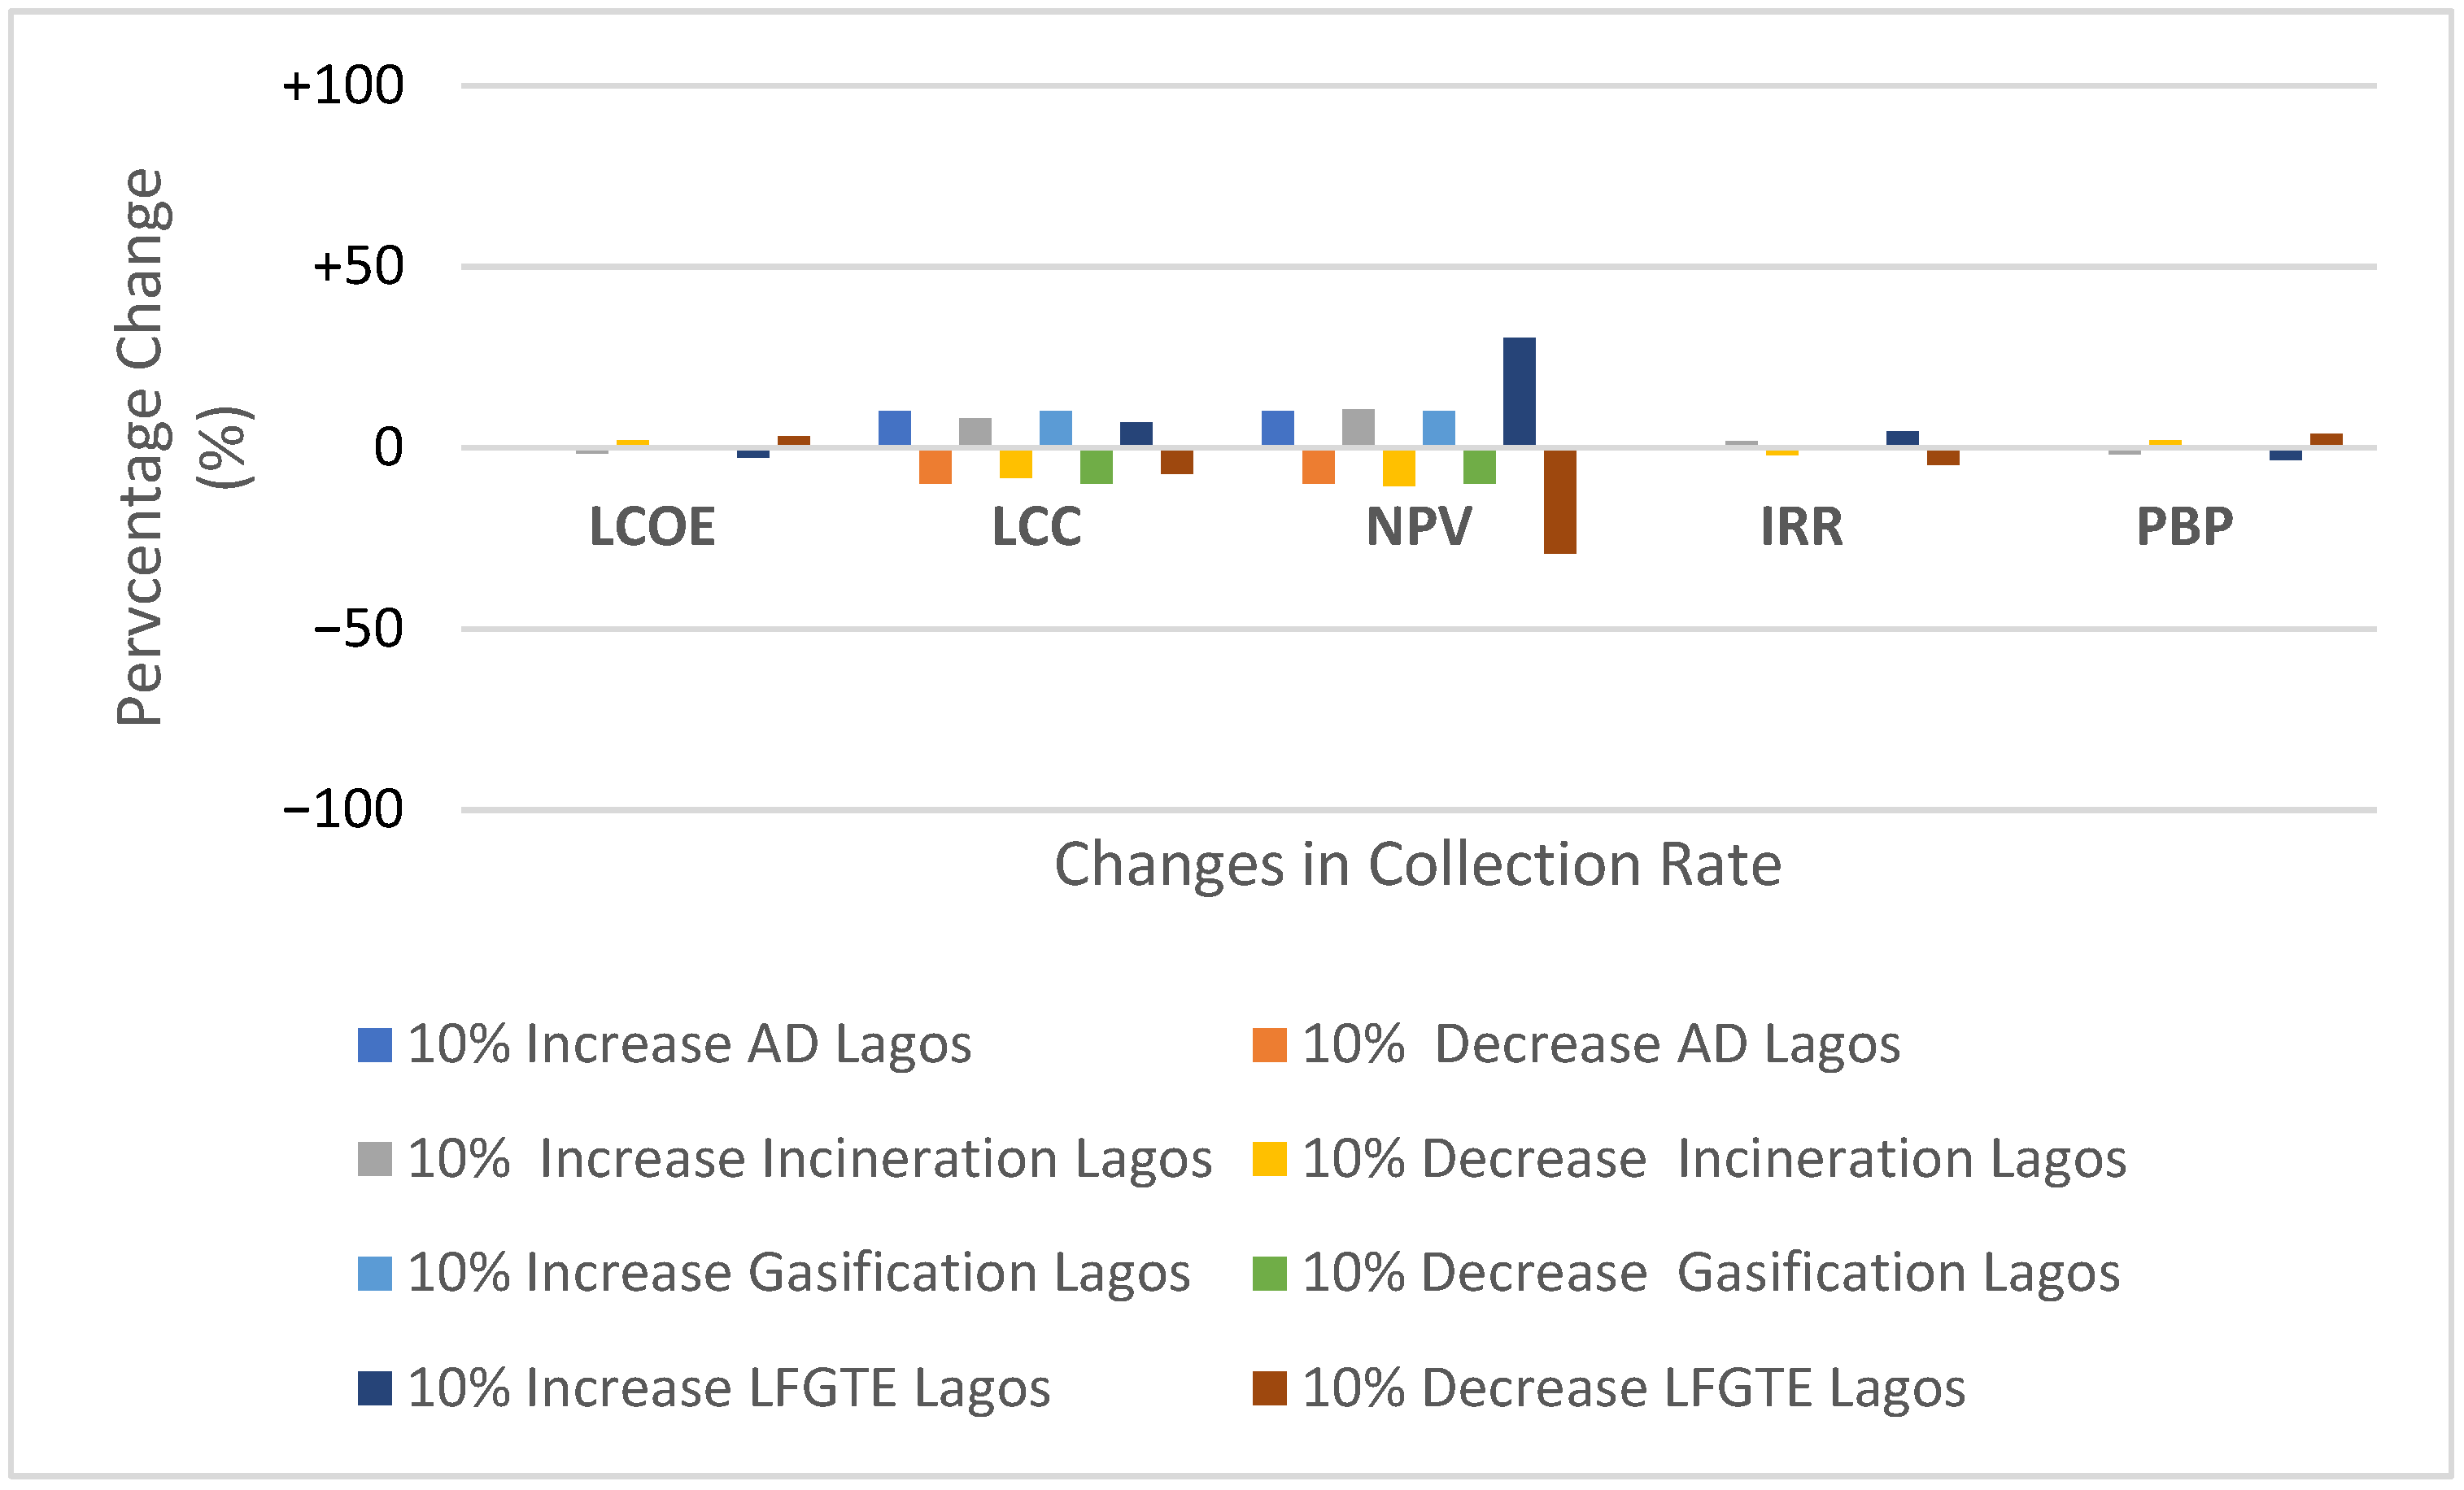
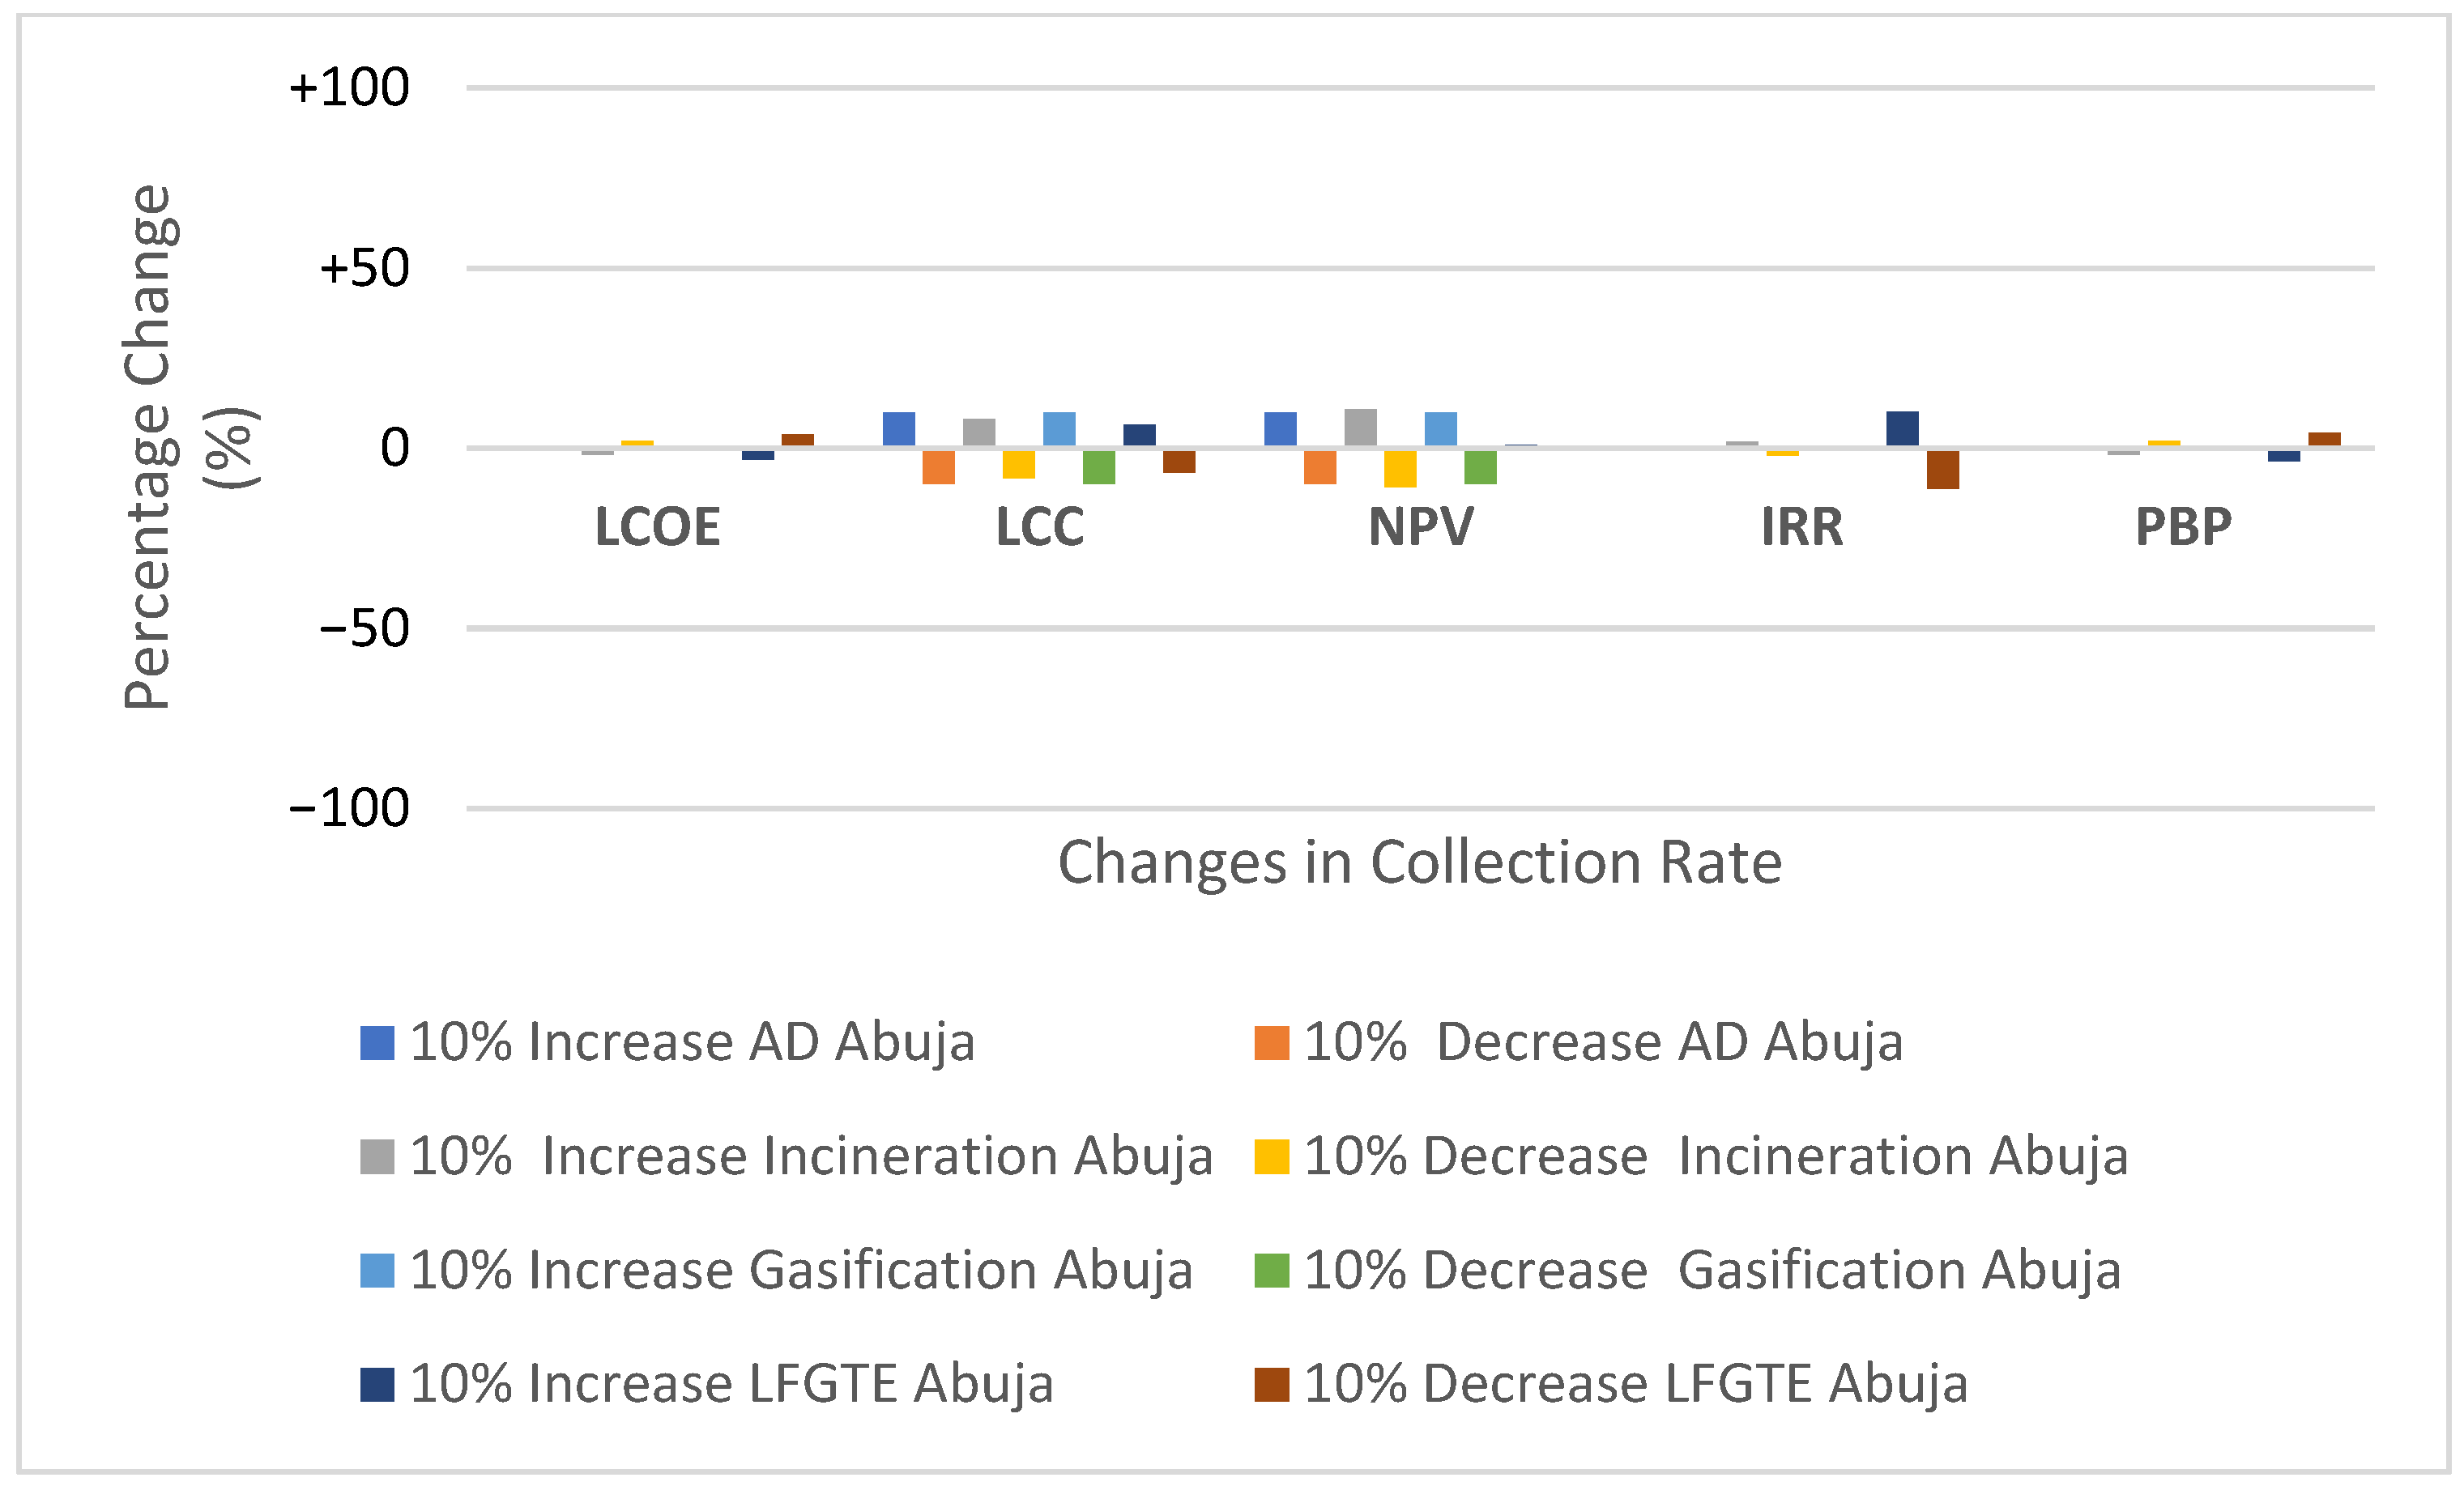
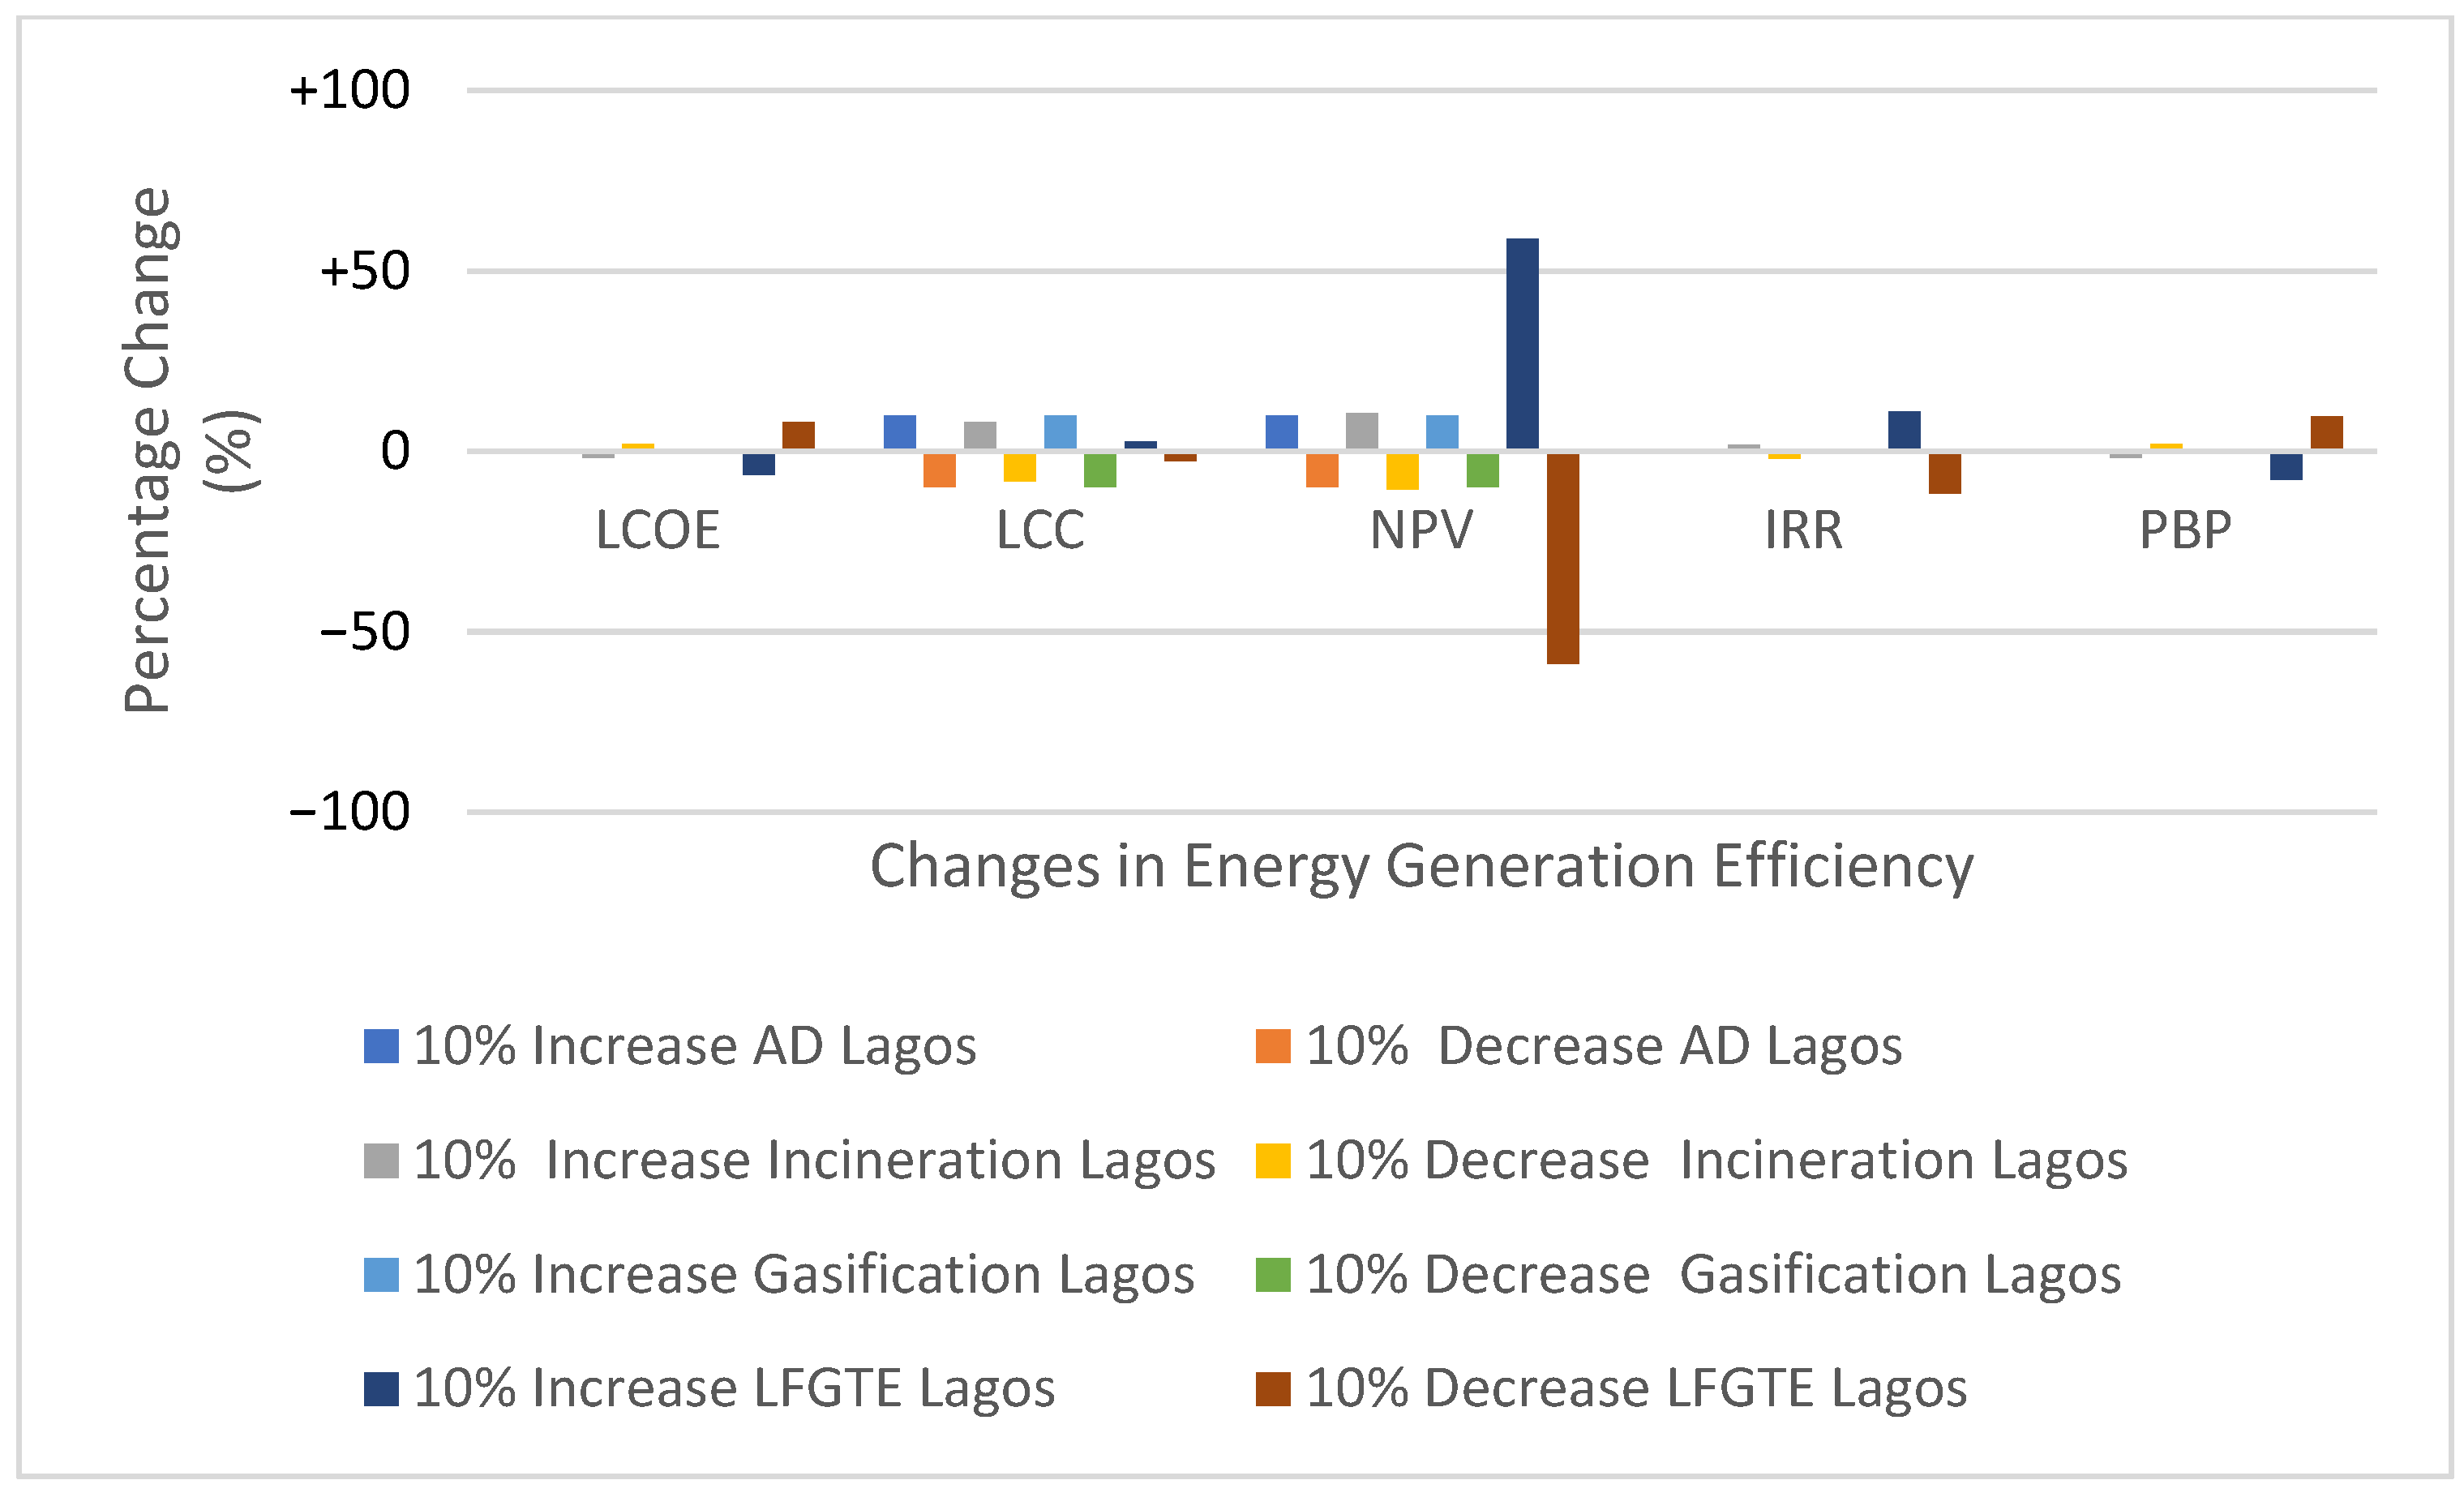
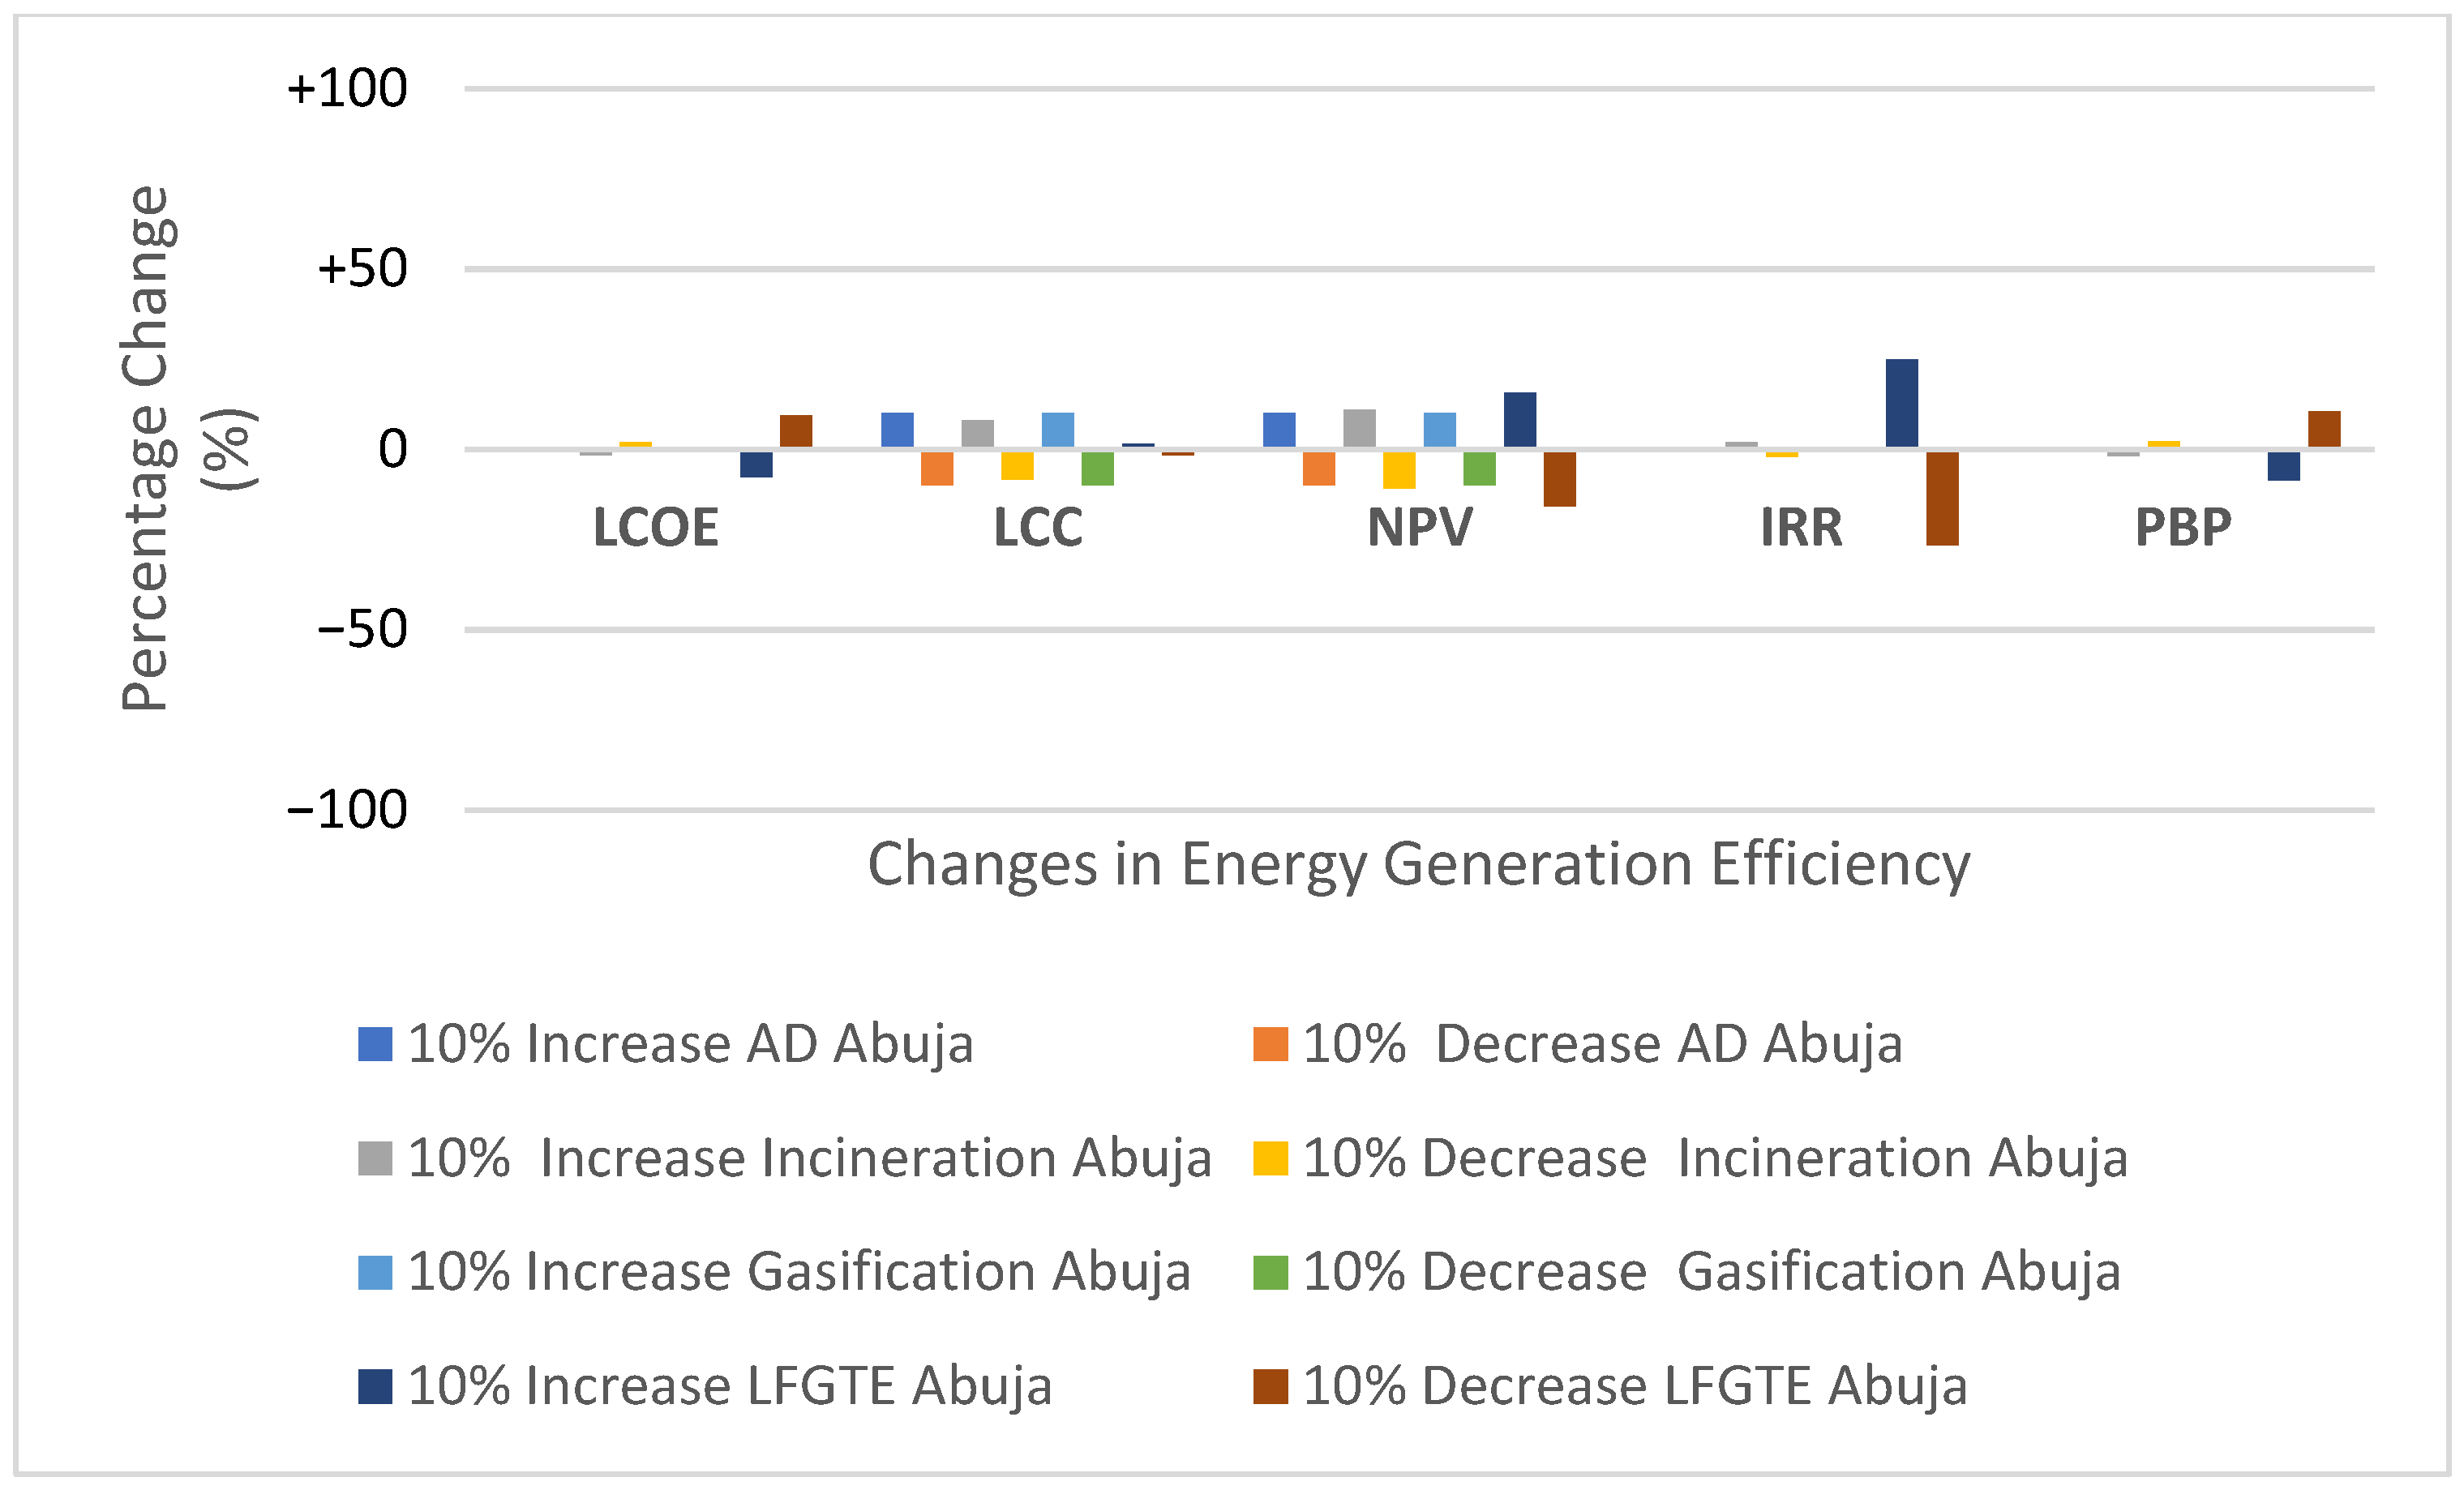
Sensitivity Analysis
4. Discussion
- Good quality data are required for proper decision-making as the reliability of feasibility studies can be affected by lack and/or uncertainties of local data.
- The employment of economies of scale for WTE facilities whereby decreasing capital and operating costs are reduced by increasing plant capacity.
- The establishment of effective legislative and institutional frameworks involving relevant stakeholders should be made to promote the implementation of WTE systems and encourage private sector participation.
- For WtE systems such as AD, more flexible criteria are required regarding the use of fertilizers originating from waste treatment processes. The production of such fertilizer from the digestate significantly improves the economics of AD systems.
- For the success of WTE systems, it is essential that participation rate in source separation programs is increased through incentives and awareness programs managed by municipalities and non-profit organizations.
- It is crucial to build a skilled educated workforce able to operate the WtE systems.
- Public awareness campaigns should be conducted to alleviate community concerns about the environmental impacts of WtE facilities.
- The Federal Government in Nigeria should embark on pilot WtE projects first before introducing large scale projects. This is due to the high investment cost required to establish a large scale WtE facilities as well as the lack of technological knowledge and experience for handling and operating such facilities.
- Relevant research institutions should be empowered through adequate budget allocation to explore WtE in Nigeria.
5. Conclusions
Supplementary Materials
Author Contributions
Funding
Institutional Review Board Statement
Informed Consent Statement
Data Availability Statement
Acknowledgments
Conflicts of Interest
References
- Trindade, A.B.; Palacio, J.C.E.; González, A.M.; Orozco, D.J.R.; Lora, E.E.S.; Renó, M.L.G.; del Olmo, O.A. Advanced exergy analysis and environmental assesment of the steam cycle of an incineration system of municipal solid waste with energy recovery. Energy Convers. Manag. 2018, 157, 195–214. [Google Scholar] [CrossRef]
- Rehman, A.U.; Lee, S.M.; Kim, J.H. Use of municipal solid waste incineration ash in 3D printable concrete. Process Saf. Environ. Prot. 2020, 142, 219–228. [Google Scholar] [CrossRef]
- Scarlat, N.; Motola, V.; Dallemand, J.F.; Monforti-Ferrario, F.; Mofor, L. Evaluation of energy potential of municipal solid waste from african urban areas. Renew. Sustain. Energy Rev. 2015, 50, 1269–1286. [Google Scholar] [CrossRef]
- Deetman, S.; de Boer, H.S.; Van Engelenburg, M.; van der Voet, E.; van Vuuren, D.P. Projected material requirements for the global electricity infrastructure–generation, transmission, and storage. Resour. Conserv. Recycl. 2021, 164, 105200. [Google Scholar] [CrossRef]
- Ayodele, T.; Ogunjuyigbe, A.; Alao, M. Life cycle assessment of waste-to-energy (WtE) technologies for electricity generation using municipal solid waste in Nigeria. Appl. Energy 2017, 201, 200–218. [Google Scholar] [CrossRef]
- Tan, S.T.; Ho, W.S.; Hashim, H.; Lee, C.T.; Taib, M.R.; Ho, C.S. Energy, economic and environmental (3E) analysis of waste-to-energy (WTE) strategies for municipal solid waste (MSW) management in Malaysia. Energy Conserv. Manag. 2015, 102, 111–120. [Google Scholar] [CrossRef]
- Gómez, A.; Zubizarreta, J.; Rodrigues, M.; Dopazo, C.; Fueyo, N. Potential and cost of electricity generation from human and animal waste in Spain. Renew Energy 2010, 35, 498–505. [Google Scholar] [CrossRef]
- Kumar, A.; Samadder, S.R. A review on technological options of waste to energy for effective management of municipal solid waste. Waste Manag. 2017, 69, 407–422. [Google Scholar] [CrossRef]
- Rogoff, M.J.; Screve, F. Waste-to-Energy: Technologies and Project Implementation; Academic Press: Cambridge, MA, USA, 2019. [Google Scholar]
- Sobamowo, G.M.; Ojolo, S.J. Techno-economic analysis of biomass energy utilization through gasification technology for sustainable energy production and economic development in Nigeria. J. Energy 2018, 2018, 4860252. [Google Scholar] [CrossRef]
- Nigerian Gross Domestic Product Report; National Bureau of Statistics: Abuja, Nigeria, 2016.
- Ike, C.C.; Ezeibe, C.C.; Anijiofor, S.C.; Daud, N.N. Solid waste management in Nigeria: Problems, prospects, and policies. J. Solid Waste Technol. Manag. 2018, 44, 163–172. [Google Scholar] [CrossRef]
- International Energy Agency. Africa Energy Outlook. 2019. Available online: https://www.iea.org/reports/africa-energy-outlook-2019 (accessed on 23 July 2021).
- Oyedepo, S.O.; Babalola, O.P.; Nwanya, S.C.; Kilanko, O.; Leramo, R.O.; Aworinde, A.K.; Adekeye, T.; Oyebanji, J.A.; Abidakun, A.O.; Agberegha, O.L. Towards a sustainable electricity supply in nigeria: The role of decentralized renewable energy system. Eur. J. Sustain. Dev. Res. 2018, 2, 40. [Google Scholar] [CrossRef]
- Khan, A.H.; López-Maldonado, E.A.; Alam, S.S.; Khan, N.A.; López, J.R.L.; Herrera, P.F.M.; Abutaleb, A.; Ahmed, S.; Singh, L. Municipal solid waste generation and the current state of waste-to-energy potential: State of art review. Energy Convers. Manag. 2022, 267, 115905. [Google Scholar] [CrossRef]
- Safar, K.M.; Bux, M.R.; Faria, U.; Pervez, S. Integrated model of municipal solid waste management for energy recovery in Pakistan. Energy 2021, 219, 119632. [Google Scholar] [CrossRef]
- Khandelwal, H.; Thalla, A.K.; Kumar, S.; Kumar, R. Life cycle assessment of municipal solid waste management options for India. Bioresour. Technol. 2019, 288, 121515. [Google Scholar] [CrossRef]
- Nubi, O.; Morse, S.; Murphy, R.J. Electricity Generation from Municipal Solid Waste in Nigeria: A Prospective LCA Study, Nigeria. Sustainability 2022, 15, 9252. [Google Scholar] [CrossRef]
- Evangelisti, S.; Tagliaferri, C.; Clift, R.; Lettieri, P.; Taylor, R.; Chapman, C. Life cycle assessment of conventional and two-stage advanced energy-from-waste technologies for municipal solid waste treatment. J. Clean. Prod. 2015, 100, 212–223. [Google Scholar] [CrossRef]
- De Menna, F.; Dietershagen, J.; Loubiere, M.; Vittuari, M. Life cycle costing of food waste: A review of methodological approaches. Waste Manag. 2018, 73, 1–13. [Google Scholar] [CrossRef] [PubMed]
- Lavee, D.; Nardiya, S. A cost evaluation method for transferring municipalities to solid waste source-separated system. Waste Manag. 2013, 33, 1064–1072. [Google Scholar] [CrossRef] [PubMed]
- Lavee, D.; Khatib, M. Benchmarking in municipal solid waste recycling. Waste Manag. 2010, 30, 2204–2208. [Google Scholar] [CrossRef]
- ISO15686; Standardized Method of Life Cycle Costing for Construction Procurement. NBS: Beijing, China, 2008.
- Swarr, T.E.; Hunkeler, D.; Klöpffer, W.; Pesonen, H.L.; Ciroth, A.; Brent, A.C.; Pagan, R. Environmental life-cycle costing: A code of practice. Int. J. Life Cycle Assess. 2011, 16, 389–391. [Google Scholar] [CrossRef]
- Li, C.; Wang, F.; Zhang, D.; Ye, X. Cost management for waste to energy systems using life cycle costing approach: A case study from China. J. Renew. Sustain. Energy 2016, 8, 025901. [Google Scholar] [CrossRef]
- Lee, E.; Oliveira, D.S.B.L.; Oliveira, L.S.B.L.; Jimenez, E.; Kim, Y.; Wang, M.; Ergas, S.J.; Zhang, Q. Comparative environmental and economic life cycle assessment of high solids anaerobic co-digestion for biosolids and organic waste management. Water Res. 2020, 171, 115443. [Google Scholar] [CrossRef]
- Dong, J.; Chi, Y.; Zou, D.; Fu, C.; Huang, Q.; Ni, M. Energy-environment-economy assessment of waste management systems from a life cycle perspective: Model development and case study. Appl. Energy 2014, 114, 400–408. [Google Scholar] [CrossRef]
- Slorach, P.C.; Jeswani, H.K.; Cuéllar-Franca, R.; Azapagic, A. Environmental and economic implications of recovering resources from food waste in a circular economy. Sci. Total Environ. 2019, 693, 133516. [Google Scholar] [CrossRef]
- Ayodele, T.R.; Ogunjuyigbe, A.S.O.; Alao, M.A. Economic and environmental assessment of electricity generation using biogas from organic fraction of municipal solid waste for the city of Ibadan, Nigeria. J. Clean. Prod. 2018, 203, 718–735. [Google Scholar] [CrossRef]
- Nubi, O.; Morse, S.; Murphy, R.J. A Prospective Social Life Cycle Assessment (sLCA) of Electricity Generation from Municipal Solid Waste in Nigeria. Sustainability 2021, 13, 10177. [Google Scholar] [CrossRef]
- National Population Commission Report; NPC: Abuja, Nigeria, 2012. Available online: https://www.nigerianstat.gov.ng/pdfuploads/annual_abstract_2012.pdf (accessed on 10 September 2022).
- Lagos Bureau of Statistics. 2010 Lagos State Government. Lagos State Government Report; Lagos State Government: Lagos, Nigeria, 2012.
- Olukanni, D.O.; Oresanya, O.O. Progression in Waste Management Processes in Lagos State, Nigeria. Int. J. Eng. Res. Afr. 2018, 35, 11–23. [Google Scholar] [CrossRef]
- Olukanni, D.O.; Aipoh, A.O.; Kalabo, I.H. Recycling, and reuse technology: Waste to wealth initiative in a private tertiary institution, Nigeria. Recycling 2018, 3, 44. [Google Scholar] [CrossRef]
- AEPB. Abuja Environmental Protection Board Report; AEPB: Abuja, Nigeria, 2019. [Google Scholar]
- Wikimedia Commons. Available online: https://en.wikipedia.org/wiki/File:Map_of_Nigerian_States_with_names.png (accessed on 10 September 2022).
- Wikimedia Commons. Available online: https://commons.wikimedia.org/wiki/File:FCT-map.png (accessed on 10 September 2022).
- Wikimedia Commons. Available online: https://commons.wikimedia.org/wiki/File:Surulere.png (accessed on 10 September 2022).
- Olorunfemi, F.B. Landfill Development and Current Practices in Lagos Metropolis, Nigeria. Afr. J. Geogr. Reg. Plan. 2011, 4, 656–663. [Google Scholar]
- Abubakar, I.R. Access to Sanitation Facilities among Nigerian Households: Determinants and Sustainability Implications. Sustainability 2017, 9, 547. [Google Scholar] [CrossRef]
- Ogunjuyigbe, A.S.O.; Ayodele, T.R.; Alao, M.A. Electricity generation from municipal solid waste in some selected cities of Nigeria: An assessment of feasibility, potential and technologies. Renew. Sustain. Energy Rev. 2017, 80, 149–162. [Google Scholar] [CrossRef]
- NPC. National Population Commission Report; NPC: Abuja, Nigeria, 2022. Available online: http://nationalpopulation.gov.ng/statistics (accessed on 10 September 2022).
- LAWMA. Lagos Waste Management Authority Report; LAWMA: Lagos, Nigeria, 2019. [Google Scholar]
- Nizami, A.S. Anaerobic Digestion: Processes Products and Applications; Nova Science Publishers: Sligo, Ireland, 2012. [Google Scholar]
- Amoo, O.M.; Fagbenle, R.L. Renewable municipal solid waste pathways for energy generation and sustainable development in the Nigerian context. Int. J. Energy Environ. Eng. 2013, 4, 42. [Google Scholar] [CrossRef]
- Nielfa, A.; Cano, R.; Fdz-Polanco, M. Theoretical methane production generated by the Co-digestion of organic fraction municipal solid waste and biological sludge. Biotechnol. Rep. 2015, 5, 14–21. [Google Scholar] [CrossRef] [PubMed]
- Richard, E.N.; Hilonga, A.; Machunda, R.L.; Njau, K.N. Life cycle analysis of potential municipal solid wastes management scenarios in Tanzania: The case of Arusha City. Sustain. Environ. Res. 2021, 31, 1. [Google Scholar] [CrossRef]
- Salami, L.; Susu, A.A.; Patinvoh, R.J.; Olafadehan, O.A. Characterisation of solid wastes: A case study of Lagos State. Int. J. Appl. Sci. Technol. 2011, 1, 47–52. [Google Scholar]
- Amini, H.R.; Reinhart, D.R.; Niskanen, A. Comparison of first order-decay modeled and actual field measured municipal solid waste landfill methane data. Waste Manage. 2013, 33, 2720–2728. [Google Scholar] [CrossRef]
- Intergovernmental Panel on Climate Change. Biological Treatment of Solid Waste; IPCC Waste; Pipatti, R., Ed.; Intergovernmental Panel on Climate Change: Geneva, Switzerland, 2006; Volume 5. [Google Scholar]
- EPA. Waste Classification, List of Waste & Determining if Waste is Hazardous or Non-Hazardous Environmental Protection Agency; EPA: Wexford, Ireland, 2015; pp. 1–64. Available online: https://www.epa.ie/publications/monitoring--assessment/waste/WasteClassification_Report2019_Aug19_Pt_2.pdf (accessed on 10 September 2022).
- International Renewable Energy Agency. IRENA Renewable Energy Technologies: Cost Analysis Series of Biomass for Power Generation; IRENA: Bonn, Germany, 2012; p. 60. [Google Scholar]
- Arena, U. Process and technological aspects of municipal solid waste gasification. A Rev. Waste Manag. 2012, 32, 625–639. [Google Scholar] [CrossRef]
- Katnoria, H.; Singh Saini, M.; Singh Cheema, R. A Smart Concept for Waste Management in Jalandhar City. Int. J. Emerg. Technol. 2017, 8, 490–496. [Google Scholar]
- Alzate, S.; Restrepo-Cuestas, B.; Jaramillo-Duque, Á. Municipal Solid Waste as a Source of Electric Power Generation in Colombia: A Techno-Economic Evaluation under Different Scenarios. Resources 2019, 8, 51. [Google Scholar] [CrossRef]
- Fernández-González, J.M.; Grindlay, A.L.; Serrano-Bernardo, F.; Rodríguez-Rojas, M.I.; Zamorano, M. Economic and environmental review of Waste-to-Energy systems for municipal solid waste management in medium and small municipalities. Waste Manag. 2017, 67, 360–374. [Google Scholar] [CrossRef]
- Ayodele, T.R.; Ogunjuyigbe, A.S.O. Increasing household solar energy penetration through load partitioning based on quality of life: The case study of Nigeria. Sustain. Cities Soc. 2015, 18, 21–31. [Google Scholar] [CrossRef]
- Nigerian Electricity Regulatory Commission (NERC). Review of Basic Assumptions for Semi-Annual Review of MYTO-2. May 2014. Available online: https://nerc.gov.ng/index.php/library/documents (accessed on 5 June 2022).
- Jorgenson, J.; Gilman, P.; Dobos, A. Technical Manual for the Sam Biomass Power Generation Model; National Renewable Energy Laboratory (NREL): Golden, CO, USA, 2011; 40p. [Google Scholar] [CrossRef][Green Version]
- Hadidi, L.A.; Omer, M.M. A financial feasibility model of gasification and anaerobic digestion waste-to-energy (WTE) plants in Saudi Arabia. Waste Manag. 2017, 59, 90–101. [Google Scholar] [CrossRef]
- Hamian, M.; Darvishan, A.; Hosseinzadeh, M.; Lariche, M.J.; Ghadimi, N.; Nouri, A. A framework to expedite joint energy-reserve payment cost minimization using a custom-designed method based on mixed integer genetic algorithm. Eng. Appl. Artif. Intell. 2018, 72, 203–212. [Google Scholar] [CrossRef]
- Odekanle, E.L.; Odejobi, O.J.; Dahunsi, S.O.; Akeredolu, F.A. Potential for cleaner energy recovery and electricity generation from abattoir wastes in Nigeria. Energy Rep. 2020, 6, 1262–1267. [Google Scholar] [CrossRef]
- Cudjoe, D.; Han, M.S. Economic and environmental assessment of landfill gas electricity generation in urban districts of beijing municipality. Sustain. Prod. Consump. 2020, 23, 128–137. [Google Scholar] [CrossRef]
- United States Environmental Protection Agency (US EPA). Emission Guidelines and Compliance Times for Municipal Solid Waste Landfills. 40 CFR Part 60. Available online: https://www.regulations.gov/document?D=EPA-HQ-OAR-2014-0451-0076> (accessed on 22 July 2022).
- Alzate-Arias, S.; Jaramillo-Duque, Á.; Villada, F.; Restrepo-Cuestas, B. Assessment of government incentives for energy from waste in Colombia. Sustainability 2018, 10, 1294. [Google Scholar] [CrossRef]
- International Renewable Energy Agency. Renewable Power Generation Costs in 2014; International Renewable Energy Agency: Bonn, Germany, 2015; pp. 1–164. [Google Scholar]
- Mabalane, P.N.; Oboirien, B.O.; Sadiku, E.R.; Masukume, M. A Techno-economic Analysis of Anaerobic Digestion and Gasification Hybrid System: Energy Recovery from Municipal Solid Waste in South Africa. Waste Biomass Valor 2021, 12, 1167–1184. [Google Scholar] [CrossRef]
- CDM-Database. The TIMARPUR-OKHLA Waste Management Company Pvt Ltd’s (TOWMCL) Intergrated Waste to Energy Project in Delhi. 2014. Available online: https://cdm.unfccc.int/Projects/DB/SGS-UKL1185291186.52 (accessed on 11 July 2017).
- Patel, C.; Lettieri, P.; Simons, S.J.R.; Germanà, A. Techno-economic performance analysis of energy production from biomass at different scales in the UK context. Chem. Eng. J. 2011, 171, 986–996. [Google Scholar] [CrossRef]
- Khoo, H.H.; Tan, R.B.H.; Salim, S.; Wu, Y.M. Life cycle evaluation and economic considerations of the pyrolysis-gasification of municipal solid waste in Singapore. WIT Trans. Ecol. Environ. 2006, 98, 43–54. [Google Scholar] [CrossRef]
- IREDA. Financing Norms & Schemes. 2016. Available online: https://www.ireda.in/doc/Annexure_I.pdf (accessed on 1 August 2022).
- Johnson, M.; Fitzpatrick, C.; Wagner, M.; Huisman, J. Modelling the levels of historic waste electrical and electronic equipment in Ireland Resour. Conserv. Recycl. 2018, 131, 1–16. [Google Scholar] [CrossRef]
- Huang, W. and Fooladi, H. Economic and environmental estimated assessment of power production from municipal solid waste using anaerobic digestion and landfill gas technologies. Energy Rep. 2021, 7, 4460–4469. [Google Scholar] [CrossRef]
- Abdallah, M.; Shanableh, A.; Shabib, A.; Adghim, M. Financial feasibility of waste to energy strategies in the United ArabEmirates. Waste Manag. 2018, 82, 207–219. [Google Scholar] [CrossRef]
- Abushammala, M.F.M.; Qazi, W.A. Financial feasibility of waste-to-energy technologies for municipal solid waste management in Muscat, Sultanate of Oman. Clean Technol. Environ. Policy 2021, 23, 2011–2023. [Google Scholar] [CrossRef]
- Goosen, C. Assessing the Economic Viability of Biogas Plants at Abattoirs in South Africa. Ph.D. Thesis, North-West University, Potchefstroom, South Africa, 2013. [Google Scholar]
- Sharma, B.K.; Chandel, M.K. Life cycle cost analysis of municipal solid waste management scenarios for Mumbai, India. Waste Manag. 2021, 124, 293–302. [Google Scholar] [CrossRef]
- Amulah, N.C. Integrating Renewable Energy into Nigeria’s Energy Supply Mix. Renew. Energy Sustain. Dev. 2022, 8, 11–19. [Google Scholar] [CrossRef]
- Yusuf, R.O.; Adeniran, J.A.; Mustapha, S.I.; Sonibare, J.A. Energy recovery from municipal solid wastein Nigeria and its economic and environmental implica-tions. Environ. Qual. Manag. 2019, 28, 33–43. [Google Scholar] [CrossRef]
- Ogbonnaya, C.; Abeykoon, C.; Damo, U.; Turan, A. The current and emerging renewable energy technologies for power generation in Nigeria: A review. Therm. Sci. Eng. Prog. 2019, 13, 100390. [Google Scholar] [CrossRef]
- Akadiri, S.S.; Alola, A.A.; Olasehinde-Williams, G.; Etokakpan, M.U. The role of electricity consumption, globalization and economic growth in carbon dioxide emissions and its implications for environmental sustainability targets. Sci. Total Environ. 2020, 708, 134653. [Google Scholar] [CrossRef]
- United Nations. About the Sustainable Development Goals. 2020. Available online: https://www.un.org/sustainabledevelopment/sustainable-development-goals/ (accessed on 24 September 2022).


| City | P0 | r (%) | Wgr (kg/Capita/Day) | Df (%) | Lifetime (years) |
|---|---|---|---|---|---|
| Lagos | 15,387,639 a | 3.2 a | 0.72 b | 40 | 20 |
| Abuja | 3,464,000 a | 5.67 a | 0.66 c | 40 | 20 |
| Element | C | H | O | N |
|---|---|---|---|---|
| Molar mass (M) (g) | 12.01 | 1.01 | 16 | 14.01 |
| Electricity Generated (kWh/t of Processed Suitable MSW) | Lagos | Abuja |
|---|---|---|
| AD | 683 | 667 |
| Incineration | 549 | 441 |
| Gasification | 626 | 639 |
| LFGTE | 171 | 135 |
| Economic Indicators | AD | Incineration | Gasification | LFGTE |
|---|---|---|---|---|
| LCC (USD/t) | 456.4 (A) | 232.76 (A) | 419.58 (A) | 323.71 (A) |
| 467.35 (L) | 214.1 (L) | 411.04 (L) | 240.53 (L) | |
| LCOE (USD/kWh) | 0.08 (A) | 0.062 (A) | 0.077 (A) | 0.28 (A) |
| 0.0803 (L) | 0.046 (L) | 0.077 (L) | 0.16 (L) | |
| NPV (USD/t) | 617.6 (A) | 475.56 (A) | 610.65 (A) | −105.42 (A) |
| 632.42 (L) | 665.42 (L) | 598.23 (L) | 35.75 (L) | |
| IRR (%) | 33.6 (A) | 45.31 (A) | 36.73 (A) | 4.17 (A) |
| 33.6 (L) | 62.84 (L) | 36.73 (L) | 12.55 (L) | |
| PBP (Years) | 2.97 (A) | 2.21 (A) | 2.72 (A) | 13.39 (A) |
| 2.97 (L) | 1.59 (L) | 2.72 (L) | 7.22 (L) | |
| Lowest | Highest |
Publisher’s Note: MDPI stays neutral with regard to jurisdictional claims in published maps and institutional affiliations. |
© 2022 by the authors. Licensee MDPI, Basel, Switzerland. This article is an open access article distributed under the terms and conditions of the Creative Commons Attribution (CC BY) license (https://creativecommons.org/licenses/by/4.0/).
Share and Cite
Nubi, O.; Morse, S.; Murphy, R.J. Prospective Life Cycle Costing of Electricity Generation from Municipal Solid Waste in Nigeria. Sustainability 2022, 14, 13293. https://doi.org/10.3390/su142013293
Nubi O, Morse S, Murphy RJ. Prospective Life Cycle Costing of Electricity Generation from Municipal Solid Waste in Nigeria. Sustainability. 2022; 14(20):13293. https://doi.org/10.3390/su142013293
Chicago/Turabian StyleNubi, Oluwaseun, Stephen Morse, and Richard J. Murphy. 2022. "Prospective Life Cycle Costing of Electricity Generation from Municipal Solid Waste in Nigeria" Sustainability 14, no. 20: 13293. https://doi.org/10.3390/su142013293
APA StyleNubi, O., Morse, S., & Murphy, R. J. (2022). Prospective Life Cycle Costing of Electricity Generation from Municipal Solid Waste in Nigeria. Sustainability, 14(20), 13293. https://doi.org/10.3390/su142013293