Article

Evaluation of Urban Intensive Land Use Degree with GEE Support: A Case Study in the Pearl River Delta Region, China

1
Key Laboratory of Urban Land Resources Monitoring and Simulation, Ministry of Natural Resources, Shenzhen 518034, China
2
School of Information Engineering, China University of Geosciences, Beijing 100083, China
3
School of Accounting, Shandong University of Finance and Economics, Jinan 250014, China
*
Author to whom correspondence should be addressed.
Sustainability 2022, 14(20), 13284; https://doi.org/10.3390/su142013284
Submission received: 13 September 2022 / Revised: 6 October 2022 / Accepted: 11 October 2022 / Published: 16 October 2022
(This article belongs to the Special Issue Geographic Big Data for Sustainable City)

Abstract

:
Evaluation of intensive land use (ILU) over long time series is essential for the rational use of land and urban development. We propose a novel framework for analyzing ILU in the Pearl River Delta (PRD) region of China. First, we used Google Earth Engine (GEE) to obtain cities’ built-up land information. Second, we calculated the ILU degree and constructed an evaluation index system based on the Pressure–State–Response (PSR) theoretical framework. Third, we employed Geodetector to determine the dominant influencing factors on ILU. The findings are as follows: (1) It is accurate and effective to extract land use data using GEE. From 2000 to 2020, all cities’ built-up areas increased, but the increases differed by city. (2) While the ILU level in all cities has increased over the past 20 years, the ILU level in each city varies. Specifically, Shenzhen had the highest ILU degree in 2020, followed by core cities such as Guangzhou, Dongguan, and Zhuhai, while cities on the PRD region’s periphery, such as Zhaoqing and Jiangmen, had relatively low ILU levels. (3) In terms of time, the dominant factors influencing ILU in the PRD region have shifted over the past two decades. During this period, however, two factors (economic density and disposable income per capita) have always played a dominant role. This suggests that improving economic output efficiency and the city’s economic strength is a feasible way to raise the ILU level at this time.

1. Introduction

With the accelerated urbanization process, the demand for land is constantly increasing. As an essential asset for a city, land provides a crucial foundation for social and economic development. Since the 1990s, due to the massive increase in population and rapid socio-economic development, China has faced many land problems [1], resulting in a scarcity of land resources, gradually becoming a major constraint to urban development. This situation dictates the need to use land intensively, thereby optimizing land use structure and improving its efficiency [2]. Only by expanding the use of intensive land use (ILU) will it be possible to resolve the conflicts. In detail, ILU refers to the continuous improvement of land use efficiency and the achievement of economic, social, and ecological benefits through the rational layout of the city, optimization of land use structure, and sustainable development [3,4,5,6].
More and more scholars are currently devoted to scientifically evaluating and analyzing the ILU level, which has become a popular topic in recent years, with the ultimate aim of supporting the Sustainable Development Goals (SDG) [4,7,8,9]. Researchers have conducted many studies on ILU evaluation. Among these studies, various statistical and spatial evaluation methods have been implemented, such as the model establishment method [6,10], the comprehensive modeling method [4,7], etc. The former refers to constructing an evaluation index system based on the definition of ILU and the characteristics of the selected study area. In contrast, the latter refers to evaluating ILU based on existing comprehensive modeling methods (e.g., Data Envelopment Analysis and stochastic frontier analysis). The former is widely used in research because it is more flexible and straightforward, allowing researchers to complete assessments based on their own needs without relying on relevant software. For instance, Chen developed an evaluation index system for cultivated land use, including input intensity, use degree, and production efficiency, and assessed the level of cultivated land intensive use in 2010 [6]. Qian developed a sustainable intensification variable model to calculate the appropriate interval of regional ILU and evaluated the degree in Jinan, China, in 2001, 2011, and 2015 [10]. After establishing the indicator system, determining weights becomes the key to evaluation. Such determination methods involve principal component analysis [11,12], hierarchical analysis [13,14], and entropy weighting methods [15,16]. Among these methods, the entropy weighting method is favored by researchers because it calculates weights based on the characteristics of the data itself and avoids subjectivity [17].
The type of index data used in the ILU evaluation or other similar land evaluation works (e.g., ecological environment evaluation) has gradually shifted from single to composite as remote sensing technology has advanced. In particular, the data used in the previous evaluation were derived primarily from statistical data. Land use information has been incorporated into the evaluation system as a result of the advancement of satellite imagery technology and machine learning (ML). For instance, Shang [9] classified Landsat images by implementing the random forest classifier to obtain land use information, then combined the land use information with social statistics to assess five cities’ ILU levels from 1990 to 2018. Wang [18] chose the Black River Basin as a typical area and calculated the Biological Abundance Index (BAI), Vegetation Cover Index (VCI), and Water Density Index (WDI) based on land use information, as well as the statistical data, to make a comprehensive evaluation of the ecological environment from 2010 to 2030. It can be seen that using information extracted from satellite images to construct the related evaluation indices can effectively replace and alleviate the problem of relying solely on statistical data. Specifically, with the popularity of cloud computing technology in the remote sensing classification field, it has become easier to obtain land use information by calling the satellite image data based on online platforms and combining it with ML algorithms for classification. The Google Earth Engine (GEE), the most widely used remote sensing cloud computing platform, which integrates powerful cloud computing services with vast quantities of multi-source satellite images, can help users effectively explore scientific topics [19,20,21]. Hence, this platform is used in this study as it allows for efficient and easy land use classification.
Furthermore, analyzing the dominant factor influencing the ILU degree is essential for comprehending the inner mechanism of ILU in cities and, as a result, making appropriate adjustments to urban planning. There are many approaches to revealing the driving forces of the factors behind geographical phenomena [22,23,24], such as principal component analysis and geographically weighted regression. However, as a new tool for factor detection, Geodetector has been widely used by researchers since the model can detect the main influencing factors expressing a spatio-temporal phenomenon without making assumptions [25,26]. Shrestha [27] also demonstrated that the Geodetector outperforms principal component analysis and geographically weighted regression methods in determining the influence of explanatory variables. The q value in the model attempts to measure the explanatory power of the variables on the phenomenon. In other words, Geodetector allows users to investigate the dominant factors.
With the growing disparity between land supply and demand in large cities, it is critical to strengthen the function of urban land use, guide the rational design of the land structure, and thus improve the ILU level for the long-term development of the regional society, economy, and environment. As a representative of the “growth miracle” since the reform and opening-up, the Pearl River Delta (PRD) region occupies an important position in the development of urbanization in China [28]. The region has undergone significant structural and spatial transformations over the past few decades. As a result, this paper focuses on the PRD region, with the goal of developing a framework for assessing and analyzing ILU (Figure 1), using quantitative analysis to (1) extract the built-up land information from the GEE platform in the PRD region between 2000 and 2020, (2) evaluate the ILU degree of the PRD region based on the Pressure–State–Response (PSR) theoretical framework, and (3) investigate the dominant influencing factors of the ILU level in the PRD region.

2. Materials and Methods

2.1. Study Area

The PRD region, one of the largest and most developed urban agglomerations in China, is located in Guandong province and includes 9 cities (Figure 2): Guangzhou, Shenzhen, Foshan, Dongguan, Zhongshan, Zhuhai, Jiangmen, Zhaoqing, and Huizhou. In 2020, the PRD region had a total land area of 54,769 km2, a GDP of RMB 895.29 billion, and a resident population of 78.23 million (National Bureau of Statistics). The region has strong land resources, economic development, and population size. It is representative to use this region as the study area. Therefore, assessing and analyzing the ILU level in each PRD city will aid in the region’s transformation, upgrading, and high-quality development.

2.2. Data and Preprocessing

The research data used in this paper include Landsat imagery data, nighttime light (NTL) data, and socio-economic data. Landsat image data and NTL data are collected through the GEE platform. Socio-economic statistics are mainly obtained from the China Urban Statistical Yearbook, the statistical yearbooks of Guangdong Province, and municipalities for the period 2001–2021.
We then used the GEE platform to access Landsat Top-of-Atmosphere (TOA) reflectance data for the long time series of 2000, 2005, 2010, 2015, and 2020 to obtain built-up land information in the PRD region. Because of the long time span, TOA images from Landsat 5 and Landsat 8 satellites containing common bands of blue, green, red, NIR, and two short-wave infrared bands (SWIR1 and SWIR2) with a spatial resolution of 30 m were combined in this study. We used the TOA images from May to October as the original dataset. To fully use all available images, annual cloud-free composites were created for each city, specifically applying the “SimpleCloudScore” algorithm [29,30] to the TOA data. This algorithm assesses pixel quality by combining indices such as the Normalized Difference Snow Index (NDSI), brightness, and temperature to produce a minimum cloud image covering the study area from 2000 to 2020.
Here, because the land use information used to evaluate ILU in this case is primarily built-up land, only “built-up land” and “not built-up land” were labeled as samples in the classification process. According to previous studies [9,31], the NTL data can be used to select samples for both “built-up land” and “not built-up land”, assuming that pixels with illumination are related to artificial structures that emit light. Obviously, this sample selection strategy is convenient and avoids the past labor-intensive manual selection of samples. Due to the study’s long time series, a single NTL product could not cover the whole study period, so we employed two types of NTL products. For the period 2000–2010, the DMSP/OLS nighttime lighting time series dataset was used. For the period 2015–2020, the VIIRS nighttime light dataset was used. The two products were projected uniformly and resampled to 500 m to maintain spatial resolution consistency. After selecting the samples based on the NTL data, the samples were checked and modified via Google Earth to avoid problems with sample selection. We used 70% of the samples for training and the remaining 30% for validation.
In this paper, some socio-economic indices (Table 1) were selected based on the Pressure–State–Response (PSR) theoretical framework, while combining land use information to form a new evaluation system for the ILU level. The data format and precision were all standardized.

2.3. Methods

2.3.1. Google Earth Engine (GEE) Platform

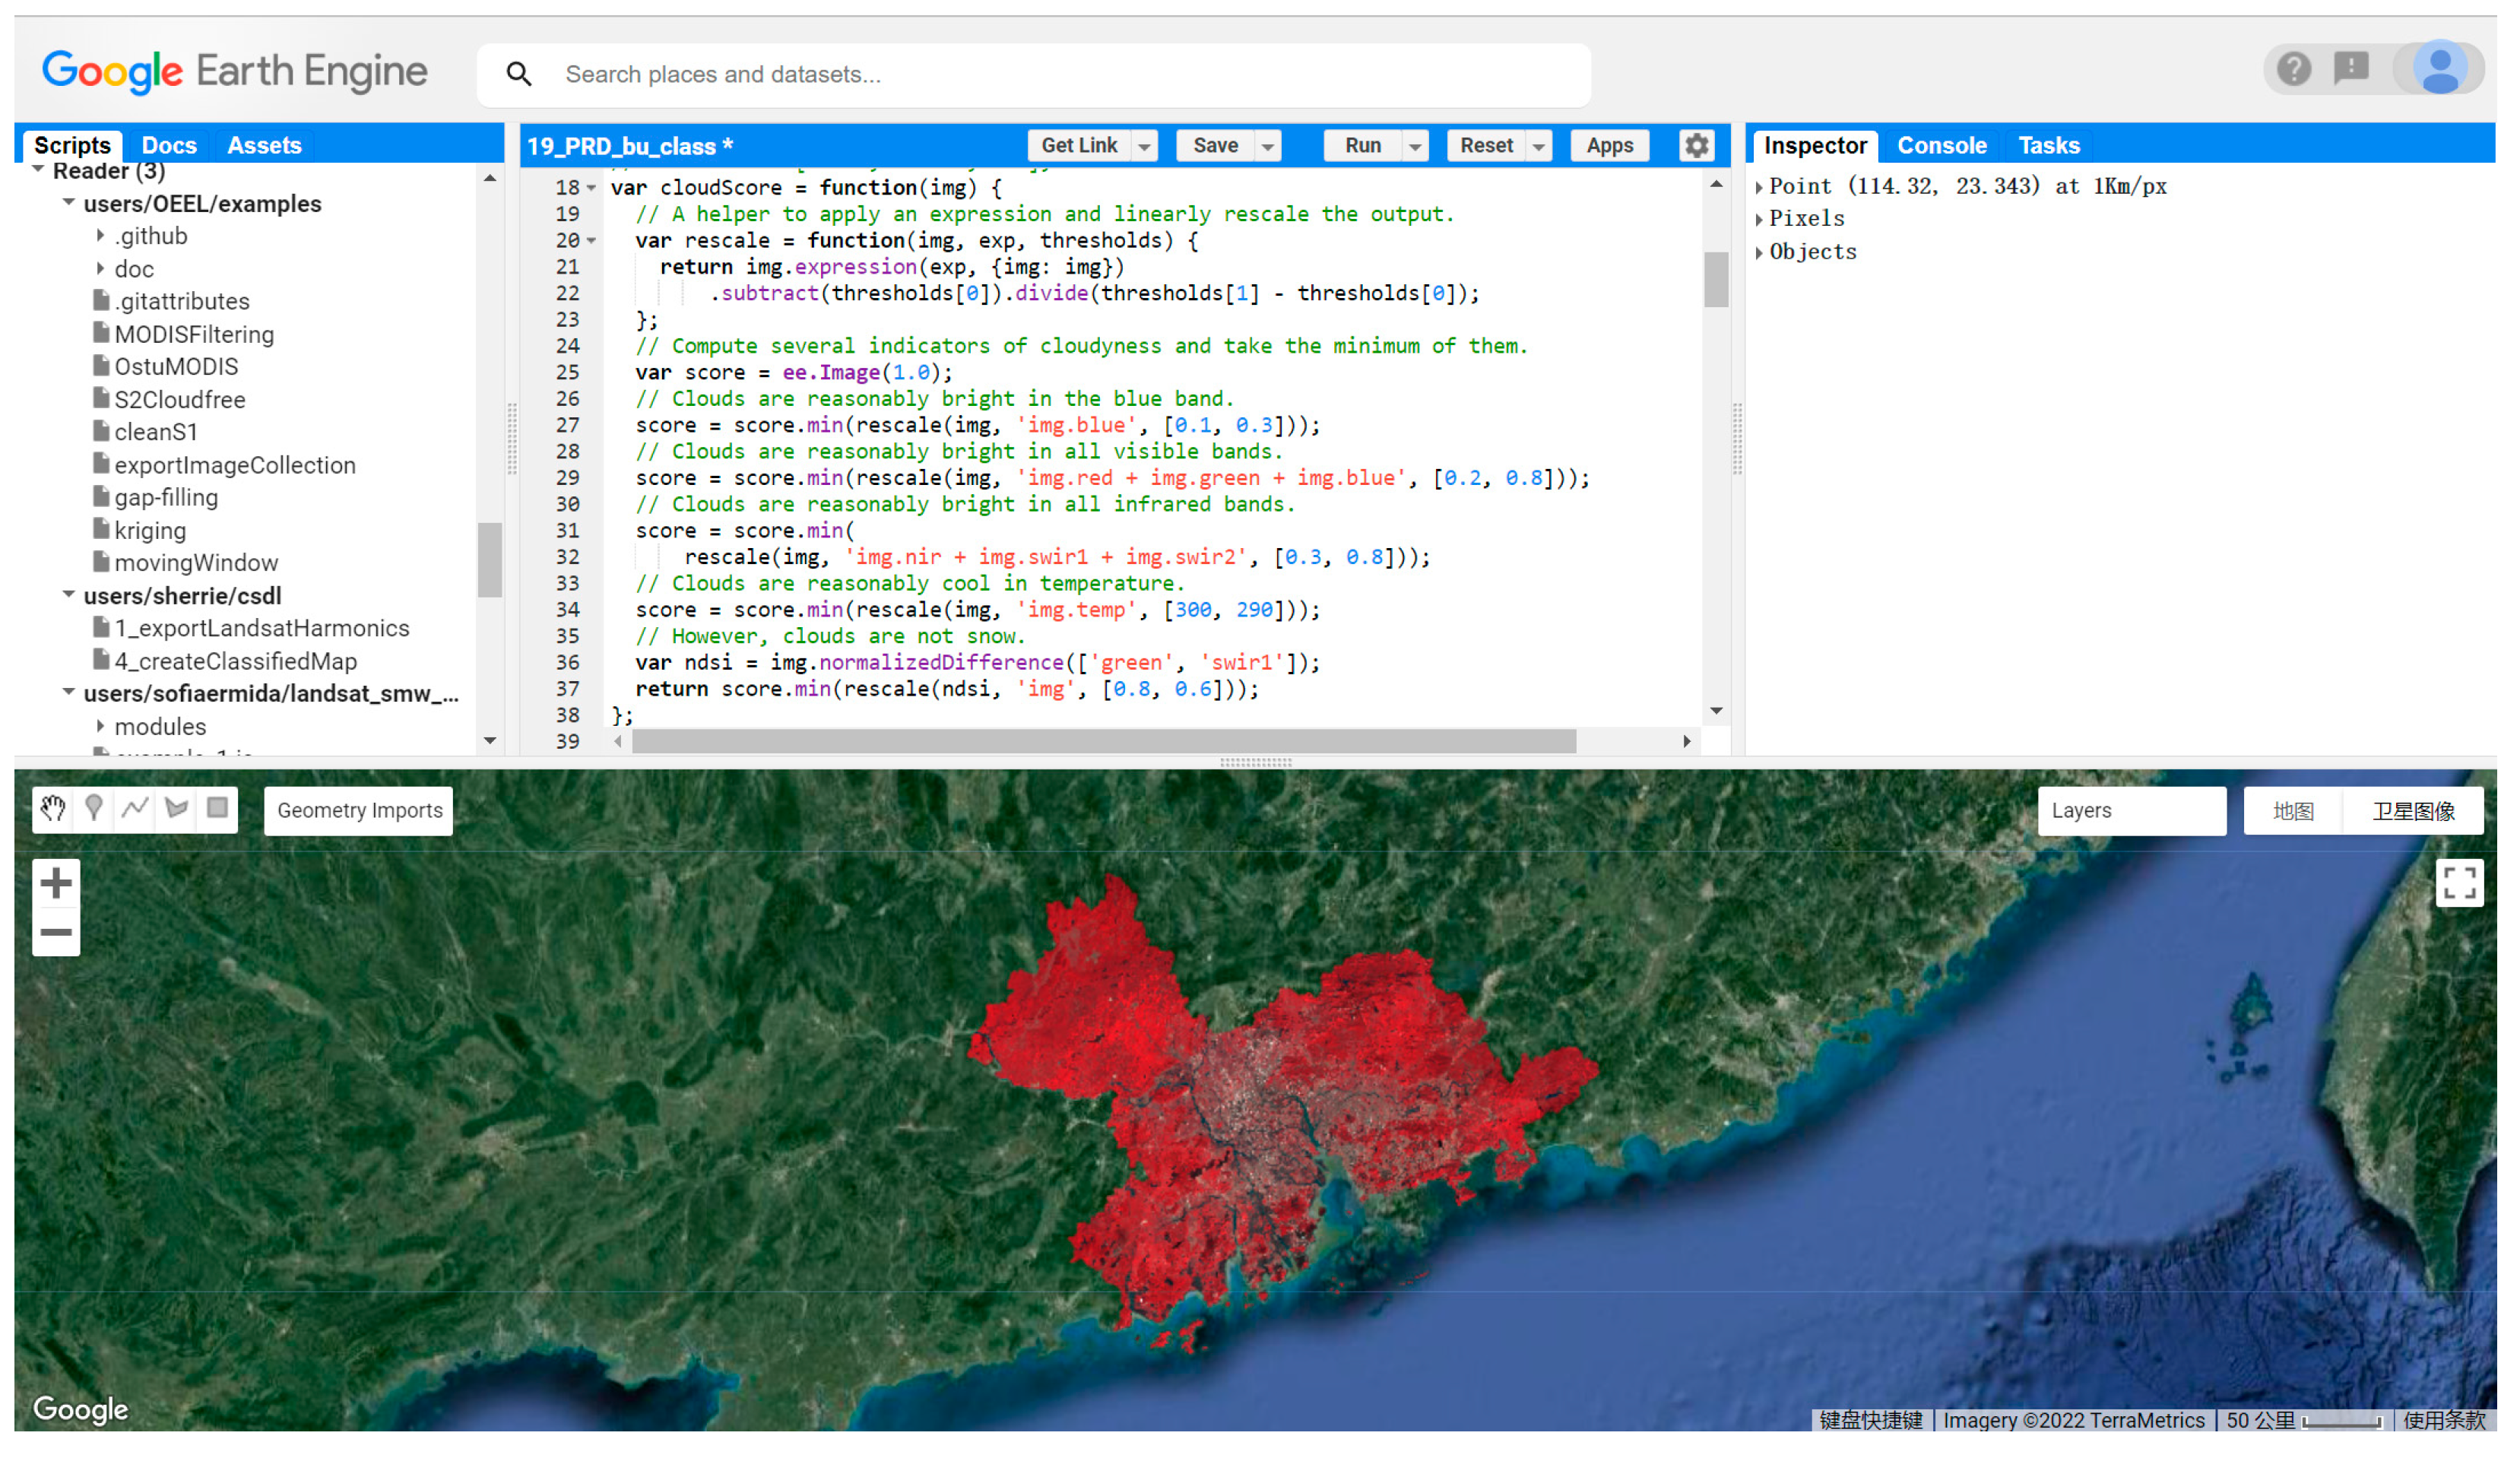
GEE is made up of a massive catalog of multi-source satellite image data as well as powerful cloud computing capabilities [32]. Users can access the Internet-accessible application programming interface (API) through an interactive web-based development environment (Figure 3). Specifically, they can access all data in the catalogue or upload private data to the cloud platform, and then use the computing power of the platform to complete computational tasks such as land use classification [33], surface temperature estimation [34], and so on. It is worth noting that GEE accounts are allocated space for uploading data as well as a rich set of code examples, with output results that can be downloaded for offline use.

2.3.2. Random Forest Classifier

The random forest (RF) algorithm is based on the synthesis of decision tree classifiers, and its final result is obtained by voting after each tree has given a result. Its accuracy is higher than other prevalent algorithms (e.g., SVM or kNN) in many previous applications [35,36,37]. RF is currently one of the most widely used land cover classification algorithms [29,30,38]. Furthermore, RF is a machine learning algorithm built into the GEE platform. As a result, we chose RF to obtain built-up land information.
Based on previous research [39,40] and the data collected, we chose 9 features as input features, comprising five spectral features, i.e., the blue, green, red, NIR, and SWIR1 bands; one textural feature, namely Geary’s C coefficient [41] (Equation (1)); and three spectral indices, i.e., NDVI [42], MNDWI [43], and NDBI [44] (Equations (2)–(4)).
C i ( d ) = ( n 1 ) i = 1 n j = 1 n w i j ( x i x j ) 2 2 i = 1 n j = 1 n w i j i = 1 n ( x i x ¯ ) 2
where wij is the spatial weight matrix between elements I and j, d is the distance, and xi and xj are the characteristics of elements i and j, respectively. In this paper, texture feature was extracted by selecting the NIR band, because it is more sensitive to the built-up land.
N D V I = N I R R E D N I R + R E D
M N D W I = G R E E N S W I R 1 G R E E N + S W I R 1
N D B I = S W I R 1 N I R S W I R 1 + N I R
where NIR, RED, GREEN, and SWIR1 are the reflectance values for the near infrared, red, green, and shortwave infrared bands of the images, respectively.
Overall accuracy (OA) and the Kappa coefficient are two commonly used accuracy evaluation measures that indicate the quality of classification results. The OA and Kappa equations are as follows:
OA = i = 1 k x i i x
Kappa = x i = 1 k x i i i = 1 k x i * x * i x
where xii is the number in row i and column i of the matrix, x is the total number of validation samples, and xi* and x*i are the total number of samples in row i and column i, respectively.

2.3.3. Construction of the Evaluation Index System

The principle of the PSR framework is that the various management activities conducted by the city for its own growth have either a positive or negative influence (pressure) on the environment of sustainable development. In response to pressure, the government or social groups take actions to regulate, which can repress pressure while changing the state of the system. This process is the “Pressure–State–Response” cycle.
Considering that ILU is more than just high-intensity input and high-efficiency output, its aim is to achieve the coordinated development of various factors, such as the economy and society. As a result, we constructed an evaluation index system for ILU using the PSR framework. By referring to the related studies [3,4,5,6,7,8,10,45] and the study area conditions, we adequately selected the indices that are representative and accessible. In total, there are 11 indices chosen for the evaluation, shown in Table 1.

2.3.4. Entropy Weighting Method

The entropy weighting method determines weights based on the dispersion of index values, which is relatively objective compared to other methods. Hence, this paper refers to the steps of previous studies [9,46] to calculate the indices’ weights. The steps are as follows:
(1) The index data should be processed as dimensionless to normalize the extreme differences, and this step can eliminate the dimension’s influence. The j-th index for the i-th city in the λ-th year can be expressed in terms of xλij (1 ≤ λh, 1 ≤ im, 1 ≤ jn; in this paper, h, m, and n are 5, 9, and 11, respectively). Equation (7) is used to normalize the positive indices, and Equation (8) is for the negative indices. Equation (9) is used to normalize all the Xλij values.
X λ i j = x λ i j x m i n x m a x x m i n
X λ i j = x m a x x λ i j x m a x x m i n
P λ i j = X λ i j λ = 1 h i = 1 m X λ i j
where Xλij denotes the value of xλij after the standard normalization of the extreme deviation, and Pλij denotes the normalized value of Xλij.
(2) Determine the entropy value of each index, where k = 1/ln(h·m):
E j = k λ = 1 h i = 1 m P λ i j ln P λ i j
(3) Calculate the entropy redundancy for each index and the corresponding weight:
D j = 1 E j
W j = D j j = 1 n D j
(4) Determine the ILU degree for each city and year:
S λ i = j = 1 n P λ i j W j

2.3.5. Dominant Factor Detection by Geodetector

Geodetector, a statistical tool proposed by [47], is a set of methods for revealing homogeneity and detecting the influencing forces behind it. This tool is based on the premise that the spatial distribution of the independent and dependent variables should have similar characteristics if the independent variables significantly influence the dependent variables. In detail, according to the spatial distributions of these data, the tool can not only measure the relationship between Y (geographical phenomenon) and X (influencing factor), but also investigate the interaction relationship between two influencing factors (X1 and X2) to the Y, without making any assumptions about the linearity of the association. We primarily used the Factor Detector module to detect the influencing process, which quantifies the X’s explanatory power to the Y via the q value, as shown below:
q = 1 1 σ 2 H i = 1 m n D , i σ 2 H D , i
where q is the explanatory power of factor D on ILU H, σ2 is the variance of the overall study target’s degree, n is the amount of cities, m is the amount of sub-areas, and σ2HD,i is the variance of the sub-area’s degree. q is in the range [0, 1], and the higher the q value, the greater the explanatory power of this factor.

3. Results

3.1. Land Use Classification Results Based on the GEE Platform

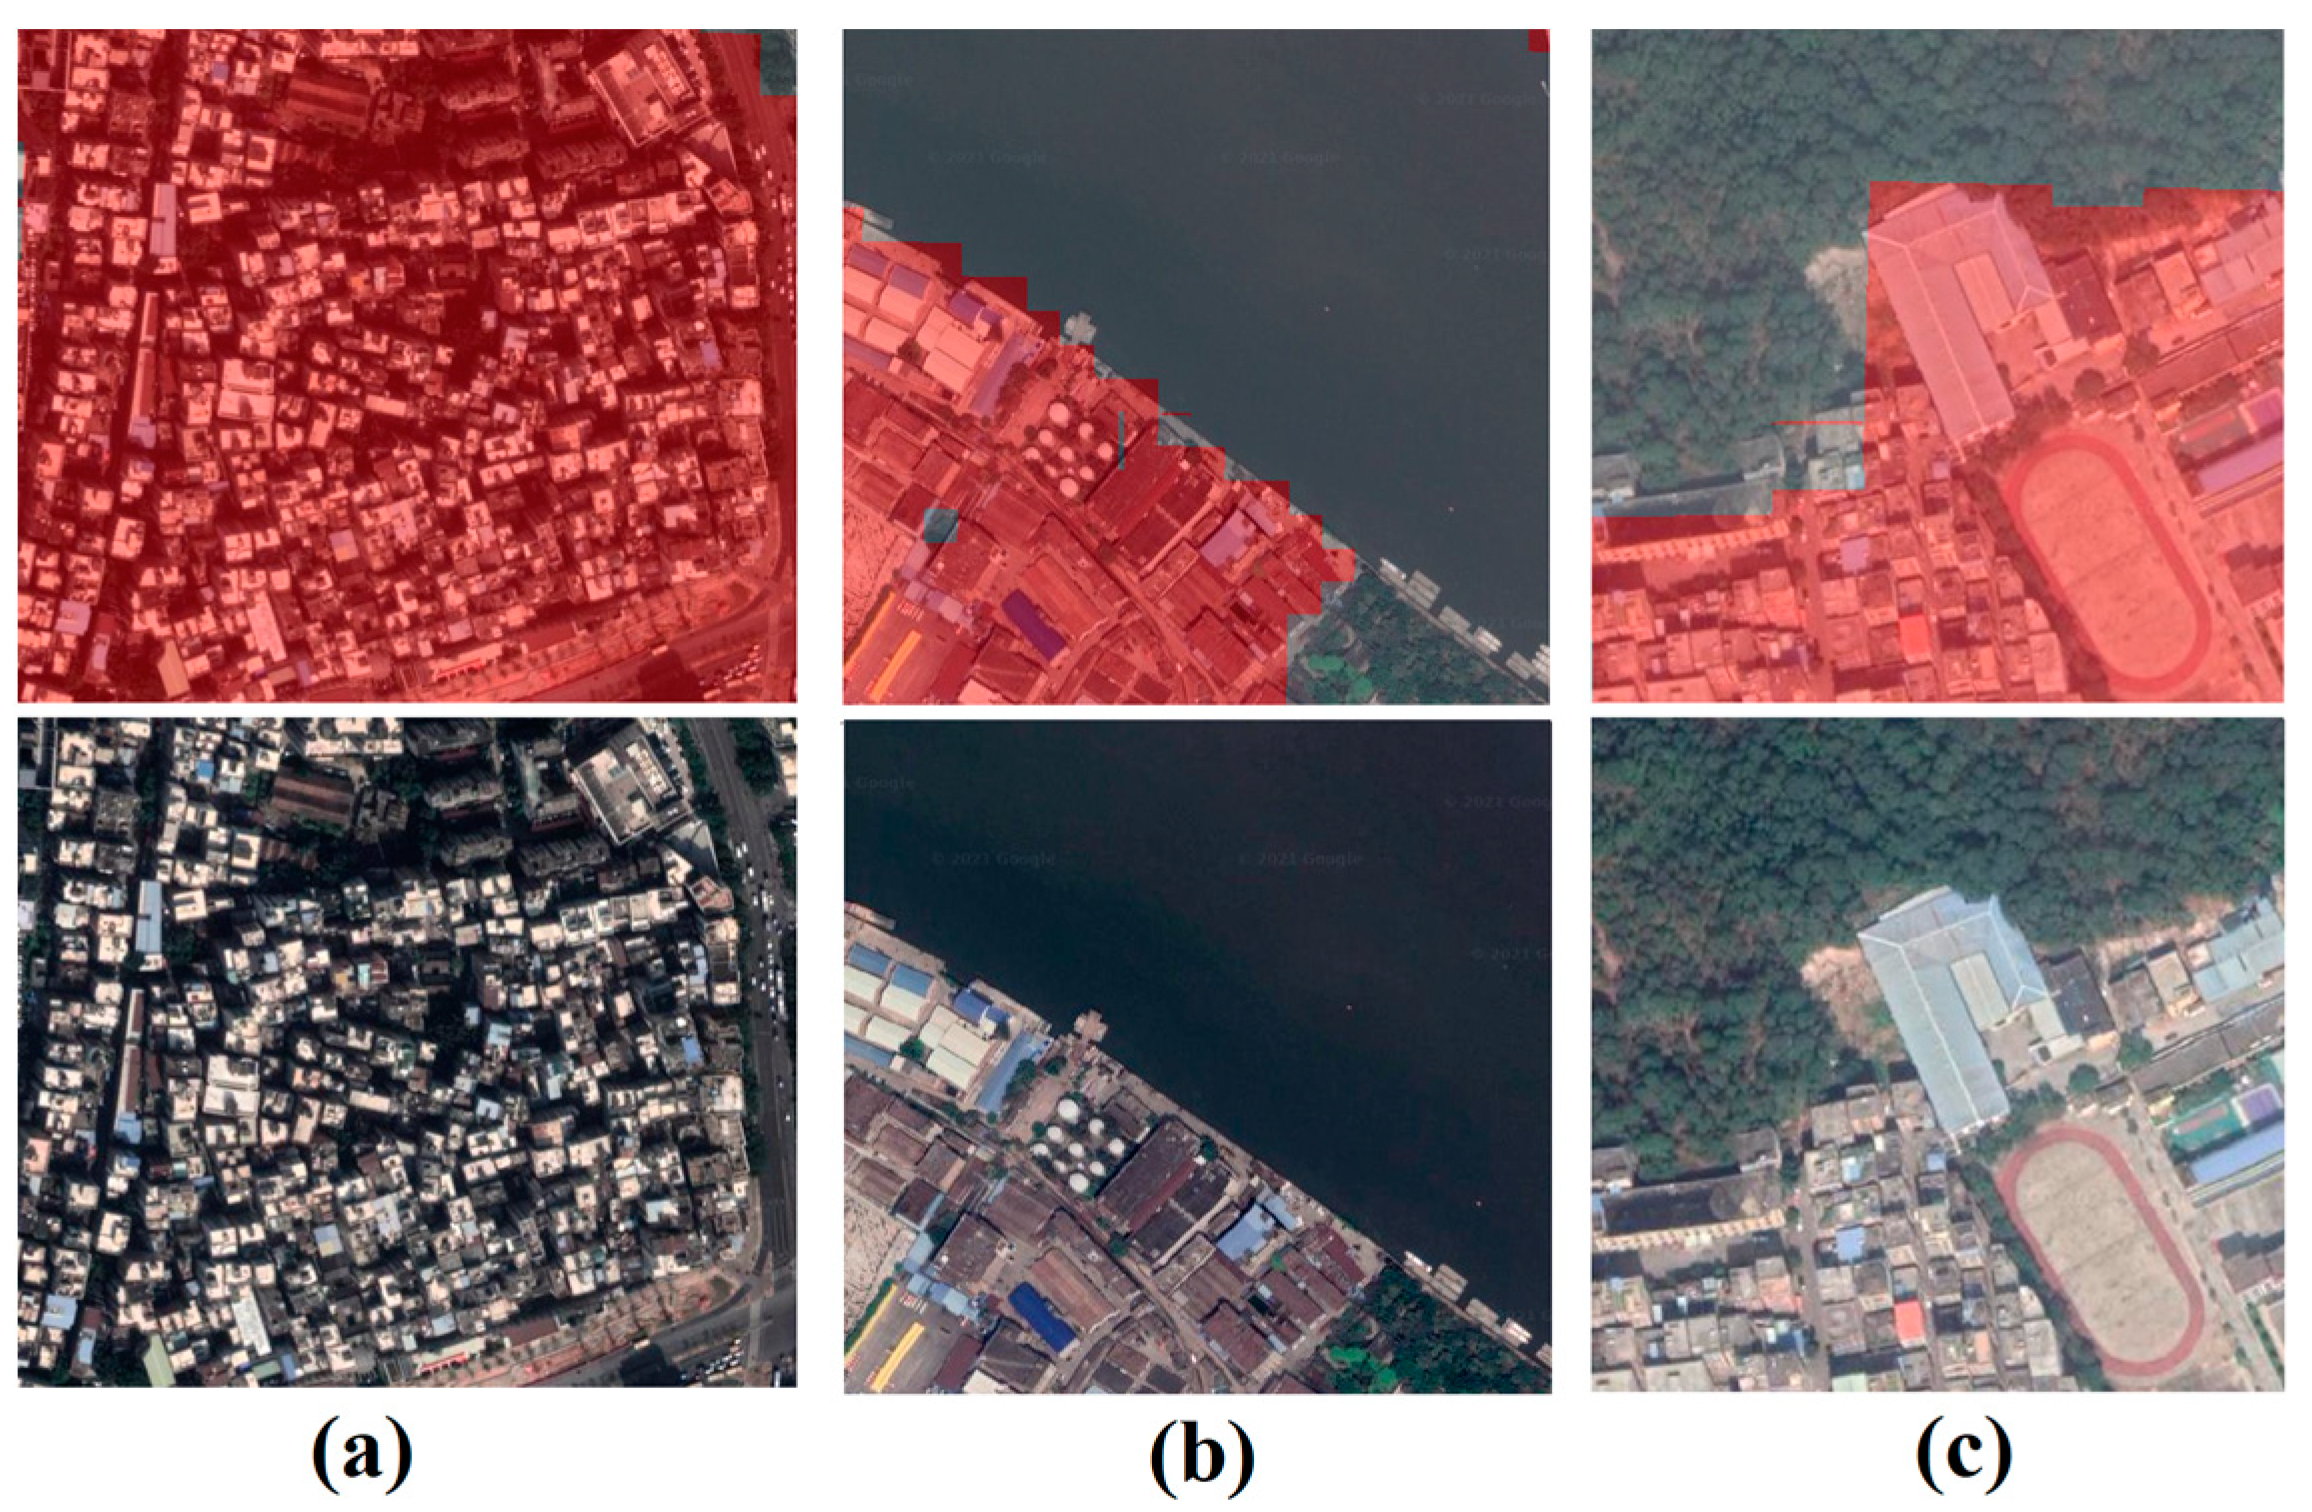
Since the built-up and non-built-up land classification results were obtained based on the GEE platform, we chose three localities to compare and check the classification results (Figure 4). The transparent red parts of Figure 4 in the first row show the precisely extracted build-up land sites, which include tall buildings, rural dwellings, and other building sites.
The accuracy results of the cities of the PRD region during 2000–2020 can be calculated through validation, with the OA among all classification results exceeding 80% and the Kappa coefficient ranging from 0.70 to 0.83. These precision results indicate that the classification performance meets the study’s research needs. Figure 5 depicts the area of built-up land for each city from 2000 to 2020. It shows that the built-up land area has risen steadily over the past 20 years, but the amount of built-up land growth clearly varies by city. Foshan has the largest increase in built-up land area of 650 km2, followed by Guangzhou, Dongguan, Huizhou, Shenzhen, Zhongshan, Jiangmen, Zhaoqing, and Zhuhai. Zhuhai has the smallest rise in constructed land area at 155 km2.

3.2. Spatial and Temporal Characteristics of ILU Changes in the Pearl River Delta

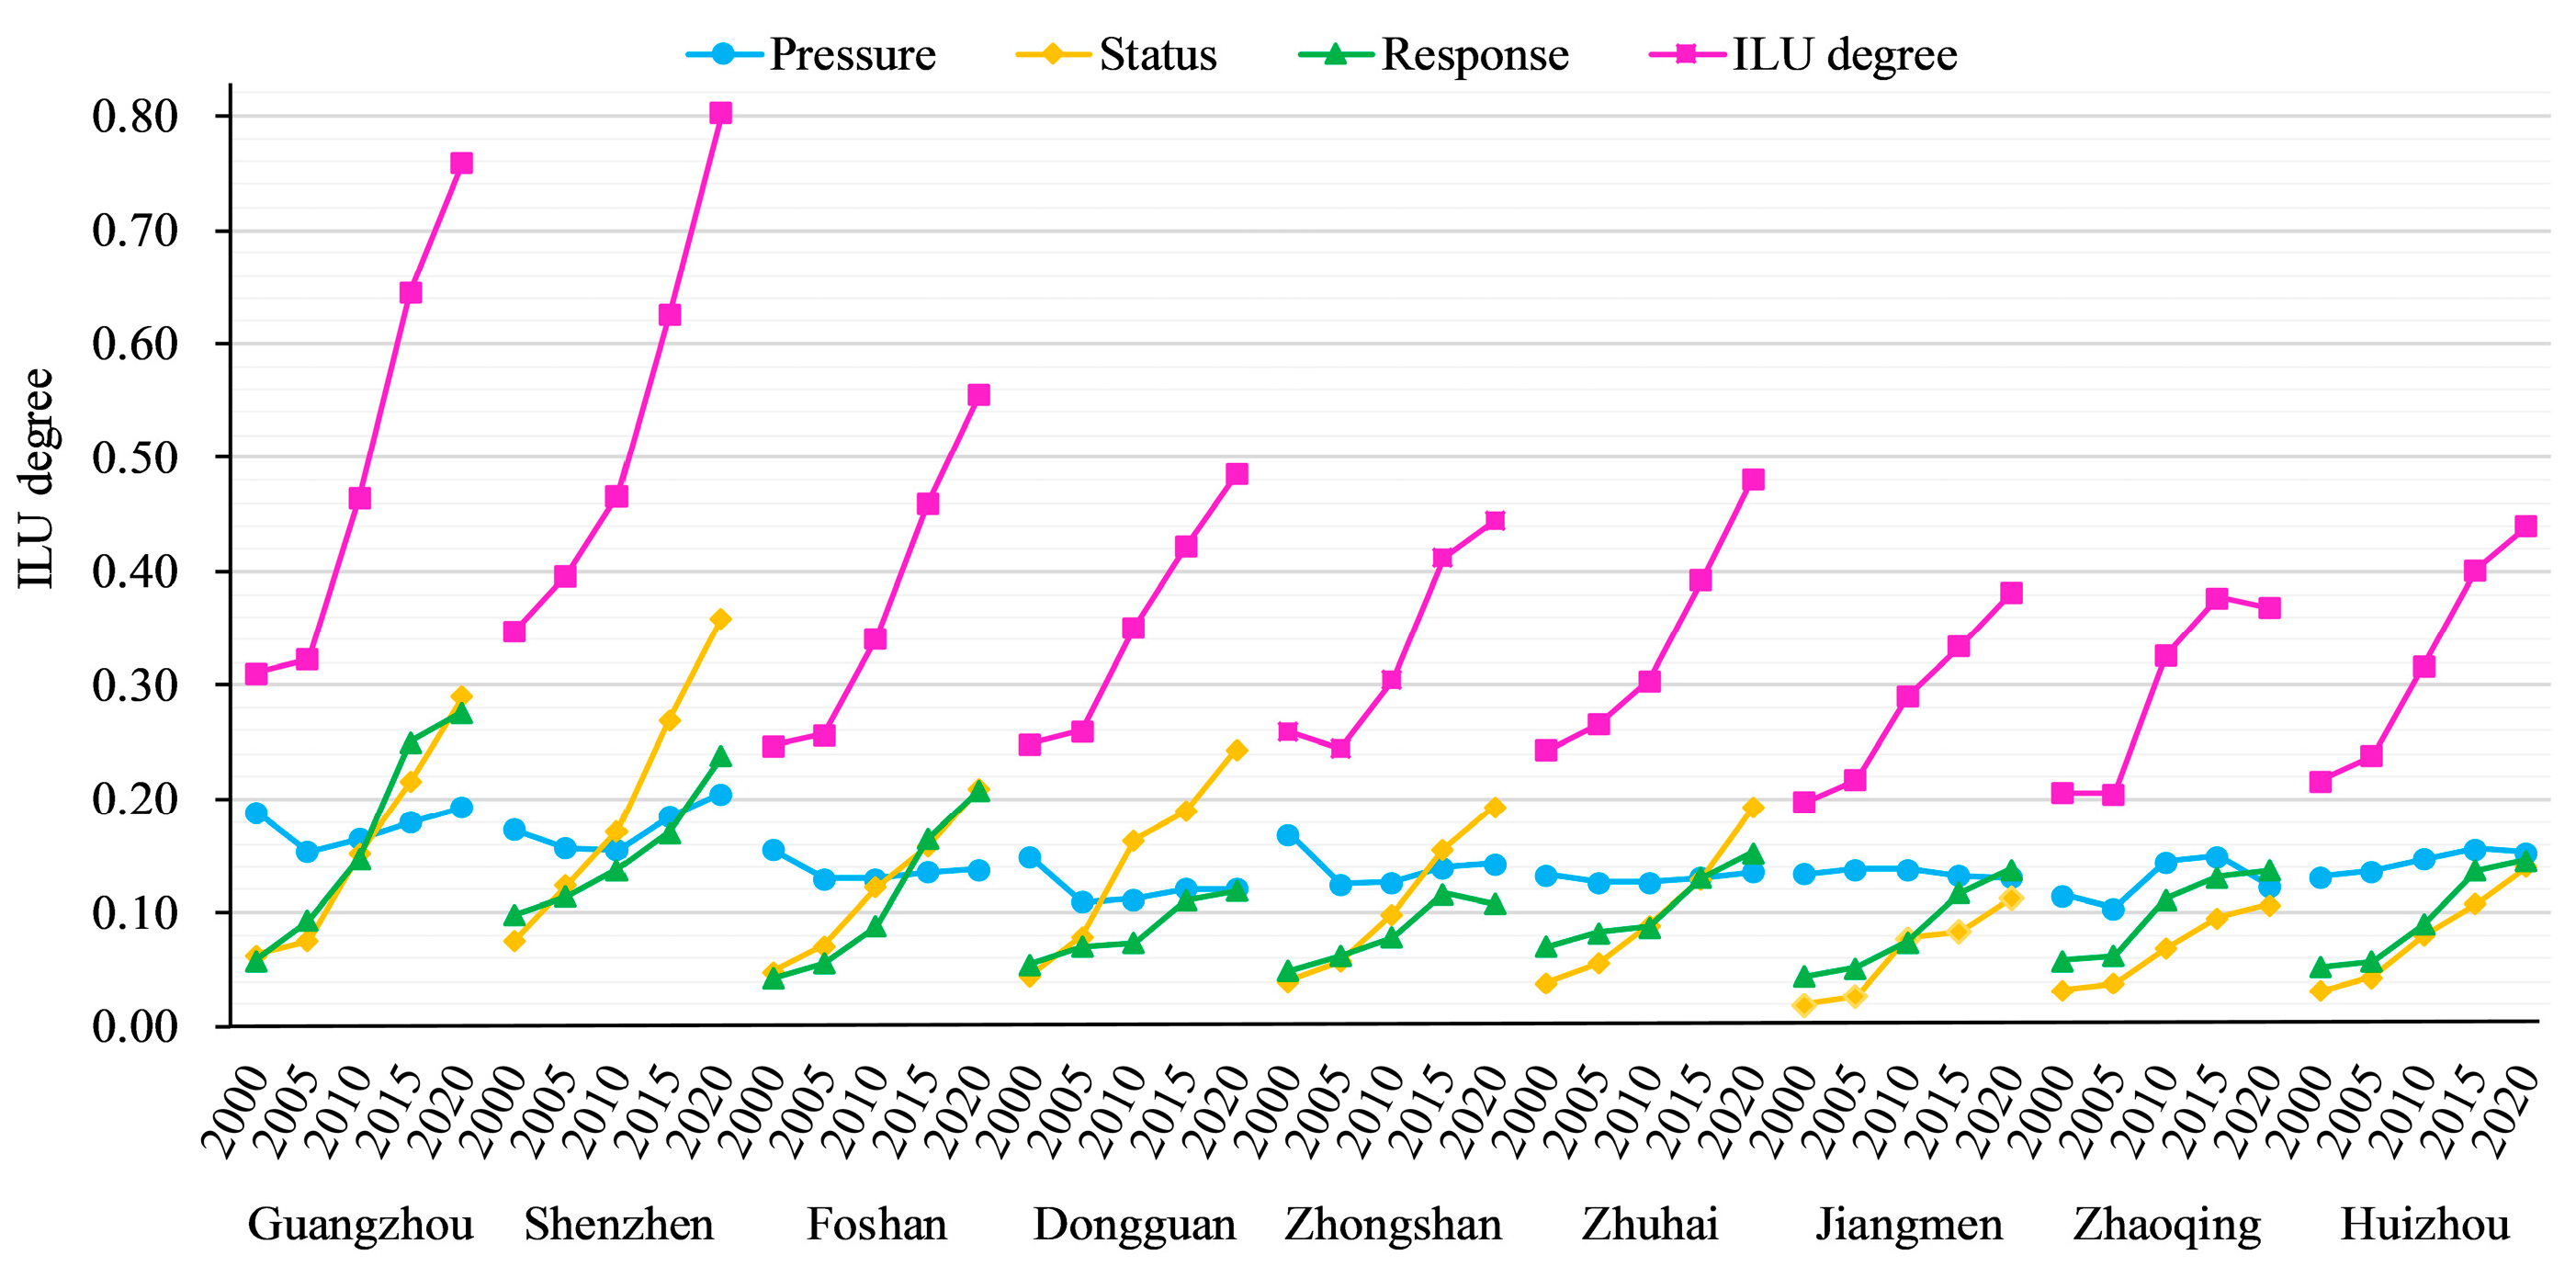
The calculated ILU result of each city in the PRD region for the period 2000–2020 are shown in Figure 6. Over the past 20 years, all of these cities have shown an overall ascending trend in ILU level, with most cities showing a continuous upward trend, but some cities also show a brief downward trend at one stage (e.g., Zhongshan and Zhaoqing). Among the nine cities, Shenzhen and Guangzhou have the highest levels of ILU, followed by Foshan, Dongguan, Zhuhai, Zhongshan, Huizhou, Jiangmen, and Zhaoqing. This ranking is generally in line with the traditional perception of the urban development level in the PRD region.
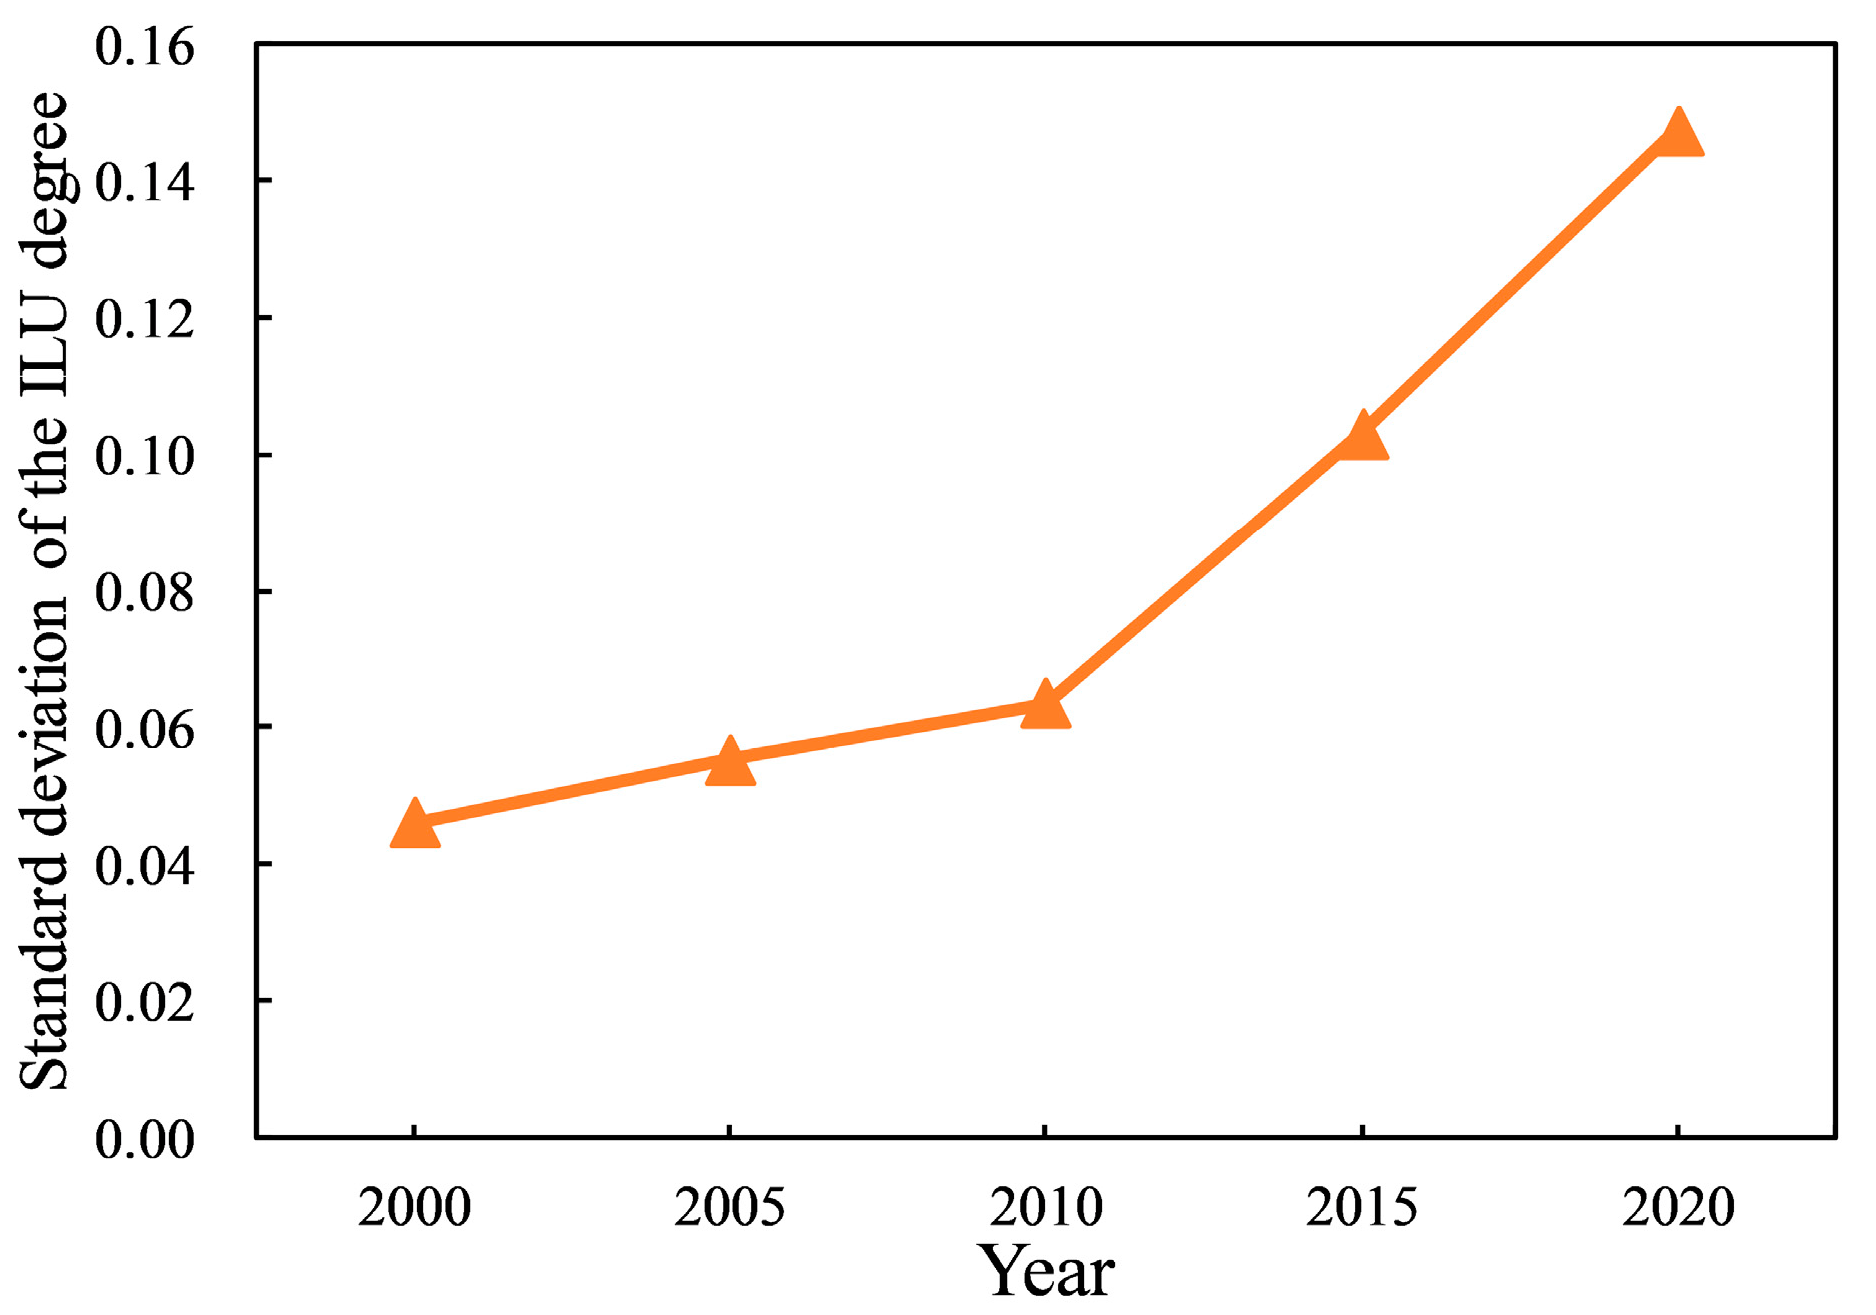
It is worth noting that while some cities have similar total ILU scores, they may not have grown differently in the pressure, state, and response tiers. For example, cities such as Guangzhou and Foshan achieve a high degree in the “Response” aspect. In contrast, cities such as Shenzhen and Dongguan rely mainly on the driving forces of the “State” aspect to improve their ILU levels. Jiangmen and Huizhou do not have high ILU degrees, but their scores in the three aspects are close. This reflects that different cities have their own development characteristics of ILU. The standard deviation was used to quantify the ILU variation between cities; the result is shown in Figure 7. These cities show an upward trend, and the variation within the PRD region has increased faster since 2010, reflecting the increasing spatial variation in ILU levels between cities over time.
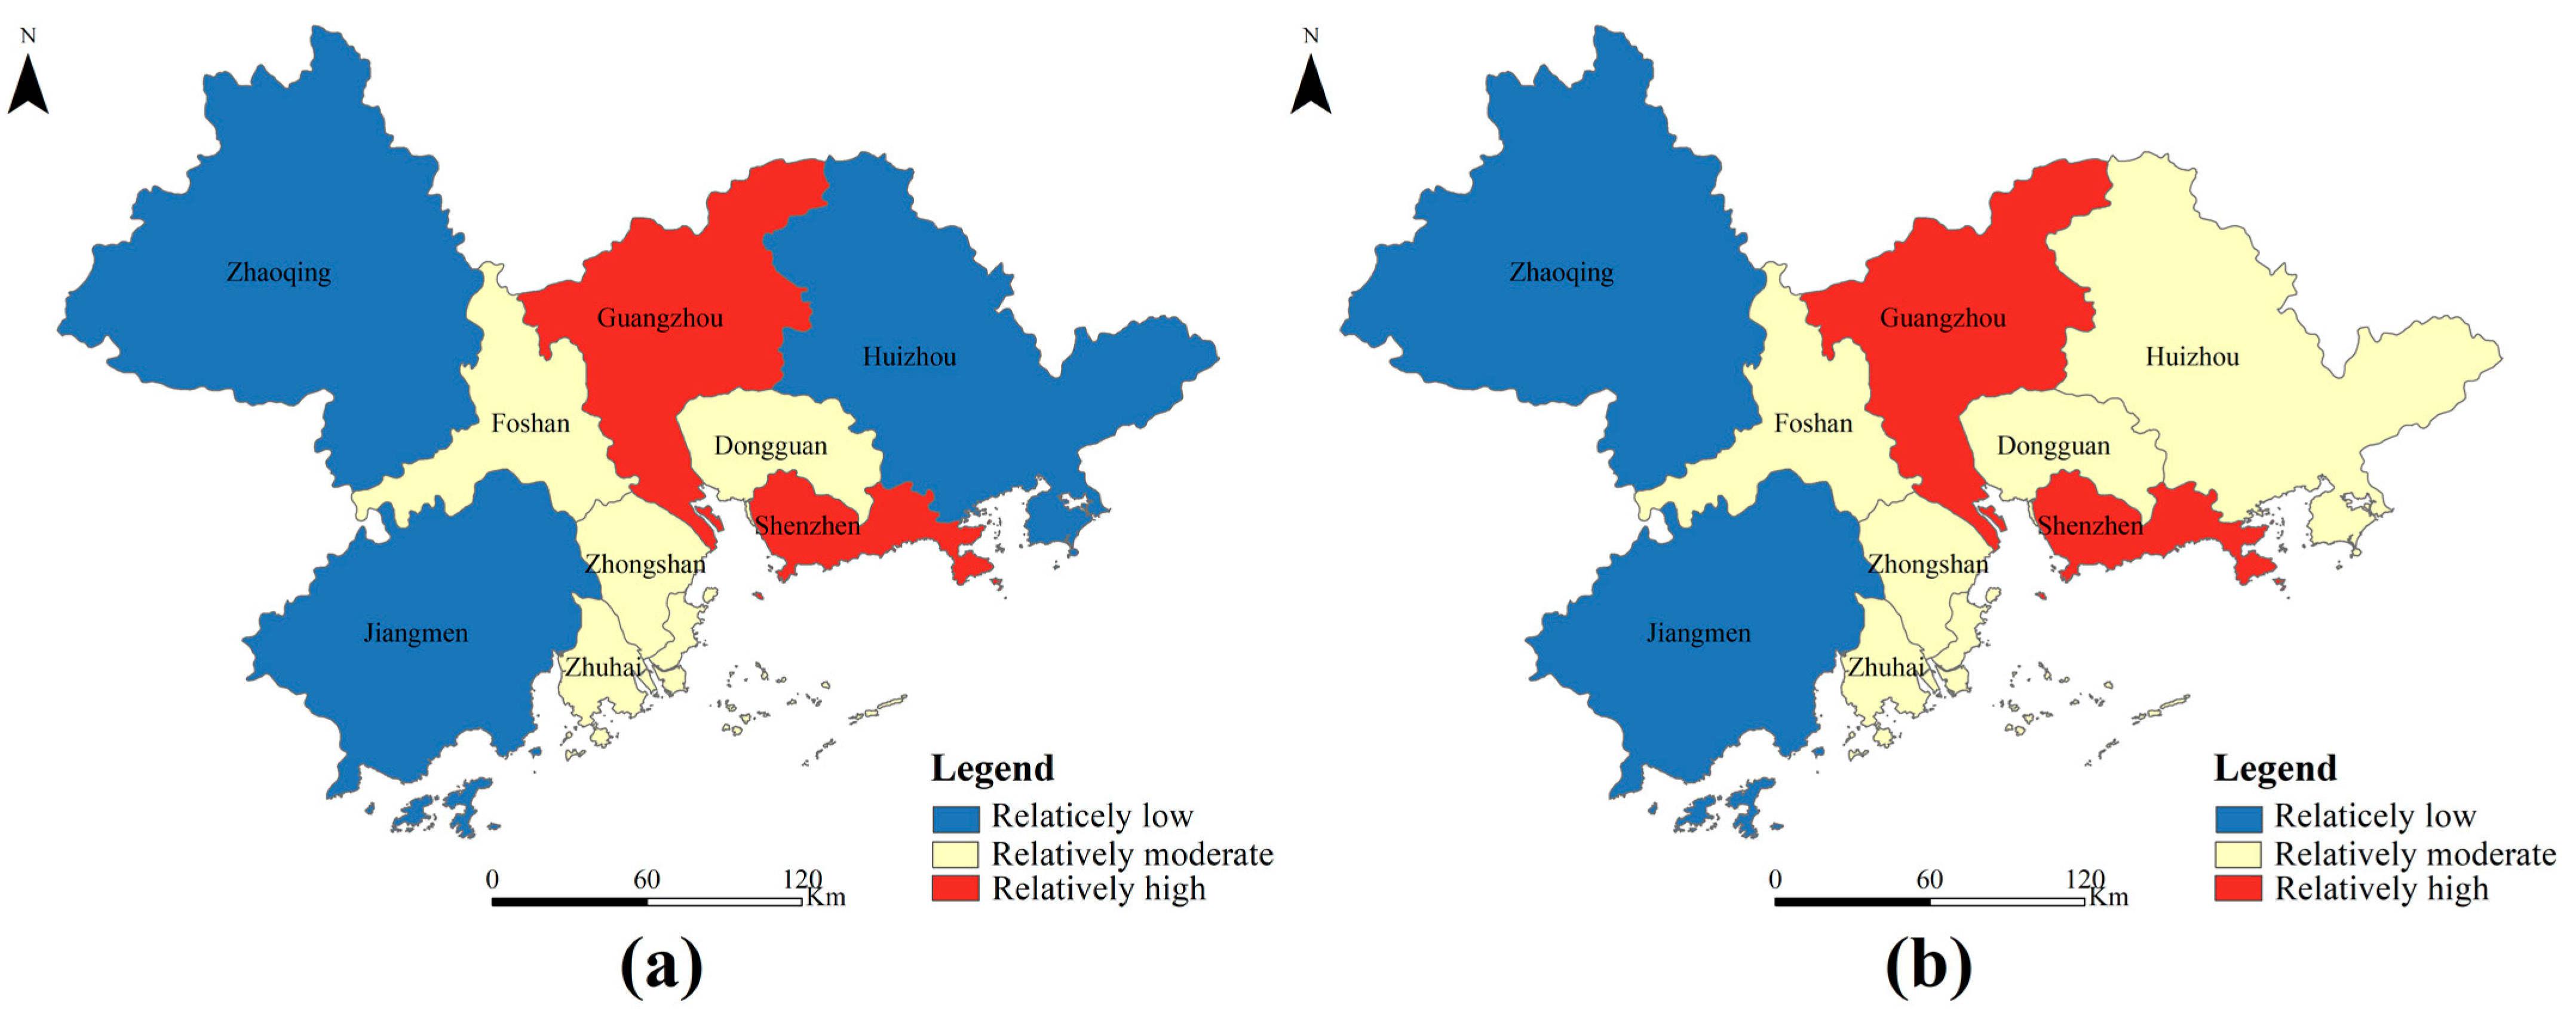
The distribution result of the cities’ ILU degrees in the PRD region in 2000 and 2020 is shown in Figure 8. We classified the ILU degree in the PRD region into three levels by the Jenks Natural Breaks method: relatively low, relatively moderate, and relatively high. It can be seen that the distribution in 2020 is basically the same as in 2000. Guangzhou and Shenzhen have been in a relatively high state, while Zhaoqing and Jiangmen have been in a relatively low state. The state that changed considerably over the 20-year period is Huizhou, which improved from a relatively low state to a relatively moderate state, indicating that Huizhou has made significant progress in its ILU level.
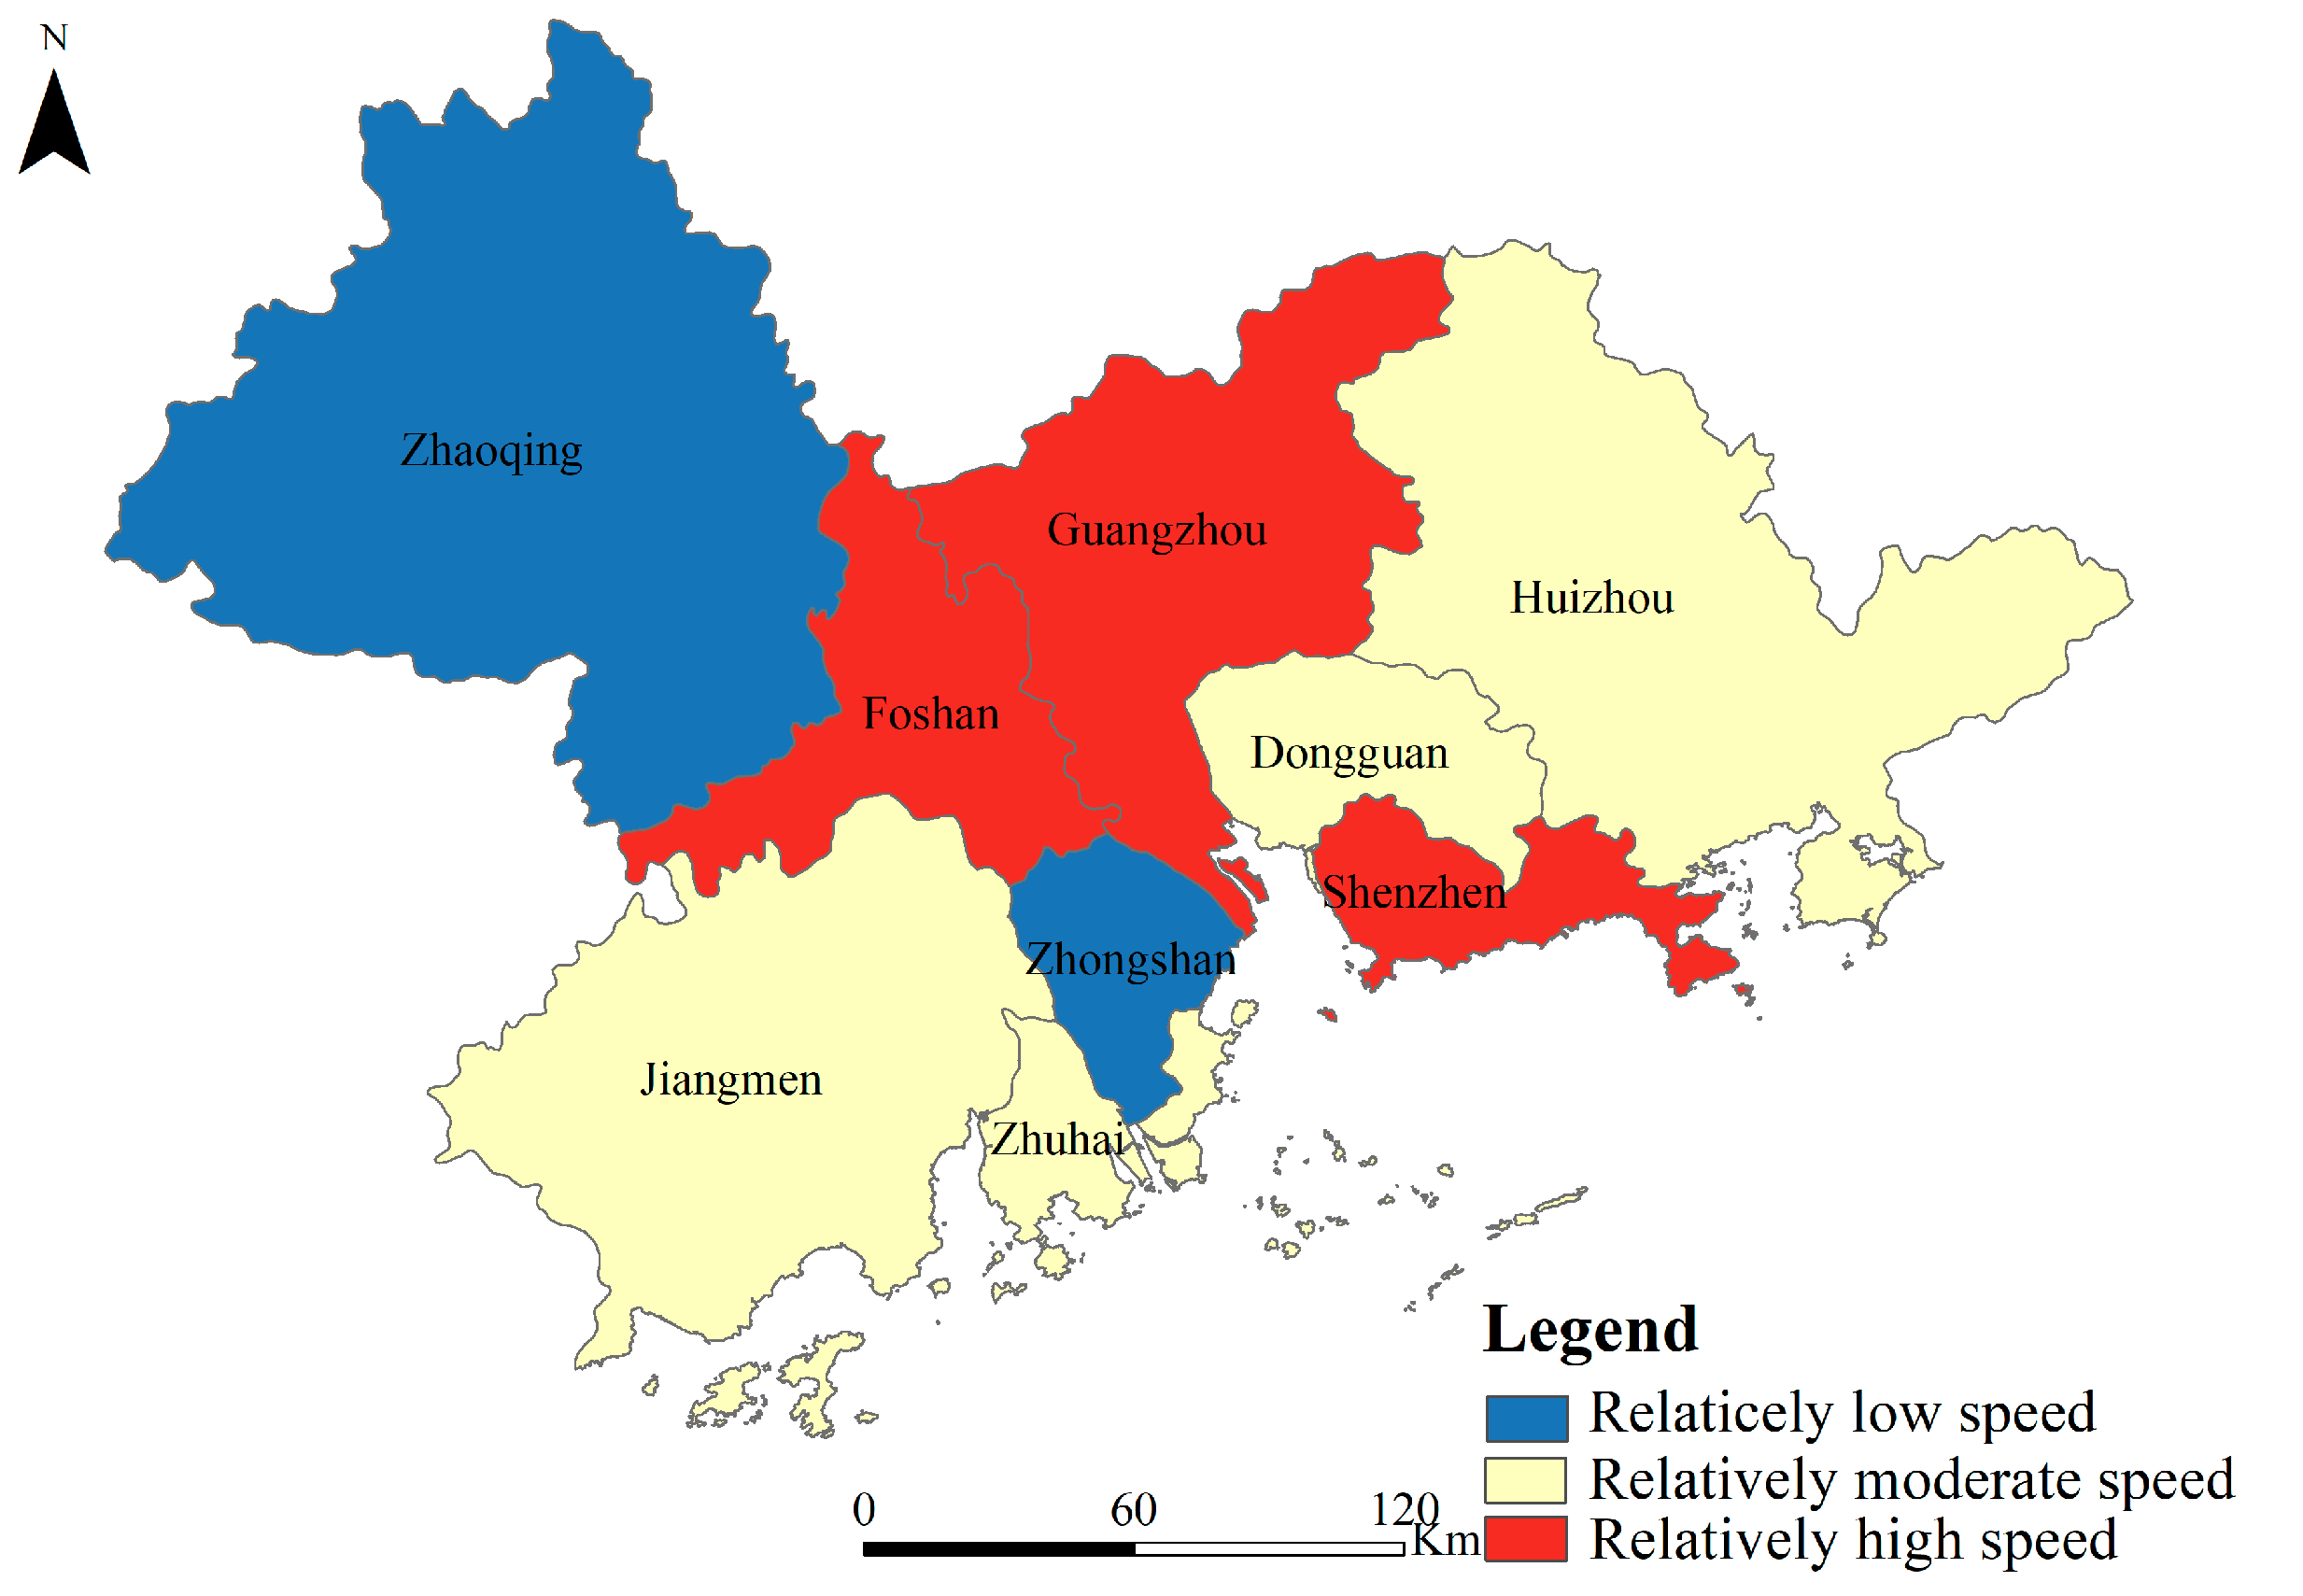
The distribution of the growth speed of ILU in the PRD region over the 20-year period is shown in Figure 9. From this result, Guangzhou, Shenzhen, and Foshan had a relatively high growth speed during this period, while Zhaoqing and Zhongshan had a relatively low growth speed, and the rest had a relatively moderate growth speed. Coincidentally, combined with the results of the ILU evaluation, it can be seen the three cities with relatively high growth speeds are the ones with the highest ILU levels now. It also can be seen that although Zhongshan has a relatively low growth speed, its ILU level is moderate among the PRD region’s cities, which is different from that of Zhaoqing.

3.3. Detection Results of Geodetector

To investigate the dominant factors influencing the PRD region’s ILU, we used the indices of the index system as influencing factors. We explored the dominant factor in the time dimensions using Geodetector.
We took the nine cities of the PRD region as a whole, then used Geodetector to explore the three dominant factors from different times (i.e., 2000, 2005, 2010, 2015, and 2020). The results are shown in Table 2. The dominant factors affecting ILU levels are clearly similar, but differences remain. In 2000, the factors that played a dominant role were S1 (q = 0.912), R1 (q = 0.815), and S3 (q = 0.799), which changed to R1 (q = 0.917), S3 (q = 0.904), and S1 (q = 0.898) in 2005, to R3 (q = 0.965), S1 (q = 0.939), and S3 (q = 0.780) in 2010, to S3 (q = 0.963), S1 (q = 0.947), and R3 (q = 0.917) in 2015, and back to S1 (q = 0.922), R1 (q = 0.872), and S3 (q = 0.695) in 2020, the same as in 2000. Among these factors, S1 and S3 dominate in all years, representing economic density and personal disposable income. R1 and R3, on the other hand, are the dominant factors influencing the ILU of the PRD region only in certain years, representing investment in fixed assets and electricity consumption per unit of GDP, respectively. It is worth noting that although the dominant factors of the PRD region are the same in 2000 and 2020, the q values of these factors are different.

4. Discussion

ILU serves as an important way to address the pressure of population growth and mitigate conflicts between people and land. It emphasizes the improvement of productivity per unit area of land and rational land use structure, layout, and ecological and environmental benefits, which are important factors in promoting industrial shifts and smart growth in cities [2,48]. We took the PRD region of China as the study object and carried out three aspects of work for analyzing ILU, namely data acquisition, scientific evaluation, and factor detection, aiming to provide references for the city’s industrial transformation and urban planning.
Combined with the extraction results in Section 3.1, it is clear that the GEE platform has potential for extracting land use information at urban agglomeration, national, or even global scales [20,21], which eliminates the previous workload of pre-downloading data to local computers. Therefore, we assessed the degree of ILU with GEE support, providing new ideas and theoretical references for the future assessment of ILU. The amount of growth in built-up area has varied across cities over the past 20 years, as shown in Figure 5. This includes Foshan, which had the largest increase in built-up area at 650 km2, surpassing Guangzhou and Shenzhen, the two cities with the highest ILU level, but its ILU level is not as high as the above two cities, suggesting that the land increment mode may not be able to sustainably raise the ILU level for cities. Furthermore, the application of the GEE platform is not limited to the built-up land, as the platform can also be used to extract information on other land use types (e.g., farmland [49]). This also provides a novel way to gauge the ILU of other objects.
From the evaluation results of the ILU degree in Figure 6, we find that Shenzhen (0.8028) has the highest ILU degree at this stage, followed by Guangzhou (0.7595), Foshan (0.5563), Dongguan (0.4859), Zhuhai (0.4813), etc. In detail, Shenzhen, Guangzhou, and Foshan have the largest increases in ILU degree, mainly in terms of “State” and “Response” aspects. At the same time, cities such as Jiangmen and Zhaoqing do not achieve a high level of ILU, mainly because their ILU degree comes mainly from the “Pressure” aspect. Specifically, the “Pressure” indices include P1 (population density) and P2 (proportion of built-up land). In contrast, the “State” aspect includes S1 (economic density) and S3 (personal disposable income), which implies that relying on routes such as raising population density or reducing the amount of built-up area to increase ILU has less impact than relying on the “State” indices. This is also confirmed by the results of the Geodetector (Table 2), as S1 and S3 are the two indices that have been playing a dominant role in ILU over the 20-year period. Still, there are no corresponding indices in the “Pressure” aspect that could play a dominant role. In addition, R1 (investment in fixed assets) and R3 (electricity consumption per unit of GDP) can also play dominant roles at some stages, but not as consistently as S1 and S2. This suggests that increasing the city’s economic output efficiency is favorable and sustainable for raising the ILU degree, which is similar to the findings of a previous study [9].
The ILU degree of the PRD region shows obvious spatial differences. Cities in the peripheral areas of the PRD region, such as Jiangmen and Zhaoqing, have relatively low levels of ILU, and they have relatively low growth speeds over the 20-year period. The core areas of the PRD region, such as Guangzhou, Shenzhen, and Foshan, have had a relatively high growth speed over the 20 year-period while maintaining a high level of ILU. This further amplifies the spatial variation in the ILU level in the PRD region, which is corroborated by Figure 7. The difference degree of ILU in the PRD region has increased about fivefold over 20 years. This phenomenon shows that although the ILU level of the cities in the PRD region has been increasing year by year, the differences among them in the region have also gradually become larger, as reflected in the gap between the core cities and the peripheral cities. To reduce the disparity in the ILU level of the PRD region, cities in the peripheral region should work to revitalize their urban land stocks, and encourage the upgrading and transformation of their industrial structures, particularly by transforming their land management mechanisms and increasing the economic output efficiency of land. Not all peripheral cities, however, have relatively poor ILU development performance. Huizhou, for example, has made significant progress in the past 20 years, rising from a relatively low ILU level in 2000 to a relatively moderate level today. This shows that economic and other variables in the central PRD region are gradually influencing the peripheral areas to drive regional development under the trend of industrial transfer and economic connections.
On a final note, some challenges warrant further research. One challenge is that only one urban agglomeration was selected as the study area in this work. To uncover the development of ILU at the urban agglomeration scale, we need to further select more urban agglomerations as the study area, e.g., the Beijing–Tianjin–Hebei urban agglomeration and the Yangtze River Delta urban agglomeration, which are also the most developed urban agglomerations in China. Another challenge is that the data used in this study are mainly from image data and statistical data. In addition, there are more clouds and rain in the PRD region, limiting the number of optical remote sensing images that can be used, and future research can combine with radar images and other data for a more accurate classification. New geographic data (e.g., POI data, Weibo check-in data), which are currently more popularly used, are not included in the study, which may limit the discovery of more valuable features in the development of ILU. Overall, under the development trend of building future smart cities, making full use of advanced technology (e.g., big data and ML) will provide scientific and effective support for the rational evaluation of ILU and intelligent planning for urban spaces.

5. Conclusions

We constructed an index system based on the Pressure–State–Response theoretical framework, extracted the built-up land information with GEE support, used the entropy weighting method to calculate the ILU degree by combining socio-economic statistics, and finally employed Geodetector to explore the dominant factors of the PRD region. In other words, we realized a complete framework for ILU research, including the process of extracting information, evaluating the ILU degree, and detecting dominant factors. The findings are as follows:
(1) Based on the powerful cloud computing capability and the rich satellite image data collected through the GEE platform, the built-up land use information can be extracted efficiently and accurately. The increase in a built-up area for each city is an inevitable trend in urban development. Still, the magnitude of the change varies among the cities in the PRD region. Foshan has the largest increase in built-up land, while Zhuhai has the smallest increase.
(2) Each city’s ILU level has shown an upward trend over the past 20 years. Still, there are differences in the ILU levels of different cities, spatially manifested as a gap between the core and peripheral regions. Specifically, Shenzhen had the highest ILU level in 2020, followed by core cities such as Guangzhou, Dongguan, and Zhuhai, while cities such as Zhaoqing and Jiangmen, which are in the peripheral region of the PRD region, have relatively low levels of ILU.
(3) In terms of the time dimension, the dominant factors affecting ILU in all cities have changed over two decades. The explanatory power of these dominant factors for the ILU degree has varied over time. However, two factors (i.e., economic density and disposable income per capita) have always played a dominant role in this period. Improving the economic output efficiency and the city’s economic strength is a feasible way to increase the ILU degree at the current stage.

Author Contributions

Conceptualization, D.L. and Y.S.; methodology, Y.S.; investigation, Y.S., D.L. and Y.C.; writing—original draft preparation, Y.S.; writing—review and editing, D.L.; supervision, D.L.; funding acquisition, D.L. All authors have read and agreed to the published version of the manuscript.

Funding

This research was funded by the Open Fund of Key Laboratory of Urban Land Resources Monitoring and Simulation, Ministry of Natural Resources (grant no. KF-2020-05-063).

Institutional Review Board Statement

Not applicable.

Informed Consent Statement

Not applicable.

Data Availability Statement

Not applicable.

Acknowledgments

We are particularly grateful to the academic editors and all reviewers for their critical comments or suggestions, which have had a significant impact on improving the quality of this manuscript.

Conflicts of Interest

The authors declare no conflict of interest.

References

  1. Ji, Y.; Guo, X.; Zhong, S.; Wu, L. Land Financialization, Uncoordinated Development of Population Urbanization and Land Urbanization, and Economic Growth: Evidence from China. Land 2020, 9, 481. [Google Scholar] [CrossRef]
  2. Peng, C.; Song, M.; Han, F. Urban economic structure, technological externalities, and intensive land use in China. J. Clean. Prod. 2017, 152, 47–62. [Google Scholar] [CrossRef]
  3. Wang, C.; Zhang, B.; Yao, S. The Evaluation of Urban Land Use Intensity and its Time-Spatial Differences in Shandong Province. China Popul. Resour. Environ. 2012, 22, 109–113. [Google Scholar]
  4. Duan, Y.; Fan, X.; Liu, J.; Hou, Q. Operating efficiency-based data mining on intensive land use in smart city. IEEE Access 2020, 8, 17253–17262. [Google Scholar] [CrossRef]
  5. Zhao, H.; Chen, C.; Hu, Z.; Li, L. Evaluation of intensive urban land use and analysis of obstacle factors in northern slope of Tianshan mountains. Trans. Chin. Soc. Agric. Eng. 2018, 34, 258–266. [Google Scholar]
  6. Chen, W.; Wu, Q. Evaluation of cultivated land intensive use considering land quality differences. Trans. Chin. Soc. Agric. Eng. 2013, 29, 244–253. [Google Scholar]
  7. Wang, J.; Sun, K.; Ni, J.; Xie, D. Evaluation and Factor Analysis of the Intensive Use of Urban Land Based on Technical Efficiency Measurement—A Case Study of 38 Districts and Counties in Chongqing, China. Sustainability 2020, 12, 8623. [Google Scholar] [CrossRef]
  8. Zhou, L.; Shi, Y.; Cao, X. Evaluation of Land Intensive Use in Shanghai Pilot Free Trade Zone. Land 2019, 8, 87. [Google Scholar] [CrossRef] [Green Version]
  9. Shang, Y.; Zheng, X.; Han, R.; Liu, W.; Xiao, F. Long-term evaluation on urban intensive land use in five fast-growing cities of northern China with GEE support. Sci. Rep. 2021, 11, 20734. [Google Scholar] [CrossRef]
  10. Qian, Q.; Liu, H.; Zheng, X. A Regional Sustainable Intensive Land Use Evaluation Based on Ecological Constraints: A Case Study in Jinan City. Sustainability 2019, 11, 1434. [Google Scholar] [CrossRef] [Green Version]
  11. He, Y.; Pang, Y.; Zhang, Q.; Jiao, Z.; Chen, Q. Comprehensive evaluation of regional clean energy development levels based on principal component analysis and rough set theory. Renew. Energy 2018, 122, 643–653. [Google Scholar] [CrossRef]
  12. Al Asbahi, A.A.M.H.; Gang, F.Z.; Iqbal, W.; Abass, Q.; Mohsin, M.; Iram, R. Novel approach of Principal Component Analysis method to assess the national energy performance via Energy Trilemma Index. Energy Rep. 2020, 5, 704–713. [Google Scholar] [CrossRef]
  13. Kazakis, N.; Kougias, I.; Patsialis, T. Assessment of flood hazard areas at a regional scale using an index-based approach and Analytical Hierarchy Process: Application in Rhodope-Evros region, Greece. Scirnce Total Environ. 2015, 538, 555–563. [Google Scholar] [CrossRef]
  14. Xu, G.; Yang, Y.-p.; Lu, S.-y.; Li, L.; Song, X. Comprehensive evaluation of coal-fired power plants based on grey relational analysis and analytic hierarchy process. Energy Policy 2011, 39, 2343–2351. [Google Scholar] [CrossRef]
  15. Zhao, D.; Li, C.; Wang, Q.; Yuan, J. Comprehensive evaluation of national electric power development based on cloud model and entropy method and TOPSIS: A case study in 11 countries. J. Clean. Prod. 2020, 277, 123190. [Google Scholar] [CrossRef]
  16. Jin, H.; Qian, X.; Chin, T.; Zhang, H. A Global Assessment of Sustainable Development Based on Modification of the Human Development Index via the Entropy Method. Sustainability 2020, 12, 3251. [Google Scholar] [CrossRef] [Green Version]
  17. Lu, J.; Wang, W.; Zhang, Y.; Cheng, S. Multi-Objective Optimal Design of Stand-Alone Hybrid Energy System Using Entropy Weight Method Based on HOMER. Energies 2017, 10, 1664. [Google Scholar] [CrossRef] [Green Version]
  18. Wang, C.; Jiang, Q.; Shao, Y.; Sun, S.; Xiao, L.; Guo, J. Ecological environment assessment based on land use simulation: A case study in the Heihe River Basin. Sci. Total Environ. 2019, 697, 133928. [Google Scholar] [CrossRef]
  19. Ghorbanian, A.; Kakooei, M.; Amani, M.; Mahdavi, S.; Mohammadzadeh, A.; Hasanloud, M. Improved land cover map of Iran using Sentinel imagery within Google Earth Engine and a novel automatic workflow for land cover classification using migrated training samples. ISPRS J. Photogramm. Remote Sens. 2020, 167, 276–288. [Google Scholar] [CrossRef]
  20. Liu, X.; Hu, G.; Chen, Y.; Li, X.; Xu, X.; Li, S.; Pei, F.; Wang, S. High-resolution multi-temporal mapping of global urban land using Landsat images based on the Google Earth Engine Platform. Remote Sens. Environ. 2018, 209, 227–239. [Google Scholar] [CrossRef]
  21. Stromann, O.; Nascetti, A.; Yousif, O.; Ban, Y. Dimensionality Reduction and Feature Selection for Object-Based Land Cover Classification based on Sentinel-1 and Sentinel-2 Time Series Using Google Earth Engine. Remote Sens. 2020, 12, 76. [Google Scholar] [CrossRef] [Green Version]
  22. Gong, Z.; Zhao, S.; Gu, J. Correlation analysis between vegetation coverage and climate drought conditions in North China during 2001–2013. J. Geogr. Sci. 2017, 70, 717–729. [Google Scholar] [CrossRef]
  23. Ferreira, A.R.L.; Fernandes, L.F.S.; Cortes, R.M.V.; Pacheco, F.A.L. Assessing anthropogenic impacts on riverine ecosystems using nested partial least squares regression. Sci. Total Environ. 2017, 583, 466–477. [Google Scholar] [CrossRef] [PubMed]
  24. Pradhan, B. Remote sensing and GIS-based landslide hazard analysis and cross-validation using multivariate logistic regression model on three test areas in Malaysia. Adv. Space Res. 2010, 45, 1244–1256. [Google Scholar] [CrossRef]
  25. Yin, Q.; Wang, J.; Ren, Z.; Li, J.; Guo, Y. Mapping the increased minimum mortality temperatures in the context of global climate change. Nat. Commun. 2019, 10, 4640. [Google Scholar] [CrossRef] [Green Version]
  26. Zuo, S.; Dai, S.; Song, X.; Xu, C.; Liao, Y.; Chang, W.; Chen, Q.; Li, Y.; Tang, J.; Man, W.; et al. Determining the Mechanisms that Influence the Surface Temperature of Urban Forest Canopies by Combining Remote Sensing Methods, Ground Observations, and Spatial Statistical Models. Remote Sens. 2018, 10, 1814. [Google Scholar] [CrossRef] [Green Version]
  27. Shrestha, A.; Luo, W. Analysis of Groundwater Nitrate Contamination in the Central Valley: Comparison of the Geodetector Method, Principal Component Analysis and Geographically Weighted Regression. ISPRS Int. J. Geo-Inf. 2017, 6, 297. [Google Scholar] [CrossRef] [Green Version]
  28. Yang, R.; Zhang, J.; Xu, Q.; Luo, X. Urban-rural spatial transformation process and influences from the perspective of land use: A case study of the Pearl River Delta Region. Habitat Int. 2020, 104, 102234. [Google Scholar] [CrossRef]
  29. Myroniuk, V.; Kutia, M.; Sarkissian, A.J.; Bilous, A.; Liu, S. Regional-Scale Forest Mapping over Fragmented Landscapes Using Global Forest Products and Landsat Time Series Classification. Remote Sens. 2020, 12, 187. [Google Scholar] [CrossRef] [Green Version]
  30. Wang, C.; Jia, M.; Chen, N.; Wang, W. Long-Term Surface Water Dynamics Analysis Based on Landsat Imagery and the Google Earth Engine Platform: A Case Study in the Middle Yangtze River Basin. Remote Sens. 2018, 10, 1635. [Google Scholar] [CrossRef] [Green Version]
  31. Goldblatt, R.; Stuhlmacher, M.F.; Tellman, B.; Clinton, N.; Hanson, G.; Georgescu, M.; Wang, C.; Serrano-Candela, F.; Khandelwal, A.K.; Cheng, W.-H.; et al. Using Landsat and nighttime lights for supervised pixel-based image classification of urban land cover. Remote Sens. Environ. 2018, 205, 253–275. [Google Scholar] [CrossRef]
  32. Gorelick, N.; Hancher, M.; Dixon, M.; Ilyushchenko, S.; Thau, D.; Moore, R. Google Earth Engine: Planetary-scale geospatial analysis for everyone. Remote Sens. Environ. 2017, 202, 18–27. [Google Scholar] [CrossRef]
  33. Lee, J.; Cardille, J.A.; Coe, M.T. BULC-U: Sharpening Resolution and Improving Accuracy of Land-Use/Land-Cover Classifications in Google Earth Engine. Remote Sens. 2018, 10, 1455. [Google Scholar] [CrossRef]
  34. Ermida, S.L.; Soares, P.; Mantas, V.; Goettsche, F.-M.; Trigo, I.F. Google Earth Engine Open-Source Code for Land Surface Temperature Estimation from the Landsat Series. Remote Sens. 2020, 12, 1471. [Google Scholar] [CrossRef]
  35. Gupta, V.K.; Gupta, A.; Kumar, D.; Sardana, A. Prediction of COVID-19 Confirmed, Death, and Cured Cases in India Using Random Forest Model. Big Data Min. Anal. 2022, 4, 116–123. [Google Scholar] [CrossRef]
  36. Guo, Q.; Zhang, J.; Guo, S.; Ye, Z.; Deng, H.; Hou, X.; Zhang, H. Urban Tree Classification Based on Object-Oriented Approach and Random Forest Algorithm Using Unmanned Aerial Vehicle (UAV) Multispectral Imagery. Remote Sens. 2022, 14, 3885. [Google Scholar] [CrossRef]
  37. Al-Mukhtar, M. Random forest, support vector machine, and neural networks to modelling suspended sediment in Tigris River-Baghdad. Environ. Monit. Assess. 2019, 191, 673. [Google Scholar] [CrossRef]
  38. Phan, T.N.; Kuch, V.; Lehnert, L.W. Land Cover Classification using Google Earth Engine and Random Forest Classifier—The Role of Image Composition. Remote Sens. 2020, 12, 2411. [Google Scholar] [CrossRef]
  39. Belgiu, M.; Drăguţ, L. Random forest in remote sensing: A review of applications and future directions. ISPRS J. Photogramm. Remote Sens. 2016, 114, 24–31. [Google Scholar] [CrossRef]
  40. Akbari, E.; Bolooran, A.D.; Samany, N.N.; Hamzeh, S.; Soufizadeh, S.; Pignatti, S. Crop Mapping Using Random Forest and Particle Swarm Optimization based on Multi-Temporal Sentinel-2. Remote Sens. 2020, 12, 1449. [Google Scholar] [CrossRef]
  41. Myint, S.W. Fractal approaches in texture analysis and classification of remotely sensed data: Comparisons with spatial autocorrelation techniques and simple descriptive statistics. Int. J. Remote Sens. 2003, 24, 1925–1947. [Google Scholar] [CrossRef]
  42. Zheng, B.; Myint, S.W.; Thenkabail, P.S.; Aggarwal, R.M. A support vector machine to identify irrigated crop types using time-series Landsat NDVI data. Int. J. Appl. Earth Obs. Geoinf. 2015, 34, 103–112. [Google Scholar] [CrossRef]
  43. Yang, J.; Du, X. An enhanced water index in extracting water bodies from Landsat TM imagery. Ann. GIS. 2017, 23, 141–148. [Google Scholar] [CrossRef]
  44. Bhatti, S.S.; Tripathi, N.K. Built-up area extraction using Landsat 8 OLI imagery. GIScience Remote Sens. 2014, 51, 445–467. [Google Scholar] [CrossRef] [Green Version]
  45. Cen, X.; Wu, C.; Xing, X.; Fang, M.; Garang, Z.; Wu, Y. Coupling Intensive Land Use and Landscape Ecological Security for Urban Sustainability: An Integrated Socioeconomic Data and Spatial Metrics Analysis in Hangzhou City. Sustainability 2015, 7, 1459–1482. [Google Scholar] [CrossRef] [Green Version]
  46. Liu, D.-j.; Li, L. Application Study of Comprehensive Forecasting Model Based on Entropy Weighting Method on Trend of PM2.5 Concentration in Guangzhou, China. Int. J. Environ. Res. Public Health 2015, 12, 7085–7099. [Google Scholar] [CrossRef] [Green Version]
  47. Wang, J.-F.; Li, X.-H.; Christakos, G.; Liao, Y.-L.; Zhang, T.; Gu, X.; Zheng, X.-Y. Geographical detectors-based health risk assessment and its application in the neural tube defects study of the Heshun Region, China. Int. J. Geogr. Inf. Sci. 2010, 24, 107–127. [Google Scholar] [CrossRef]
  48. Yin, G.; Lin, Z.; Jiang, X.; Yan, H.; Wang, X. Spatiotemporal differentiations of arable land use intensity—A comparative study of two typical grain producing regions in northern and southern China. J. Clean. Prod. 2019, 208, 1159–1170. [Google Scholar] [CrossRef]
  49. You, N.; Dong, J. Examining earliest identifiable timing of crops using all available Sentinel 1/2 imagery and Google Earth Engine. ISPRS J. Photogramm. Remote Sens. 2020, 161, 109–123. [Google Scholar] [CrossRef]
Figure 1. Research framework of this paper.
Sustainability 14 13284 g001
Figure 2. Spatial location of the study area.
Sustainability 14 13284 g002
Figure 3. The GEE interactive development environment (50 公里 = 50 km).
Sustainability 14 13284 g003
Figure 4. Local area comparison before and after classification of satellite images obtained from Landsat-8 OLI images from June to September of 2020. The extracted built-up land is shown in transparent red in the first row of the figure. (a) The local area of tall buildings, (b) the local area of building sites close to water, (c) the local area of rural dwellings.
Sustainability 14 13284 g004
Figure 5. Area of built-up land in each city during 2000–2020.
Sustainability 14 13284 g005
Figure 6. The ILU degree results for the PRD region over the period 2000–2020.
Sustainability 14 13284 g006
Figure 7. Overall degree of difference between cities of PRD region from 2000 to 2020.
Sustainability 14 13284 g007
Figure 8. Spatial distribution of ILU level in the PRD region in 2000 and 2020. (a) The result in 2000, (b) the result in 2020.
Sustainability 14 13284 g008
Figure 9. Distribution of the growth speeds of the PRD region between 2000 and 2020.
Sustainability 14 13284 g009
Table 1. Evaluation index system of ILU degree.
TypeIndexCharacterCodeCalculation Formula
PressurePopulation density *+P1Resident population/built-up land area
Proportion of built-up land *P2Built-up land area/city’s area
Output value proportion of secondary and tertiary industries+P3Output value of secondary and tertiary industries/GDP
StateEconomic density *+S1Output value of secondary and tertiary industries/built-up land area
Road network density+S2Total length of urban roads/city’s area
Personal disposable income+S3See statistics
Employee density *+S4Number of employee in secondary and tertiary industries/built-up land area
ResponseInvestment in fixed assets+R1See statistics
Public green space per capita+R2See statistics
Electricity consumption per unit of GDPR3See statistics
Industrial wastewater dischargeR4See statistics
Note: The index marked with * was calculated by extracting built-up land information from the GEE platform, while all other indices were derived from the statistical data. The “+” indicates a positive index, while the “−” indicates a negative index.
Table 2. Detection result of the dominant factor for each city.
YearDominant Factors
2000S1 (q = 0.912), R1 (q = 0.815), S3 (q = 0.799)
2005R1 (q = 0.917), S3 (q = 0.904), S1 (q = 0.898)
2010R3 (q = 0.965), S1 (q = 0.939), S3 (q = 0.780)
2015S3 (q = 0.963), S1 (q = 0.947), R3 (q = 0.917)
2020S1 (q = 0.922), R1 (q = 0.872), S3 (q = 0.695)
Publisher’s Note: MDPI stays neutral with regard to jurisdictional claims in published maps and institutional affiliations.