Article

Exploring the Applicability of the Unified Glare Rating for an Outdoor Non-Uniform Residential Luminaire

1
ESAT/Light&Lighting Laboratory, KU Leuven, Gebroeders De Smetstraat 1, 9000 Ghent, Belgium
2
IEIS/Human Technology Interaction, TU Eindhoven, De Zaale 1, 5600 MB Eindhoven, The Netherlands
*
Author to whom correspondence should be addressed.
Sustainability 2022, 14(20), 13199; https://doi.org/10.3390/su142013199
Submission received: 21 July 2022 / Revised: 16 September 2022 / Accepted: 11 October 2022 / Published: 14 October 2022
(This article belongs to the Special Issue Sustainable Outdoor Lighting)

Abstract

:
The Unified Glare Rating (UGR) and the modified version (UGR’) have been developed and widely accepted in multiple standards for measuring the discomfort glare of a luminaire in typical indoor environments; however, a standardized glare metric for non-uniform outdoor luminaires is still missing. In this paper, the possibility to apply UGR and UGR’ to an outdoor residential luminaire with a non-uniform spatial luminance distribution is explored. The luminaire was characterized in a large near-field goniophotometer (NFG) and luminance images were captured at four angles specified in the CIE 232:2019 document. Some practical issues of applying the UGR’ for a non-uniform residential luminaire are discussed, such as selecting the luminous area, the blurring parameter, the viewing angles, and the background luminance. In addition to these practical issues, possible solutions and suggestions are explored, such as a different blurring parameter, viewing angle, and background luminance. In the end, employing a human visual system to evaluate the amount of discomfort glare for both indoor and outdoor applications might be preferred.

1. Introduction

Discomfort glare from a light source or luminaire is defined by the International Commission on Illumination (CIE) as “glare that causes discomfort without necessarily impairing the vision of objects” [1]. Due to its importance in creating visually appealing lighting designs, discomfort glare has been studied extensively. Many different glare indices have been proposed, for example, the CIE Glare Index (CGI) [2], British Glare Index (BGI) [3,4], Visual Comfort Probability (VCP) [4,5,6], Glare Control Mark (G) [7], Cumulative Brightness Effect (CBE) [8], Daylight Glare Index (DGI) [9], and Daylight Glare Probability (DGP) [10].
In 1995, the Technical Committee 3-13 (TC 3-13) was tasked with producing such a single practical discomfort glare evaluation system and adopted the Unified Glare Rating (UGR), first proposed by Sorensen in 1987 [11], in the CIE report 117:1995 [12]. The UGR incorporates components of the Hopkinson and Einhorn formula and uses the Guth position index. The UGR depends mainly on four parameters which are generally agreed to be the main factors that induce discomfort glare. These include the solid angle subtended by the luminous area of the luminaire, the position of the luminaire, background luminance, and average luminance over the luminous area. Nowadays, the CIE UGR is largely accepted for determining the amount of discomfort glare in indoor light sources and is included in the European national standard for the lighting of indoor workplaces, CEN 2012 [13].
Although the calculation of UGR requires the luminance of the luminous area as input, conventionally, a conversion from luminance to far field intensity is applied. However, some researchers have indicated that by using far-field intensity distributions, non-uniform light sources are not differentiated from uniform light sources [14]. With the use of LEDs, luminaires with a non-uniform spatial luminance distribution have become more apparent, and research has shown that non-uniformity is important in quantifying the amount of discomfort glare [15,16,17,18,19,20,21,22,23,24]. This initiated a number of studies to develop glare indices for non-uniform luminaires [14,25,26], among which the UGR’ proposed by the CIE in 2019 [27] stands out as an extension of the well-known UGR using a correction factor depending on the level of non-uniformity.
For outdoor environments, multiple discomfort glare prediction models have also been developed. Bullough et al. introduced the Discomfort Glare (DG) value that predicts the sensation of glare for outdoor lighting installations from the illuminance of the luminaire, the surrounding, and the ambiance environment [28]. Kohko et al. proposed glare metrics for LED lighting in pedestrian zones calculated based on the luminance of the light source, the background, the size, as well as the viewing angle of the luminaire [29]. Discomfort glare in motor vehicle lighting was also discussed in the model suggested by Schmidt-Clausen and Bindels [30], while Lin et al. proposed a model for LED road light discomfort glare and evaluated different glare rating scales to find out that de Boer’s scale could be significantly different for various levels of glare source’s luminance, solid angle, and background luminance [31]. The impact of spectral sensitivity on glare sensation in outdoor lighting has also been investigated [32], which is also integrated into the glare model by Sweater-Hickcox et al. [33]. Within road and vehicle lighting, the CIE 243:2021 [34] reports and Funke [35] report that glare source luminance distribution affects glare ratings according to LED luminance, the distance between LEDs, and background luminance.
Despite the CIE UGR being widely accepted and used in indoor lighting, no such unification of discomfort glare indices yet exists for outdoor (residential) lighting, even when most outdoor glare matrices consider similar factors as in UGR. The applicability of the CIE UGR and UGR’ for outdoor (residential) luminaires have, to the best of our knowledge, been limitedly explored [36]. In outdoor lighting, Threshold Increment (TI) [37] and Glare Rating (GR) [38] are among some of the most commonly used glare indices, but these metrics mainly concern the disability glare. In the past, discomfort glare used to be included with the glare control mark [39,40].
Additionally, specifically in residential lighting, the luminaire glare index [41] is often used to evaluate glare; however, just as with the glare control mark, TI, and GR, it does not take into account non-uniform light sources. In current years, the demand for a discomfort glare rating for non-uniform residential lighting has grown significantly [42,43]. This effectively calls for a unified glare metric that can give proper consideration to non-uniform light sources in outdoor lighting. Though the CIE UGR and UGR’ are defined for typical indoor lighting, it might provide interesting insights to apply these current discomfort glare indices to (non-uniform) residential outdoor luminaires. In this study, a typical residential outdoor luminaire is characterized, and the potentials and challenges of calculating UGR and UGR’ are discussed. Part of this work (i.e., part of the methodology and some of the results) was presented at the Joint Conference 11th International Conference on Energy Efficiency in Domestic Appliances and Lighting (EEDAL’22) & 17th International Symposium on the Science and Technology of Lighting (LS: 17), June 2022, Toulouse, France [44].

2. Methodology

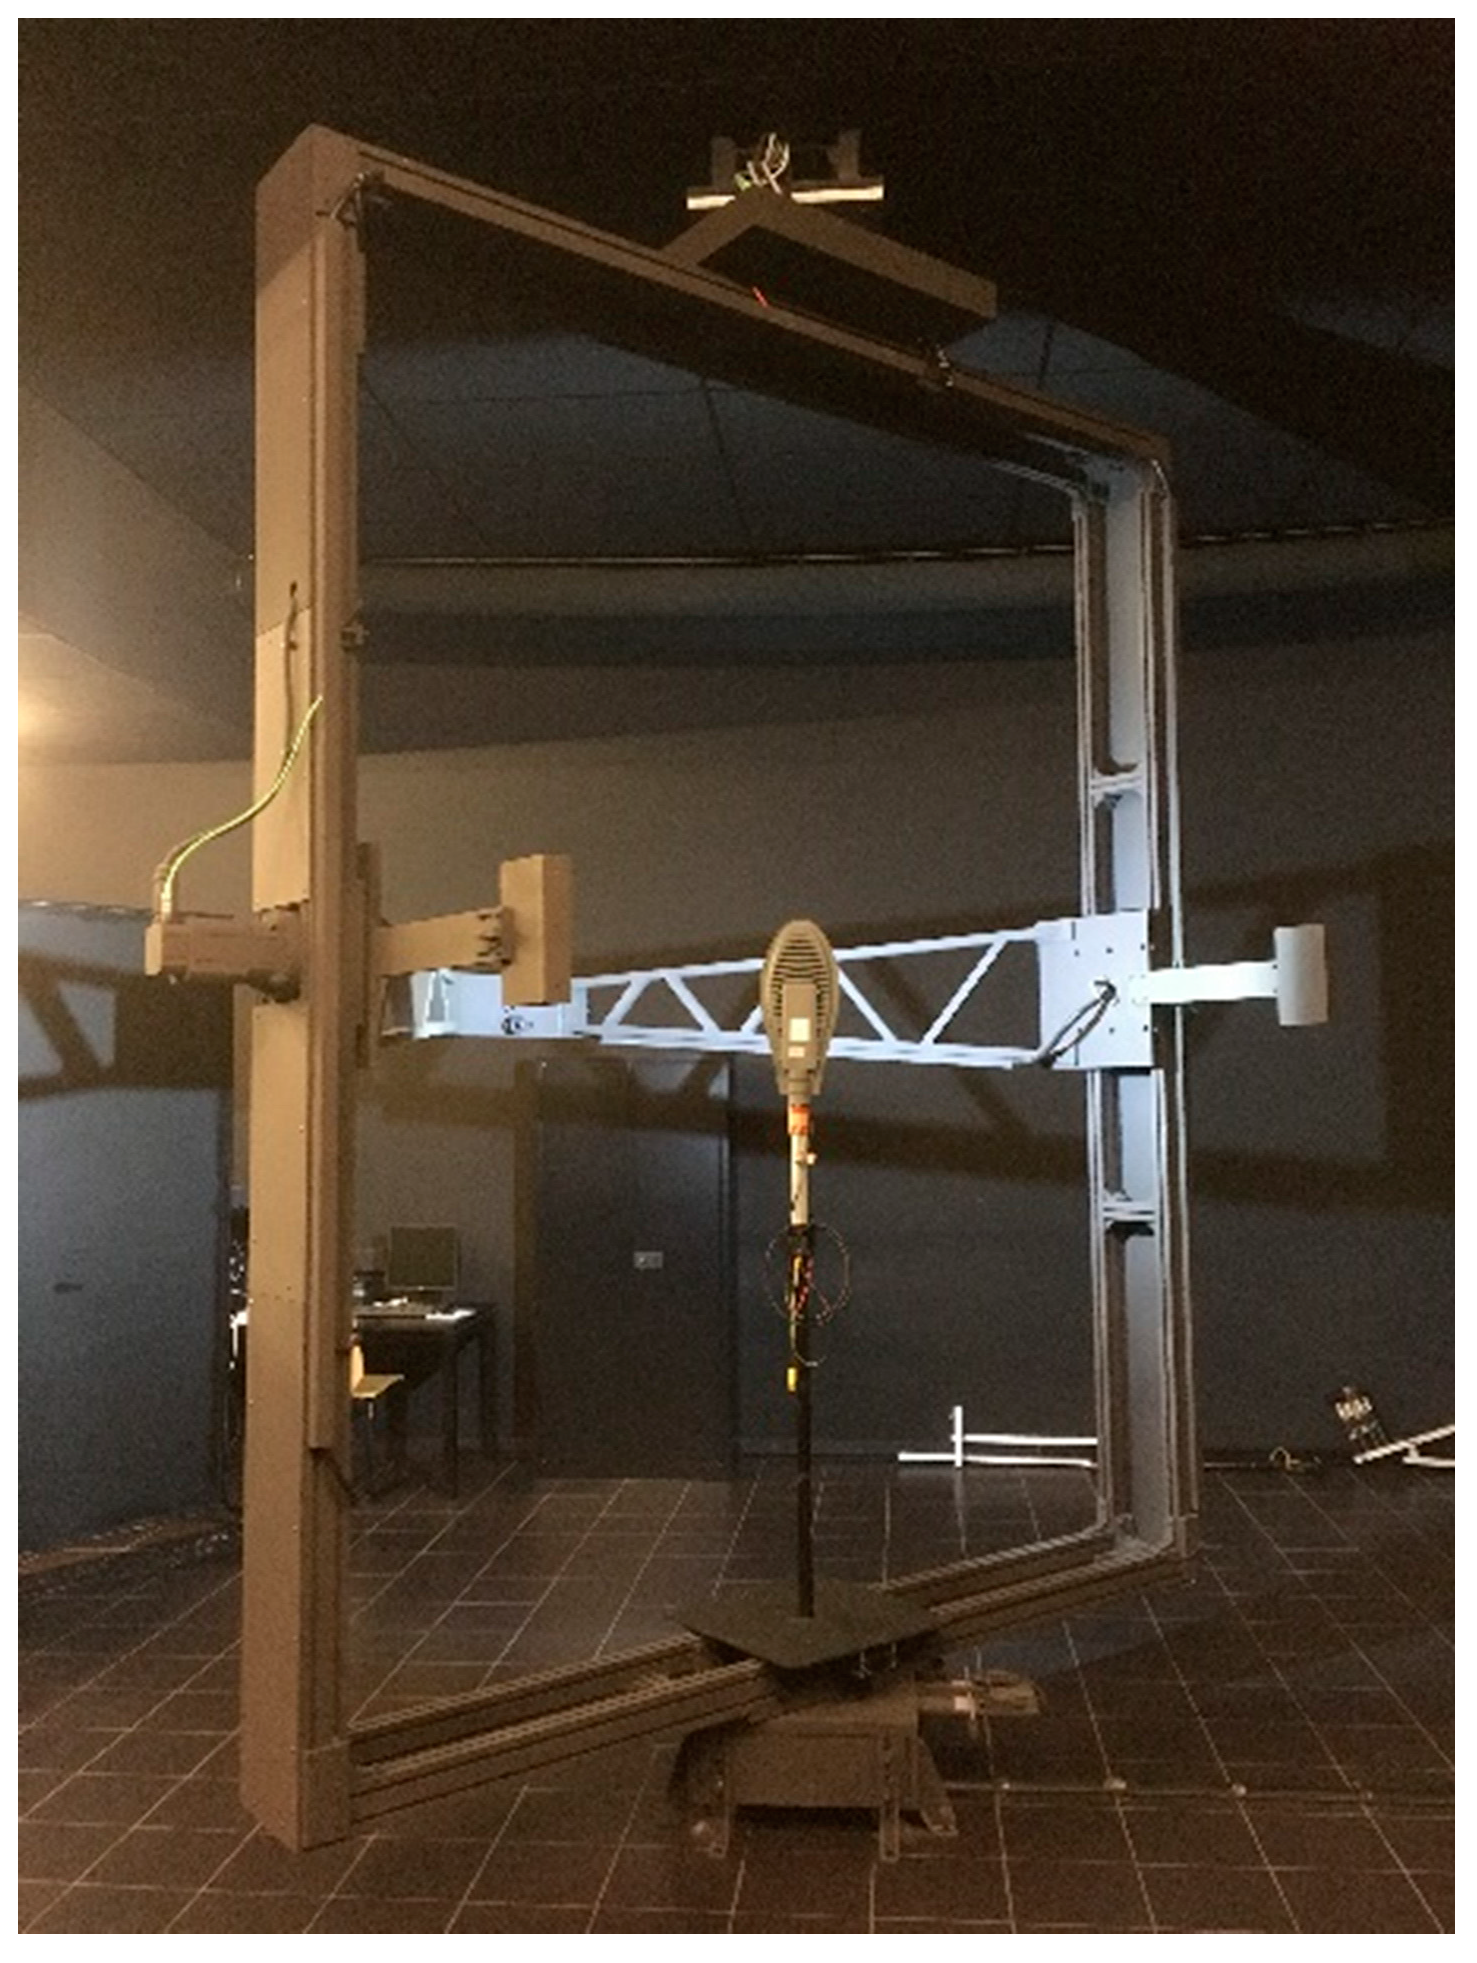
2.1. Large Near-Field Goniophotometer (NFG)
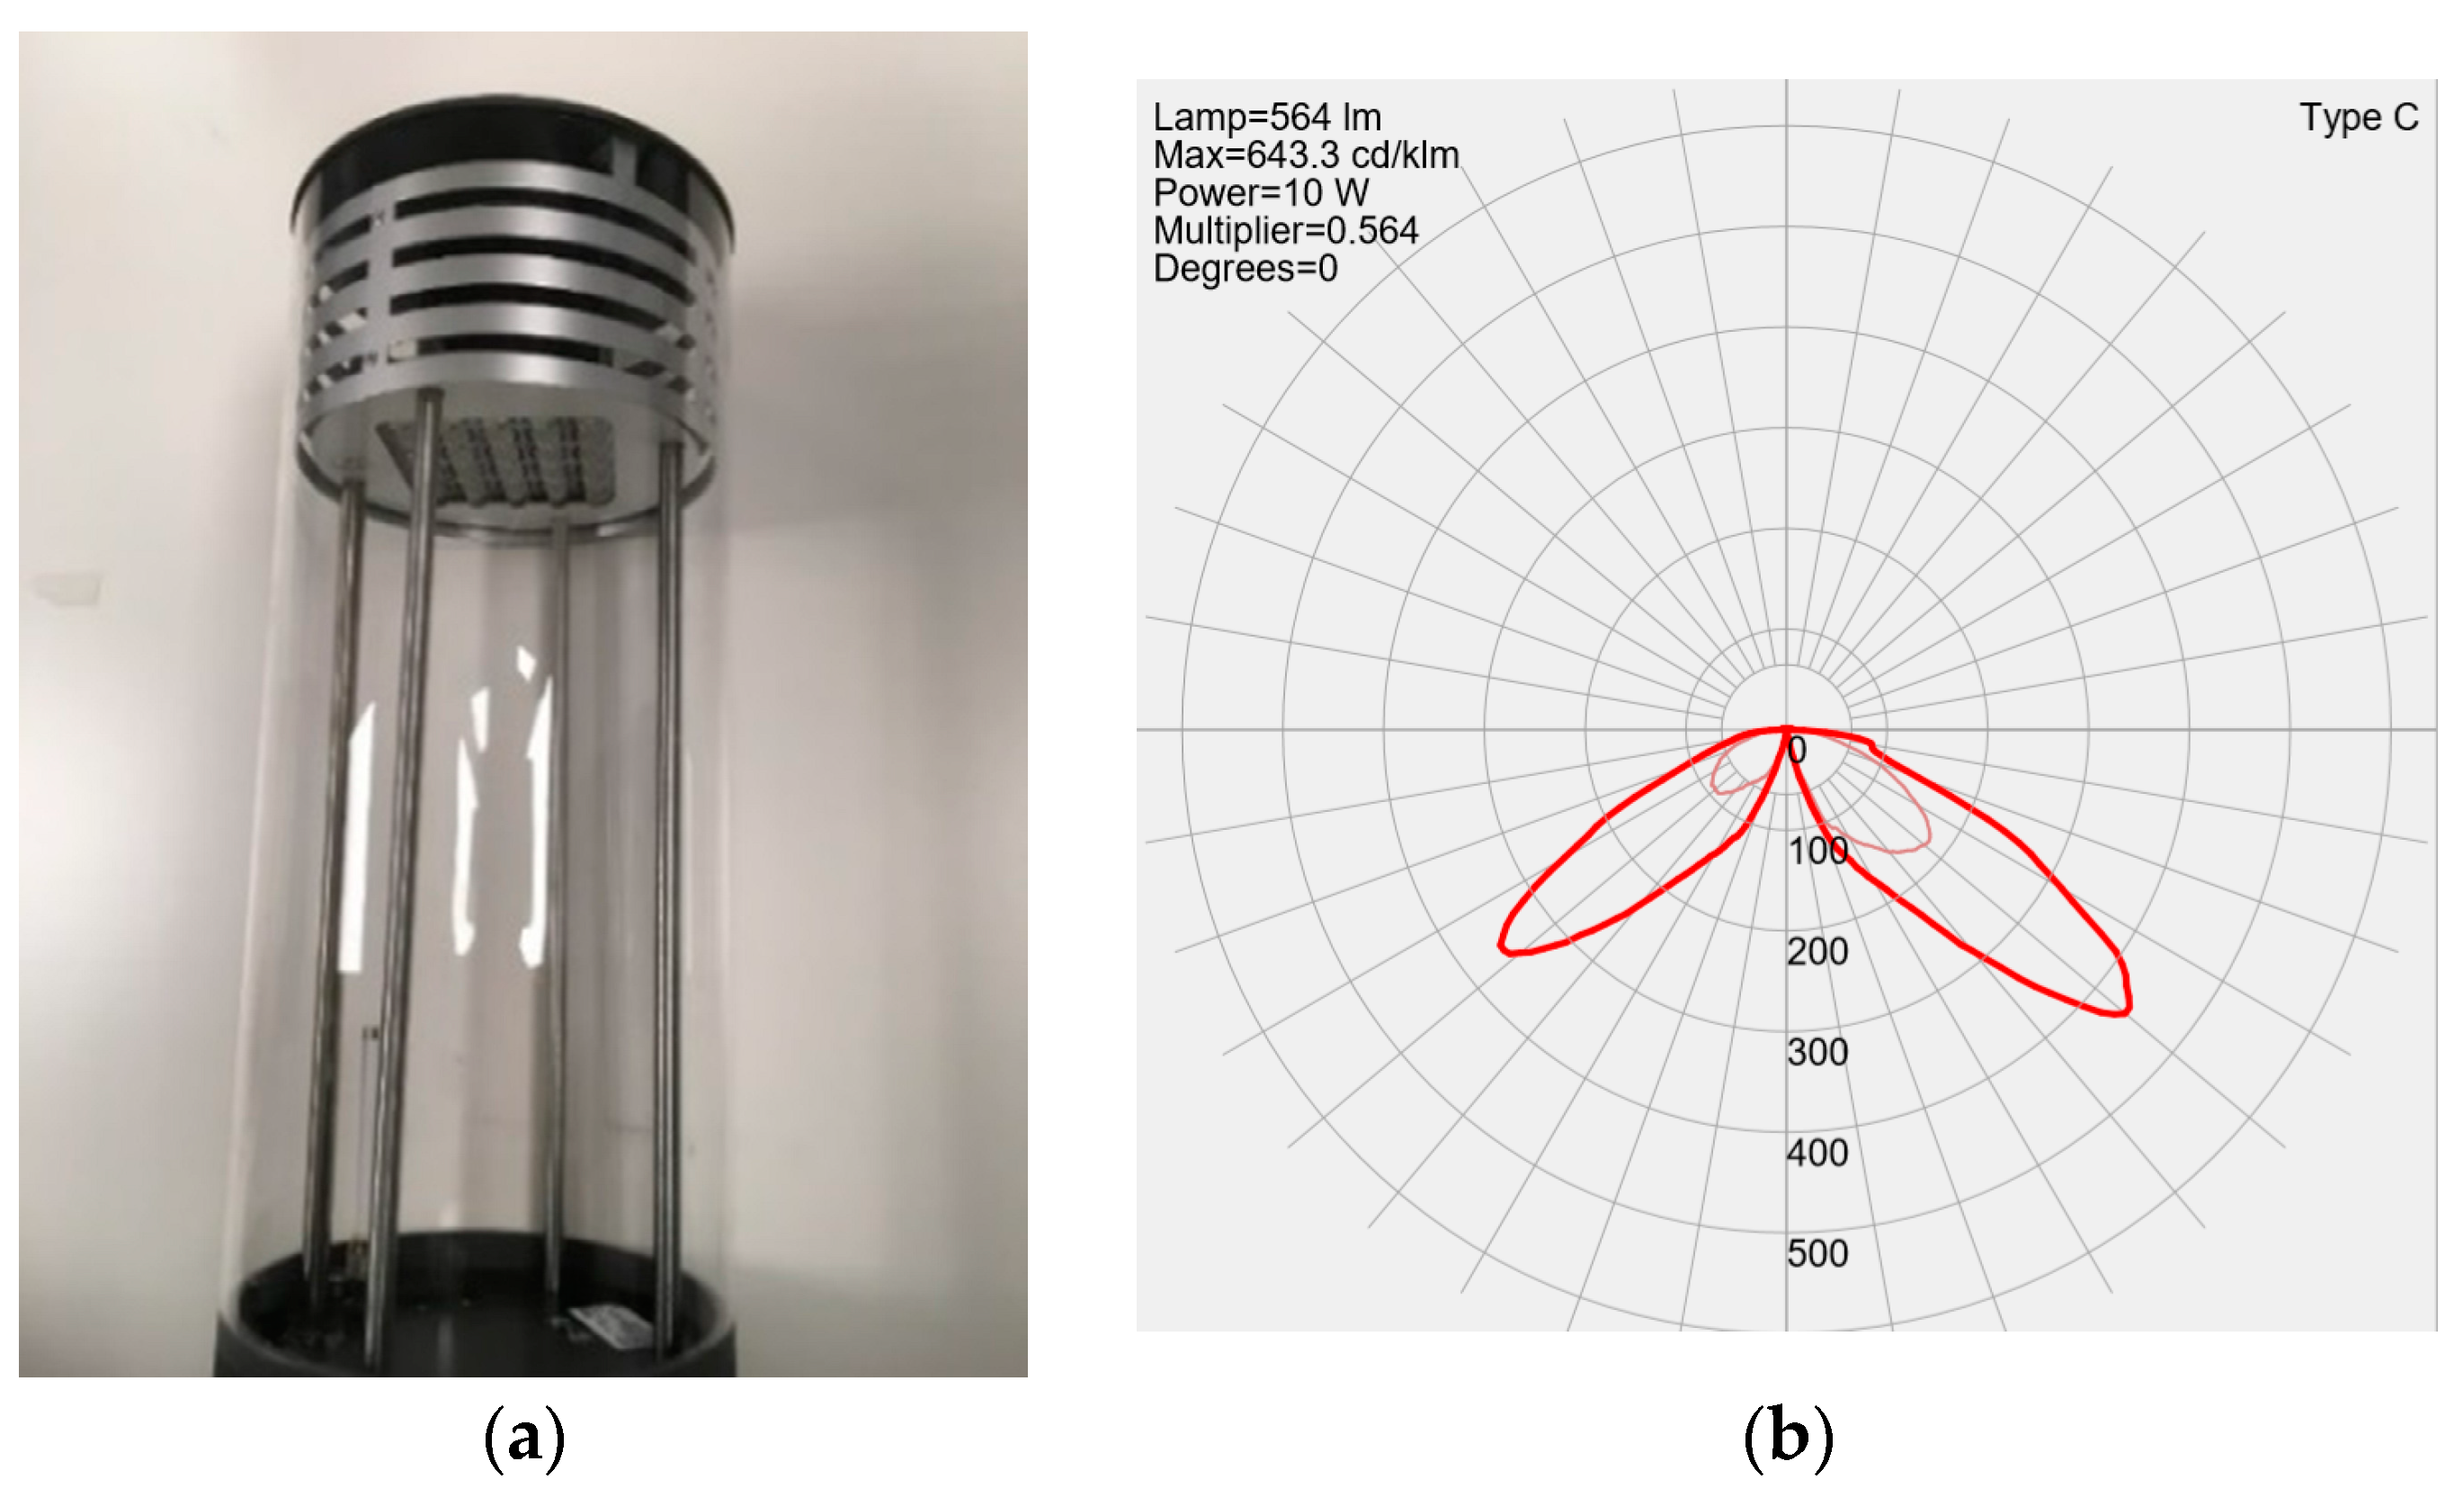
The luminous intensity distributions (LIDs) and luminance measurements took place in a dark room at the Light&Lighting Laboratory at KU Leuven with a Rigo801 Near-Field Goniophotometer (NFG), shown in Figure 1. The instrument includes an imaging luminance measurement device (ILMD), allowing for the creation of luminance images necessary to calculate UGR’. The ILMD consisted of an LMK98-4 TechnoTeam camera with a CCD Sony ICX 285 AL sensor, full resolution of 1390 (H) × 1040 (V) pixels, reported repeatability of ΔL < 0.1%, and measuring accuracy of ΔL < 3% (for standard illuminant A). The luminaire was mounted in the center of the large NFG.

2.2. Luminaire

The residential luminaire used in this study is shown in Figure 2a. The luminaire is a pole top mounted Hess GmbH Q5 4000k Residenza with a diagonal of 200 mm and a CRI of 80. The luminaire enclosure is made of PMMA and the size of the luminous area is 100 × 100 mm. The luminous area consists of 25 LEDs arranged on a square grid at a distance of 2 cm; the luminaire generates 564 lumens for an input power of 10 W. The corresponding LID is shown in Figure 2b.

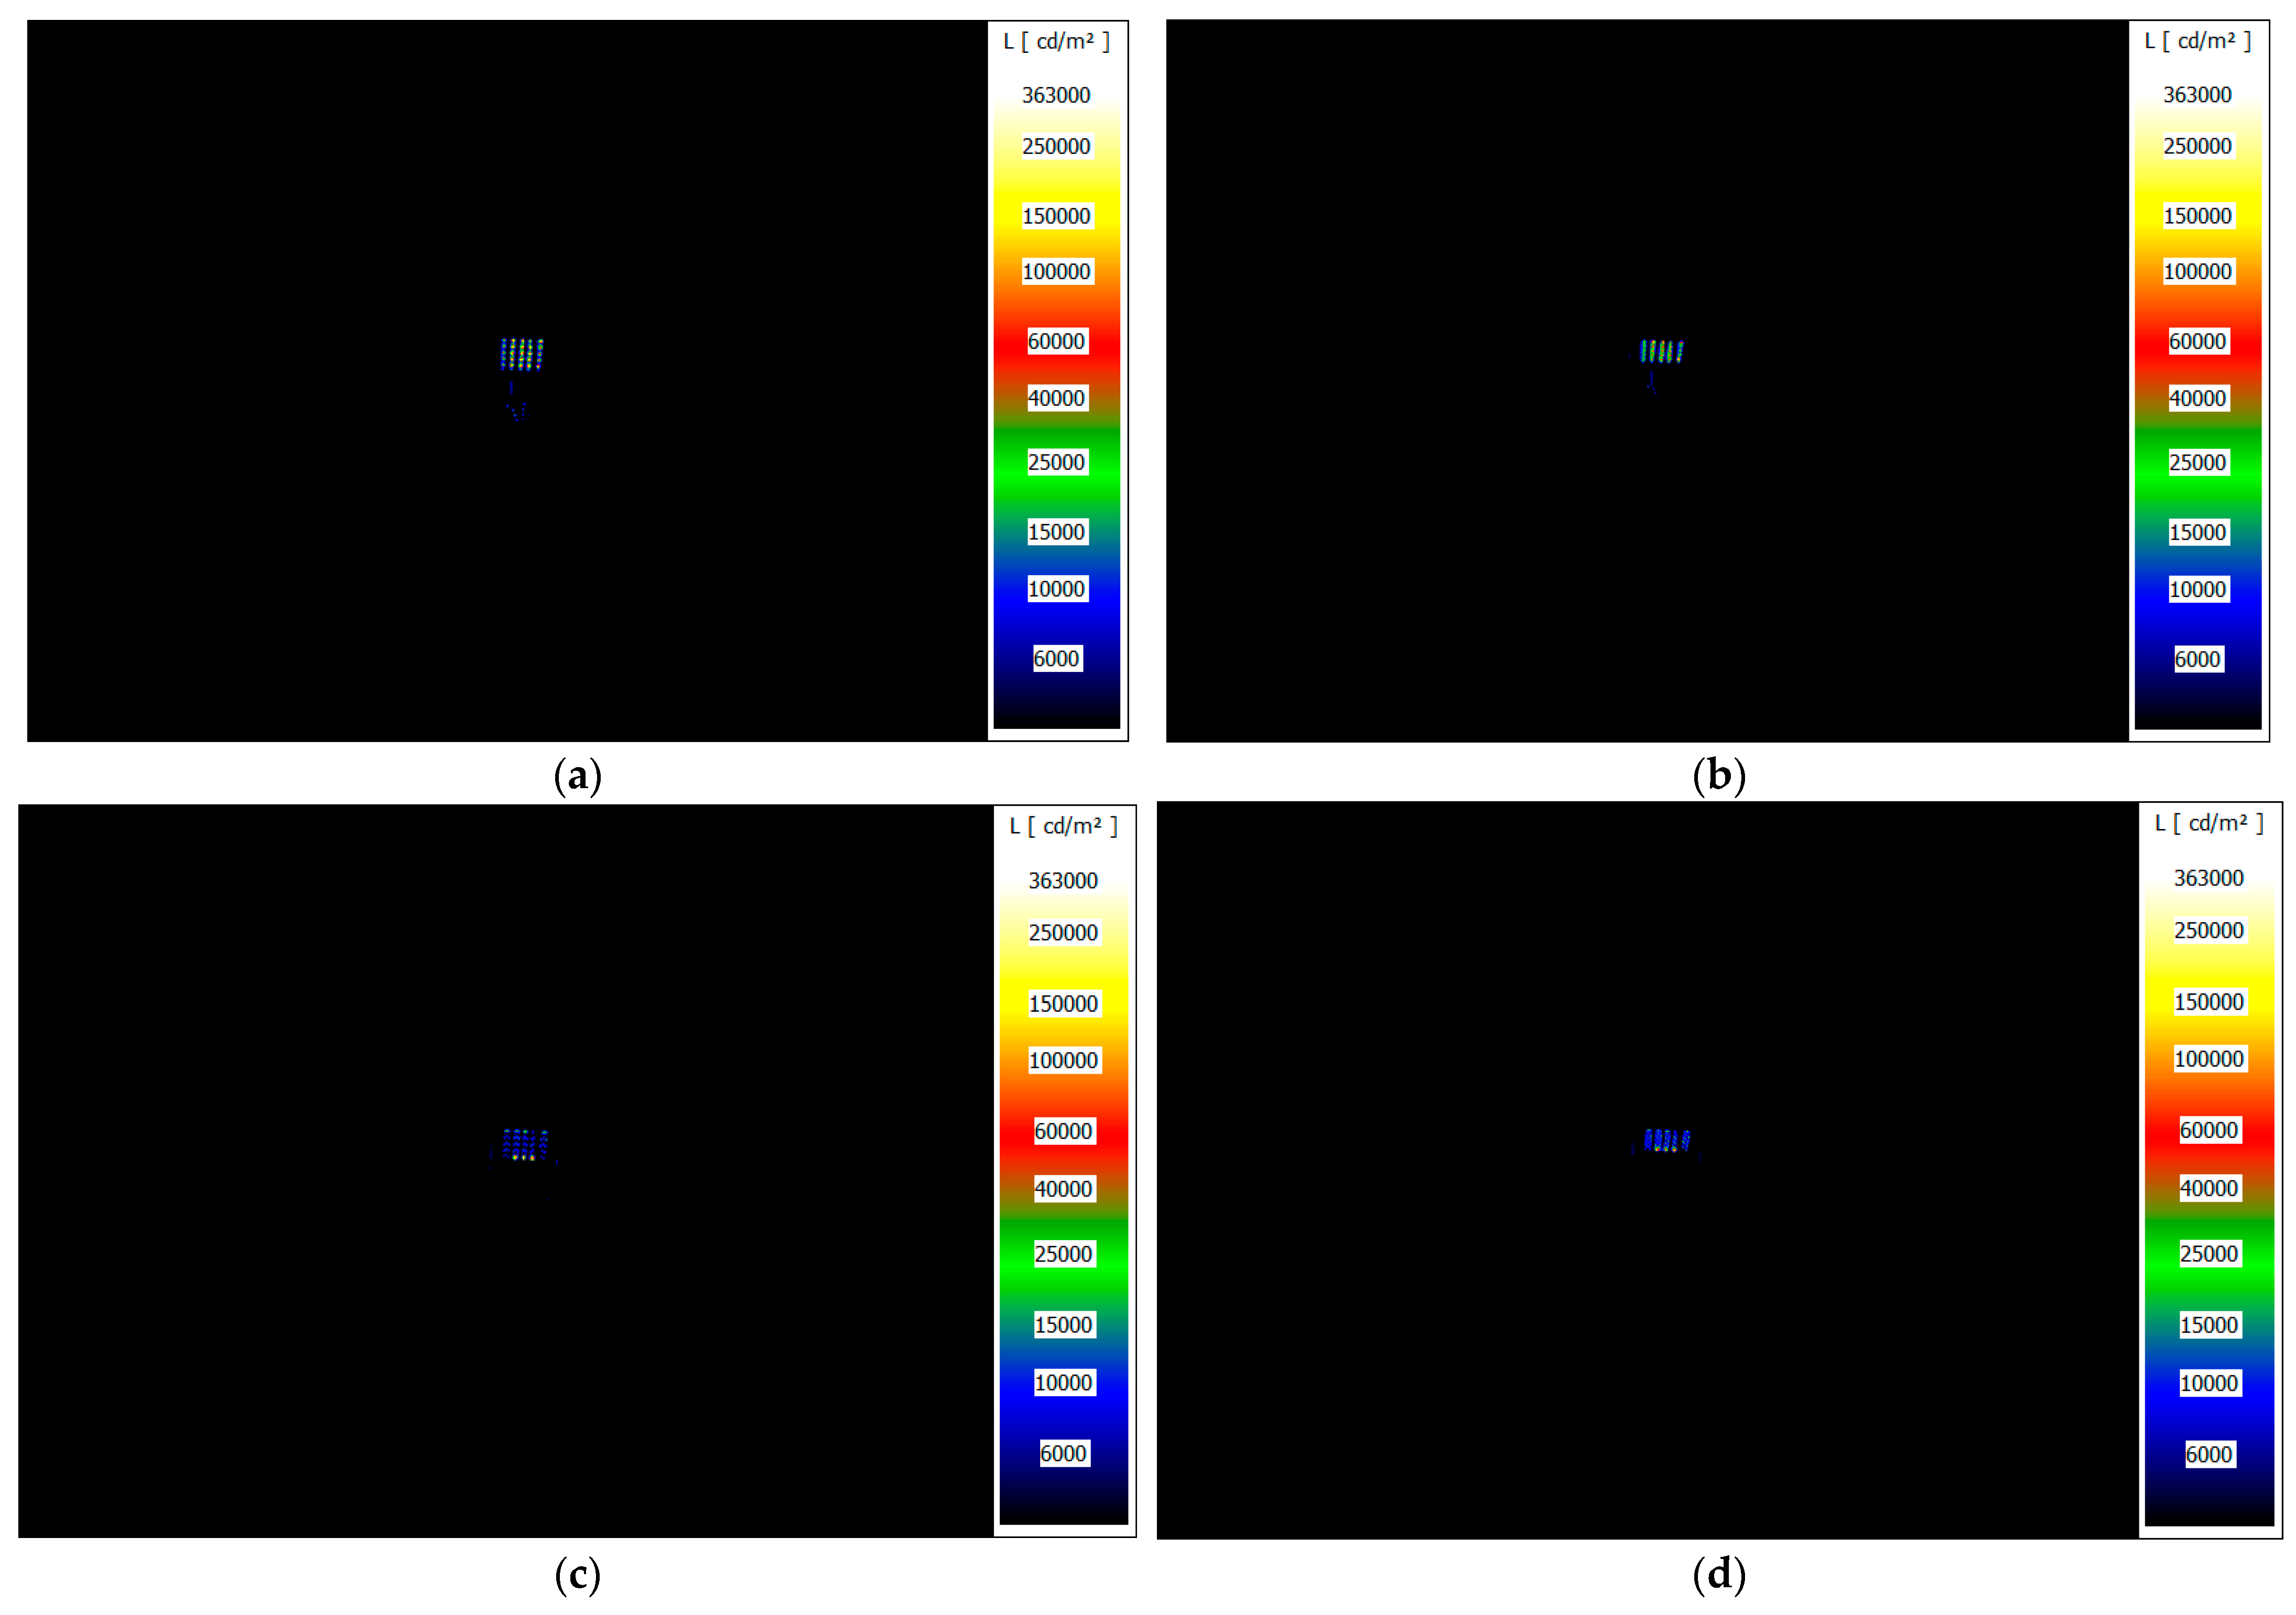
2.3. Luminance Image Capture

Luminance images are captured for four orientations as described in the CIE document 232:2019 [27]: γ values of 25 and 40 degrees for both an endwise (C = 90), and crosswise (C = 0) orientation. The ILMD is equipped with an array detector with a pixel size d p i x c a m (assumed to be a square) and a lens with a focus length f . The aperture of the camera is located at a distance D from the center of the luminaire. According to CIE 232:2019 [27], this distance has to be chosen such that the luminous area of the luminaire is within ±5°.
From these parameters, the solid angle subtended by the central pixel can be calculated:
ω p i x = ( d p i x c a m ) 2 f 2
Since the whole luminous area is within 5° of the center, this equation can be applied to all the relevant pixels.
The size of a pixel at the luminaire on a plane perpendicular to the viewing direction is given by d p i x l u m and can be calculated in first approximation as:
d p i x l u m = ( d p i x c a m D f )
This value can also be determined experimentally by positioning a ruler at the luminaire and capturing an image. The resolution of the camera used to capture the luminance images d p i x l u m was 1.5 mm/pixel at the luminaire, which is lower than 12 mm/pixel, as required by CIE 232:2019 [27].

3. Calculating UGR and UGR’

3.1. UGRLID: UGR from the Luminous Intensity Distribution

The CIE UGR for a single luminaire is defined as:
UGR = 8 log [ 0.25 L b L s 2 ω p 2 ]
in which L s is the average luminance over the luminous area, ω the solid angle subtended by the luminous area, L b is the background luminance, and p is the Guth’s position index of the luminaire. A visualized overview of all the parameters in Equation (3) is given in Figure 3.
However, classical indoor UGR calculations using software such as Dialux typically do not use luminance data as the input; instead, the UGR is calculated from the intensity values I L I D , using a conversion from the experimental intensity values to the average luminance in the corresponding direction. The UGR value calculated in this way is called UGR LID and is obtained as:
UGR LID = 8 log [ 0.25 L b I L I D 2 A p D 2 p 2 ]
with A p as the projected source area. Note that before calculating the UGRLID, the experimental LID was converted to a perfect symmetrical LID. The source area of the luminaire A s r c is characterized by its horizontal dimensions (width W, and length L) and eventually by a vertical height H. The area is defined by the operator as a horizontal and vertical luminous area and is considered as input in the .ldt file. This value is to some extent arbitrary because it is not always clear which area of the luminaire is considered “luminous”. To calculate the projected source area A p when viewed in a particular direction, some standard geometrical relations have been defined by CIE [12]. If the source area only has a horizontal area, A p is given by:
A p = A s r c cos γ
In an indoor situation, the average background luminance can be calculated from the vertical illuminance at the observer. In an outdoor residential environment, the determination of the background luminance value is quite ambiguous as it will depend strongly on the environment and the position of the luminaire. One might consider the background luminance as the average luminance of the environment surrounding the luminaire (which can be between 0.06 and 20 cd/m2 [45]) or the urban night sky (which can be between 0.0002 and 0.05 cd/m2 [45,46]), while some might opt for the luminance of the road surface (which is typically within the range of 0.5 and 2 cd/m2). In our calculation, a value of 1 cd/m2 is chosen as a typical luminance of the average road surface luminance for an M3 lighting classification [37].
UGRLID is calculated for the four directions mentioned before.

3.2. UGRimage: UGR from the Luminance Image

When using an NFG, the luminance images of the luminaire are also available, and the basic UGR formula of Equation (3) in terms of luminance can be used directly; the output is denoted as UGRimage.
An elegant calculation of the average value of the luminance L s and the solid angle ω directly from the luminance image is not straightforward. As the image contains more pixels than those corresponding to the luminous area (no cropping is applied), the number of relevant pixels corresponding to the luminous area n must be calculated. This number can be found as follows:
n = A p ( d p i x l u m ) 2
This number is rounded up to an integer value. The corresponding solid angle ω is visualized in Figure 4 and given by:
ω = n ω p i x   which   is   equivalent   to   ω = A p D 2
All the pixels from the image are sorted according to their luminance value. The n highest luminance values are assumed to belong to the luminous area and are used to calculate the average value L s . This way, the calculation of the solid angle and the average luminance is mutually consistent and consistent with the projected source area as used for the calculation of U G R L I D . An alternative way consists of cropping the image manually, which is more arbitrary and allows much more freedom in choosing the “luminous” area, therefore leading to the possible misuse in calculating UGRimage.
UGRimage is calculated for the four directions that are mentioned before.

3.3. UGR’

When dealing with luminaires with a non-uniform spatial luminance distribution, the UGR given by Equation (3) must be replaced by the UGR′ calculated as:
UGR = 8 log [ 0.25 L b L e f f 2 ω e f f p 2 ]
where ω e f f is the effective solid angle and L e f f is the effective luminance of the luminaire [27].
In the first step, the original luminance map is blurred according to the characteristics of the human visual system. Indeed, the minimal observable feature diameter is dependent on the eye resolution and the position on the retina. For a worst-case indoor situation (with a height between the luminaire and the observer’s eye equal to 1.20 m), a minimal diameter of 12 mm has been adopted. For this reason, the initial luminance images are blurred with a Gaussian filter with a full width at half maximum (FWHM) equivalent to 12 mm at the luminaire.
The number of “effective” pixels in the blurred image is denoted as n e f f and equals the number of pixels having a luminance higher than 500 cd/m2 (no image cropping was applied) [27].
The corresponding effective solid angle can be determined as follows:
ω e f f = n e f f ω p i x
The effective luminance L e f f is calculated as the average luminance value over the pixels considered for n e f f . Comparing Equation (8) to Equation (3), UGR’ is expected to be a higher number than UGR for a non-uniform luminous area, reflecting the impact of non-uniformity on glare perception [24,27].
UGR’ is calculated for the four orientations stipulated in the standard: C/γ = 0/50; 0/65; 90/50; 90/65. The corresponding Guth index p can be determined from the standard tables. All the main parameters are gathered in Table 1.
One would expect n e f f to be lower than the number of pixels corresponding to the complete luminous area (which normally also includes the pixels having a luminance lower than 500 cd/m2). However, the number of “effective” pixels is influenced by the high dynamic range of the luminance image: when a pixel in a luminance image has considerably high luminance and is surrounded by many pixels with a luminance less than 500 cd/m2, the blurring operation will increase the luminance of these surrounding pixels. As a result, those surrounding pixels can substantially increase the number of “effective” pixels. A simplified example of this is given in Figure 5 for a luminance image with a single pixel and a luminance of 363,000 cd/m2, which is blurred with the previously used Gaussian filter with a full width at half maximum (FWHM) equivalent to 12 mm at the luminaire. In the unblurred luminance image, the L e f f is 363,000 cd/m2 and the ω e f f is 9.85 × 10⁻⁷ sr, and after blurring the L e f f is 1983 cd/m2 and the ω e f f is 1.74 × 10⁻⁴ sr.

4. Results and Discussion

To compare the variation in the different approaches to calculate the unified glare rating, the results of the UGRLID, UGRimage, and UGR’, and luminance image of the luminaire, are reported in Figure 6 and Table 2 for each orientation.
Generally, the variation between the UGRimage, UGRLID, and UGR’ with viewing direction is quite similar. In absolute terms, the values of UGR’ and UGRimage are almost equal. This is surprising as for non-uniform luminaires, UGR’ is expected to be higher (for the same average luminance and the solid angle subtended by the luminous area), reflecting the effect of non-uniformity. However, the spatial distance between the LEDs is quite small compared to the blurring width, which minimizes the effect. Furthermore, as mentioned before, this might also be attributed to the blurring effect itself. Although the blurring might increase ω e f f , this effect will be counteracted as blurring also reduces the original peak luminance values, resulting in a lower L e f f .
It is noticeable that all the UGRimage, UGRLID, and UGR’ values are higher than the typical acceptable UGRimage, UGRLID, and UGR’ values for indoor lighting, being 19 [13]; however, the absolute UGRimage, UGRLID, and UGR’ values are highly dependent on the value of the background luminance. With the differences in the viewing conditions and the background luminance defined for outdoor environments, developing a new UGR scale for outdoor lighting might become relevant. For future investigations, a series of psychophysical experiments will be needed to define a more applicable UGR scale for the glare in outdoor lighting.

4.1. Camera Resolution and Blurring

The 12 mm/pixel blurring is defined for an indoor lighting situation based on the minimum observable feature size. In CIE 232:2019 [27], the minimum observable feature diameter in a luminaire is approximated to be 0.01 times the height difference between the luminaire and the horizontal line of sight of the observer for all luminaire positions. For an outdoor residential luminaire, the typical mounting height equals 3.6 m, and for an observer with an average height of 1.6 m, this results in a typical height between the luminaire and the observer’s eye of 2.0 m. This suggests the use of a blurring resolution of 20 mm/pixel when considering an outdoor residential luminaire. Therefore, in this study, 20 mm/pixel blurring was investigated comparatively and reported in Table 3. Although it is worth noting that this is determined for a horizontal line of sight and for pedestrians the line of sight is typically more dynamic, looking both at the footpath and surroundings [47,48]. In future research, a worst-case scenario should be further investigated.
The difference between 12 and 20 mm/pixel blurring for the UGR’ is very small (i.e., approx. 1.3%), where, as expected, the UGR’ for 20 mm/pixel is slightly smaller as a larger blurring width smoothens the non-uniformity.

4.2. Viewing Angles

In the CIE document 232:2019 [27], the four defined orientations are C/γ = 0/50, 0/65, 90/50, and 90/65. These angles are only defined and standardized for indoor lighting, however, not yet for outdoor lighting. In outdoor lighting, the luminaires are placed and viewed at many different locations and eccentricities to the line of sight. For outdoor luminaires, typically, the luminaires are placed to the side of the road, which introduces very different relevant C-planes angles, whereas with indoor lighting, generally, this can be limited to the C0 and C90 plane. As mentioned before, the difference in mounting height can play an important role in the viewing angle; therefore, a new viewing angle that is both different in its C-plane and γ angle is recommended. Based on a luminaire with a height of 3.6 m for an observer with an average height of 1.6 m viewed at a distance of 7.5 m at a width of 1.8 m, from the side of the road, results in a γ angle of 75° and a C-plane angle of 15°. The resulting UGRLID, UGRimage, and UGR’ are reported in Table 4.
The difference in values between the four standardized angles and the C/γ = 15/75 angle is very large, especially for the UGR’ and UGRimage (>15). This highlights the importance of the viewing angle for outdoor (residential) luminaires, as the viewing angle can have a profound effect. As mentioned in determining the amount of blurring required, the line of sight is typically more dynamic, suggesting the addition of a viewing angle to different lines of sight, or choosing a line of sight and viewing angle corresponding to the worst-case scenario in future research.

4.3. Background Luminance

For an outdoor luminaire, the direct background will most likely be the average luminance of the environment surrounding the luminaire (which can be between 0.06 and 20 cd/m2) or the urban night sky (which can be between 0.0002 and 0.05 cd/m2), generally resulting in high UGR values. The background luminance will depend highly on the location of the luminaire and the line of sight of the observer, being a walkway in a park or on the footpath in a shopping street. Initially, in this study, the average road surface luminance was taken as the background; however, in addition, different background areas were considered, as indicated in Figure 7. Figure 7 is purely an illustrative luminance measurement to indicate the different areas that can be considered for the background luminance; it does not comply with the CIE 232:2019 requirements (i.e., ≤12 mm/pixel) [27], and is not used to calculate the average luminance over the luminous area.
The resulting UGR values for these different luminance background values from the urban night sky and environment surrounding the luminaire, 0.05 and 0.5 cd/m2,, respectively, are reported in Table 5 for comparison.
As expected, and can be directly calculated with Equations (3), (4), and (8), the UGR values are higher for a decrease in luminance background. The discomfort glare ratings are expected to be higher for a decrease in luminance background based on a larger mismatch between the adaptation state and glare source brightness [49]. The difference between the UGR values for a background of 0.5 cd/m2 and 1 cd/m2 is relatively small, however, when a background of 0.05 cd/m2 is taken, the UGR values are considerably higher. Therefore, taking either the direct environment surrounding the luminaire or the average road surface luminance will not result in a large difference, however, taking the urban night sky does result in much larger UGR values. In addition, often in calculating the contrast thresholds in outdoor lighting, the veiling luminance from the surrounding is added to the average road surface luminance. Furthermore, the background luminance can be considered a combination of local and global adaptation, for which more advanced human visual glare models are recommended [49]. All in all, several options are still to be investigated in future research.

4.4. Practical Evaluation System

As previously mentioned, the UGR is a practical evaluation system to determine the amount of discomfort glare; however, it is also observed that improvements are still needed to make the model applicable to a wider scope of applications. Besides the practical issues, such as the ambiguity in choosing the luminous area, the effect of the blurring parameter on the luminous area, determining the most relevant (standardized) viewing angles, blurring parameter, and background luminance for outdoor lighting applications, the CIE 232:2019 also lists other limitations to the UGR formulae. The UGR is limited in the light source size and excludes effects of the light spectrum, the impact of glare sources in foveal view, age or chronotype of the observer, local and global adaptation, overhead glare, and the physiological mechanism of discomfort glare [27].
Since the implementation of the UGR, researchers have been working towards more fundamental human visual discomfort glare models [21,22,25,49,50,51]. This opens another possible direction for future research that can engage more physiological mechanisms in glare prediction, besides enhancing the promising performance of UGR for non-uniform outdoor lighting.
One example of such a human visual model is the visual discomfort (VD) model by Scheir et al. [50], which incorporates the receptive field mechanism, pupillary light reflex, and correction for the retinal position. As our first step to explore the possibility of applying such human visual discomfort glare to non-uniform outdoor lighting and compare its performance to UGR and UGR’, the VD model values are calculated for the set of luminance images to explore one of these human visual discomfort models for its use for residential luminaires and to explore what values can be expected. The VD model values are reported in Table 6.
The VD model values vary between 3.2 and 4.3, indicating the largest value for the C/γ = 0/50 angle. This is slightly different from the UGR values where the C/γ = 0/65 angle seemed to be the worst case, however, the difference between the two angles is only 0.4. Future research should further explore beyond the practical evaluation systems and investigate generic human visual system models that incorporate most human visual elements involved in discomfort glare [49,50].

5. Conclusions

In conclusion, the CIE UGR and UGR’ metrics are applied to an outdoor residential luminaire with a non-uniform spatial luminance distribution. Some practical issues of using the UGR and the UGR’ in an outdoor environment are discussed, such as determining the luminous area, the blurring parameter and its effect, the viewing angle, the background luminance, and the rating scale. Furthermore, some possible solutions and suggestions are explored using calculations and measurements for a different blurring parameter (20 mm/pixel), a different viewing angle, and background luminance. For future investigations, psychophysical experiments will be needed to develop a suitable UGR-based scale for the glare in outdoor lighting and to verify the performance of the model. In spite of the UGR including the four main factors that produce discomfort glare, a more fundamental human visual system-based model may prove more useful and provide solutions to some of these practical issues.

Author Contributions

Conceptualization, R.M.S., T.H.P. and P.H.; methodology, R.M.S., T.H.P. and P.H.; software, R.M.S. and T.H.P.; validation, R.M.S., T.H.P. and P.H.; formal analysis, R.M.S., T.H.P. and P.H.; investigation, R.M.S., T.H.P. and J.A.; resources, R.M.S., T.H.P. and J.A.; data curation, R.M.S., T.H.P. and J.A.; writing—original draft preparation, R.M.S.; writing—review and editing, T.H.P., J.A. and P.H.; visualization, R.M.S.; supervision, P.H.; project administration, R.M.S.; funding acquisition, P.H. All authors have read and agreed to the published version of the manuscript.

Funding

This research was funded by the research council of the KU Leuven, grant number C24/17/051, and the APC was also funded by KU Leuven (Belgium).

Institutional Review Board Statement

Not applicable.

Informed Consent Statement

Not applicable.

Data Availability Statement

The data are available on request from the corresponding author.

Conflicts of Interest

The authors declare no conflict of interest.

References

  1. Commission Internationale de l’Eclairage. CIE International Lighting Vocabulary; CIE: Vienna, Austria, 1987. [Google Scholar]
  2. Committee on Recommendations of Quality and Quantity of Illumination of the IES. Outline of a standard procedure for computing visual comfort ratings for interior lighting. J. Illum. Eng. Soc. 1972, 2, 328. [Google Scholar]
  3. Illuminating Engineering Society Technical Committee. Evaluation of Discomfort Glare: The IES Glare Index System for Artificial Lighting Installations; IES Tech. Rep. 10; IES: London, UK, 1967. [Google Scholar]
  4. Rubino, M.; Cruz, A.; García, J.A.; Hita, E. Discomfort glare indices: A comparative study. Appl. Opt. 1994, 33, 8001–8008. [Google Scholar] [CrossRef]
  5. Guth, S.K. Computing visual comfort ratings for a specific interior lighting installation. Illum. Eng. 1966, 61, 634. [Google Scholar]
  6. Guth, S.K. A method for the evaluation of discomfort glare. Illum. Eng. 1963, 58, 351–364. [Google Scholar]
  7. De Boer, J.; Burghout, F.; Van Heemskerck Veeckens, J.F.T. Appraisal of the quality of public lighting based on road surface luminance and glare. In Proceedings of the 14th Session of CIE, Brussels, Belgium, 1959; pp. 529–538. [Google Scholar]
  8. Bennett, C.A.; Dubbert, D.; Hussain, S. Comparison of Real-World Roadway Lighting, Dynamic Simulation, CBE and Glaremark Predictive Systems; Special report no. 176; Kansas Engineering Experiment Station: Manhattan, KS, USA, 1985. [Google Scholar]
  9. Hopkinson, R. Glare from daylighting in buildings. Appl. Ergon. 1972, 3, 206–215. [Google Scholar] [CrossRef]
  10. Wienold, J.; Christoffersen, J. Evaluation methods and development of a new glare prediction model for daylight environments with the use of CCD cameras. Energy Build. 2006, 38, 743–757. [Google Scholar] [CrossRef]
  11. Sorensen, K. A modern glare index method. In Proceedings of the 21st CIE Session, Venice, Italy, 1987; Volume 2, p. 106. [Google Scholar]
  12. Commission Internationale de l’Eclairage. CIE 117:1995. Discomfort Glare in Interior Lighting; CIE: Vienna, Austria, 1995. [Google Scholar]
  13. European Committee for Standardisation. CEN 2011C Light and Lighting—Lighting of Work Places—Part 1: Indoor Work Places; CEN: Brussels, Belgium, 2011. [Google Scholar]
  14. Scheir, G.H.; Hanselaer, P.; Bracke, P.; Deconinck, G.; Ryckaert, W.R. Calculation of the Unified Glare Rating based on luminance maps for uniform and non-uniform light sources. Build. Environ. 2015, 84, 60–67. [Google Scholar] [CrossRef]
  15. Waters, C.; Mistrick, R.; Bernecker, C. Discomfort Glare from Sources of Nonuniform Luminance. J. Illum. Eng. Soc. 1995, 24, 73–85. [Google Scholar] [CrossRef]
  16. Kasahara, T.; Aizawa, D.; Irikura, T.; Moriyama, T.; Toda, M.; Iwamoto, M. Discomfort Glare Caused by White LED Light Sources. J. Light Vis. Environ. 2006, 30, 95–103. [Google Scholar] [CrossRef] [Green Version]
  17. Takahashi, H.; Irikura, T.; Moriyama, T.; Toda, M.; Iwamoto, M. Discomfort glare and annoyance caused by white LED lamps. In Proceedings of the 26th Session of the CIE, Beijing, China, 4–11 July 2007. [Google Scholar]
  18. Bullough, J.; Hickcox, K.S. Interactions among light source luminance, illuminance and size on discomfort glare. SAE Int. J. Passeng. Cars-Mech. Syst. 2012, 5, 199–202. [Google Scholar] [CrossRef]
  19. Geerdinck, L.; Van Gheluwe, J.; Vissenberg, M. Discomfort glare perception of non-uniform light sources in an office setting. J. Environ. Psychol. 2014, 39, 5–13. [Google Scholar] [CrossRef]
  20. Scheir, G.; Van de Perre, L.; Ryckaert, W.; Hanselaer, P. Effect of luminance contrast on the perception of discomfort. In Proceedings of the 28th CIE Session, Manchester, UK, 28 June–4 July 2015; pp. 1870–1876. [Google Scholar]
  21. Donners, M.A.H.; Vissenberg, M.C.J.M.; Geerdinck, L.M.; Van Den Broek-Cools, J.H.F.; Buddemeijer-Lock, A. A psychophysical model of discomfort glare in both outdoor and indoor applications. In Proceedings of the 28th CIE Session, Manchester, UK, 28 June–4 July 2015. [Google Scholar]
  22. Scheir, G.; Donners, M.; Geerdinck, L.; Vissenberg, M.; Hanselaer, P.; Ryckaert, W. Visual discomfort prediction based on receptive fields. In Proceedings of the CIE 2016 “Lighting Quality and Energy Efficiency”, Melbourne, Australia, 3–5 March 2016; pp. 195–203. [Google Scholar]
  23. Scheir, G.; Hanselaer, P.; Ryckaert, W. The effective luminous surface for the unified glare rating. In Proceedings of the 4th CIE Expert Symposium on Color and Visual Appearance, Prague, Czech Republic, 6–7 September 2016; pp. 462–469. [Google Scholar]
  24. Yang, Y.; Luo, R.M.; Ma, S.-N.; Liu, X.-Y. Assessing glare. Part 1: Comparing uniform and non-uniform LED luminaires. Light. Res. Technol. 2017, 49, 195–210. [Google Scholar] [CrossRef]
  25. Safdar, M.; Luo, M.R.; Mughal, M.F.; Kuai, S.; Yang, Y.; Fu, L.; Zhu, X. A neural response-based model to predict discomfort glare from luminance image. Light. Res. Technol. 2018, 50, 416–428. [Google Scholar] [CrossRef]
  26. Yang, Y.; Luo, M.R.; Ma, S. Assessing glare. Part 2: Modifying Unified Glare Rating for uniform and non-uniform LED luminaires. Light. Res. Technol. 2017, 49, 727–742. [Google Scholar] [CrossRef]
  27. Commission Internationale de l’Eclairage. CIE 232:2019. Discomfort Caused by Glare from Luminaires with a Non-Uniform Source Luminance; CIE: Vienna, Austria, 2019. [Google Scholar]
  28. Bullough, J.D.; Brons, J.; Qi, R.; Rea, M. Predicting discomfort glare from outdoor lighting installations. Light. Res. Technol. 2008, 40, 225–242. [Google Scholar] [CrossRef]
  29. Kohko, S.; Ayama, M.; Iwata, M.; Kyoto, N.; Toyota, T. Study on Evaluation of LED Lighting Glare in Pe-destrian Zones. J. Light Vis. Environ. 2015, 39, 15–25. [Google Scholar] [CrossRef] [Green Version]
  30. Schmidt-Clausen, H.-J.; Bindels, J.T.H. Assessment of discomfort glare in motor vehicle lighting. Light. Res. Technol. 1974, 6, 79–88. [Google Scholar] [CrossRef]
  31. Lin, Y.; Liu, Y.Y.; Sun, Y.; Zhu, X.; Lai, J.; Heynderickx, I.I. Model predicting discomfort glare caused by LED road lights. Opt. Express 2014, 22, 18056–18071. [Google Scholar] [CrossRef] [PubMed] [Green Version]
  32. Bodrogi, P.I.; Wolf, N.A.; Khanh, T.Q. Spectral sensitivity and additivity of discomfort glare under street and automotive lighting conditions. Light Eng. 2012, 20, 66–71. [Google Scholar]
  33. Sweater-Hickcox, K.; Narendran, N.; Bullough, J.D.; Freyssinier, J.P. Effect of different coloured lumi-nous surrounds on LED discomfort glare perception. Light. Res. Technol. 2013, 45, 464–475. [Google Scholar] [CrossRef]
  34. Commission International de l’Éclairage. CIE 243:2021. Discomfort Glare in Road Lighting and Vehicle Lighting; CIE: Vienna, Austria, 2021. [Google Scholar]
  35. Funke, C. Blendungsbewertung von LED-Leuchten in Innenräumen. Ph.D. Thesis, Technische Universität Ilmenau, Ilmenau, Germany, 2017. [Google Scholar]
  36. Villa, C.; Bremond, R.; Saint Jacques, E.; Dumont, E. Predicting the Discomfort Glare Experienced by Pedestrians: Ugr and Cbe. In Proceedings of the CIE 2017, Commission Internationale de l’Eclairage Midterm Meeting, Jeju, Korea, 20–28 October 2017; pp. 1088–1097. [Google Scholar]
  37. EN 13201-2:2003; Road Lighting—Part 2: Performance Requirements (BDS EN/TR 13201-2:2005—Street Lighting. Performance Requirements). European Committee for Standardisation: Brussels, Belgium, 2003.
  38. International Commission on Illumination; CIE Technical Committee TC-5.04. Glare Evaluation System for Use within Outdoor Sports and Area Lighting. CIE Central Bureau. 1994. Available online: http://www.cie.co.at/publications/glare-evaluation-system-use-within-outdoor-sport-and-area-lighting (accessed on 17 November 2021).
  39. Commission Internationale de l’Eclairage. CIE 31:1976. Discomfort Glare in Interior Lighting; CIE: Vienna, Austria, 1976. [Google Scholar]
  40. De Boer, J.B.; van Heemskerck Veeckens, J.F.T. Observations on discomfort glare in street lighting. In Proceedings of the CIE, Zurich, Switzerland, 1955. [Google Scholar]
  41. Commission Internationale de l’Eclairage. CIE 136:2000. Guide to the Lighting of Urban Areas; CIE: Vienna, Austria, 2000. [Google Scholar]
  42. Miller, N.J.; Koltai, R.; McGowan, T. Pedestrian Friendly Outdoor Lighting; Gateway Report PNNL-23085; Pacific Northwest National Laboratory: Portland, OR, USA, 2013. [Google Scholar]
  43. Miller, N.J.; McGowan, T.K. Correspondence: Glare in pedestrian-friendly outdoor lighting. Light. Res. Technol. 2015, 47, 760–762. [Google Scholar] [CrossRef]
  44. Spieringhs, R.M.; Phung, T.H.; Hanselaer, P. Applying the Unified Glare Rating for a non-uniform residential luminaire. In Proceedings of the 2022 Joint Conference 11th International Conference on Energy Efficiency in Domestic Appliances and Lighting (EEDAL’22) & 17th International Symposium on the Science and Technology of Lighting (LS: 17), Toulouse, France, 3 June 2022; IEEE: New York, NY, USA, 2022. [Google Scholar]
  45. Liu, M.; Zhang, B.; Li, W.; Guo, X.; Pan, X. Measurement and distribution of urban light pollution as day changes to night. Light. Res. Technol. 2018, 50, 616–630. [Google Scholar] [CrossRef]
  46. Li, Q.; Yang, G.; Yu, L.; Zhang, H. A survey of the luminance distribution in the nocturnal environment in Shanghai urban areas and the control of luminance of floodlit buildings. Light. Res. Technol. 2006, 38, 185–189. [Google Scholar] [CrossRef]
  47. Fotios, S.; Uttley, J.; Cheal, C.; Hara, N. Using eye-tracking to identify pedestrians’ critical visual tasks, Part 1. Dual task approach. Light. Res. Technol. 2015, 47, 133–148. [Google Scholar] [CrossRef]
  48. Fotios, S.; Uttley, J.; Yang, B. Using eye-tracking to identify pedestrians’ critical visual tasks. Part 2. Fixation on pedestrians. Light. Res. Technol. 2015, 47, 149–160. [Google Scholar] [CrossRef] [Green Version]
  49. Vissenberg, M.C.J.M.; Perz, M.; Donners, M.A.H.; Sekulovski, D. A generic glare sensation model based on the human visual system. In Proceedings of the CIE 2021, Kuala Lumpur, Malaysia, 27–29 September 2021; pp. 203–212. [Google Scholar] [CrossRef]
  50. Scheir, G.; Hanselaer, P.; Ryckaert, W. Pupillary light reflex, receptive field mechanism and correction for retinal position for the assessment of visual discomfort. Light. Res. Technol. 2019, 51, 291–303. [Google Scholar] [CrossRef]
  51. Donners MA, H.; Vissenberg MC, J.M.; Geerdinck, L.M.; Van Den Broek-Cools JH, F.; Buddemeijer-Lock, A. A psychophysical model of discomfort glare for both indoor and outdoor applications. In Proceedings of the CIE x042:2016 “Lighting Quality and Energy Efficiency”, Melbourne, Australia, March 2016; pp. 142–151. [Google Scholar]
Figure 1. TechnoTeam Rigo 801 Near-Field Goniophotometer used to characterize the luminaire.
Sustainability 14 13199 g001
Figure 2. (a) Picture of the Residenza luminaire, and (b) LID of the Residenza luminaire for C half-planes C0-C180 in bold and C90-C270 in pale. The lumen, power, and maximum intensity are shown in the top left.
Sustainability 14 13199 g002
Figure 3. A visualized representation of each parameter in the UGR formulae, average luminance over the luminous area, the solid angle substended by the luminous area, the background luminance, and Guth’s position index, from top left to bottom right.
Sustainability 14 13199 g003
Figure 4. An auxiliary drawing of how to determine the solid angle subtended by a pixel belonging to the luminous area at a distance D and angle α.
Sustainability 14 13199 g004
Figure 5. An illustration of the effect of blurring for a luminance image (a), and the blurred luminance image (b). After blurring, the effective luminous area (>500 cd/m2) is larger, though at the cost of the effective average luminance.
Sustainability 14 13199 g005
Figure 6. Luminance images of the luminaire for each orientation (a) C0γ50, (b) C0γ65, (c) C90γ50, and (d) C90γ65, from top left to bottom right.
Sustainability 14 13199 g006
Figure 7. Example luminance image of a controlled road lighting installation for illustrative purposes only, concerning different luminaires, heights, and distances. The yellow arrow indicates the direct background of the luminaire, the green arrow indicates the urban night sky, and the red arrow the road surface.
Sustainability 14 13199 g007
Table 1. Calculation parameters.
Pixel   Dimension   at   CCD   d p i x c a m ( mm ) 0.00645
Focal length lens f (mm)6.5
Pixel   solid   angle   ω p i x 9.85 × 10⁻⁷
Measurement distance D (mm)1540
Pixel   dimension   at   luminaire   d p i x l u m (mm)1.528
Background   luminance   L b (cd/m2) used in the UGR calculations1
Guth index γ = 505.391
Guth index γ = 652.689
Table 2. The calculated UGRimage, UGRLID, and UGR’ values for each orientation (i.e., C0γ50, C0γ65, C90γ50, and C90γ65). The variation in UGRimage and UGR’ values compared to the UGRLID values are indicated in brackets.
Orientation
C = 0
γ = 50
C = 0
γ = 65
C = 90
γ = 50
C = 90
γ = 65
UGR’29.0 (−10.2%)31.3 (−9.0%)24.0 (−8.0%)28.2 (−5.4%)
UGRimage28.8 (−10.8%)31.5 (−8.4%)22.9 (−12.3%)27.5 (−7.7%)
UGRLID32.334.426.129.8
Table 3. The calculated UGR’ values for each orientation (i.e., C0γ50, C0γ65, C90γ50, and C90γ65). The variation between the original blurring of 12 mm/pixel and 20 mm/pixel is indicated in brackets.
Orientation
C = 0
γ = 50
C = 0
γ = 65
C = 90
γ = 50
C = 90
γ = 65
UGR’
(12 mm/pixel blurring)
29.031.324.028.2
UGR’
(20 mm/pixel blurring)
28.6 (−1.4%)30.9 (−1.3%)23.5 (−2.1%)27.7 (−1.8%)
Table 4. The calculated UGRimage, UGRLID, and UGR’ values for each orientation (i.e., C0γ50, C0γ65, C90γ50, C90γ65, and C15γ75). The variation in UGRimage and UGR’ values compared to the UGRLID values are indicated in brackets.
Orientation
C = 0
γ = 50
C = 0
γ = 65
C = 90
γ = 50
C = 90
γ = 65
C = 15
γ = 75
UGR’29.0 (−10.2%)31.3 (−9.0%)24.0 (−8.0%)28.2 (−5.4%)47.0 (19.9%)
UGRimage28.8 (−10.8%)31.5 (−8.4%)22.9 (−12.3%)27.5 (−7.7%)53.5 (36.5%)
UGRLID32.334.426.129.839.2
Table 5. The calculated UGRimage, UGRLID, and UGR’ values for a luminance background of 0.5 cd/m2 and 0.05 cd/m2. The variation in UGRimage, UGRLID, and UGR’ values for both luminance backgrounds compared to the calculated UGRimage, UGRLID, and UGR’ values for a luminance background of 1.0 cd/m2 are indicated in brackets.
Lb = 0.5 cd/m2
Orientation
C = 0
γ = 50
C = 0
γ = 65
C = 90
γ = 50
C = 90
γ = 65
UGR’31.4 (8.3%)33.7 (7.7%)26.4 (10.0%)30.6 (8.5%)
UGRimage31.2 (8.3%)33.9 (7.6%)25.3 (10.5%)29.9 (8.7%)
UGRLID34.7 (7.4%)36.8 (7.0%)28.5 (9.2%)32.2 (8.1%)
Lb = 0.05 cd/m2
UGR’39.4 (35.9%)41.7 (33.2%)34.4 (43.3%)38.6 (36.9%)
UGRimage39.2 (36.1%)41.9 (33.0%)33.3 (45.4%)37.9 (37.8%)
UGRLID42.7 (32.2%)44.8 (30.2%)36.5 (39.8%)40.2 (34.9%)
Table 6. The calculated VD values for each orientation (i.e., C0γ50, C0γ65, C90γ50, and C90γ65).
Orientation
C = 0
γ = 50
C = 0
γ = 65
C = 90
γ = 50
C = 90
γ = 65
VD4.23.83.53.3
Publisher’s Note: MDPI stays neutral with regard to jurisdictional claims in published maps and institutional affiliations.

