


Abstract
Sustainable development encompasses numerous development goals and strategies, with green buildings (GBs) being among the implementations of this concept. The development of GBs is a topic of increasing interest due to the massive development of conventional infrastructure that has the major limitation of environmental degradation, a fact also proven by the research of the scientific literature, with publications in the field enhancing in recent times. Even if strategies applying the GBs concept have many advantages, the public acceptance is not so high due to technologies that still need to be optimized, the relatively low return on investment, and the limited dissemination of information about this concept. Therefore, the manuscript provides a comprehensive assessment in a distinctive way of GBs in the context of sustainable development, clarifying notions and principles of application while integrating green materials and circular economy into the general scientific framework provided. Moreover, a score has been proposed which is assigned to the different types of buildings described, based on the assessment of several specific parameters. This paper provides stakeholders, from designers to occupiers, with a coherent overview of the GB concept and its beneficial role for future generations in order to develop this field by increasing the dissemination of scientific information based on a technical-engineering perspective.
1. Introduction
Within the accelerated evolution of the society, and implicitly of economy, the energy shortage and deteriorating environment represent two major concerns of the global population today. Currently, the building industry has become the leading consumer of world energy supplies and of various energy resources such as wood, ores, and so on, and represents the main source of environmental pollution across the globe [1]. In the agreement with the United Nations Environment Program, the total energy use in the construction industry is responsible for approximately 30–40% of the globe’s entire energy consumption [2].
Globally, China has the highest energy consumption, while the consumption attributed to the building industry respond for 38% of the total energy use. These data highlight a grim situation, which clearly points to the fact that transforming and upgrading the construction field is a mandatory next step. The construction sector’s carbon emissions in 2020 reached 11.79 gigatons of carbon dioxide, representing 37% of all carbon emissions worldwide. A total of 17% of them were attributable to residential buildings’ operational carbon emissions [3]. Therefore, it is essential to accelerate the implementation of sustainable development strategies towards carbon neutrality as promptly as possible since the world’s climate continues to worsen. The foundation for examining past emissions and forecasting future pollutants is the development of an emission characterization model based on urban population and urbanization rate, industrial structure, carbon emission factor, energy intensity, economic deficiency, and the gross domestic product per capita [4]. Additionally, the industry is challenged to pinpoint a greener, sustainable, and environmentally friendly solution for future development. Thus, there are pressing needs to explore and establish a sustainable development approach within the construction industry, with the purpose of reshaping the current situation characterized by high environmental pollution and high resource consumption [5].
In 1987, the sustainable development concept was introduced for the first time by Brundtland Commission (WCED, 1987); since then, this term has evolved in accordance with social and economic changes [6]. The emergence of this concept is based on the necessity to correlate human development with the obligation to manage resources as effectively as feasible. It was a crucial moment when the scientific world realized the limited nature of all resources. It evolved into a tool based on the concepts of advancement (socio-economic growth within ecological boundaries), requirements (redistributing resources to provide a high standard of living for all the population), and subsequent generations (potential for long-term resource management to assure the essential level of quality of existence for future generations). The Triple Bottom Line theory, which aims to balance the three components of sustainability (environmental, social, and economic) forms the basis of the concept of sustainable development. Environmental sustainability aims at maintaining the environment’s overall quality. Economic sustainability focuses on preserving the human and natural capital for an improvement in the quality of life. Furthermore, social sustainability intends to highlight the importance of equality and human rights [7]. At present, it has expanded its meaning and it is being used for diversified goals, issues, and by various professions. Throughout this term’s evolution, different meanings were attributed to the concept of sustainable development. Generally, there is an encompassing consensus on the fact that the appropriate environment, economy, and society are the main factors that contribute to sustainable development. However, the sustainable development term remains ambiguous and challenging to comprehend, several features being correlated/attributed to it, as well as to the sustainable building (SB) design (Lombardi, 1999, Ding, 2005) [8,9].
Sustainable development concept was debated in 1992, at the United Nation Conference on Environment and Development, which have taken place at Rio de Janeiro, Brasil [10,11], which was considered as being the very first conference on environmental issues of international impact, and where many world leaders participated, and cooperation for international partnerships and agreements on environmental protection were promoted [12]. The conference led to a series of important conclusions and culminated with the Rio Declaration on Environment and Development, highlighting 27 strategies for achieving sustainable development. Although there have been extensive discussions and deliberations on an international level, the concept of sustainable development remains multi-dimensional, complex, ambiguous, and difficult to comprehend within the exclusive context of environmental issues [8,9].
Numerous economic and social presumptions have changed as a result of the effects of the global economic crisis of 2007. Due to the complexity of sustainable development concepts, the world economy, and the variety of objectives, it became explicit that the typical approach of thinking and operating was not only unsustainable but also harmful to the environment, population, and economy. Thus, their representation was converted into a new, more sustainable form [7]. It is still in research how to define what really constitutes the sustainable development concept, to underline the criteria applicable in the sustainable design, and to accurately achieve sustainable level of performance regarding the building envelope. Thus, it is essential to evaluate the function of a sustainable development approach in sustainable envelope design. This assessment can be performed by examining the effects of sustainable envelope design on general building sustainability.
The green building (GB) concept has grown exponentially as a research topic in recent years as a result of the increasing contradictions between the massive expansion of construction and the degradation of the natural environment [13]. GBs involve the comprehensive management of developing structures and utilizing technologies that are environmentally aware and asset effective over a building’s life cycle, including locations, concept planning, assembly, development, maintenance, restoration, and disassembly [14].
Prior research has shown that GBs can provide significant results, such as promoting the recycling and reutilization of materials, enhancing energy efficiency, enriching the ecological system, implementing sustainable land management, preserving the biosphere, and lowering CO2 emissions and waste products. The continuous cooperation between the government, researchers, technology providers, and consumers, is important for the achievement of a sustainable building infrastructure [15]. Due to insufficient GB highly accurate technology, prolonged investment recovery periods, and poor information dissemination, which are core issues in the sustainable development of GB, GB is not widely and immediately adopted by the general public as a novel form of architecture. Therefore, there is currently potential for additional investigation due to these open gaps [16].
The vast majority of recent analyses provided by the scientific literature are scattered and confined. They frequently merely address a few components of GBs in the context of sustainable development instead of thoroughly and methodically analyzing the issue. Because a significant proportion of relevant research focuses on aspects related to a specific area or nation, the findings lack representation on a multinational scale. In order to gain an in-depth knowledge of the current situation and potential future approaches, the present manuscript comprehensively assesses, from an engineering point of view, the state of GBs as an indispensable tool for the future of sustainable development.
The aim of the present paper was to create a coherent, clear, well-systematized and useful scientific framework, that would serve as a starting point in the field of construction (and all related aspects, such as design, energy, installations, materials, etc.) for researchers, administrative-territorial units, architects, designers, as well as beneficiaries and investors. The idea of this paper took shape in the context of drastic climate change and a growing concern for reducing greenhouse gas emissions and CO2 emissions, with real improvement only made possible through sustainable design. Moreover, starting from the fact that in most publications, GBs are often confused with sustainable buildings (SBs), this paper clearly differentiates GB from other concepts associated with buildings (smart buildings (SBs), passive houses (PHs), nearly zero-emission buildings (NZEB)), in the context of sustainable design. Furthermore, the presented material clarifies and provides an extremely useful database to those in the field of construction, entrepreneurs, property owners, residents of buildings of various types, site managers, manufacturers of building materials, specialists in renewable energy sources, etc. Finally, the design and methodology of this study are based on an assessment of the concepts of sustainable development, GB design, renewable energy sources, GB certification systems, and green materials, by providing a scientific background on these key terms, the legislative framework, and their applicability in a comprehensive and distinctive way.
2. Methodological Approaches
The present manuscript filters and evaluates scientific publications on GBs in the context of sustainable development between 1987 and 2022, based on a comprehensive search and selection of literature on applied engineering concepts and optimal exploitation of renewable resources, with the aim of enhancing the advancement and implementation of sustainable development, green design concepts, and circular economy features. To achieve these goals, large and scientifically validated databases were searched (i.e., ScienceDirect, Google Scholar, Web of Science, SpringerLink, ProQuest, Wiley Online Library, and Nature), applying pre-defined algorithms correlated with the Boolean AND operator. Furthermore, the selected manuscripts were of the article type and written exclusively in English. Figure 1 depicts the PRISMA workflow diagram including sets of items related to the literature selection and evaluation process, in full compliance with the recommendations provided by Page et al. [17]. After evaluation, selection, and revisions of this paper, 149 bibliographic resources validated the scientific information in this manuscript.
Figure 1.
Literature selection depicted in a PRISMA 2020 flow diagram.
3. Trends in Building Design—Conceptualizations and Applicability
The buildings of the future will be focused on people and on the planet, respectively, on the concerns regarding the next generations. Thus, the materials from which they are/will be built must be environmentally friendly. The way that they are heated and cooled, to ensure their use/operation, must also be environmentally friendly. Buildings have the role of making people’s lives easier, as they evolve in sync with the technological developments and then become intelligent buildings, capable of providing people with the healthy environment and comfort that are needed for carrying out daily activities. Constructions will thus meet the performance requirements of the functions they serve. Moreover, they are not permitted to alter the environment through consumption and pollutants, but they must be integrated in a clean, unaltered environment.
The concerns of humankind regarding the constructions of the present and of the future (even the near future) are closely linked to climate change, and thus to a sustainable approach. This implies that no matter the type of building (green building or GB, passive building or NZEB, etc.) the focus is on durability/sustainability/cost.
3.1. Sustainable Building Design
It is challenging to define GBs, considering the continued evolution of this concept, developing and generating an extended range of opinions. The World Green Building Council (having representation in approximately 70 countries and being a large network of GB councils) acknowledges the fact that countries/geographical regions possess different specific features such as historical context, cultural identity and traditions, specific climate conditions, distinct building types and ages, as well as economic, social, and environmental opportunities and priorities that contour GB practices [18].
The concept of GB is not universal and constant across the globe, the definitions are provided in accordance with the specifications of national and regional construction industry developments. World GBC defines a GB as a building which aims to reduce or to fully eliminate the negative impact on the environment throughout its entire lifecycle, while also generating positive impacts on the local environment and the climate [18,19]. Additionally, this concept has been described by the United States Environmental Protection Agency (USEPA) as “the practice of creating structures and using processes that are environmentally responsible and resource-efficient throughout a building’s life cycle from siting to design, construction, operation, maintenance, renovation, and deconstruction” [20].
A widely accepted description in the European Union, as well as in the United Kingdom, states that a GB contributes to conserving the environment, within the parameters of well-being of the building occupants, concerning the use of space and the quality of indoor air. This term is similar to the definitions of SBs and sustainable construction. The concept implies not only energy efficiency, but also other aspects, including the decrease in CO2 emissions, although this seems to somewhat differ in the EU compared to the US. BREEAM, which is the first GB certification system, can be a representation of the concept of GBs in the UK, focusing on energy efficiency, and also on the well-being of inhabitants and users of the building. According to this concept, GBs and SBs can be interchangeable [21,22].
Designing the SB meeting, all requirements of sustainability can sometimes become a real challenge to the construction designers, as well as the building professionals [23]. In order to integrate the concept of sustainable development into building envelope design, it becomes essential to implicate the stakeholders taking part in the process of SB envelope design. All competing sustainable development elements must be considered throughout the design of a sustainable envelope so as to successfully attain building/construction sustainability, an issue which is faced by the construction industry but can be possibly resolved by applying the sustainable development concept and principles during the initial stages of building design [24]. Additionally, the challenge of sustainable development regarding the building envelope has been extensively detailed regarding four interconnected fields, including: environment, participation, equity, and futurity. This statement was discussed at the 1992 Earth Summit, in Brazil. A total of 27 principles were established in relation to sustainable development practices, on the basis of the four interrelated areas of sustainable development above-mentioned, and contained in Figure 2 [25].
Figure 2.
Sustainable development’s four connected fields.
The theoretical concept presented in Figure 1 highlights the link between sustainable development values which in turn generate sustainable development principles and strategies, sustainable envelope design, and, lastly, building sustainability. Observing the relationship between the aforementioned items, it can be assessed that it is necessary to balance the sustainability factors (e.g., the environment, the economic situation, the surrounding environment, energy resources, and social context) for making sustainable design decisions in regard to the building envelope. Thus, there is a challenge to check the sustainable strategies and practices, in order for achieving sustainable building design within the construction industry [26].
Designing a SB/GB is about the practice of realizing structures and utilizing techniques/methods/processes characterized by environmental responsibility, that exist and function throughout a building’s life cycle. Chronologically, the life cycle includes stages such as “site selection”, “design”, “construction”, “operation and maintenance”, “renovation”, finalizing with the “demolition”, the practice not only expanding, but also complementing the classical design in construction, in areas such as durability, utility, economy, and comfort [27]. A SB is also considered a GB or alternatively, a high-performance building. The feature elements of the SBs are as follows:
- The ability to accumulate and meet all the water and energy requirements on site;
- The capacity to adapt specifically to site climate and evolve in accordance to changing conditions;
- Pollution-free operation and zero waste generation in regard to waste that is not useful for another process in the building or for the surrounding environment;
- The ability to promote the health/well-being of building inhabitants, representative of a healthy ecosystem;
- The integration of energy efficient systems, that maximize both efficiency as well as comfort;
- The tendency to improve the health and to expand the diversity of the local ecosystem instead of damaging it;
- To be aesthetically pleasing and visually inspiring [28].
3.2. Scientific Framework of Passive Buildings and a Nearly Zero-Emission Buildings
The passive house (PH) ensures a comfortable indoor climate, both in winter/summer seasons, needing for a conventional heating source. The minimum requirement can be ensured through heating the ventilated air, by respecting the following criteria:
- maximum 10 W / m2 required constant heat;
- maximum 15 kWh / m2 required annually with space heating;
- maximum 42 kWh / m2 required annually total energy consumed.
The term PH considered the concept of lowering the heat losses to a minimum, thus rendering large heating systems irrelevant. Under 10 W/m2 of living area (with the peak heating loads stagnating), the low residual demand for heat can be delivered through the air supply by a post-heating coil. A PH can be defined as a building that does needing no heating system besides post air heaters. In a standard PH, no traditional heating (or cooling) systems are required. The PH concept and the physics behind it remain constant throughout the different climates of the world. However, while PH principles are the same across the world, details undergo adaptations depending on the specific climate of a certain geographical area. A building that fulfills the PH standard will look different in Zimbabwe compared to one in Alaska. [29].
The PH concept imposes a building standard which brings together affordability, comfort, and energy efficiency. PHs permit a degree of heating/cooling space which allow up to 90% energy savings, comparatively with standard constructions, and of over 75% in comparison with new constructions, using 1.5 m3 of gas or <1.5 L of oil in heating 1 m2 living space/year—this consumption being significantly lower than in the case of “low-energy” buildings. Major energy savings were registered in warmer climate zones, with standard buildings also requiring systems with active cooling. PHs efficiently utilize the sun warmth, as well as both internal sources of heating and techniques/tools/methods of heat recovery, eliminating the need for conventional heating systems even in the coldest winters. In the warmer season, PHs utilize passive cooling techniques, including strategic shading, in order to maintain a comfortably cool temperature. PHs are known to generally offer a high level of comfort. Temperatures of internal surfaces remain comparable to indoor temperatures of the air, even when in the case of extreme outdoor temperatures. Keeping the desired heat within the house, as well as the undesirable heat outside of the house, is made possible by incorporating special windows, highly insulated exterior walls, and an envelope of the building made of a strong insulated floor slab and roof. Constant fresh air is supplied through a subtle ventilation system, which ensures superior air quality while avoiding unpleasant draughts. An efficient heat recovery system allows the re-use of the heat contained in the exhaust air [29].
3.3. Green Building Design and Principles
Environmental issues and sustainable architecture have become components of the business agendas for both local as well as international communities. They are topics that are addressed almost to an excess. The term of “sustainability” and the concept of “sustainable architecture” are currently trending in the architecture’s frame and design for at least two specific purposes: formal and functional. A sustainable considered item must demonstrate its ecological awareness and therefore, the item’s functionality needing being linked to its correlation with the environment by way of its appearance.
Additionally, sustainable architecture designs help in realizing constructions with the goal of limiting their environmental impact. This goal is attained by achieving energy efficiency and improved livability for inhabitants, and by having a positive impact on health, well-being, and comfort, and the way to achieve all of this is through the incorporation of suitable technologies within the building. The concept of sustainable architecture includes specific characteristics requested in order to satisfy the consumers’ most demanding needs and requests. Meanwhile, they are evaluating both the necessary time for raising a building and the natural resources needed from the very beginning phases of the project, stepping into the context through a natural-centered approach, and in consequence, planning and designing to solve the space and employed materials as reusable. Designing sustainable architecture entails taking several essential elements in account, as follows:
- building orientation on the land surface and natural light dependence;
- natural ventilation;
- shading vs. sunlight provided by all the pre-existing elements in the site;
- the use of biomass;
- domotics/home automation/Ambient Assisted Living.
The renewable energy systems, all of the above mentioned parameters/characteristics designed, produced, and incorporated with materials that interact in a specifical manner with the environment, its issues and particularities [30]. Figure 3 outlines the defining elements in the design of energy efficient buildings. The degree of efficiency is the result of design (envelope, equipment, materials), execution, and operation.
Figure 3.
Designing—conceiving energy efficient buildings.
Designers have the possibility to conceive specific characteristics in the buildings that assure the imitation of the functions of other already existing specific eco-systems. Species living and thriving in these natural ecosystems are allowed to turn to habitats designed within man-made structures. Conceiving and realizing a new habitat within structures located in urban places plays a particularly relevant role in supporting the biodiversity, and implicitly maintaining a healthy ecosystem [31,32].
The following data brings together the strategies, key principles, and technologies correlated/associated with the main 5 core elements of GB design:
- Sustainable Site/Location Design;
- IEQ;
- Energy and Environment;
- Conservation of Materials and Resources; and
- Water Conservation/preservation and Quality.
This consideration comes to supporting and justifying the integration of the USGBC LEED Green Building Rating System, emphasizing in the same time strategies and principles, rather than technologies or clear-cut solutions, which are typically specific to the building site and vary with each project (USGBC). The principles adopted in GB practices dictate the application of “Green” characteristics and features in both building construction, as well as redevelopment. In 2016, the first five important above-mentioned components of GB design were published. Figure 4 shows the authors’ assessment [33] of the GB principles, in a schematized way.
Figure 4.
Principles governing the application of “Green” characteristics in building construction.
According to the evaluation of this study, it has been repeatedly discussed and assessed that, in developed countries, buildings have a rate of energy consumption between 30–40% of the total energy consumption. Thus, the performance that can be achieved by the sustainable energy of GBs (including zero energy buildings (ZEB), ultra-low energy buildings (ULEB), and low energy buildings (LEB)) is justifiably the main focus area of current efforts. The reviewed theories and implementation accounts, and also the next perspectives clearly accentuate the critical need to evolve together with the GBs development, and designate them the standard basis for local/international constructions standards, regulations, and policies [34].
Although most of the findings are extracted from the already published academic research related to innovative sustainable design practices in order to enhance building energy performances, the associated literature also includes studies related to additional correlated issues on the energy conservation. A 2010 published research evaluated and analyzed specific commercial buildings for confirming the existence of high levels of energy wastage, highlighting the necessity to consider also the issues associated with user behavior and user-generated energy wastage [35]. On the other hand, it was suggested that the energy performance simulations analyze the constructions currently in operation; whereas, the analysis/simulation of the performances should be incorporated in the process of building designing for the purpose of assessing the material, form, and integrated systems during the same designing phase of the building [36]. Considering the study and research of sustainable energy performance indicators, the analysis addresses the actual results and attempts at developing environmental system models for the assessment of building performances. In this context, the obtained results delve into examining energy performances, thus identifying the principal sustainable energy performance indicators as socio-cultural, economic, and environmental characteristics parameters [37]. The study conducted by Mwasha et al. comes in support of these findings and concludes that in regard to SB performance indicators, it is crucial to take into account the economic/energy efficiency of buildings, in addition to the socio-cultural advantages they are offering [38]. The 2010 studies carried out by Lombera, completely focus on the sustainable environmental index of buildings, as well as the function of building materials, construction process, building site, energy consumption, and waste management, as essential parameters/characteristics of sustainable energy performance indicators, in the case of industrial buildings [39,40].
3.4. Smart Building Features
A Smart Building is capable of retrieving information from a variety of input channels (sensors), processing it according to its default settings, and providing actions in response. Smart Buildings, also referred to as intelligent buildings, utilize technology in the service of people, in order to provide a safer, more comfortable, and productive environment. The concept is flexible, so that it can be adapted to commercial, residential, and even industrial buildings. The specific abilities of IoT devices of collecting, processing, and analyzing data from various areas and elements, allow us to obtain automated control and oversight of the operation of a building in real-time. Moreover, this offers the possibility of increasing the usability, safety, accessibility, and energy efficiency of the building space [41]. Considering the novel automation techniques and control systems, it is now feasible to develop buildings that are capable of reducing energy consumption, improving the surrounding environment, maximizing the safety of building inhabitants and users, and limiting the environmental impact through a responsible consumption of resources [41].
Nowadays, in the context of an increasing emphasis on digitization, there is a constant challenge to transform existing buildings into smart and energy efficient buildings, as well as design and build new smart buildings. A building that is designed today must be both green and sustainable, but also energy efficient, in order to meet the needs for responsible design of the future generations.
3.5. Principles of Green Neighborhoods and Green Cities
In this context, it all originates form the idea of creating a pleasant environment for residents, such as that of a quiet neighborhood with recreational facilities, while also ensuring recycling practices and environmental protection. Realistically, a “green” house cannot be built in a polluted city, but only in areas where all inhabitants share the same approach, such as in the scenario of a neighborhood built from scratch, through the application of environmental protection principles from the conception phase. Thus, the emphasis is not only placed on financial comfort during use, but also on the comfort of living, while preserving the environment. The three elements mentioned above complement and aid each other: a house that brings together all these elements has a significantly lower initial cost than a passive house, but also manages to incur low costs during use. Moreover, the simple fact that its inhabitants remain healthy and are not exposed to the aggressions of pollution present in a typical city, [5] is a huge benefit, both in terms of quality of life, as well as in terms of financial advantage [10].
As opposed to the commuter-centered cities, which were a by-product of the Industrial Revolution and the accelerated trade and production developments of the 20th century, the novel trends in urban planning have introduced the construction of eco-neighborhoods. These urban projects are developed with the intent of decreasing the influence on the environment, and altering the living places, activities, and inhabitants, as well as making them more aware of their influence on the surroundings and more responsible for their immediate environment. The key to successfully implementing this type of initiative is the use of sustainable technologies and materials in the construction of buildings and other infrastructures [42].
According to information provided by the United Nations, by the year 2050, approximately 68% of the global population will live in cities which despite the fact they account for just 3% of the earth’ s surface, they produce approximately 60% of greenhouse gas emissions and consume 78% of the total energy. In this direction, in 2016, the improved New Urban Agenda was adopted, which had the purpose of advising countries about correct urbanization processes in order to assure more habitable cities, resilient, inclusive, healthier, and sustainable [42]. The basic principles of a Smart City are shown in Figure 5.
Figure 5.
The principles of a Smart City.
The cities inhabited by most Europeans will play an important role in achieving sustainability goals. The European Environment Agency has recently brought together stakeholders in the process of building sustainable cities in Europe, with the purpose of developing a common conceptual framework, which serves the basis for the report and the briefing note that we have recently published, as well as for our future assessments on this topic [43,44,45]. The framework is intended to help city authorities and policy makers to design a strategy for transition to sustainability, by analyzing the concept of urban sustainability from six different perspectives: the circular city; the resilient city; the city with low carbon emissions; the green city; the inclusive city; the healthy city [46,47,48]. From creating green and blue zones in the city center, to integrating public transport into active mobility systems (such as cycling and walking), or creating more efficient recycling systems, the solutions that cities can adopt in the process of transition to urban sustainability are countless [48,49]. Wider adoption of technological innovations (electric vehicles, teleworking, etc.) can speed up the process. European green capitals also clearly show a coherent long-term vision, supported by relevant governance structures, as well as practical knowledge and real data. This long-term strategic approach truly has the potential to transform a city in a few decades [50].
4. Certification of Green Buildings
There are several types of GB certifications in the world [19,23], of which Table 1 summarizes the most important ones, in chronological order.
Table 1.
Certification of GBs.
5. Energy of Green Buildings
5.1. Energy Used in Green Buildings
For minimizing the energy consumption of a building, and ultimately mitigating CO2 emissions through energy conservation, there are core approaches:
- Design focused on comfort and optimal orientation for harnessing solar energy;
- Low embodied energy materials used for building’s construction;
- Energy efficient domestic appliances for conserving the building’s operational energy;
- Renewable energy technologies integrated within the building [43].
The most sustainable energy practice is maximum energy conservation within the building. Passive solar building design can provide immense support for energy conservation efforts because the energy consumption is directly linked to and influenced by the building design. Constructions having passive solar designs naturally use solar light for no-cost heating/cooling, as well as lighting during daytime. This significantly decreases the energy needs, coming from other sources and maintaining a comfortable indoor living environment. Passive solar design characteristics in line with a wide array of architectural styles, and can be part of the renovation plan of an existing building, so that the building becomes a net zero energy construction [44].
Humanity’s expanding energy demand, together with a constantly increasing number of the population, led to continued use of the well-known, classic energy sources/resources, such as fossil fuels (gas, coal, oil). This situation has turned into a challenge, as it has caused many problems, including increasing greenhouse gas emissions and growing concerns related to the environment, depletion (at an alarming rate) of fossil fuel tanks, military/geopolitical conflicts, and, of course, the continuing fluctuations in fuel prices. These issues are bound to lead to an unsustainable global setting, which in turn, will eventually result in the creation of irreversible threats to the global human society (UNFCC, 2015). Definitively, renewable energy sources represent a superior alternative and the only feasible solution to the aforementioned challenges. In 2012, according to the information provided by the US Energy Information Administration, the renewable energy sources generated 22% of the whole world supply with energy. Such a high percentage would not have been possible a decade ago [45,46,47,48]. In 2014, The International Energy Agency stated that a reliable energy supply can be considered as being essential for all worldwide economies, for ensuring lighting, heating, industrial equipment functionality, transport, etc. Renewable energy sourcing significantly and obviously reduces the greenhouse gases emissions, when evaluated in comparison with the fossil fuels. Evaluating the fact that renewable energy is naturally obtained from the continuous contributions of different types of energy existing in the environment, it can be characterized by sustainability. Furthermore, it should be emphasized that in order for renewable energy to be considered as being sustainable, it is mandatory to be both unlimited but also to ensure the optimal delivery of services and goods in relation to the environment (i.e., sustainable biofuel for not increasing net CO2 emissions, respectively, or negatively impact food security, or pose a threat to biodiversity) [49].
Despite the obvious advantages presented by renewable energy sources, there are also certain shortcomings, such as the irregular and inconsistent generation of energy, as an effect of seasonal variations, considering the fact that climate and its changes are in strict correlation with the main renewable energy resource. Due to this challenge, renewable energy exploitation needs detailed design, planning optimization methods, control and follow. Therefore, recent and future technological advances in computer software/hardware systems allow scientists to address these optimizations by using specific computing resources that are appropriate for the direction of sustainable, renewable energy [50]. Renewable energy sources (as the name implies) are naturally renewed, but they are also not subject to depletion in time. Renewable energy sources are about geothermal, wind, solar, hydropower, ocean (tide and wave) energies, and bioenergy [51,52]
5.1.1. Renewable Energy Sources
This energy manages to gather under its umbrella those energy sources related to a persistent, natural flow of energy that takes place in the proximal environment, including the following energies: geothermal, direct solar, wind, ocean (tides and waves) and hydropower, as well as bioenergy.
Hydropower
This is a highly important energy source, which is harnessed from the water that moves from higher to lower elevation levels, in order to move the turbines and, as a result, generate electricity. Hydropower designs and projects, which cover a wide range in project scale, come in different shapes, including dam projects with reservoirs, in-stream projects, run-of-river projects. Hydropower technologies are considered as technically mature technologies, with projects that exploit a resource that demonstrates temporary variability. The operational processes of hydropower reservoirs highlight their multiple uses (drought), as well as flood control [53,54,55].
Gravity is what provides the primary source of energy, using the height from which water falls on the turbine. The potential energy of the stored water is given by the gravity factor (g = 9.81 m /s2), the mass of the water, and the height (known as difference between the dam / tail levels of the water). Somewhat, the reservoir’s water level goes down with the release of water, and thus influences the production of electricity. Turbines are designed and built for an optimal flow of water. Hydropower offers many advantages because, from a practical point of view, it does not generate particle-based pollution, and can be upgraded just in time, and it has the capacity of storing energy for an extended amount of time in hours [56,57].
The technical yearly potential for hydropower production is 14,576 TWh, having an approximative total potential capacity of 3721 GW. However, at present, the world-wide installed hydropower capacity can be considered significantly below its potential. Taking in account the 2013 World Energy Council Report, four countries (namely Brazil, China, USA, and Canada), share approximately 50% of the entire installed hydropower capacity. It is, however, known that climate change alters the potential resource of hydropower. Globally, the existing changes in the actual hydropower system of production, that are attributed to climate changes, are estimated as being <0.1%, although supplemental research will be needed to decrease the uncertainties of the estimations provided [58].
Since hydropower production does not generate greenhouse gases, it is viewed as a green energy source. Nevertheless, it poses both advantages, as well as disadvantages. Hydropower generation improves the socio-economic evolution of a country, but, from a social impact perspective, when a hydropower system is installed and operated, an effect is that many people end up being displaced from their homes and are compensated insufficiently for this aspect. The hydropower production site is often exploited with detrimental effects. For example, many times, with the reservoirs being artificially made, this has the consequence of flooding the previous natural environment. Moreover, the water is drained from the original sources (such as lakes) and then transported by means of canals and pipes over considerable distances to the turbines often positioned visibly. Hydroelectric structures, due to the construction of dams/dikes/weirs, affect the ecology of natural water flow, mainly inducing changes in its hydrological characteristics, disrupting seasonal, periodic migrations of certain fish varieties, and interrupting the ecological continuity of sediment transport/movement. In places where many plants/trees are flooded due to water damage constructions, rotting plants in the water can lead to the formation of methane gas, which is either released directly or while the water is being processed in turbines [57,58].
Bioenergy
This type of energy is listed as a renewable energy source which is generated by the biological resources. An essential energy source, bioenergy is usable for heating or cooking, biodiesel-fueled transport, and generation of electricity. A wide range of sources can be considered when producing electricity from bioenergy, including agricultural residues—forest by-products (such as the wood residues), animal husbandry residue (such as the cow dung), and sugar cane waste. Fuel often resulting as a by-product, waste product, or a residue, from the afore-mentioned sources, is one of the main advantages of the biomass energy-based electricity. The impact and relevance of this specific aspect lies in that there is no competition between the ground for fuel vs. land for food [59]. At global level, the biofuels production is somewhat reduced, but it is on a rise tendency [60]. In the United States, 15 billion liters was the annual biodiesel consumption, reported for 2006, and it has been increasing with 30–50% yearly, having an expected target (at that time) of 30 billion L/year until the end of 2012 [61].
In the future, biomass has an immense potential for ensuring fuel supply, meanwhile being considered for decreasing greenhouse gases. Extensive studies have been conducted in this field for quantifying the global biomass technology. As the published data states, approximately 3500 EJ/year represents the theoretical entire bioenergy potential, relative to the earth’s surface, the locations with the best potential being in the Caribbean and South America (between 47–221 EJ yearly), sub-Saharan Africa (between 31–317 EJ yearly), the Baltic States and the Commonwealth of Independent States (between 45–199 EJ yearly). Both the resulting biomass yield and its potential obviously vary between the many countries, with average yields being reported in areas with temperate climates and high levels in zones with tropical/subtropical climates. Regarding the identification and implicit use of these sustainable and ecologically acceptable sources of biomass, much of the research focuses on identifying and capitalizing on the optimal information to mitigate the increasing changes in climate [62,63].
Historically, finding, identifying, and using biological-based components (i.e., animal, plant, mineral, etc.) capable of generating energy has always been a necessity for mankind. The public is sensitive to the idea of using food produce to provide fuel in a situation where generalized population hunger and insufficient food is a reality in deprived countries. It is reported that 99.7% of human food is the result from land and about 0.3% comes from the Earth’s waters (seas, lakes, rivers) (underlining here, once more, that already, the most suitable land implied in the biomass provided is used) [60]. The negative/positive effects on the socio-economic aspects of the production and use of bioenergy, but also on the environment, have been highlighted in published studies. Considering the general forestry and agriculture systems [64], the production of bioenergy accentuates vegetation and solid destruction, in a strict correlation with the water and forests overuse and overexploitation, excessive removal of forest/crop residue [65]. Conversion of land or specific crops into bioenergy generation sites induces commodity food prices, thus affecting the food security [66]. Optimizing soil and crops management would result in positive effects, including enhancing biodiversity [67,68], soil carbon increasing, and a better quality, improved soil [58,67,69].
Solar Energy
“Direct solar energy” expression considers the renewable energy technologies that use direct solar energy. Other technologies (from renewable sources) (such as wind, thermal, and ocean) are based in part on energy (which has already been absorbed/transformed into other forms) from the sun. Solar-based energy is the result of irradiation, generating electricity through photovoltaic cells [70] and focusing this huge solar energy, in order to generate thermal energy, meeting the needs of direct lighting and, collateral, for the production of fuels usable for transport, heating, etc. [58]. Since 2013, as it was stated by the World Energy Council [71], the energy from solar radiation that fell to Earth’s surface resulted in >7500 times the total yearly consumption of the primary energy in the world, namely 450 EJ [59].
Geothermal Energy
Sourced naturally, coming from the inner earth, geothermal energy is considered as representing a heat energy source. The internal structure of the earth/the physical phenomena tacking place in that environment relates to the origin of the heat. It is well known that heat is present in the earth’s crust in immense and excessive quantities, and even more so in its deep inner layers of the earth, often located at unavailable depths to allow mechanical exploitation. The geothermal gradient is considered to have an average value of approximately 30 °C/km. Areas further inland can be accessed by drilling, each gradient being more significant than the average gradient. [72]. Heat can be extracted from geothermal deposits by using different means (such as wells). Existing deposits, sufficiently hot and naturally permeable, are known as hydrothermal tanks; another option is the still adequately hot tanks, which by hydraulic stimulation are optimized/improved, and are known as improved geothermal systems (ESG). From the moment they reach the surface, these fluids with varying temperatures are potentially used to produce electricity, or for other purposes that require the use of thermal energy [58].
Wind Energy
Wind has not only emerged as a considerable essential source, but it has also taken a leading place among renewable energy sources. Winds (air currents) are present in all geographical areas of the world, with different intensities, in some locations/areas with energy density worthy of consideration [73]. The kinetic energy of continuously moving air at different speeds is harnessed by wind energy. Given the worrying prospects of climate change, it can be said that the most appropriate and sustainable application of wind energy is precisely the generation of electricity. This is done through large turbines—installations for transforming wind energy into electricity, which can be placed both offshore (in salted water of the seas and in freshwater) and onshore (on the land surface) [74]. Already on a large scale, these onshore, wind-based energy technologies are currently manufactured and deployed [58].
Ocean Energy (Wave and Tide)
The passage of wind over water leads to the formation of surface waves. The energy production of the waves is even higher and is necessarily and directly dependent on the increase/intensity of the following factors: wind speed, time/duration in which the wind is sustained, the distance traveled by the wind, and obviously the height of the resulting waves. [75]. The ocean stores sufficient energy to meet ever-increasing energy requirements through waves, currents, tide, and heat. The first generation of commercial devices for harnessing the energy of the oceans were launched in 2008, with the first units installed in the Portugal-Pelamis and the UK-SeaGen. Currently, four ways of generating energy using marine space are recognized, as follows: thermal differences between different depth levels of seawater (deep vs. shallow), wind, tide, and waves [76]. The methodology approach for green cost/benefits is schematized in Figure 6.
Figure 6.
The flow chart describing the methodology approach for the ratio green cost/benefit.
5.2. Green Building Energy Consumption
One of the most relevant performance indicators of a building is energy consumption, whereas in the case of developing a GB, it is about reducing the energy consumption of that building. Most GB rating standards assign the most “points” for the design of energy saving. In this context, studies conducted on the evaluation of the energy performance of constructions are essential. Recently, due to the presence and observation of a performance gap, investigations have been intensified to determine whether GBs, when occupied by residents/users, achieve the designed energy-saving standard.
A 2010 study conducted over a period of more than one year summarized the information provided in the utility bills regarding energy use, resulting in data on the general sustainability of 12 GB belonging to the General Services Administration [77]. The operating energy consumption of the GBs was measured against the values registered by the Commercial Buildings Energy Consumption Survey. The conclusions of this evaluation were that the mean energy performance of the GBs from the study was 29% better than the average value of CBECS, and that the average GB energy performance in the study was approximately 29% more optimized than the mean value mentioned in the survey.
Another study comparatively evaluated the features of LEED vs. non-LEED constructions located in the United States, in the northwestern part of the Pacific Ocean [78]. For 41 buildings with the same characteristics and built in the same area, results were obtained which prove that the average value recorded for energy consumption/floor area, was 10% lower for the 12 constructions LEED vs. the 39 non-LEED constructions. In North America, other authors evaluated 121 buildings classified as LEED, by measuring the energy performance. On average, it was observed that LEED constructions achieved an energy saving of between 25 and 30% compared to the average value recorded / calculated at national level of all commercial buildings. Compared to the energy consumption mentioned in the design phase, the measured energy use index (EUI) showed a significant scatter. Compared to the projected value of “real EUI”, the deviation was very high, ranging from 25% worse and 30% better to more than 50% of the buildings. In addition, the average energy savings went up simultaneously with the mentioned level of certification, however, registering scattered values for IUE of constructions with identical level of certification (i.e., gold-rated buildings EUIs ranged approximately between less than 63 to more than 442 kWh/m2) [79,80].
Published research re-analyzed the results obtained previously by Turner et al., and it was observed that in the case of 28–35% of LEED buildings, the construction of a poorer actual/real energy performance vs. conventional counterparts, even at LEED buildings, the average value of energy consumption/floor area <18–39% compared to the energy consumption of conventional counterparts. Furthermore, there was no noticeable difference between the different levels of energy certification provided in the project and the measured, real, energy consumption values of GBs [81]. Diamond et al. used utility bills to compile the energy consumption values registered for 21 LEED certified buildings. Compared to the simulated prediction, the total energy consumption billed was 1% lower; the same simulated prediction exceeded the reference value by 27%. The real situation revealed that the energy performance achieved by the studied constructions showed significant imbalances (standard deviation of 46%). Moreover, the LEED energy efficiency score was not correlated at all with actual energy consumption [82].
The Center for Neighborhood Technology conducted a study of 25 GBs located in Illinois, using energy data collected across an entire year. The results concluded an obvious trend for reduced consumption of energy, which was correlated with more energy credits attained during the stage of design developing, with no correlation between the LEED certification level and the degree of energy consumption. In addition, only 10 of the 17 buildings evaluated had a lower consumption than the average recorded in that region, with most buildings having poorer results than expected. [83]. Summarizing the above-mentioned information, data investigating the GB energy consumption are comparatively presented in Table 2.
Table 2.
Published data investigating the GB energy consumption.
6. The Indoor Environment Quality of Green Buildings in Ensuring the Inhabitants’ Satisfaction
Occupants’ satisfaction and IEQ are two relevant performing areas in assessing GBs, and they can generally be considered major markers of GBs’ operating benefits. Occupant satisfaction and IEQ are inextricably linked, since research shows that an improved indoor environment contributes to greater occupant’s satisfaction, as well as improvements in productivity and well-being [92,93,94,95].
Recent scientific studies on the post-occupancy investigation of GBs combined personal occupant satisfaction assessments with objective IEQ evaluations. As a result, IEQ and occupant’s satisfaction was consolidated into an all-encompassing notion called overall IEQ performance, which contained both subjective and objective aspects. It is critical to define which elements target before analyzing the overall IEQ performance of GBs. There are two types of components that influence IEQ and occupant satisfaction: non-physical factors and physical factors. Indoor air quality, thermal comfort, acoustic environment, and lighting are four features of physical factors that can be assessed using quantitative measures. Non-physical factors include indoor features that are difficult to evaluate with instruments, such as cleanliness, facilities privacy, furnishing, view, and space layout. The existing literature had a propensity to focus on physical factors, rather than non-physical factors, due to their measurable nature [96].
McNaughton et al. studied IEQ factors in five non-certified and five certified LEED buildings in the United States. The researchers then examined the impact of IEQ on human cognitive performance. People who lived in GBs had improved performance and fewer disease symptoms than those who lived in conventional facilities, according to scientific findings [97].
A 2015 study compared the IEQ of a Green Mark Platinum building to a non-Green Mark-certified building, both situated in Singapore. In comparison to the GB, the conventional facility provided was approximately 1 degree Celsius colder, had a reduced luminosity, and had a 2.5–3 times greater air changing rate [98].
Pei et al. used objective measures and subjective assessments to investigate the IEQ performance of GBs in two different Chinese climatic regions. It has been reported that GBs’ objective IEQ performance fulfilled the planned metrics, and that GBs are more promising than conventional buildings [99].
POE studies were performed on the IEQ of 12 non-GB and 12 GBs in the northern United States and Canada. Furthermore, numerous environmental factors linked to better occupant satisfaction, such as a larger level of indoor luminosity, diminished background noise levels, attributes associated with thermal comfort, and lowered airborne particulates, were identified through on-site physical measurements and surveys applied to building residents. When compared to similar non-green buildings, GBs demonstrated greater performance in terms of both human and physical variables [81]. Additionally, POE survey data from two academic office facilities were analyzed in Sydney, Australia, highlighting that tenant IEQ satisfaction was associated with one’s own perceptions of the environment. As a result, in comparison with their non-green counterparts, GB residents had an increased IEQ satisfaction [100].
Another research study evaluated interactions between facility maintenance and support services for occupant’ s satisfaction and IEQ in seven office facilities in Seoul, before selecting two constructions for closer examination. The analysis revealed that both offices’ occupants were satisfied related to their IEQ [101]. The interaction between energy utilization, occupant satisfaction, and IEQ was further assessed after analyzing each measure of operating performance in GBs. The essential information from past studies on the relationship between these parameters are presented below.
Firstly, objective IEQ performance is strongly linked to human factors, particularly occupant satisfaction. Humans are the indoor environment’s direct service object, and they have the ability to intuitively sense if the IEQ parameters can be considered as being comfortable. As a result, the occupant’s contentment with the indoor environment can be applied as one of the criteria for assessing the IEQ. If an individual’s IEQ performance is insignificant, the associated IEQ factor can be set, checked, and controlled using personal feedback. Consequently, the occupant satisfaction level and the objective IEQ converge, forming the two parts of the extensive IEQ. Secondly, a significant IEQ performance is achieved at the expense of energy consumption. Functioning of energy-based infrastructure, such as HVAC systems and lighting, can have a direct impact on objective IEQ settings and, as a result, on occupant satisfaction. In consequence, the overall IEQ performance might influence the mode of operation or schedule of facilities, ultimately affecting energy consumption. High-level GBs face a major issue in balancing energy use and IEQ, which indicates that efficient GBs should use reduced energy to produce improved IEQ.
In the context of practical infrastructure projects, however, the link between the components above-mentioned can be considered as being considerably more complex. Already published research (targeting the combined analysis of consumption of energy, occupant’ s satisfaction, and IEQ) has been limited, its findings being inconsistent. As regarding the association between occupant satisfaction and objective IEQ, no consistent pattern exists to show that higher IEQ leads to an enhanced satisfaction of the occupant. Despite the fact that a single Chinese study indicated that GBs had better occupant’s satisfaction and objective IEQ performance than conventional constructions, a further assessment from South Korea found that the occupant satisfaction in two distinct offices was similar regardless of the fact that their objective IEQ performances were different [99,101].
This discrepancy emerges from the intricate nature of human perceptions, which are regularly impacted by a variety of minor conditions. Additionally, the personal control component, as well as individual differences in comfort preferences, may have a major influence in this direction [102].
The IEQ status [103] and occupant satisfaction [104] of American GBs, on the other hand, were less varied, and the discrepancies were minor when compared to energy usage disparities. As a result of the numerous parameters related with energy consumption and IEQ performance, the magnitude of the quantitative relationship between IEQ and energy use remains uncertain. Different types of facilities or systems, operational modes or schedules, and energy efficiency can all have a significant impact. It has been an attempt to comprehensively combine energy usage, occupant satisfaction, and IEQ, focusing on the qualitative correlation between them. The aim is to underline the importance of a combined examination of energy use, occupant satisfaction, and IEQ in GBs’ post-occupancy evaluation. Nevertheless, there is no accurate conclusion on the association between these components, due to the limitations of prior studies in this area. As a result, it can be assumed that these topics should be given greater priority in the future [103].
7. The Circular Economy and Green Buildings
Circular economy emerged as a measure of climate change and a sustainable approach, and it includes several essential principles, including the quality of building sustainability and the building design/construction/operation.
Environmental protection and waste management are two concepts that complement and complete each other. It is essential to comprehend the nature of our actions and, most importantly, to fully grasp the consequences that derive from these actions. Recycling has recently become a very popular theme, and we can even claim that being an environmentalist is nowadays considered trendy [105].
Within designing buildings in the frame of circular economy, The European Commission’s Directorate-General for Internal Market, Industry, Entrepreneurship and SMEs introduces the construction sector together with a recommended approach to circular design, which serves as the basis for the overall principles [105]. Areas of application of the principles, targeted at defined objective, as well as the seven target groups [105], are described in the diagram presented as Figure 7.
Figure 7.
Aim of the principles considering the target group and specific objective (dark green color marks the measure of inclusion of the objectives in the target groups).
High-level perspective of the traditional construction sector [106], adapted from BPIE © VERHAERT, is presented in Figure 8.
Figure 8.
High-level overview of the traditional construction sector.
8. Green Materials
Significant research was performed in recent decades to decrease the existing energy requirements in the operation phase of a building, mentioning here the energy required to maintain the temperature (cooling/heating), optimal ventilation, and hot water production (for operating appliances and lighting, etc.). In this way, an optimized, increased energy performance of several constructions was obtained, throughout their lifetime/service life, by the fair and adequate implementation of more suitable, much more efficient materials and technical solutions [107]. The current direction of exploiting the renewable energy sources resulted in a faster advancement of the ZEB term, which implies an annual balance of zero between the energy utilized for the operation processes of the construction and the energy obtained from as many as possible renewable sources (e.g., the case of “solar houses”) [108,109].
Directive 2010/31/EU issued by the European Parliament and the European Council on 19 May 2010, regarding the buildings’ energy performance, established the target of NZEB for public constructions by 2018 and, even more so, for all the new buildings (by 2020) [108].
More and more focus has been paid as well to the pre-use phase of a construction (as is the case of the impact/influence on the environment by the materials used for the construction, taking into account the extraction of raw materials, processes, and lines of obtaining/production of them, as well as the disposal of the necessary materials at the building site). The impact in question, on the environment, but also on construction materials, is quantifiable by several parameters established in the life cycle assessment (LCA) procedures (mentioned and described in ISO 14040). This includes energy needs, water depletion, increased greenhouse gas emissions, etc. It should be added that the environmental parameters mentioned, which are also essential for the environmental regulations regarding the impact of buildings, are both difficult to quantify and difficult to bring to the attention of the public. However, this energy of building materials, the so-called “embodied energy” (EE), has managed to prove its relevance, gaining increased importance [110,111]. EE generally consider the energy that is used during the process of materials’ extraction/production/delivery line to the building-site. It is however worth noting that, considering published data, it must include as well the “recurrent” EE employed in both refurbishing/maintenance processes of components and materials of that building, as well as the energy associated with the building demolition, which is necessary for the building’s deconstruction and disposing of resulting debris and materials [112,113,114].
Even by overlooking the other forms of environmental influence generated by constructions materials, for >50-year building lifetime in common constructions, EE presently evidences for 2–38% of the total consumed energy, respectively, for approximately 9–46% in low energy consumption buildings [9]. In the design process, these estimations highlight the significance of appropriate choices of SB materials. Certain published data claim that constructions with low energy consumption have an improved performance than ZEBs (from the life cycle of a building perspective), considering the latter are constructed with high energy high EE [112,114]. For this reason, needs for “life cycle ZEBs/net-ZEBs” has recently been addressed, so as to consider both the operational energy, as well as the energy consumed throughout the entire life cycle, in accordance to an applicable ‘cradle to grave’ approach [109].
A standardized and universally applicable definition of GB materials has still not been provided; however, GB materials are largely considered environmentally responsible/friendly materials [115,116]. Because of this ambiguity, some materials have reached the market in the field of constructions with a generic label of “greenness”, but with no objective evidence to support the “greenness”, if not with misleading claims [115]. In some papers, the green attribute offered to materials has been simply related to the materials’ ‘natural’ origins. This reasoning was also applied to materials such as asbestos (considered as building material in the past, but currently banned because of its proven carcinogenic effect), turpentine (solvent resulted from the tree resins distillation, as well being harmful for health), or radon (probably emitted by certain stones used in construction, in the form of radioactive gas, and considered a cause of lung cancer) [117]. According to a more sensitive and common conception, these GB materials would be defined as:
- sustainable throughout their life cycle, with the possibility to quantify their sustainability through the LCA methodology, in reference to a ‘cradle to grave’ approach;
- not hazardous for human health (i.e., not generating harmful effects in the context of and related to the IAQ). Specifically, these GB materials must not generate indoor pollution (biological pollutant proliferation, volatile organic compounds, radon emissions, hazardous fiber dispersion) or unpleasant indoor climate conditions (e.g., dampness on surfaces or in certain parts of the building). Both aspects must be mutually treated.
In terms of definition, one of the main problems identifiable is the lack of a “perfect GB material” vs. green materials. This is due to processes included in a GB life cycle (such as manufacturing/transportation/placing/disposing/recycling of GB materials) invariably implying a net zero impact. In the current situation, it is practically impossible to compile a comprehensive register of green materials, since each designing process entails selecting the “greenest” materials from what the market has to offer, because of the required materials, their characteristics/performance, and the best existing technologies. This places great responsibility in the hands of decisionmakers and furthermore, emphasized the importance of proper material selection [117,118]. The Sustainable Green Materials component is depicted in Figure 9 and the principles for architectural concepts regarding sustainable design and pollution prevention are summarized in Figure 10.
Figure 9.
The Sustainable Green Materials component.
Figure 10.
Principles for architectural concepts regarding sustainable design/pollution prevention.
A preliminary assessment was necessary when addressing the problem of material selection. Besides the “greenness” necessity, materials must comply a plethora of requirements stated and described by standards of national/international level, national laws, codes of practice, local construction practices, at least in regard to:
- acoustic performance, which is connected to satisfactory indoor comfort;
- aesthetic outcome, coordinated with local construction traditions;
- cost, within limits of the available budget;
- dimension and weight limits, according to the particularities of the construction;
- durability within the particular environmental and geographical context of the building (the durability issue is in close relation to sustainability, as it determines the life span of materials);
- mechanical properties of the structural materials, including stiffness, strength, behavior in under seismic activity, etc.;
- safety, both in case of fire and during the positioning / handling of materials;
- particular performances related to buildings usage (i.e., safety requirements for schools, hygiene requirements for hospitals, particular color and/or transparency requirements for libraries, etc.);
- thermal performance, which is necessary for achieving a satisfactory energetic behavior while in operation.
This multitude of criteria makes the selection of materials quite challenging. Based on the condition of fulfilling all other requirements, choosing the materials being based and related to the actions or effects on the environmental space, and therefore on human health, taking place during the design process, in two different stages, as follows:
- the initial stage (considered the phase of evaluation of the project and during which various technological solutions and their feasibility are evaluated); and
- the second stage, regarding the specific environmental concerns that become part of the decision-making process [119,120].
Many comparative reviews and studies have been carried out, highlighting the associated tools, and revealing few critical aspects. Several weak points were described and noted, regarding the used materials:
- methods related to collecting information on materials lifecycle. The input values are generally collected from voluminous databases of building materials [113], which actually provide data regarding the categories of materials, instead of single commercial materials. Unfortunately, this is a cause for errors in the analysis, due to the following parameters: variation and rapid evolution [113] of the manufacturing/production processes of the materials for constructions, material formulas differences, the changes (and sometimes lack of knowledge) regarding the locations of material sourcing and supply, etc. It is worth noting that the manufacturing processes for building materials are not as standardized as the processes associated with other goods. This is because of the specific type and characteristics of each building, and the variations occurring at national or regional level. An exemplificative case regarding the uncertainty of working and considering the most simplified classes of building materials, which is mentioned in specialty literature and databases, describes very large differences (e.g., in the case of steel: from 0.84 to 312 MJ/kg; in the case of brass: from 17 to 239 MJ/kg; in the case of paints: from 3 to 98 MJ/kg) [113,121].
- the functional unit utilized in the calculus. The way of choosing the functional unit hugely impacts all the results because the materials should be considered comparatively with their primary role in the construction; a possible improper unit may lead to erroneous data (i.e., comparing structural materials, such as aluminum vs. steel, must be done in reference to varying cross sections characterized by similar strength performance, regardless of their unit mass). In parallel, the comparison between flooring tiles must be conducted about unit area (rather than unit mass). The impact of the building’s environment/floor area is a critical unit when it is about building certification [121].
- the phases of the life cycle. Although some assessment tools omit building maintenance, demolition, and disposal, there is still a general agreement on the impact of materials (in the context of the supply of raw materials, the manufacturing process, transport, and delivery to the site, as well as and the operational activity after the commissioning of the building)
- the duration of service life. Depending on accessibility and durability, the building materials might have different service life lengths, a general lifespan of 50 years is generally considered [121].
- the energy of materials quality. The quantification of the embodied energy of materials can be performed considering either the primary energy, or the end use/delivered energy. In regard to EE determination, there is no clear agreement on this energy. [114].
- differences caused by different parameter quantification systems [119], representing the key items of environmental assessments.
- the lack of parameters that can be used to evaluate the materials’ impact on IAQ. This aspect is vaguely considered and appropriate parameters must still be established [122], although minimal study was performed to create procedures for the evaluations of the effects of materials on indoor pollution [123].
LEED-based rating system takes into account no less than four credits/points to IEQ and, for each of the following items, being given one point:
- coatings and paints limiting VOC emission;
- low VOC emitting carpets;
- adhesive and sealants limiting VOC emission;
- composite wood and agrifibre products without urea-formaldehyde resins [124].
Introducing these parameters is obviously of great importance; however, they are offering just a limited picture of the potentially hazardous effects of materials within the building environment. These effects are compiled and summarized under the umbrella terms of Sick Building Syndrome (SBS) and Building Related Illness (BRI).
Issues such as fiber dispersion, radon emissions, and biological pollutants are not considered, nor are potential VOC emissions generated by other components of the building (thermal insulating materials, resilient flooring, biocide application on organic materials, etc.). Currently, LEED credits include only a very small portion of the requirements issued by the European and other international authorities in the field of pollution and IAQ [117].
8.1. Examples of Green Materials
8.1.1. Quarry Dust
It is a waste by-product that results from the extraction and treatment of rocks to create soft particles with sizes of about 4.75 mm or less. Quarry dust is produced during crushing, screening, and blasting coarse aggregate. In this situation, it will take the form of angular, sharp, and rough particles, with increased interlocking between them, which provides the quarry with increased strength. Thus, when rock quarry dust is used in concrete, it improves the resistance against acid and sulphate and provides low permeability, when compared to concrete made from conventional Portland cement. However, in certain situations, the use of quarry dust increases the amount of cement that is needed to maintain workability within permitted rates. The use of quarry sand is typically limited, because a high cement paste volume would be required to achieve the appropriate workability of concrete [125]. Obviously, using waste materials, such as quarry dust, in the production of concrete, will reduce the production cost of concrete.
8.1.2. Fly Ash
Fly ash is a very soft powder generated as a by-product of coal combustion. In general, fly ash is collected from the chimneys of the coal-fired electrical power plants. There are generally two kinds of ash, namely coal ash which is utilized as part of the concrete mixture, and bottom ash, which is collected from the bottom of coal furnaces. The composition of fly ash varies in accordance with the origin and texture of the burned coal. Nevertheless, all types of fly ash are made of silicon dioxide (SiO2) and calcium oxide (CaO) [126]. In theory, it is possible to use fly ash as opposed to mixing in the entire amount of Portland cement; however, when the percentage of replacement is at 80% or above, it is recommended to use a chemical activator. There use of fly ash includes several advantages. Firstly, it can by generating the minimal hydration heat, it can improve the durability of concrete. Secondly, fly ash enhances the strength and durability of hardened concrete and significantly improves concrete workability. Moreover, it can reduce the water that is required in the mixture, and thus it can better the flow behavior [125].
8.1.3. Masonry and Concrete Waste
Recycled coarse masonry or concrete are gradated aggregates that result from useable concrete or masonry waste and are traditionally used in road construction. The substance may consist of small amounts of crushed bricks, rock gravel, or other forms of stone-based materials, which are included in the mixture. Recycled fine aggregates may be recommended for use as smashed concrete fines; however, the excessive quantity and grading form of fines may determine the finishing capacity, rate of bleeding, and concrete workability [125].
8.1.4. Silica Fume
Silica fume results as a by-product of several industrial processes, but, unfortunately, silica may be a cause for air pollution. Thus, in order to reduce the silica-induced air pollution, micro silica is combined with cement. The resulting concrete will be more sustainable, and its strength will increase when replacing 5–15% percent of the mixture with silica. However, it is not advised to surpass this percentage and increase the rate of replacement by 20%, because it can lead to reduced concrete strength. Silica fume is finer than cement and it can easily react with the other ingredients of the concrete mix. As such, silica fume will increase the consistency of cement, at a very fast rate, compared to conventional concrete [127].
8.1.5. Marble Waste
Since antiquity, marble waste has been a traditional and widely used construction material. However, one of the most pressing environmental problems is the disposal of marble industry waste, which consists of very fine marble powder. Yet, this powder waste can successfully be used to develop certain characteristics of traditional concrete, such as hardness. [125].
8.1.6. Crushed Glass
Glass is a colorless, fragile, hard-textured, and transparent material. ASTM International, which defines glass industry standards, defines glass as an inorganic substance with a 6.5 hardness. When its state turns from molten into a colder case, glass becomes solid and without any crystallization. The core glass component is the silica; however, glass can contain Al2O3 (aluminum oxide), CaO (calcium oxide), MgO (magnesium oxide), and Na2O (natrium oxide). Research has concluded that it is possible to use glass in concrete mixtures in one of three shapes: rough glass aggregate, soft glass aggregate, and also, soft glass powder. When glass and cement are combined, the glass is subjected to a chemical action. The result is a hydrated calcium silicate and then the reaction of hydrated cement, resulting in pozzolan [128]. Studies have demonstrated that the rise in the glass waste magnitude would reduce the concrete specific weight and the concrete compressive strength because of the decreased adhesion with glass [129]. The reduction in particle size will enhance workability, while at the same time, the compressive strength of cement at 28 days will reduce it. The mixing of fine and rough glass will enhance water absorption, which in turn will minimize concrete shrinkage [130].
8.1.7. Polyethylene Terephthalate
Polyethylene terephthalate can be considered a long chain polymer with a polyester structure. It is composed of ethylene glycol and pure terephthalic acid, both being petroleum-based products. Polyester processing involves chemicals which result from the polymerization of alkali and acid. Polyethylene terephthalate is an amorphous glass substance and its waste utilized in concrete can aid in reducing the environmental impact. A microstructure of lightweight PET (Polyethylene terephthalate) aggregates was analyzed in 2005, by testing the influence of the grainy slag for molten metal on the microstructure [131]. The study concluded that the density of concrete consisting of PET aggregates increased from 1940 to 2260 kg/m3. In parallel, the transition region between cement paste and PET particles was noted to expand, in comparison with normal aggregates. It was predictable that the slag grain of molten metal could increase the limit and level of the PET transition zone, which would lead to calcium hydroxide reactions. Experiments have demonstrated that the use of PET in the concrete increase ductility and minimize cracks caused by shrinkage [132,133]. On the other hand, a high-quality, lightweight concrete can be produced via PET, as its particular density is somewhat lower compared to normal aggregates [18]. The increase in the PET component amount to 15% will reduce the compressive strength of the concrete by 15.9% to 18%, the elastic modulus by 20% to 23%, and the specific weight by 3.1% to 3.3% [134].
8.1.8. Ceramic and Tile
Ceramic can be described as a non-organic and non-metallic material, of which there are two kinds. On the other hand, tile can be defined as a slice of artificial stone with the thickness of a few millimeters, a smooth surface, and a soft top side. Ceramic and tile waste can be generated during the transfer operation, during post burning, due to manufacturing or human error, from the contact with an unsuitable substance, or it may occur as a byproduct of building destruction [135]. Several studies have attempted to evaluate the use of a specific type of tile and ceramic waste in concrete. The results of the experiments show that it could be practical to use tiles in concrete as an aggregate or pozzolan [136,137]. In the case of white ceramic being used as a soft aggregate, at rates of 10–50%, the concrete quality will be improved [138]. Furthermore, when porcelain sanitary waste is utilized as coarse aggregate in concrete at a rate of 3–9%, its resistance is higher than that of concrete without additives, at a rate of 2–8% [139]. Another study, conducted by Medina et al. (2012), showed that when the curing takes around 28 days, and a sanitary porcelain waste is used at a percentage of 5–20% of the aggregates, the concrete resistance will be increased [140].
9. EU Regulations on GBs
The construction industry, especially the commercial and residential building sector, is the EU’s largest energy consumer and CO2 emitter. This activity sector represents approximately 40% of the EU’s overall CO2 emissions and energy usage [141,142]. Building codes are adopted by governments worldwide to protect populations from harm caused by possible structural collapses and other building-related concerns. The codes should accomplish their objective by outlining at the very least the minimal standards for construction techniques and materials. Catastrophic phenomena, such as meteorological threats or earthquakes, highlight the significance of enforcing construction codes on a constant and effective basis. The methodologies for GB design are often not compulsory and are presented as design choices or concepts to consider. The approaches are not always complementary or supportive of one another and using one may exclude using others. Architects, developers, designers, proprietors, and other stakeholders or collaborators in the GB maintenance operation will have to consider the benefits of using a certain approach. To accomplish a project’s various design objectives, a step-by-step approach and a comprehensive examination may be required.
The Energy Performance of Buildings Directive (EPBD—Directive 2002/91/EC), which established minimum energy efficiency standards and Energy Performance Certificates (EPCs), improved the EU’s legislative basis for sustainable buildings in 2002 [143]. Selection of a calculating procedure, mandatory energy performance certifications, and minimum energy performance criteria were all mentioned in the original EPBD 2002/91/EC. The EPBD was updated in 2010 with Directive 2010/31/EU on energy performance of buildings, which enhanced the requirements and expanded the scope of the EPBD. Furthermore, it has introduced the NZEB concept and set a debut date of 2018/2020. It also pioneered the concept of “cost-optimal levels” of building energy efficiency, which corresponds to “energy efficiency that results in the lowest cost over the predicted economic life cycle.” Furthermore, via intermediate targets for increasing the energy performance of new facilities by 2015, the Directive supported the establishment of national strategies to implement the concept of NZEBs. The European Commission released a package of recommendations titled “Clean Energy for All Europeans” in November 2016, with the aim of implementing a solid regulatory system to aid in the transition to sustainable energy. This was a significant step upwards to the founding of the Energy Union. The recommendations in “Clean Energy for All Europeans” are aimed at assisting the EU energy sector in becoming more competitive, stable, and sustainable. These aims, which are relevant for the 21st century, are supported by the EU’s capability to perform its commitments under the Paris Agreement. The European Parliament and the European Council published Directive 2009/125/EC on 21 October 2009, which establishes an approach to setting eco-design standards for energy-related items. This is significant, particularly in the context of construction materials [144,145].
The Passive House Standard is a sustainable building standard that should be applied in all EU member states by 2021, according to a resolution passed by the European Parliament on 31 January 2008. Moreover, the European Council and The European Parliament established on 17 November 2009 a deadline of 2020 for all newly built facilities to be NZEBs [146].
As of 1 January 2030, the ZEB standards will be implemented to all new facilities, and as of 1 January 2027, it will be applicable to all new constructions occupied or administered by public institutions.
Even though the proposal’s major aim is to lower operational greenhouse gases, the ZEB definition also targets the computation of life-cycle Global Warming Potential (GWP) and its dissemination through the energy performance certificate of the facility. This regulation will come into operation on 1 January 2027, for all new structures having a functional floor area greater than 2000 square meters, and on 1 January 2030, for all new constructions [147].
The EU Parliament adopted a decision on the new resource efficiency implementation plan in February 2021, demanding specific initiatives to develop a completely circular economy by 2050 that is ecologically sustainable, non-toxic, and carbon neutral. The resolution contains rigorous recycling requirements as well as more restrictive material use and consumption limits. As part of the circular economy implementation plan, the EU Commission released the first set of measures in March 2022 with the aim of accelerating the transition to a circular economy. The recommendations are aimed to assist consumers for the green transition, promoting sustainable products, managing building product regulation, and implementing a strategy for sustainable textiles [105].
In the context of climate change, the international community must implement policies to include achievable objectives on its agenda, such as biodiversity in the framework of a circular economy, CO2 emission neutrality, and economic and social prospects for the population. At the end of March 2022, the European Commission implemented a set of regulations regarding the circular economy action plan. Furthermore, the European Council and the European Parliament have requested initiatives to promote the circularity of building products, address barriers in the building product single market, and support the Circular Economy action plan and the European Green Deal’s targets [148].
Since the EPBD does not explicitly state practical numeric intervals or thresholds, these specifications allow for considerable individual perception, enabling EU Member States to describe their NZEB in a flexible manner, considering country-specific weather patterns, major energy indicators, building traditions, calculation approaches, and ambition degree. Furthermore, this is also the guiding factor behind different NZEB definitions in various nations. According to the EPBD report from the Concerted Action (CA), around 40% of EU states have yet to establish an accurate description of NZEB. The research also stated that approximately 60% of member states have specified their precise definition of NZEB in a legal document, while part of them are keeping the definition in draft condition or indicating the potential for future modifications to the term [149].
10. Conclusions and Future Directions
- The present research paper introduces and describes a coherent approach for the sustainable design of the future, namely the GB solution, characterized by sustainability and energy efficiency.
- Also, it provides a comprehensive assessment to explore the progress and the current scientific framework of GBs, including design, certification systems, circular economy, renewable energy sources, and green materials, all in the context of sustainable development. However, no other publication has evaluated all these concepts simultaneously in a similar manner. The main shortcoming of the present study is that the ongoing advancement of GB design technology and concepts, as well as related scientific literature, is largely approached from a strictly engineering perspective and not sufficiently from an occupant/beneficiary-oriented perspective.
- Future research directions have been established based on the quantitative evaluation of all GB-related factors, the investigation of dynamic strategy models for sustainable GB development, and the approach of GB design from an occupant perspective.
- The information and the manner in which it is presented open the door to a similar analysis of the concept of green neighborhoods or even that of green cities, with existing publication that can be used to analyze and synthesize, as well as provide real examples.
Author Contributions
Conceptualization, C.C.B. and M.F.P.; methodology, C.C.B. and T.B.; software, C.C.B. and T.B.; validation, I.F.P. and M.F.P.; formal analysis, C.C.B.; investigation, C.C.B., T.B., I.F.P. and M.F.P.; resources, T.B.; data curation, C.C.B. and T.B.; writing—original draft preparation, C.C.B. and T.B.; writing—review and editing, T.B.; visualization, M.F.P.; supervision, M.F.P.; funding acquisition, C.C.B. All authors have read and agreed to the published version of the manuscript.
Funding
The APC was funded by the University of Oradea through and internal project.
Institutional Review Board Statement
Not applicable.
Data Availability Statement
Information provided in this paper are supported by published data in the mentioned references.
Acknowledgments
The authors would like to thank to the University of Oradea, Oradea, Romania, for supporting the APC.
Conflicts of Interest
The authors declare no conflict of interest.
References
- Bhutta, F.M. Application of smart energy technologies in building sector—Future prospects. In Proceedings of the 2017 International Conference on Energy Conservation and Efficiency (ICECE), Lahore, Pakistan, 22–23 November 2017; pp. 7–10. [Google Scholar]
- Abdallah, M.; El-Rayes, K.; Liu, L.Y. Optimizing the selection of sustainability measures to minimize life-cycle cost of existing buildings. Can. J. Civ. Eng. 2016, 43, 151–163. [Google Scholar] [CrossRef] [Scilit]
- Yan, R.; Xiang, X.; Cai, W.; Ma, M. Decarbonizing residential buildings in the developing world: Historical cases from China. Sci. Total Environ. 2022, 847, 157679. [Google Scholar] [CrossRef] [Scilit] [PubMed]
- Zhang, S.; Ma, M.; Xiang, X.; Cai, W.; Feng, W.; Ma, Z. Potential to decarbonize the commercial building operation of the top two emitters by 2060. Resour. Conserv. Recycl. 2022, 185, 106481. [Google Scholar] [CrossRef] [Scilit]
- Lu, Y.; Cui, P.; Li, D. Which activities contribute most to building energy consumption in China? A hybrid LMDI decomposition analysis from year 2007 to 2015. Energy Build. 2017, 165, 259–269. [Google Scholar] [CrossRef] [Scilit]
- Imperatives, S. Report of the World Commission on Environment and Development: Our Common Future; Oxford University Press: Oxford, UK, 1987; 300p. [Google Scholar]
- Klarin, T. The Concept of Sustainable Development: From its Beginning to the Contemporary Issues. Zagreb Int. Rev. Econ. Bus. 2018, 21, 67–94. [Google Scholar] [CrossRef] [Scilit]
- Lombardi, P. Understanding Sustainability in the Built Environment: A Framework for Evaluation in Urban Planning and Design; University of Salford: Salford, UK, 1999. [Google Scholar]
- Ding, G.K.C. Developing a multicriteria approach for the measurement of sustainable performance. Build. Res. Inf. 2005, 33, 3–16. [Google Scholar] [CrossRef] [Scilit]
- Weiss, E.B. United Nations Conference on Environment and Development. Int. Leg. Mater. 1992, 31, 814–817. [Google Scholar] [CrossRef] [Scilit]
- Hughes, P. Local Agenda 21 in the United Kingdom: A Review of Progress and Issues for New Zealand; Office of the Parliamentary Commissioner for the Environment: Wellington, New Zealand, 2000; 38p. [Google Scholar]
- Harding, R. Environmental Decision-Making; The Federation Press: Wales, Australia, 1998; 366p. [Google Scholar]
- Teng, J.; Mu, X.; Wang, W.; Xu, C.; Liu, W. Strategies for sustainable development of green buildings. Sustain. Cities Soc. 2019, 44, 215–226. [Google Scholar] [CrossRef] [Scilit]
- Li, Y.; Li, M.; Sang, P.; Chen, P.-H.; Li, C. Stakeholder studies of green buildings: A literature review. J. Build. Eng. 2022, 54, 104667. [Google Scholar] [CrossRef] [Scilit]
- Zuo, J.; Zhao, Z.-Y. Green building research–current status and future agenda: A review. Renew. Sustain. Energy Rev. 2014, 30, 271–281. [Google Scholar] [CrossRef] [Scilit]
- Frontczak, M.; Schiavon, S.; Goins, J.; Arens, E.; Zhang, H.; Wargocki, P. Quantitative relationships between occupant satisfaction and satisfaction aspects of indoor environmental quality and building design. Indoor Air 2012, 22, 119–131. [Google Scholar] [CrossRef] [Scilit] [PubMed]
- Page, M.J.; McKenzie, J.E.; Bossuyt, P.M.; Boutron, I.; Hoffmann, T.C.; Mulrow, C.D.; Shamseer, L.; Tetzlaff, J.M.; Akl, E.A.; Brennan, S.E.; et al. The PRISMA 2020 statement: An updated guideline for reporting systematic reviews. Rev. Esp. Cardiol. 2021, 74, 790–799. [Google Scholar] [CrossRef] [PubMed]
- World Green Building Trends 2018 SmartMarket Report. Available online: https://www.worldgbc.org/news-media/world-green-building-trends-2018-smartmarket-report-publication (accessed on 20 March 2022).
- Darko, A.; Chan, A.P.C.; Yang, Y.; Shan, M.; He, B.-J.; Gou, Z. Influences of barriers, drivers, and promotion strategies on green building technologies adoption in developing countries: The Ghanaian case. J. Clean. Prod. 2018, 200, 687–703. [Google Scholar] [CrossRef] [Scilit]
- EPA. Buildings and their Impact on the Environment: A Statistical Summary. Available online: https://archive.epa.gov/greenbuilding/web/pdf/gbstats.pdf (accessed on 20 March 2022).
- Strohmer, S. Green Buildings in Europe—Regulations, Programs, and Trends: An Interview with Robert Donkers. Bridges 2006, 11, 1–5. [Google Scholar]
- What is BREEAM? Available online: https://web.archive.org/web/20150923194348/http://www.breeam.org/ (accessed on 21 March 2022).
- WBDG Whole Building Design Guide. Available online: https://www.wbdg.org/design-objectives/sustainable (accessed on 22 March 2022).
- Iwaro, J.; Mwasha, A. The impact of sustainable building envelope design on building sustainability using Integrated Performance Model. Int. J. Sustain. Built Environ. 2013, 2, 153–171. [Google Scholar] [CrossRef] [Scilit]
- Duran-Encalada, J.A.; Paucar-Caceres, A. Sustainability model for the valsequillo lake in Puebla, Mexico: Combining system dynamics and sustainable urban development. In Proceedings of the the 2007 International Conference of the System Dynamics Society and 50th Anniversay Celebration, Boston, MA, USA, 29 July–2 August 2007. [Google Scholar]
- Department of Trade and Industry. Sustainable construction strategy report. Available online: www.dti.gov.uk (accessed on 29 September 2010).
- Yun, W. Modular construction and evaluation of green building technology system based on LEED. J. Chem. Pharm. Res. 2014, 6, 2904–2913. [Google Scholar]
- Environmental Protection Agency. USEPA Green Building Basic Information. Available online: http://www.epa.gov/greenbuilding/pubs/about.htm (accessed on 11 January 2022).
- 25 Years Passive House—Interview with Dr. Wolfgang Feist. Available online: https://passivehouse.com/02_informations/01_whatisapassivehouse/01_whatisapassivehouse.htm (accessed on 15 May 2022).
- What is sustainable architecture: Definition, concept and famous examples. Available online: https://www.lifegate.com/sustainable-architecture-definition-concept-projects-examples (accessed on 30 April 2022).
- Rettenwender, T.; Spitz, N. The Principles of Green Building Design. MA, Mag. Arch, MA, Mag. Arch., LEED AP, Architect and Niklas Spitz Monterey Peninsula College INTD62, Monterey Peninsula; Academia: Toronto, ON, Canada, 2009; 36p. [Google Scholar]
- Bungău, C.C.; Prada, I.F.; Prada, M.; Bungău, C. Design and Operation of Constructions: A Healthy Living Environment-Parametric Studies and New Solutions. Sustainability 2019, 11, 6824. [Google Scholar] [CrossRef] [Scilit]
- Alam, S.; Haque, Z. Fundamental principles of green building and sustainable site design. Int. J. Manag. Appl. Sci. 2016, 2, 1–5. [Google Scholar]
- Kapsalaki, M.; Leal, V.; Santamouris, M. A methodology for economic efficient design of Net Zero Energy Buildings. Energy Build. 2012, 55, 765–778. [Google Scholar] [CrossRef] [Scilit]
- Masoso, O.T.; Grobler, L.J. The dark side of occupants’ behaviour on building energy use. Energy Build. 2010, 42, 173–177. [Google Scholar] [CrossRef] [Scilit]
- Schlueter, A.; Thesseling, F. Building information model based energy/exergy performance assessment in early design stages. Autom. Constr. 2009, 18, 153–163. [Google Scholar] [CrossRef] [Scilit]
- Popescu, D.; Bungau, C.; Prada, M.; Domuta, C.; Bungau, S.; Tit, D.M. Waste management strategy at a public university in smart city context. Journal of environmental protection and ecology 2016, 17, 1011–1020. [Google Scholar]
- Mwasha, A.; Williams, R.G.; Iwaro, J. Modeling the performance of residential building envelope: The role of sustainable energy performance indicators. Energy Build. 2011, 43, 2108–2117. [Google Scholar] [CrossRef] [Scilit]
- Lombera, J.-T.S.-J.; Aprea, I.G. A system approach to the environmental analysis of industrial buildings. Build. Environ. 2010, 45, 673–683. [Google Scholar] [CrossRef] [Scilit]
- Lombera, J.-T.S.-J.; Rojo, J.C. Industrial building design stage based on a system approach to their environmental sustainability. Constr. Build. Mater. 2010, 24, 438–447. [Google Scholar] [CrossRef] [Scilit]
- The 6 features of smart buildings. Available online: https://nexusintegra.io/features-smart-buildings/ (accessed on 23 June 2022).
- Green or Sustainable Buildings. The ‘Green’ Buildings are Leading the Way to more Sustainable and Efficient Urban Planning. Available online: https://www.iberdrola.com/sustainability/sustainable-green-buildings (accessed on 30 April 2022).
- Chel, A.; Kaushik, G. Renewable energy technologies for sustainable development of energy efficient building. Alex. Eng. J. 2018, 57, 655–669. [Google Scholar] [CrossRef] [Scilit]
- Aksamija, A. Regenerative design of existing buildings for net-zero energy use. Procedia Eng. 2015, 118, 72–80. [Google Scholar] [CrossRef] [Scilit]
- UNFCCC, V. Adoption of the Paris agreement. Propos. Pres. 2015, 282. [Google Scholar]
- Administration, E.I. Annual Energy Outlook 2012: With Projections to 2035; Government Printing Office: Washington, DC, USA, 2012. [Google Scholar]
- Guruswamy, L. International Energy and Poverty; Routledge Publishing: Boca Raton, FL, USA, 2015. [Google Scholar]
- Tiwari, G.N.; Mishra, R.K. Advanced Renewable Energy Sources; Royal Society of Chemistry: Zhongguancun, China, 2012. [Google Scholar]
- Twidell, J.; Weir, T. Renewable Energy Resources, 3rd ed.; Routledge: Boca Raton, FL, USA, 2015. [Google Scholar]
- Baños, R.; Manzano-Agugliaro, F.; Montoya, F.G.; Gil, C.; Alcayde, A.; Gómez, J. Optimization methods applied to renewable and sustainable energy: A review. Renew. Sustain. Energy Rev. 2011, 15, 1753–1766. [Google Scholar] [CrossRef] [Scilit]
- Panwar, N.; Kaushik, S.; Kothari, S. Solar greenhouse an option for renewable and sustainable farming. Renew. Sustain. Energy Rev. 2011, 15, 3934–3945. [Google Scholar] [CrossRef] [Scilit]
- Owusu, P.; Asumadu-Sarkodie, S. A review of renewable energy sources, sustainability issues and climate change mitigation. Cogent. Eng. 2016, 3, 1167990. [Google Scholar] [CrossRef] [Scilit]
- Asumadu-Sarkodie, S.; Owusu, P.A.; Jayaweera, M. Flood risk management in Ghana: A case study in Accra. Adv. Appl. Sci. Res. 2015, 6, 196–201. [Google Scholar]
- Asumadu-Sarkodie, S.; Owusu, P.; Rufangura, P. Impact analysis of flood in Accra, Ghana. Adv. Appl. Sci. Research. 2015, 6, 53–78. [Google Scholar]
- Edenhofer, O.; Pichs-Madruga, R.; Sokona, Y.; Seyboth, K.; Matschoss, P.; Kadner, S.; Zwickel, T.; Eickemeier, P.; Hansen, G.; Schlömer, S. IPCC Special Report on Renewable Energy Sources and Climate Change Mitigation; Prepared by Working Group III of the Intergovernmental Panel on Climate Change; Cambridge University Press: Cambridge, UK, 2011. [Google Scholar]
- Hamann, A. Coordinated Predictive Control of a Hydropower Cascade; Carnegie Mellon University: Pittsburgh, PA, USA, 2015. [Google Scholar]
- Førsund, F. Hydropower Economics; Springer: New York, NY, USA, 2005; Volume 112, p. 36. [Google Scholar]
- Edenhofer, O.; Pichs-Madruga, R.; Sokona, Y.; Seyboth, K.; Kadner, S.; Zwickel, T.; Eickemeier, P.; Hansen, G.; Schlömer, S.; von Stechow, C. Renewable Energy Sources and Climate Change Mitigation: Special Report of the Intergovernmental Panel on Climate Change; Cambridge University Press: Cambridge, UK, 2011. [Google Scholar]
- Urban, F.; Mitchell, T. Climate Change, disasters and Electricity Generation. 2011. Available online: https://opendocs.ids.ac.uk/opendocs/handle/20.500.12413/2504 (accessed on 24 July 2022.).
- Ajanovic, A. Biofuels versus food production: Does biofuels production increase food prices? Energy 2011, 36, 2070–2076. [Google Scholar] [CrossRef] [Scilit]
- Ayoub, M.; Abdullah, A.Z. Critical review on the current scenario and significance of crude glycerol resulting from biodiesel industry towards more sustainable renewable energy industry. Renew. Sustain. Energy Rev. 2012, 16, 2671–2686. [Google Scholar] [CrossRef] [Scilit]
- Hoogwijk, M.; Faaij, A.; Eickhout, B.; De Vries, B.; Turkenburg, W. Potential of biomass energy out to 2100, for four IPCC SRES land-use scenarios. Biomass Bioenergy 2005, 29, 225–257. [Google Scholar] [CrossRef] [Scilit]
- Demirbas, M.F.; Balat, M.; Balat, H. Potential contribution of biomass to the sustainable energy development. Energy Convers. Manag. 2009, 50, 1746–1760. [Google Scholar] [CrossRef] [Scilit]
- Behl, T.; Kaur, I.; Sehgal, A.; Singh, S.; Sharma, N.; Bhatia, S.; Al-Harrasi, A.; Bungau, S. The dichotomy of nanotechnology as the cutting edge of agriculture: Nano-farming as an asset versus nanotoxicity. Chemosphere 2022, 288, 132533. [Google Scholar] [CrossRef] [Scilit]
- Koh, L.P.; Ghazoul, J. Biofuels, biodiversity, and people: Understanding the conflicts and finding opportunities. Biol. Conserv. 2008, 141, 2450–2460. [Google Scholar] [CrossRef] [Scilit]
- Headey, D.; Fan, S. Anatomy of a crisis: The causes and consequences of surging food prices. Agric. Econ. 2008, 39, 375–391. [Google Scholar] [CrossRef] [Scilit]
- Baum, S.; Weih, M.; Busch, G.; Kroiher, F.; Bolte, A. The impact of short rotation coppice plantations on phytodiversity. Landbauforsch. Volkenrode 2009, 59, 163–170. [Google Scholar]
- Schulz, U.; Brauner, O.; Gruß, H. Animal diversity on short-rotation coppices–a review. Landbauforsch. Volkenrode 2009, 59, 171–181. [Google Scholar]
- Tilman, D.; Hill, J.; Lehman, C. Carbon-negative biofuels from low-input high-diversity grassland biomass. Science 2006, 314, 1598–1600. [Google Scholar] [CrossRef] [Scilit] [PubMed]
- Asumadu-Sarkodie, S.; Owusu, P.A. The potential and economic viability of solar photovoltaic power in Ghana. Energy Sources Part A Recovery Util. Environ. Eff. 2016, 38, 709–716. [Google Scholar] [CrossRef] [Scilit]
- World Energy Council. World Energy Resources: Hydro. Available online: https://www.worldenergy.org/wp-content/uploads/2013/10/WER_2013_5_Hydro.pdf (accessed on 16 January 2022).
- Barbier, E. Geothermal energy technology and current status: An overview. Renew. Sustain. Energy Rev. 2002, 6, 3–65. [Google Scholar] [CrossRef] [Scilit]
- Manwell, J.F.; McGowan, J.G.; Rogers, A.L. Wind energy Explained: Theory, Design and Application; John Wiley & Sons: Hoboken, NJ, USA, 2010. [Google Scholar]
- Asumadu-Sarkodie, S.; Owusu, P.A. The potential and economic viability of wind farms in Ghana. Energy Sources Part A Recovery Util. Environ. Eff. 2016, 38, 695–701. [Google Scholar] [CrossRef] [Scilit]
- Jacobson, M.Z.; Delucchi, M.A. Providing all global energy with wind, water, and solar power, Part I: Technologies, energy resources, quantities and areas of infrastructure, and materials. Energy Policy 2011, 39, 1154–1169. [Google Scholar] [CrossRef] [Scilit]
- Esteban, M.; Leary, D. Current developments and future prospects of offshore wind and ocean energy. Appl. Energy 2012, 90, 128–136. [Google Scholar] [CrossRef] [Scilit]
- Fowler, K.M.; Rauch, E.M.; Henderson, J.W.; Kora, A.R. Re-Assessing Green Building Performance: A Post Occupancy Evaluation of 22 GSA Buildings; Pacific Northwest National Lab. (PNNL): Richland, WA, USA, 2010; 275p. [Google Scholar]
- Baylon, D.; Kennedy, M. For Seattle City Light; Ecotope: Seattle, WA, USA, 2008. [Google Scholar]
- Turner, C.; Frankel, M.; Council, U. Energy performance of LEED for new construction buildings. New Build. Inst. 2008, 4, 1–42. [Google Scholar]
- Turner, C. LEED Building Performance in the Cascadia Region: A Post Occupancy Evaluation Report; The Council: Portland, OR, Canada, 2006; 16p. [Google Scholar]
- Newsham, G.R.; Mancini, S.; Birt, B.J. Do LEED-certified buildings save energy? Yes, but…. Energy Build. 2009, 41, 897–905. [Google Scholar] [CrossRef] [Scilit]
- Diamond, R. Evaluating the Energy Performance of the First Generation of LEED-Certified Commercial Buildings; Lawrence Berkeley National Laboratory: Berkeley, CA, USA, 2006. [Google Scholar]
- Council, U.G.B. Regional Green Building Case Study Project: A Post-Occupancy Study of LEED Projects in Illinois. Center for Neighborhood Technology. 2009. Available online: https://www.cnt.org/sites/default/files/publications/CNT_Exec-Summary-Regional-Green-Building-Case-Study-Project-Year-1-Report.pdf (accessed on 25 August 2022).
- Lin, B.; Liu, Y.; Wang, Z.; Pei, Z.; Davies, M. Measured energy use and indoor environment quality in green office buildings in China. Energy Build. 2016, 129, 9–18. [Google Scholar] [CrossRef] [Scilit]
- Chen, Y.; Tan, H.; Berardi, U. A data-driven approach for building energy benchmarking using the Lorenz curve. Energy Build. 2018, 169, 319–331. [Google Scholar] [CrossRef] [Scilit]
- Jing, R.; Wang, M.; Zhang, R.; Li, N.; Zhao, Y. A study on energy performance of 30 commercial office buildings in Hong Kong. Energy Build. 2017, 144, 117–128. [Google Scholar] [CrossRef] [Scilit]
- Brown, N.; Wright, A.; Shukla, A.; Stuart, G. Longitudinal analysis of energy metering data from non-domestic buildings. Build. Res. Inf. 2010, 38, 80–91. [Google Scholar] [CrossRef] [Scilit]
- Baylon, D.; Storm, P. Comparison of Commercial LEED Buildings and Non-LEED Buildings within the 2002-2004 Pacific Northwest Commercial Building Stock; ACEEE Summer Study on Energy Efficiency of Buildings; American Council for an Energy-Efficient Economy: Washington DC, USA, 2008. [Google Scholar]
- Scofield, J.H. Efficacy of LEED-certification in reducing energy consumption and greenhouse gas emission for large New York City office buildings. Energy Build. 2013, 67, 517–524. [Google Scholar] [CrossRef] [Scilit]
- Li, C.; Hong, T.; Yan, D. An insight into actual energy use and its drivers in high-performance buildings. Appl. Energy 2014, 131, 394–410. [Google Scholar] [CrossRef] [Scilit]
- ASHRAE. Standard 90.1. Available online: https://www.ashrae.org/technical-resources/standards-and-guidelines/standards-addenda/addenda-to-standard-90-1-2004 (accessed on 20 April 2022).
- Newsham, G.; Veitch, J.; Charles, K. Risk factors for dissatisfaction with the indoor environment in open-plan offices: An analysis of COPE field study data. Indoor Air 2008, 18, 271–282. [Google Scholar] [CrossRef] [Scilit]
- Thayer, J.F.; Verkuil, B.; Brosschotj, J.F.; Kevin, K.; West, A.; Sterling, C.; Christie, I.C.; Abernethy, D.R.; Sollers, J.J.; Cizza, G. Effects of the physical work environment on physiological measures of stress. Eur. J. Prev. Cardiol. 2010, 17, 431–439. [Google Scholar] [CrossRef] [Scilit]
- Al Horr, Y.; Arif, M.; Kaushik, A.; Mazroei, A.; Katafygiotou, M.; Elsarrag, E. Occupant productivity and office indoor environment quality: A review of the literature. Build. Environ. 2016, 105, 369–389. [Google Scholar] [CrossRef] [Scilit]
- Fisk, W.J. Health and productivity gains from better indoor environments and their relationship with building energy efficiency. Annu. Rev. Energy Environ. 2000, 25, 537–566. [Google Scholar] [CrossRef] [Scilit]
- Choi, J.-H.; Moon, J. Impacts of human and spatial factors on user satisfaction in office environments. Build. Environ. 2017, 114, 23–35. [Google Scholar] [CrossRef] [Scilit]
- MacNaughton, P.; Satish, U.; Laurent, J.G.C.; Flanigan, S.; Vallarino, J.; Coull, B.; Spengler, J.D.; Allen, J.G. The impact of working in a green certified building on cognitive function and health. Build. Environ. 2017, 114, 178–186. [Google Scholar] [CrossRef] [Scilit] [PubMed]
- Tham, K.W.; Wargocki, P.; Tan, Y.F. Indoor environmental quality, occupant perception, prevalence of sick building syndrome symptoms, and sick leave in a Green Mark Platinum-rated versus a non-Green Mark-rated building: A case study. Sci. Technol. Built Environ. 2015, 21, 35–44. [Google Scholar] [CrossRef] [Scilit]
- Pei, Z.; Lin, B.; Liu, Y.; Zhu, Y. Comparative study on the indoor environment quality of green office buildings in China with a long-term field measurement and investigation. Build. Environ. 2015, 84, 80–88. [Google Scholar] [CrossRef] [Scilit]
- Deuble, M.P.; de Dear, R.J. Green occupants for green buildings: The missing link? Build. Environ. 2012, 56, 21–27. [Google Scholar] [CrossRef] [Scilit]
- Kwon, S.-H.; Chun, C.; Kwak, R.-Y. Relationship between quality of building maintenance management services for indoor environmental quality and occupant satisfaction. Build. Environ. 2011, 46, 2179–2185. [Google Scholar] [CrossRef] [Scilit]
- Wang, Z.; de Dear, R.; Luo, M.; Lin, B.; He, Y.; Ghahramani, A.; Zhu, Y. Individual difference in thermal comfort: A literature review. Build. Environ. 2018, 138, 181–193. [Google Scholar] [CrossRef] [Scilit]
- Choi, J.-H.; Loftness, V.; Aziz, A. Post-occupancy evaluation of 20 office buildings as basis for future IEQ standards and guidelines. Energy Build. 2012, 46, 167–175. [Google Scholar] [CrossRef] [Scilit]
- Geng, Y.; Ji, W.; Lin, B.; Zhu, Y. The impact of thermal environment on occupant IEQ perception and productivity. Build. Environ. 2017, 121, 158–167. [Google Scholar] [CrossRef] [Scilit]
- Circular Economy: Definition, Importance and Benefits. Available online: https://www.europarl.europa.eu/news/en/headlines/economy/20151201STO05603/circular-economy-definition-importance-and-benefits (accessed on 22 August 2022).
- Circular Economy in the Building Industry. Available online: https://verhaert.com/circular-economy-building-industry/ (accessed on 30 April 2022).
- Thormark, C. The effect of material choice on the total energy need and recycling potential of a building. Build. Environ. 2006, 41, 1019–1026. [Google Scholar] [CrossRef] [Scilit]
- Marszal, A.J.; Heiselberg, P.; Bourrelle, J.S.; Musall, E.; Voss, K.; Sartori, I.; Napolitano, A. Zero Energy Building–A review of definitions and calculation methodologies. Energy Build. 2011, 43, 971–979. [Google Scholar] [CrossRef] [Scilit]
- Hernandez, P.; Kenny, P. From net energy to zero energy buildings: Defining life cycle zero energy buildings (LC-ZEB). Energy Build. 2010, 42, 815–821. [Google Scholar] [CrossRef] [Scilit]
- Sandrolini, F.; Franzoni, E. Characterization procedure for ancient mortars’ restoration: The plasters of the Cavallerizza courtyard in the Ducal Palace in Mantua (Italy). Mater. Charact. 2010, 61, 97–104. [Google Scholar] [CrossRef] [Scilit]
- Huberman, N.; Pearlmutter, D. A life-cycle energy analysis of building materials in the Negev desert. Energy Build. 2008, 40, 837–848. [Google Scholar] [CrossRef] [Scilit]
- Dixit, M.K.; Fernández-Solís, J.L.; Lavy, S.; Culp, C.H. Identification of parameters for embodied energy measurement: A literature review. Energy Build. 2010, 42, 1238–1247. [Google Scholar] [CrossRef] [Scilit]
- Sandrolini, F.; Franzoni, E. Embodied energy of building materials: A new parameter for sustainable architectural design. Heat Tech 2010, 27, 163–167. [Google Scholar]
- Ramesh, T.; Prakash, R.; Shukla, K. Life cycle energy analysis of buildings: An overview. Energy Build. 2010, 42, 1592–1600. [Google Scholar] [CrossRef] [Scilit]
- Kubba, S. Green Construction Project Management and Cost Oversight; Butterworth-Heinemann: Woburn, MA, USA, 2010; 560p. [Google Scholar]
- Spiegel, R.; Meadows, D. Green Building Materials: A guide to Produce Selection and Specification; John Wiley & Sons: Hoboken, NJ, USA, 2006; 368p. [Google Scholar]
- Sandrolini, F.; Franzoni, E. Materiali e costruzione ecosostenibile. In Il progetto ecosostenibile; CLUEB: Bologna, Italy, 2008; pp. 79–84. [Google Scholar]
- Directive, C. Council Directive 89/106/EEC of 21 December 1988 on the approximation of laws, regulations and administrative provisions of the Member States relating to construction products. J. Eur. Union 1988, 32, 1–16. [Google Scholar]
- Ding, G.K. Sustainable construction—The role of environmental assessment tools. J. Environ. Manag. 2008, 86, 451–464. [Google Scholar] [CrossRef] [Scilit]
- Lee, B.; Trcka, M.; Hensen, J.L. Embodied energy of building materials and green building rating systems—A case study for industrial halls. Sustain. Cities Soc. 2011, 1, 67–71. [Google Scholar] [CrossRef] [Scilit]
- Haapio, A.; Viitaniemi, P. A critical review of building environmental assessment tools. Environ. Impact Assess. Rev. 2008, 28, 469–482. [Google Scholar] [CrossRef] [Scilit]
- Forsberg, A.; Von Malmborg, F. Tools for environmental assessment of the built environment. Build. Environ. 2004, 39, 223–228. [Google Scholar] [CrossRef] [Scilit]
- Sandrolini, F.; Franzoni, E.; Biolcati Rinaldi, M. Proposte per una metodologia di valutazione dell’ecosostenibilità dei materiali e componenti edilizi in sede progettuale. Inarcos 2002, 634, 637–640. [Google Scholar]
- Castro-Lacouture, D.; Sefair, J.A.; Flórez, L.; Medaglia, A.L. Optimization model for the selection of materials using a LEED-based green building rating system in Colombia. Build. Environ. 2009, 44, 1162–1170. [Google Scholar] [CrossRef] [Scilit]
- Shadab, M.; Abdullah, M.; Amir, M.; Arham, M.; Khan, M.A. Green Concrete or Eco-Friendly Concrete. Int. J. Adv. Res. Dev. 2017, 2, 78–83. [Google Scholar]
- Bhatia, A. Paper Code: P-37 Fly Ash a Better Worthwhile [Supportable] Material for Green Concrete. In Proceedings of the International Webinar on ‘‘Recent Advances in Science and Technology During the Corona Virus Pandemic-2020, Jharkhand, India, 18–20 July 2020. [Google Scholar]
- Admute, A.; Nagarkar, V.; Padalkar, S.; Bhamre, S.; Tupe, A. Experimental study on green concrete. Int. Res. J. Eng. Technol. 2017, 4, 2395-0056. [Google Scholar]
- Islam, G.M.S.; Rahman, M.H.; Kazi, N. Waste glass powder as partial replacement of cement for sustainable concrete practice. Int. J. Sustain. Built Environ. 2017, 6, 37–44. [Google Scholar] [CrossRef] [Scilit]
- Topçu, İ.B.; Canbaz, M. Properties of concrete containing waste glass. Cem. Concr. Res. 2004, 34, 267–274. [Google Scholar] [CrossRef] [Scilit]
- de Castro, S.; de Brito, J. Evaluation of the durability of concrete made with crushed glass aggregates. J. Clean. Prod. 2013, 41, 7–14. [Google Scholar] [CrossRef] [Scilit]
- Choi, Y.-W.; Moon, D.J.; Chung, J.-S.; Cho, S.-K. Effects of Waste PET Bottles Aggregate on the Properties of Concrete. Cem. Concr. Res. 2005, 35, 776–781. [Google Scholar] [CrossRef] [Scilit]
- Singh, S.; Shukla, A.; Brown, R. Pullout behavior of polypropylene fibers from cementitious matrix. Cem. Concr. Res. 2004, 34, 1919–1925. [Google Scholar] [CrossRef] [Scilit]
- Won, J.-P.; Jang, C.-I.; Lee, S.-W.; Lee, S.-J.; Kim, H.-Y. Long-term performance of recycled PET fibre-reinforced cement composites. Constr. Build. Mater. 2010, 24, 660–665. [Google Scholar] [CrossRef] [Scilit]
- Rahmani, E.; Dehestani, M.; Beygi, M.H.A.; Allahyari, H.; Nikbin, I.M. On the mechanical properties of concrete containing waste PET particles. Constr. Build. Mater. 2013, 47, 1302–1308. [Google Scholar] [CrossRef] [Scilit]
- Tavakoli, D.; Hashempour, M.; Heidari, A. Use of waste materials in concrete: A review. Pertanika J. Sci. Technol. 2018, 26, 499–522. [Google Scholar]
- Ay, N.; Ünal, M. The use of waste ceramic tile in cement production. Cem. Concr. Res. 2000, 30, 497–499. [Google Scholar] [CrossRef] [Scilit]
- Portella, K.F.; Joukoski, A.; Franck, R.; Derksen, R. Reciclagem secundária de rejeitos de porcelanas elétricas em estruturas de concreto: Determinação do desempenho sob envelhecimento acelerado. Cerâmica 2006, 52, 155–167. [Google Scholar] [CrossRef] [Scilit]
- López, V.; Llamas, B.; Juan-Valdes, A.; Moran, J.; Guerra-Romero, M. Eco-efficient Concretes: Impact of the Use of White Ceramic Powder on the Mechanical Properties of Concrete. Biosyst. Eng. 2007, 96, 559–564. [Google Scholar] [CrossRef] [Scilit]
- Guerra, I.; Vivar, I.; Llamas, B.; Juan, A.; Moran, J. Eco-efficient concretes: The effects of using recycled ceramic material from sanitary installations on the mechanical properties of concrete. Waste Manag. 2009, 29, 643–646. [Google Scholar] [CrossRef] [Scilit]
- Medina, C.; Frías, M.; Sánchez de Rojas, M.I. Microstructure and properties of recycled concretes using ceramic sanitary ware industry waste as coarse aggregate. Constr. Build. Mater. 2012, 31, 112–118. [Google Scholar] [CrossRef] [Scilit]
- Prada, M.; Brata, S.; Tudor, D.; Popescu, D. Reducing of gas emissions according to the EU energy policy targets. J. Environ. Prot. Ecol. 2013, 14, 209–215. [Google Scholar]
- Prada, M.F.; Brata, S.; Tudor, D.F.; Popescu, D.E. Energy saving in Europe and in the world–a desideratum at the beginning of the millenium case study for existing buildings in Romania. In Proceedings of the 11th WSEAS International Conference on Sustainability in Science Engineering, Timisoara, Romania, 27–29 May 2009; pp. 246–251. [Google Scholar]
- Isopescu, D. The impact of green building principles in the sustainable development of the built environment. In Proceedings of the IOP Conference Series: Materials Science and Engineering, Brasov, Romania, 24–27 April 2018; p. 012026. [Google Scholar]
- Prada, M.; Popescu, D.E.; Bungau, C.; Pancu, R. Parametric studies on European 20-20-20 energy policy targets in university environment. J. Environ. Prot. Ecol. 2017, 18, 1146–1157. [Google Scholar]
- Ecodesign and Energy Labelling. Available online: https://ec.europa.eu/info/energy-climate-change-environment/standards-tools-and-labels/products-labelling-rules-and-requirements/energy-label-and-ecodesign_en (accessed on 16 January 2022).
- What is a Passive House? Available online: https://passipedia.org/basics/what_is_a_passive_house (accessed on 30 April 2022).
- Nearly Zero-Energy Buildings. Available online: https://energy.ec.europa.eu/topics/energy-efficiency/energy-efficient-buildings/nearly-zero-energy-buildings_en (accessed on 30 April 2022).
- Circular Economy Action Plan. Available online: https://ec.europa.eu/environment/strategy/circular-economy-action-plan_en (accessed on 30 April 2022).
- Nearly Zero-Energy Buildings and Their Energy Performance. Available online: https://ec.europa.eu/energy/eu-buildings-factsheets-topics-tree/nearly-zero-energy-buildings-and-their-energy-performance_en (accessed on 30 April 2022).
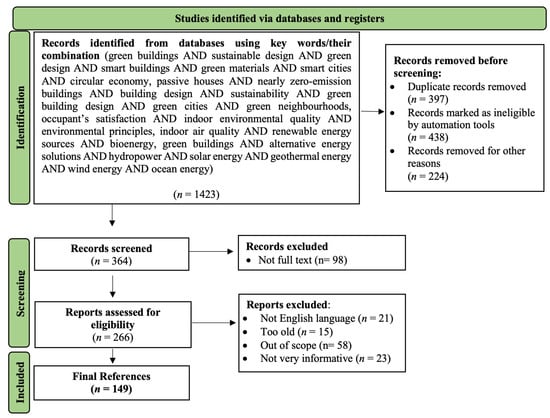
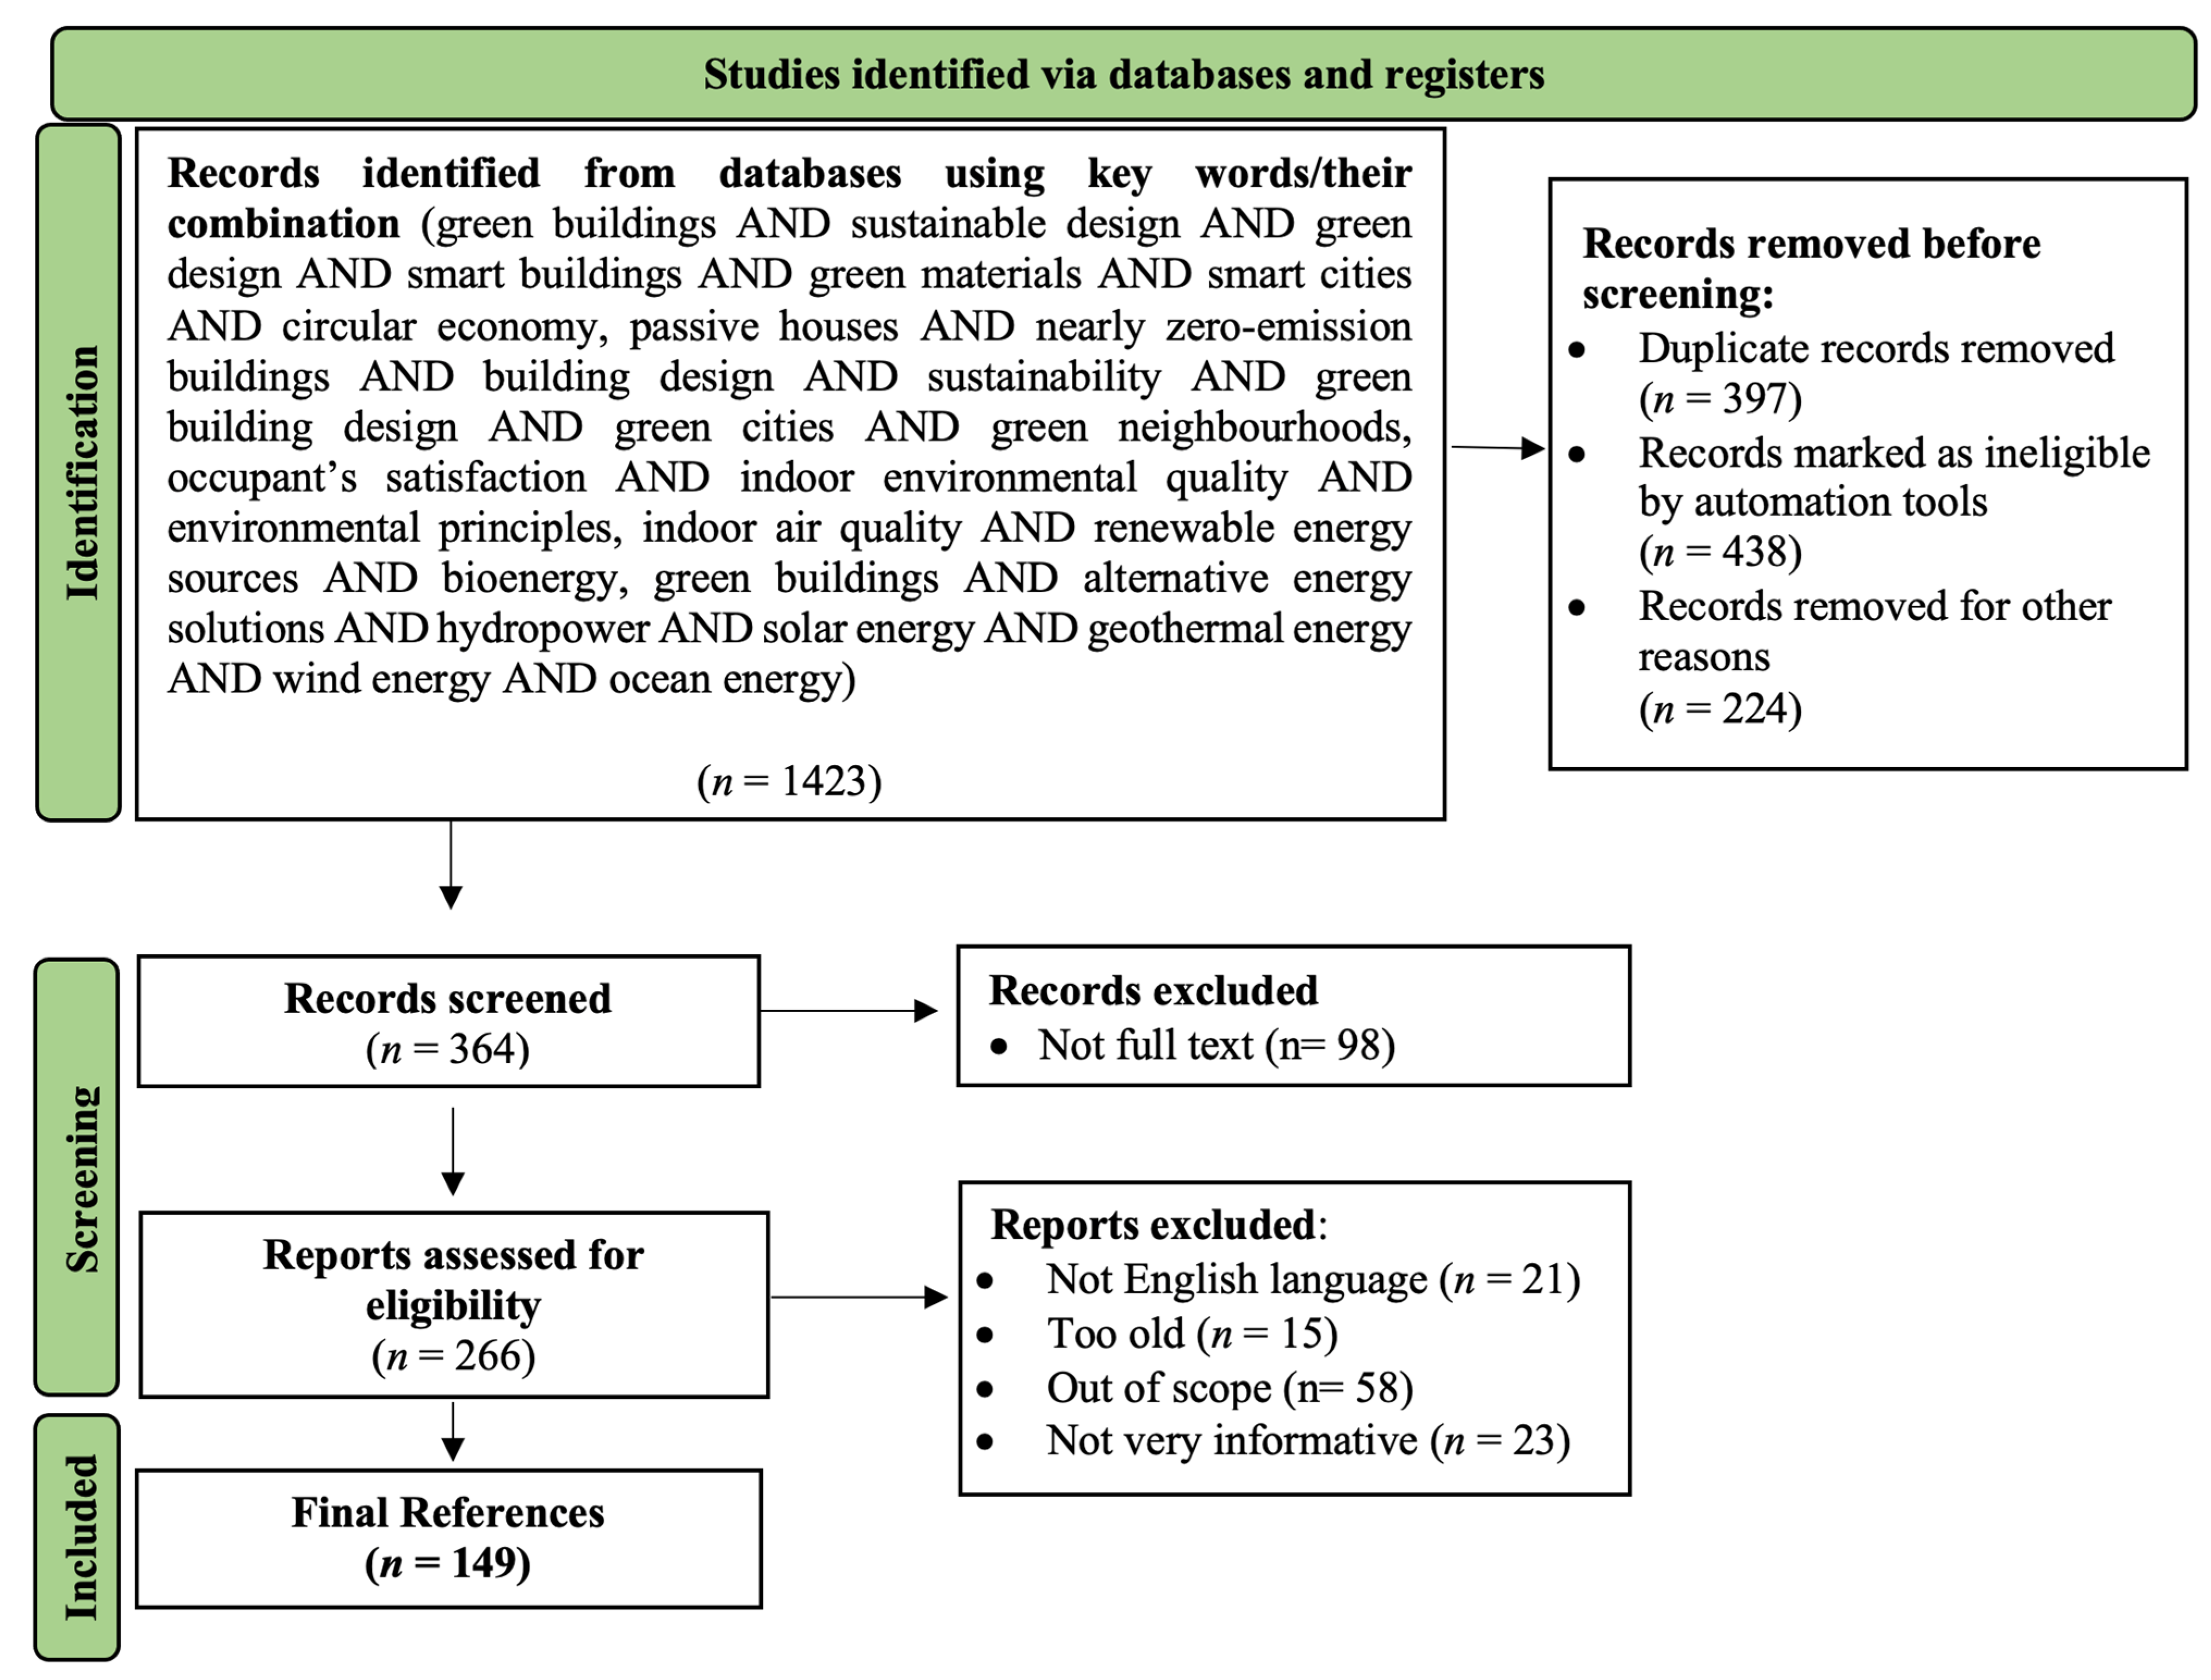
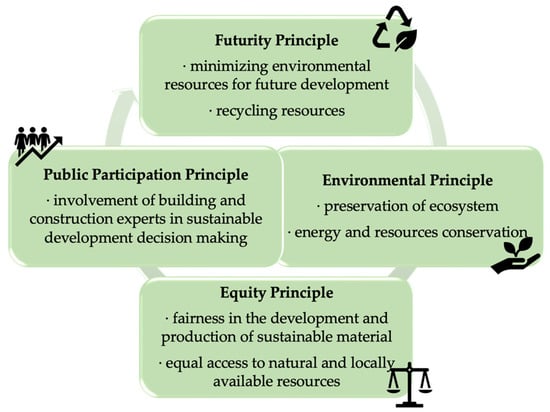
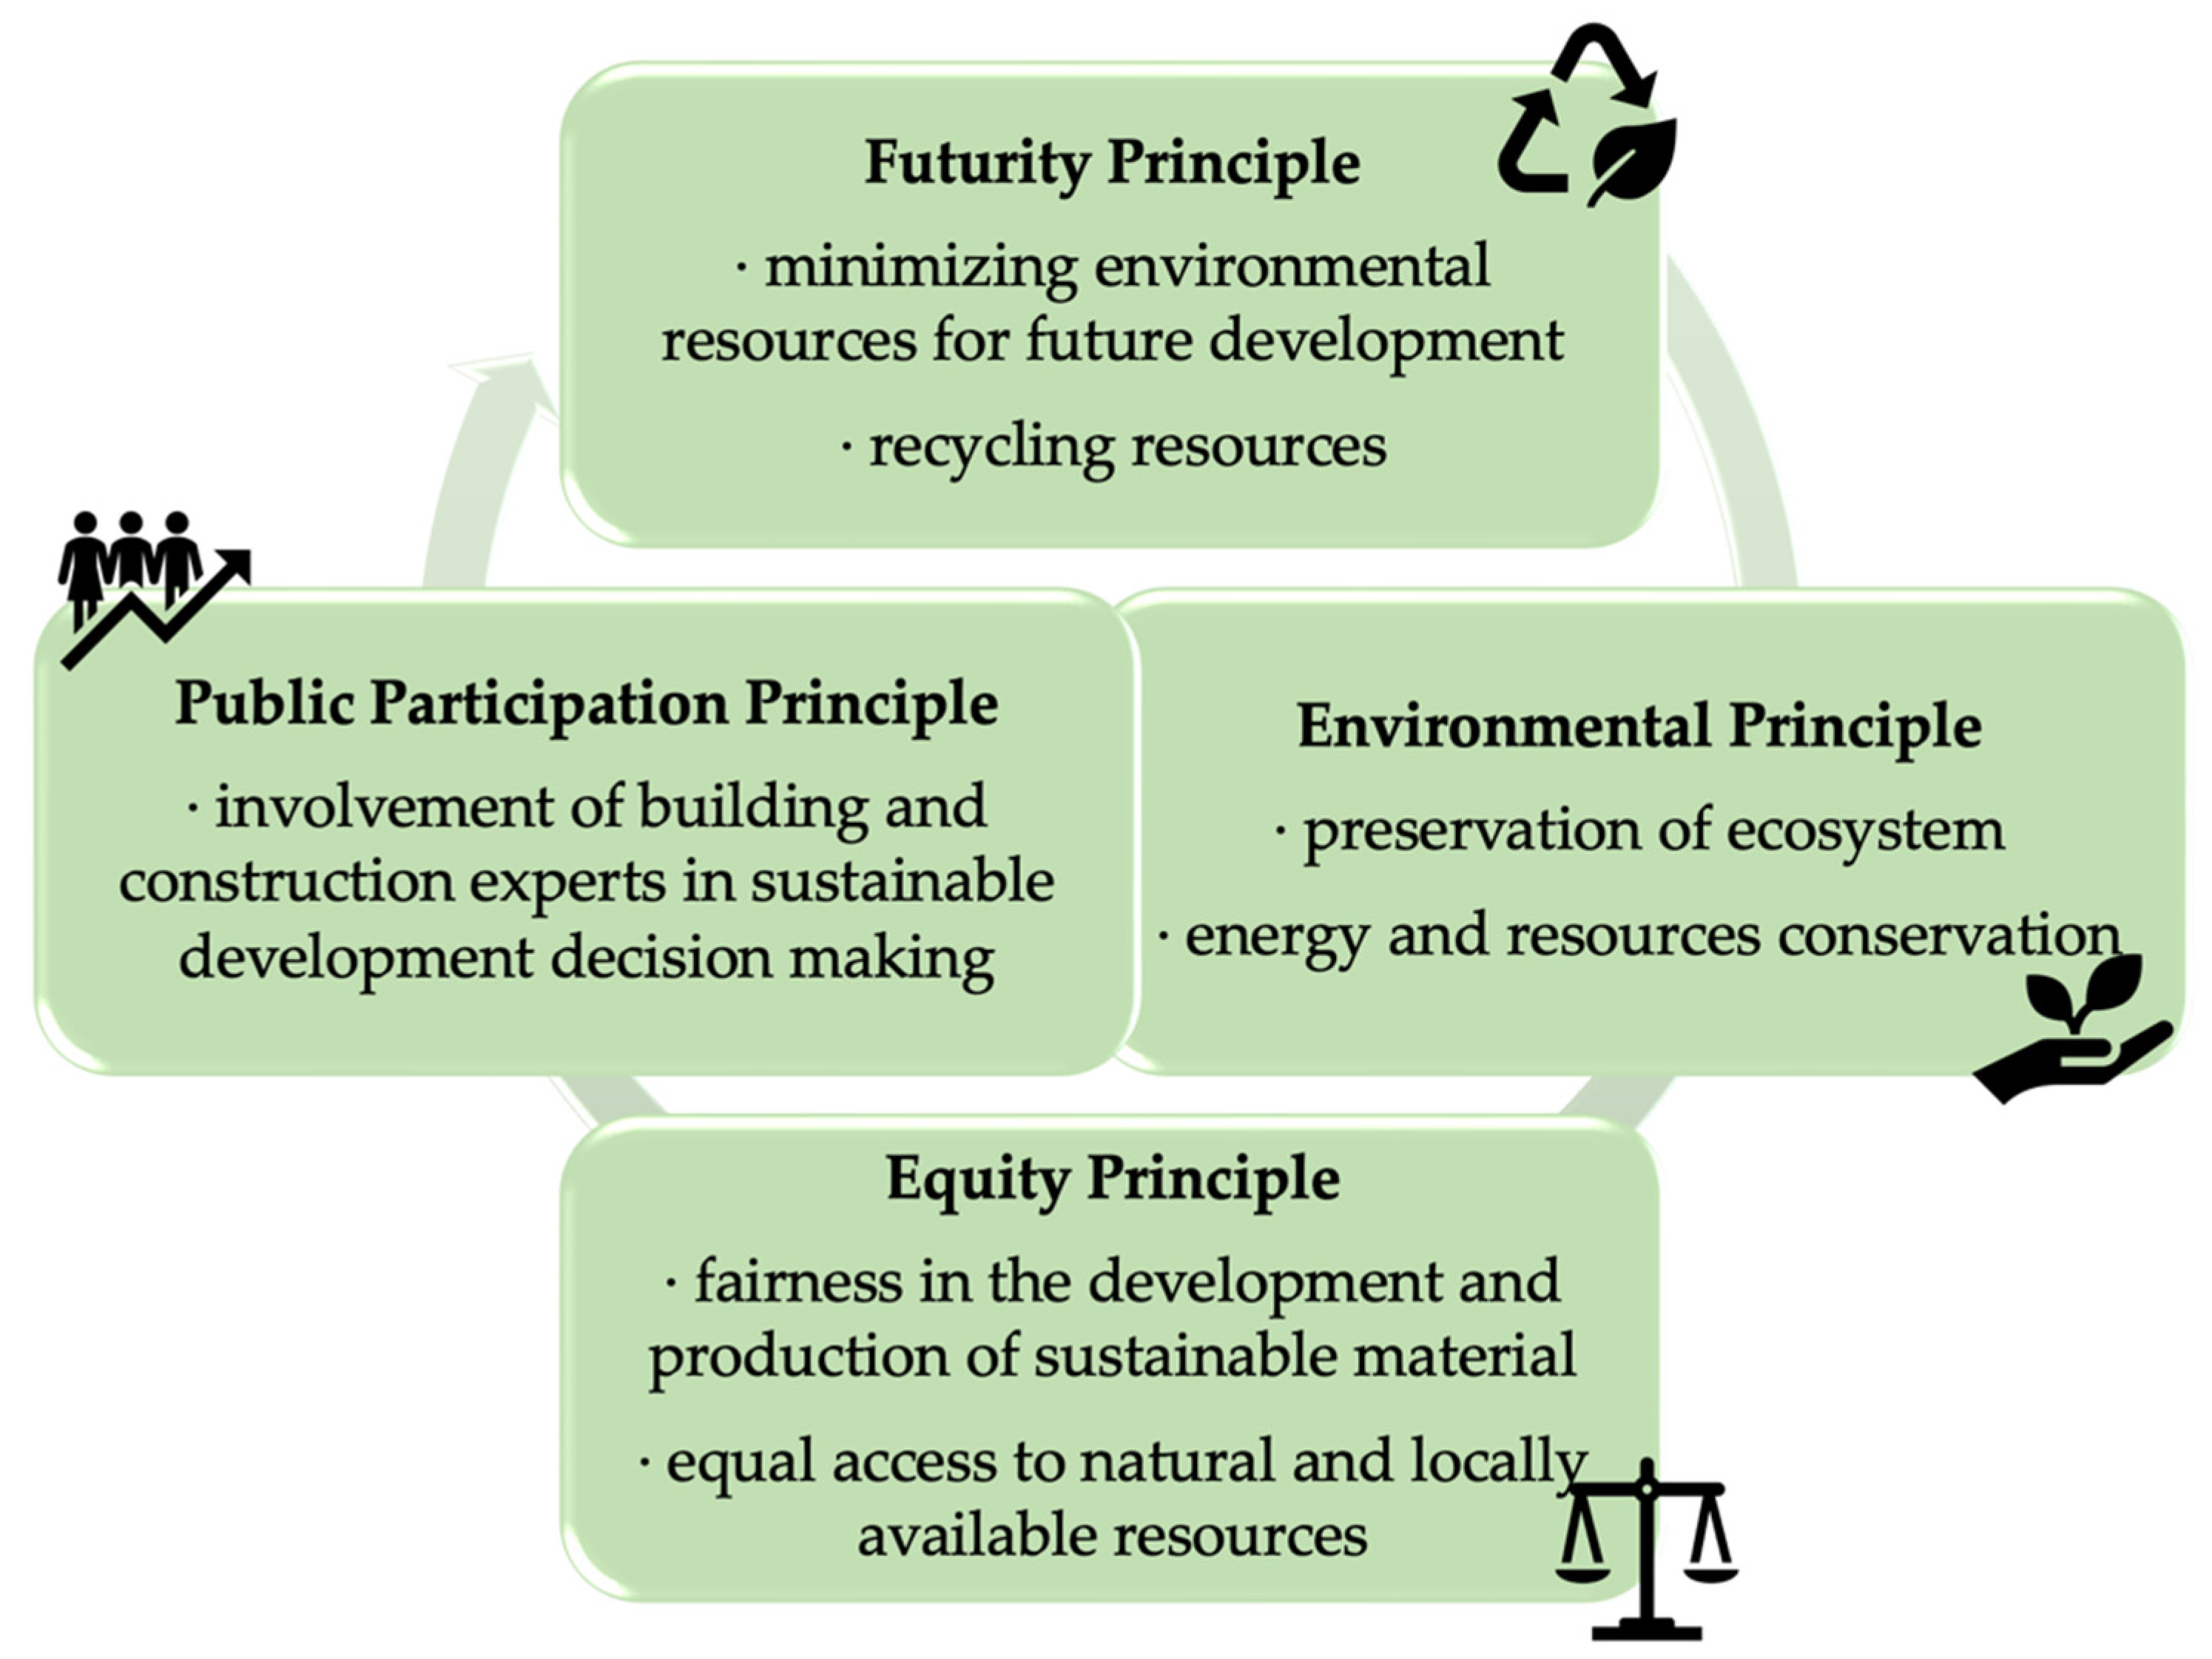
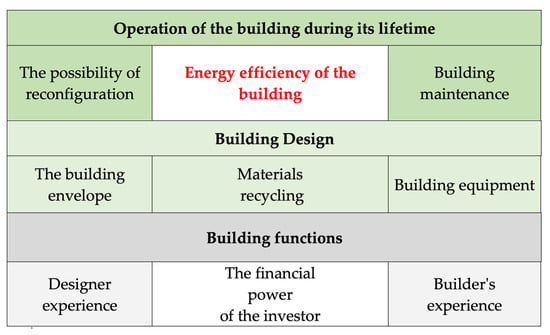
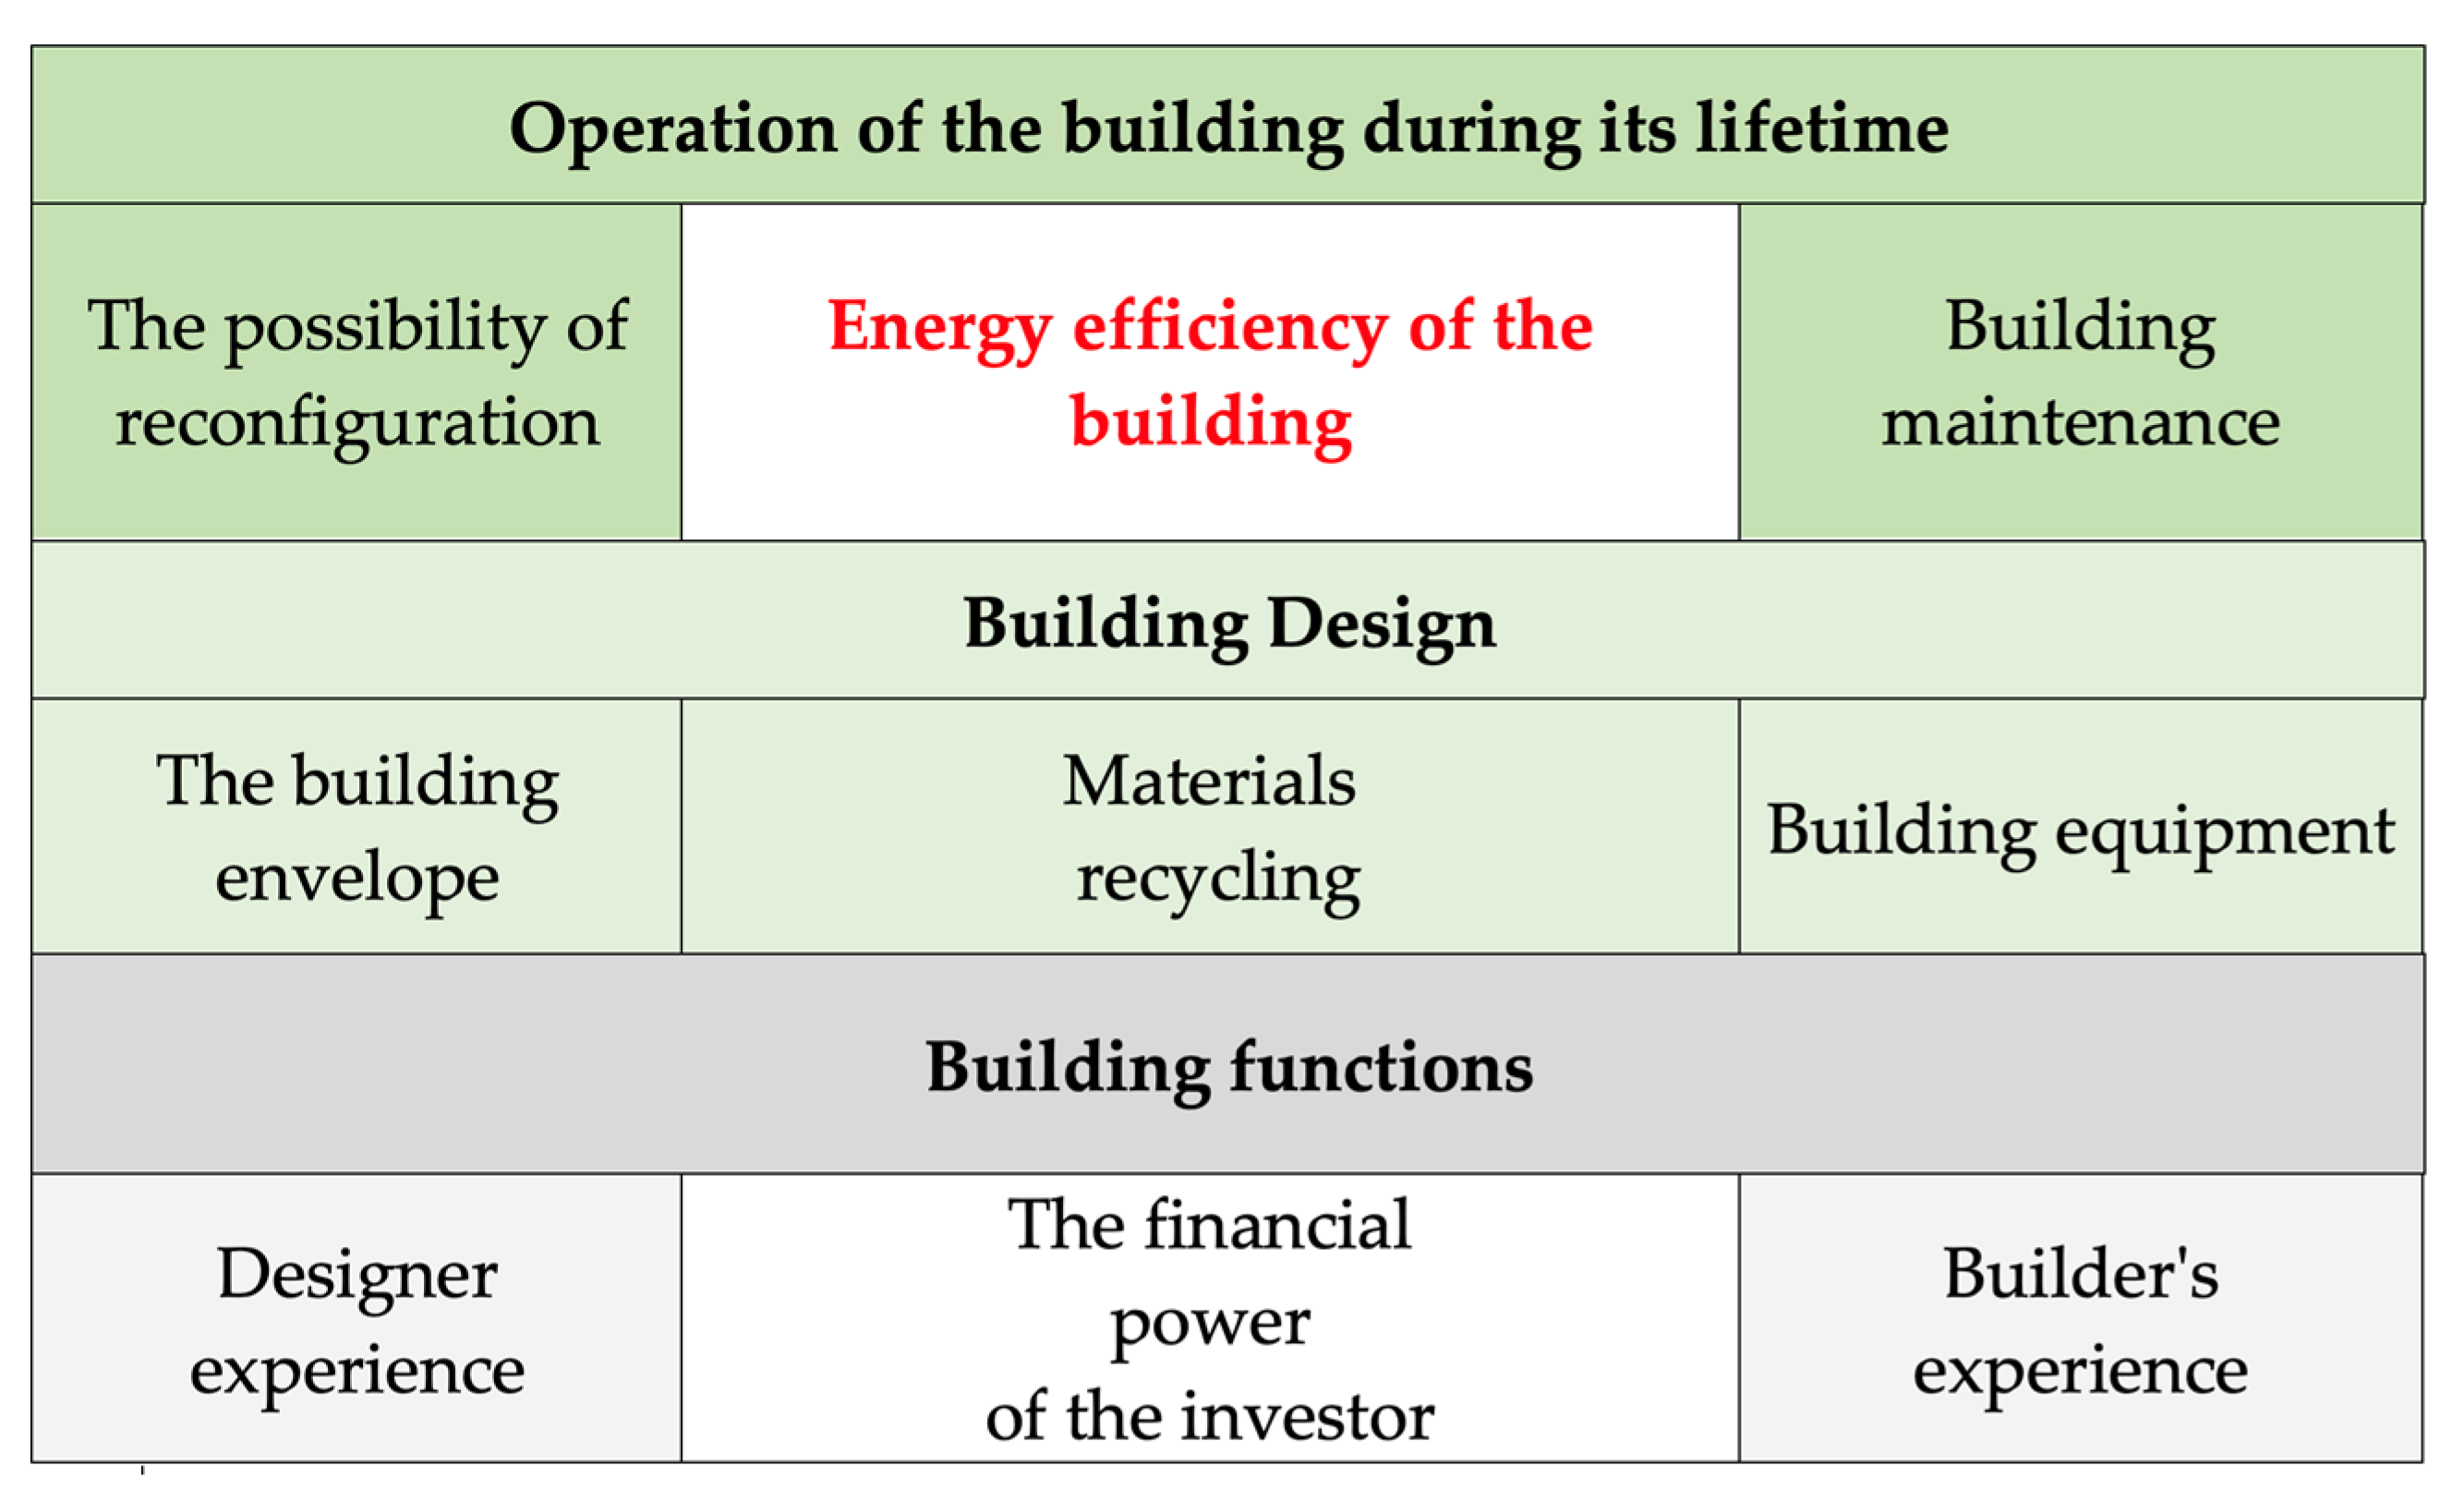
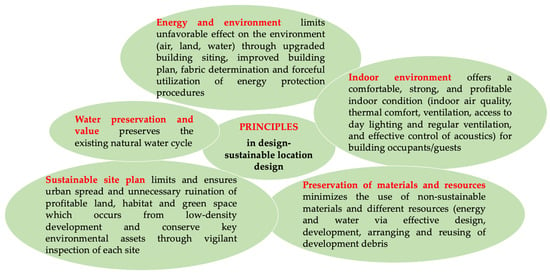
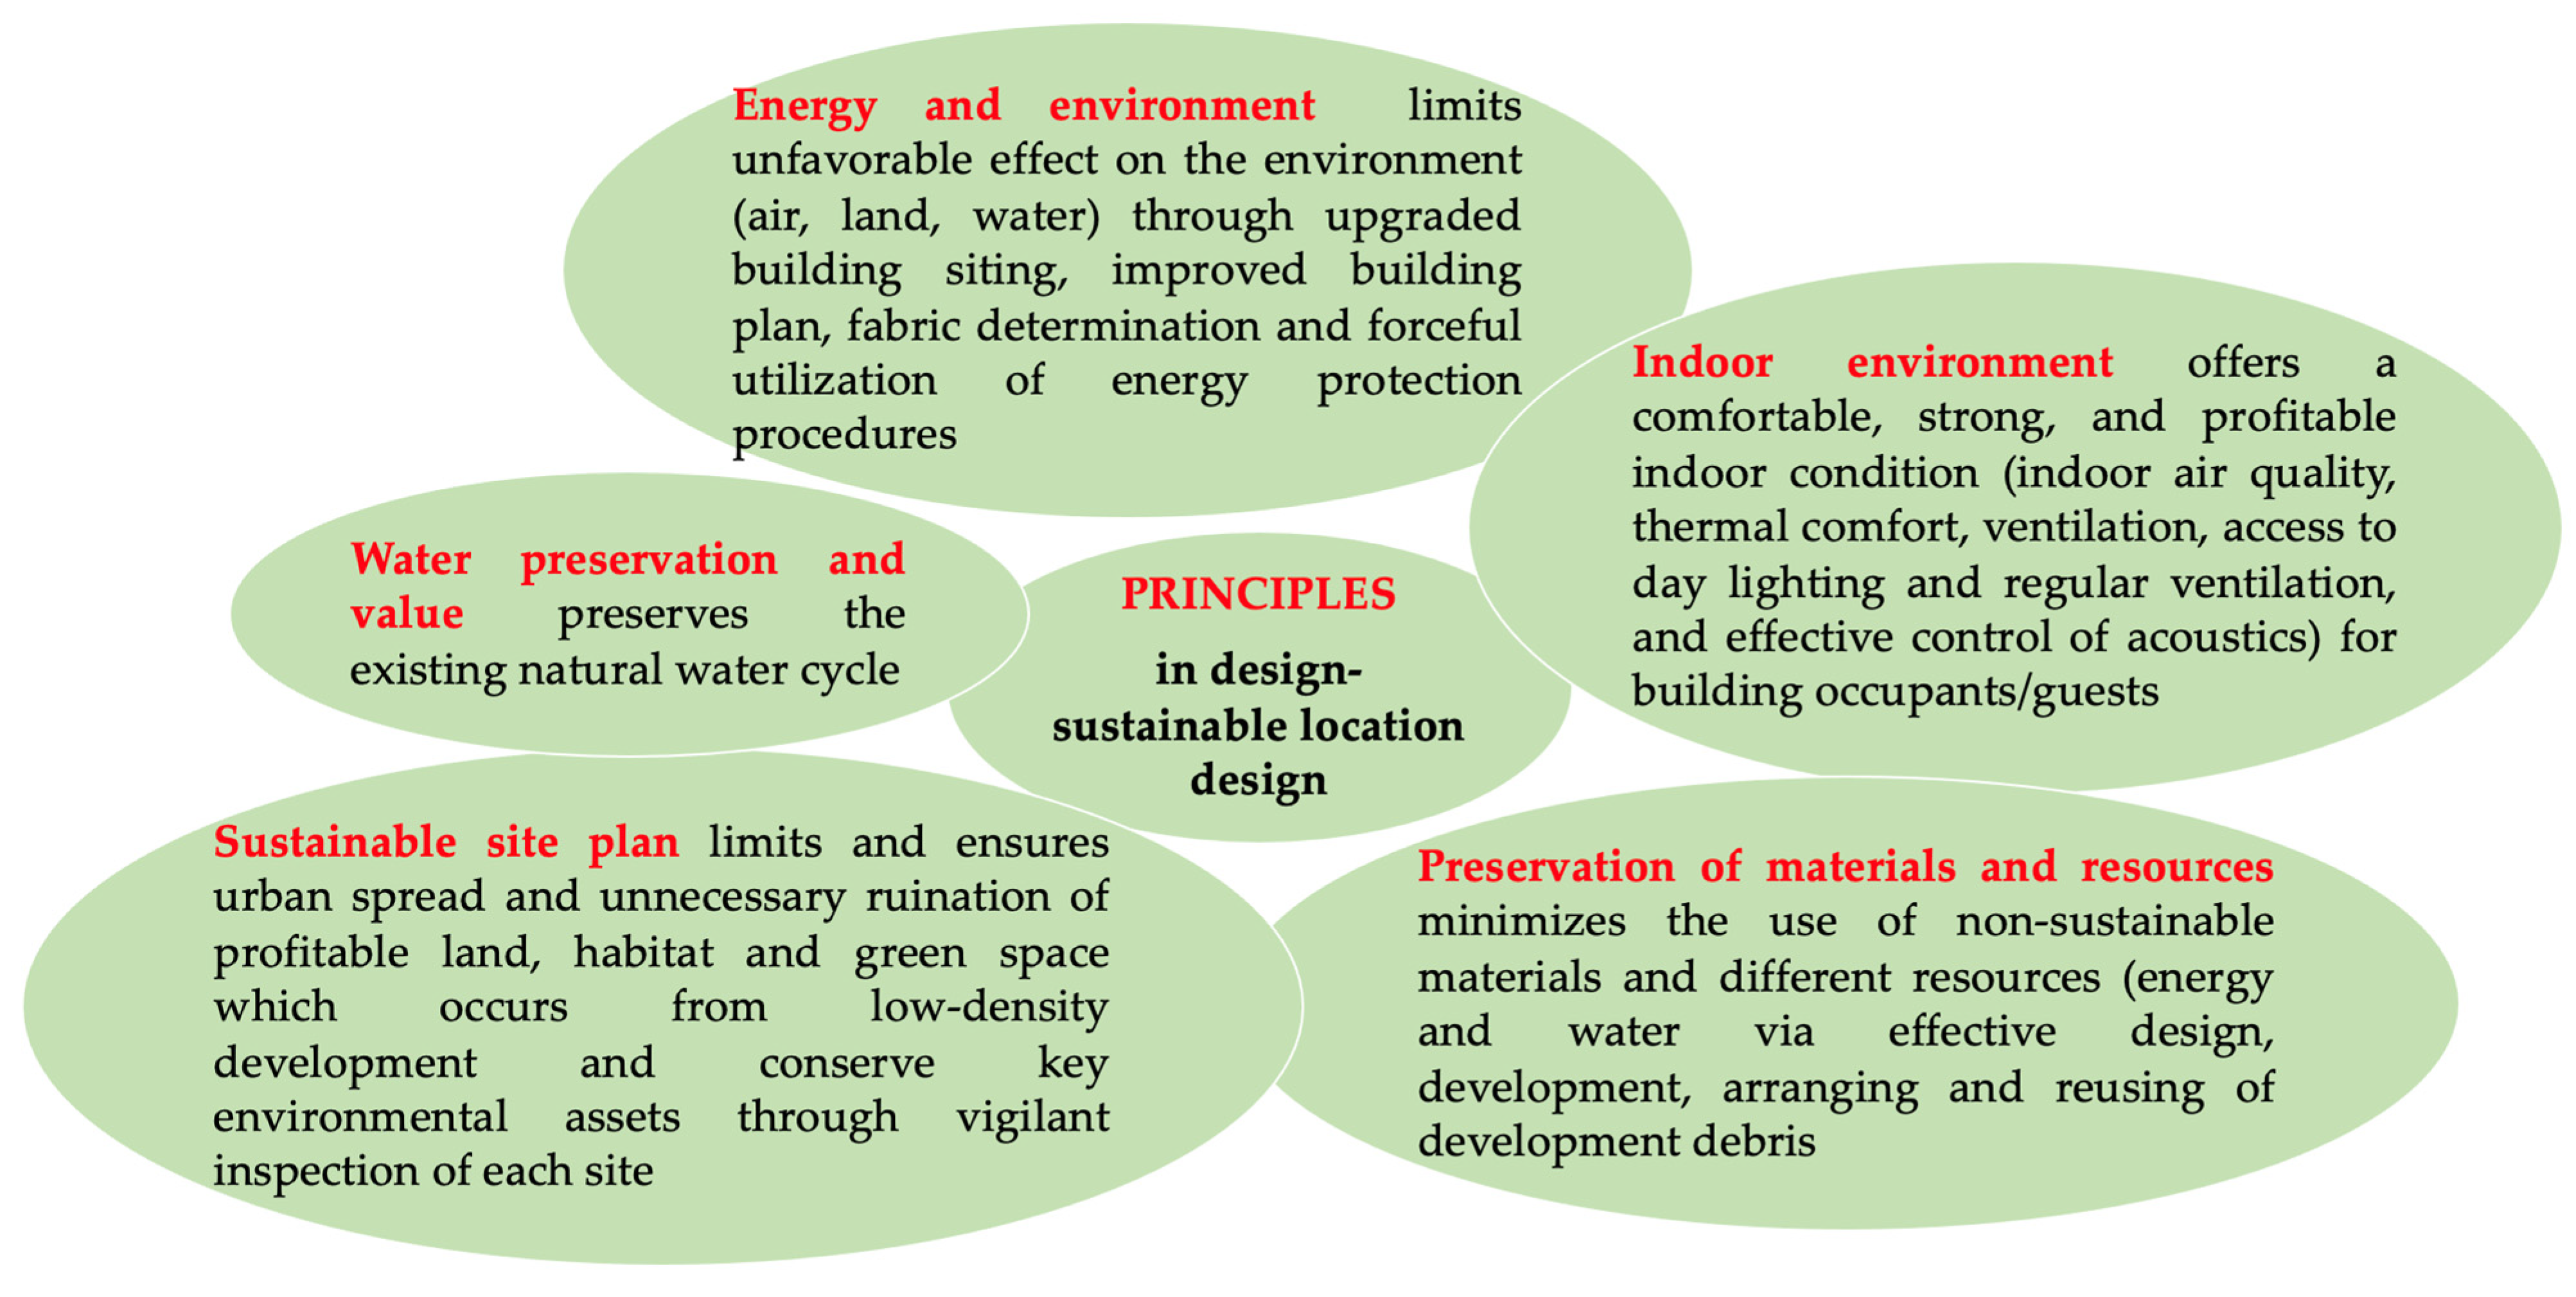
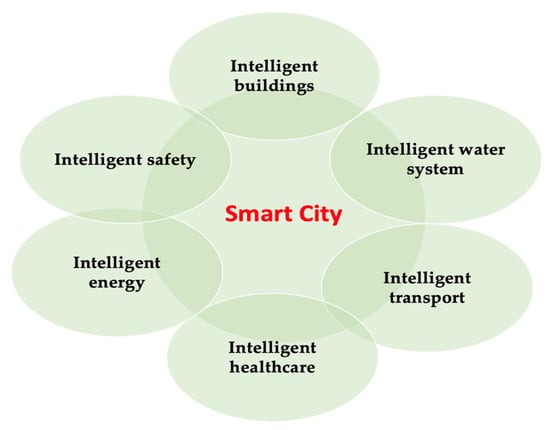
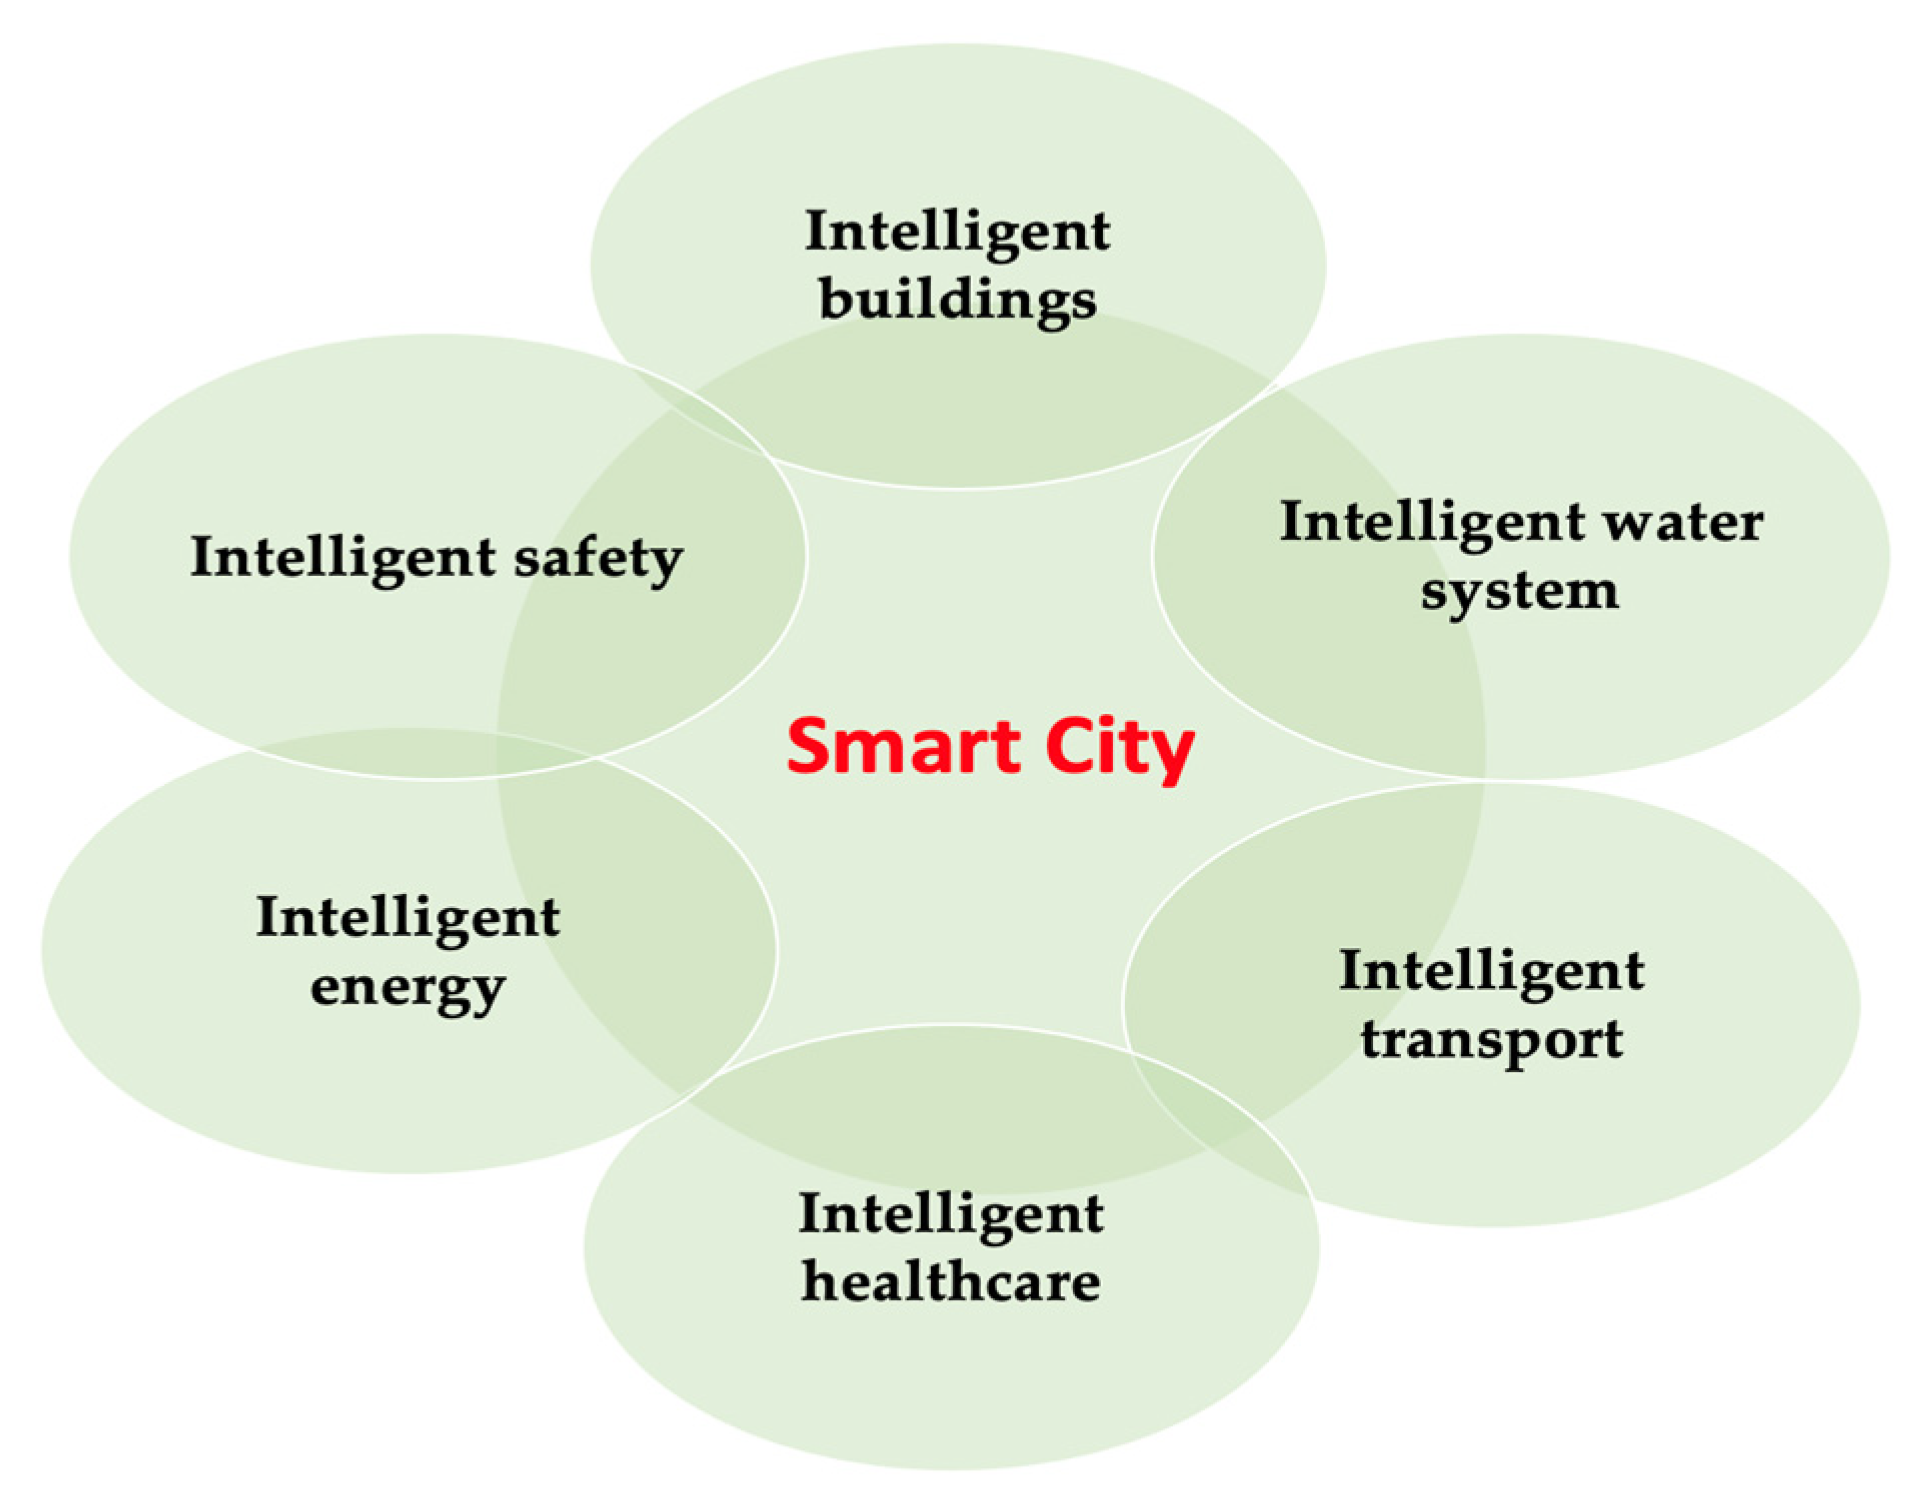
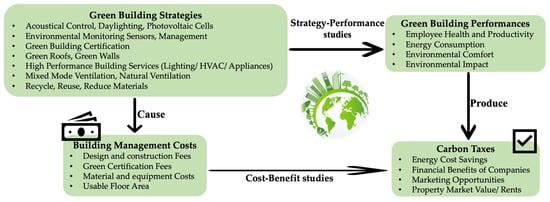
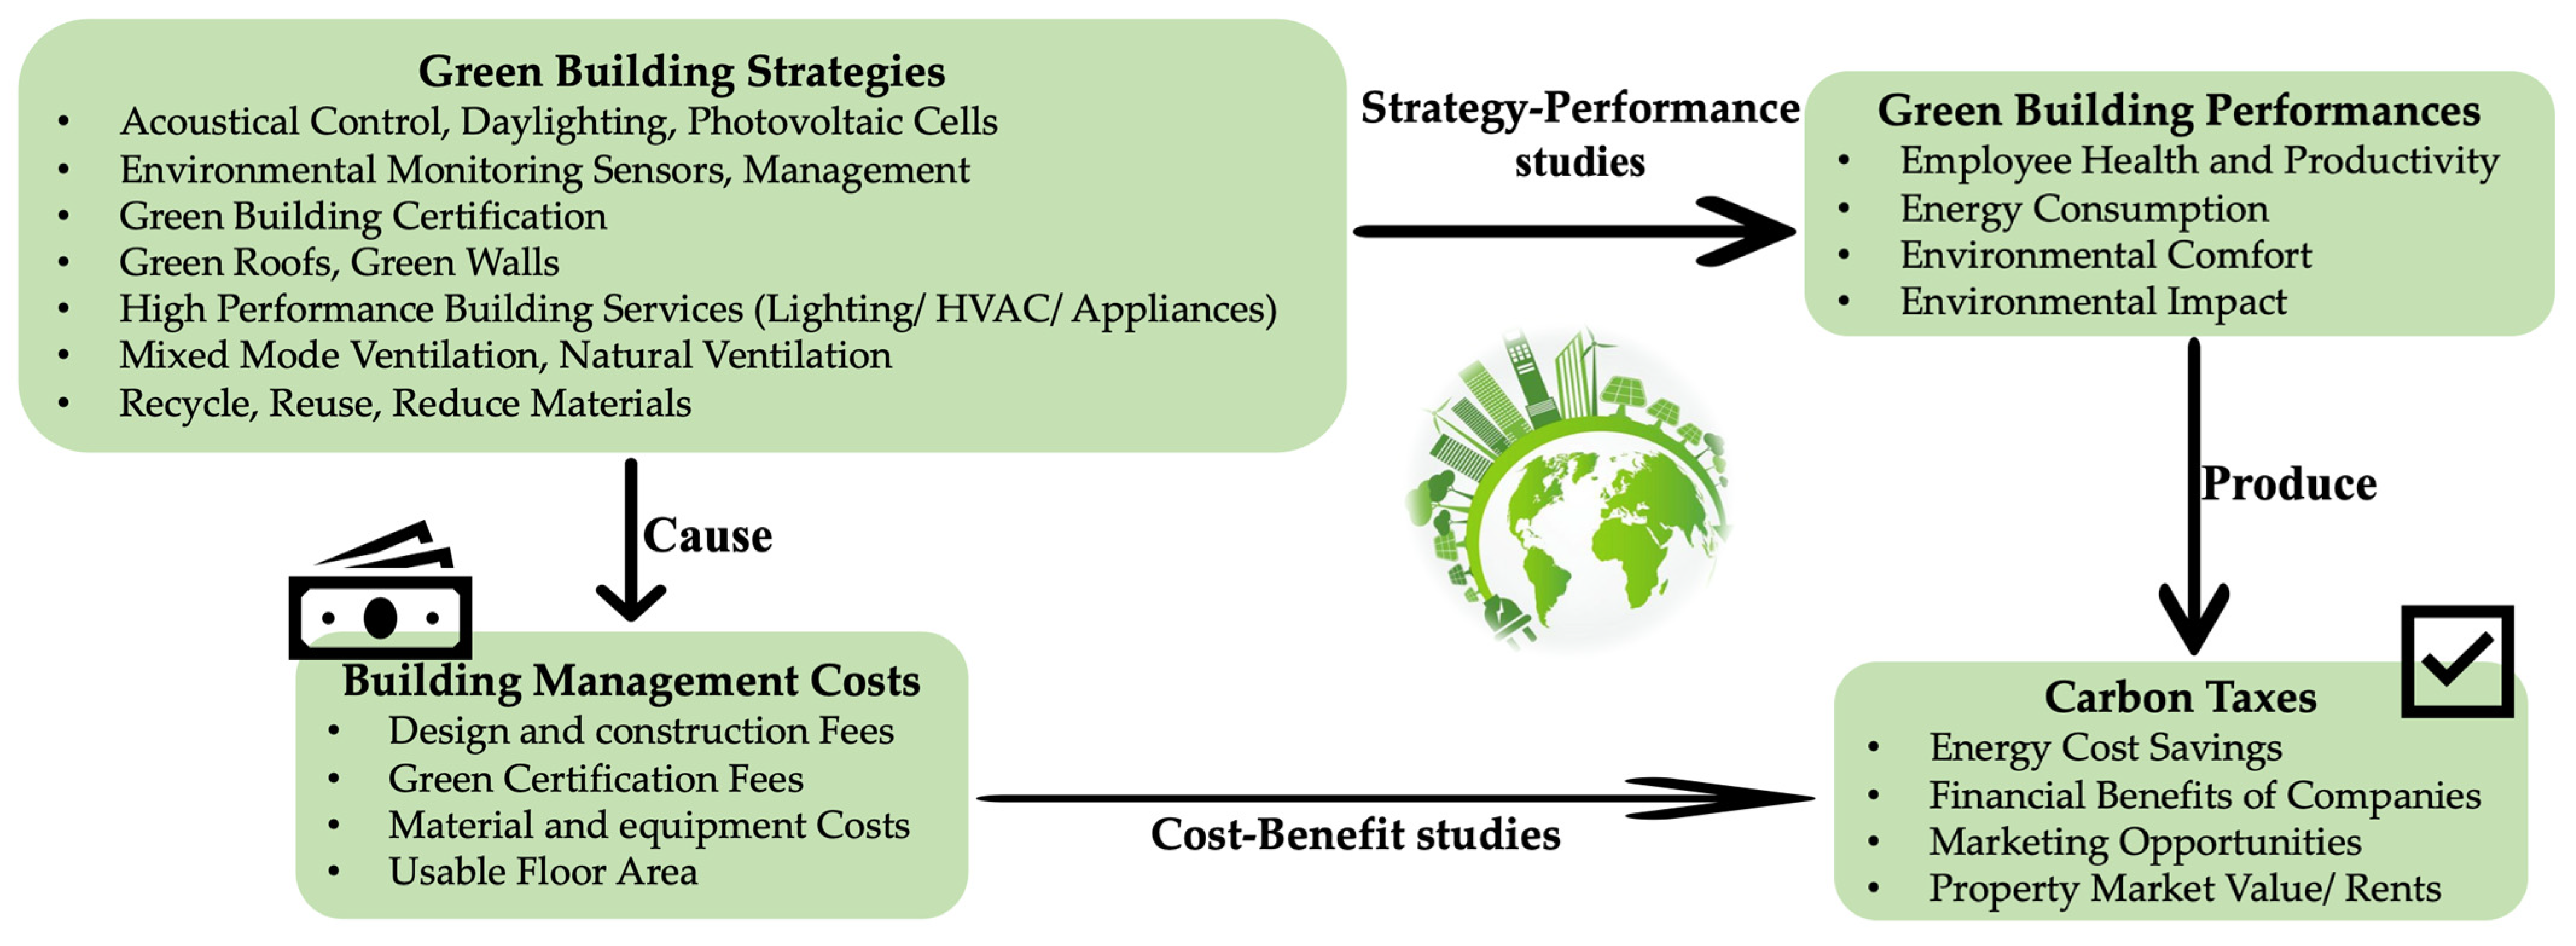
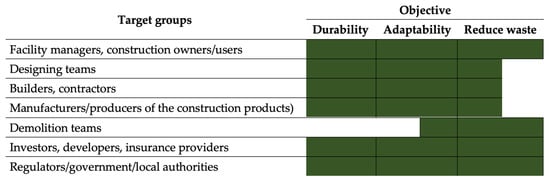
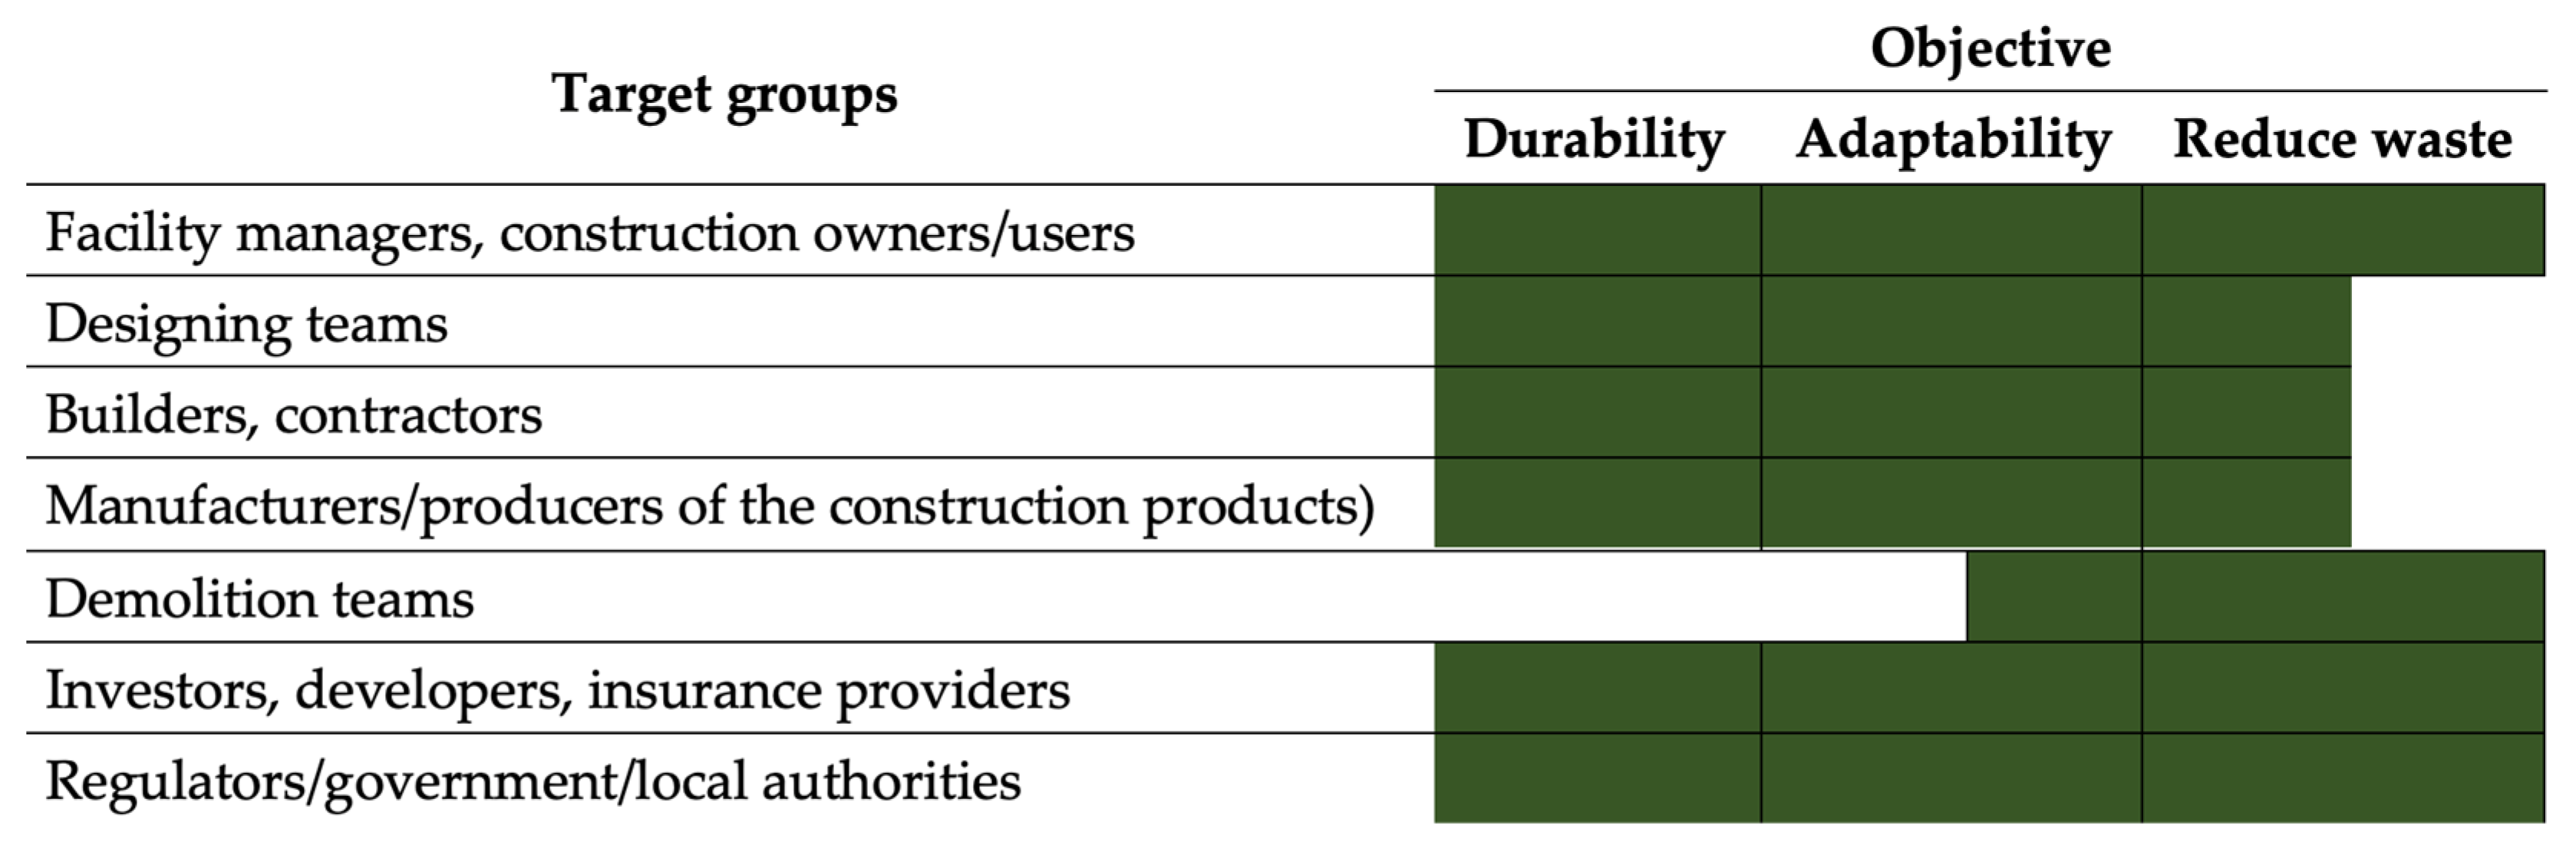
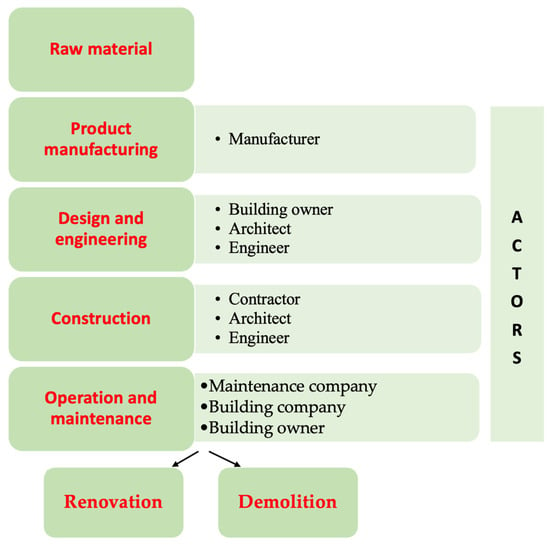
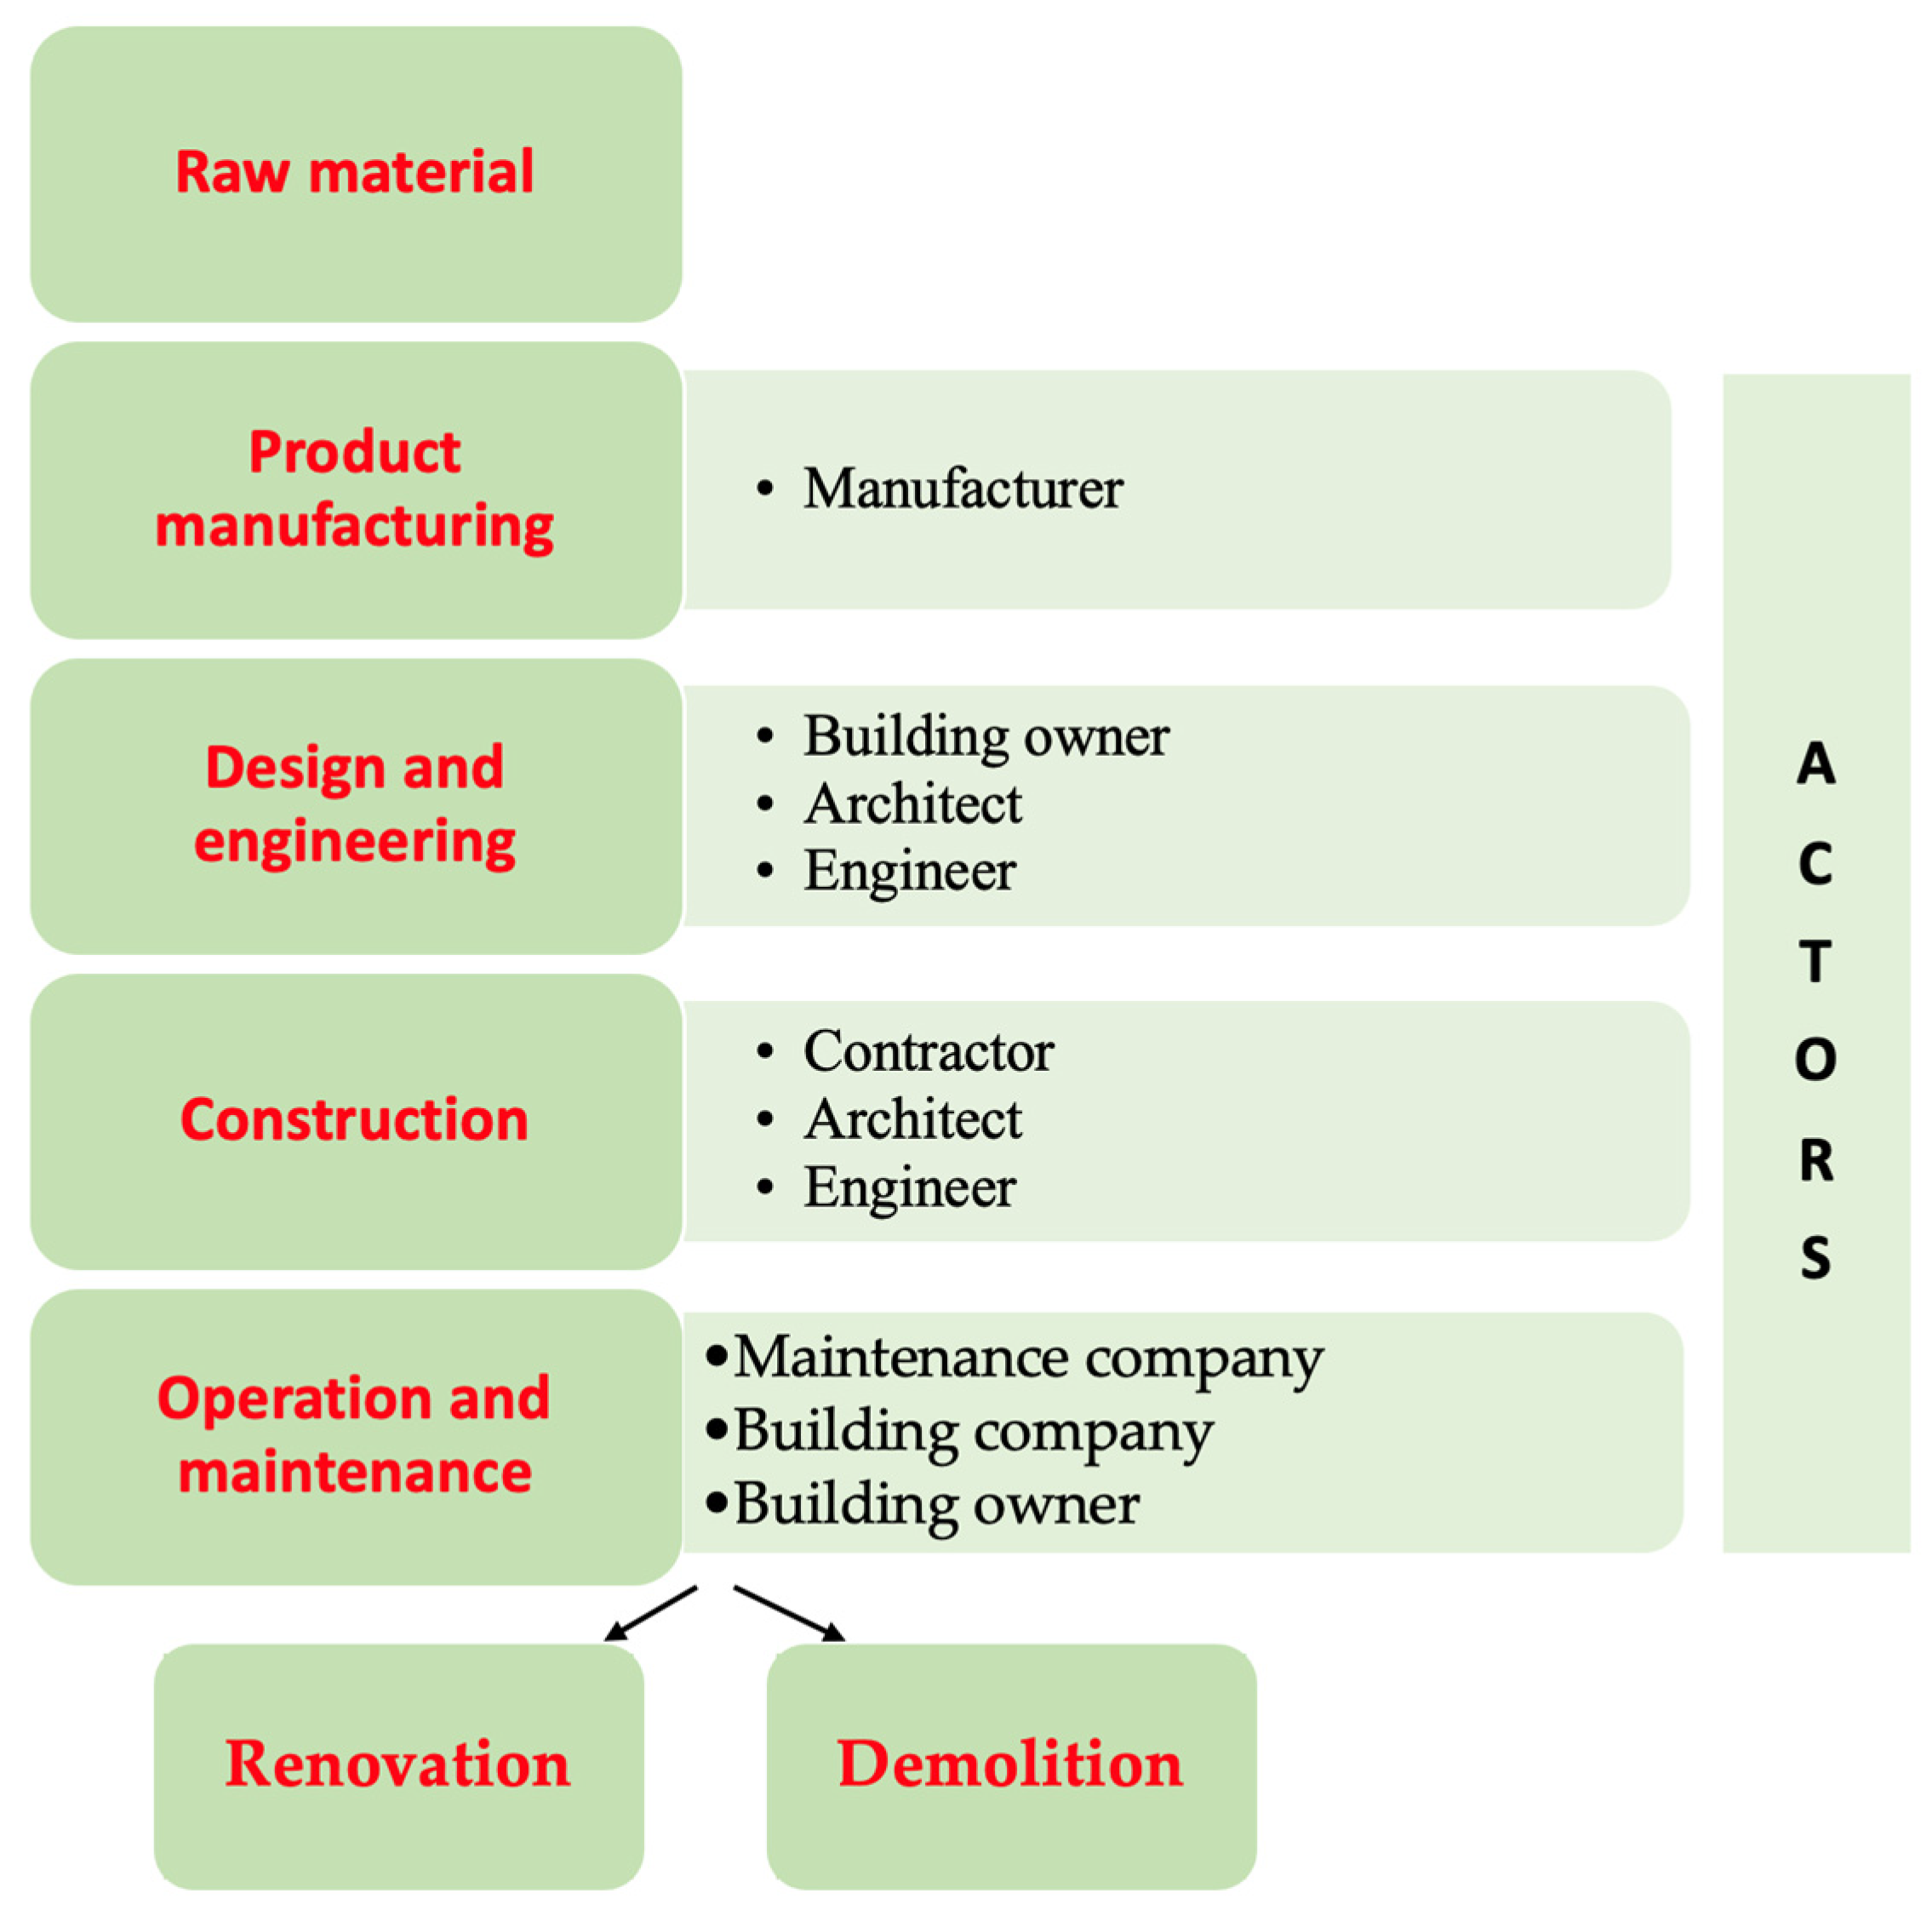
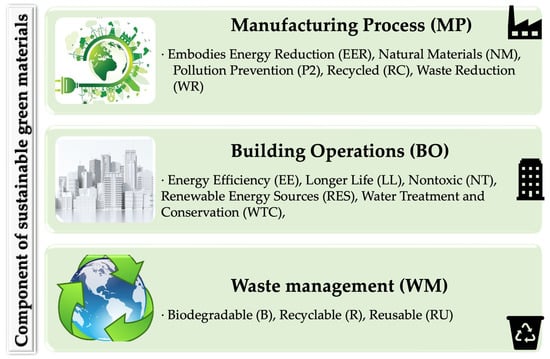
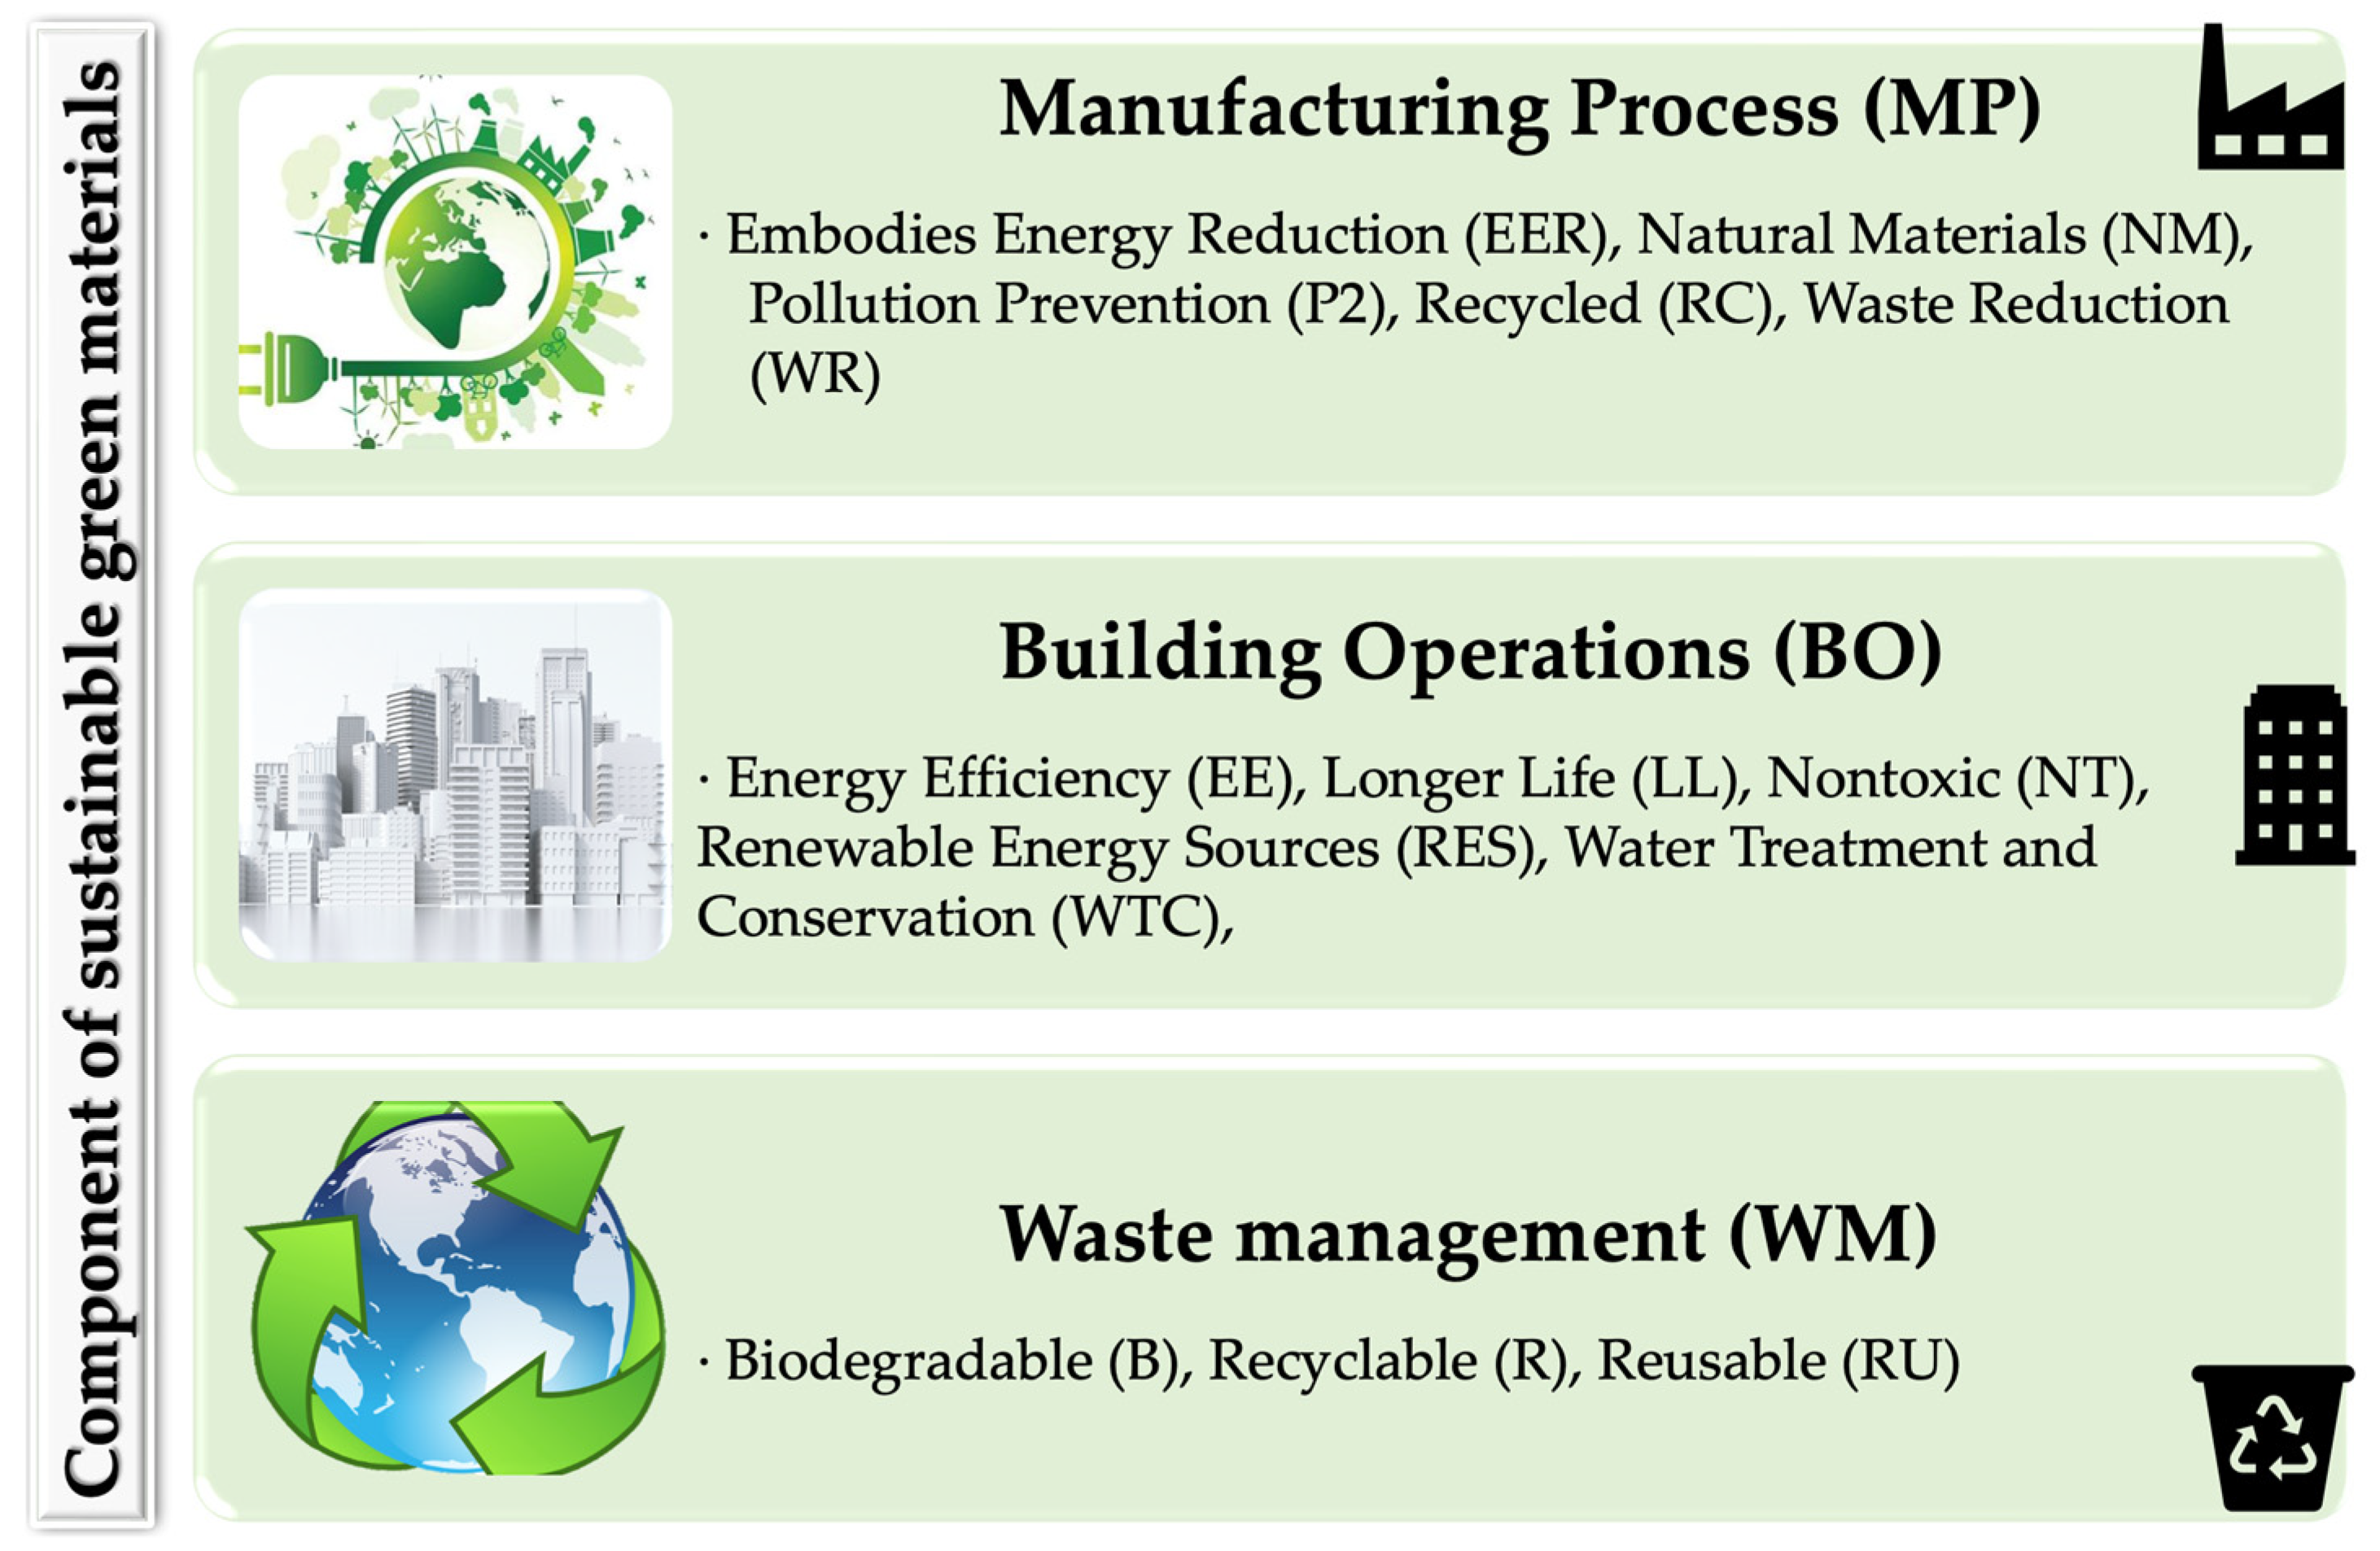
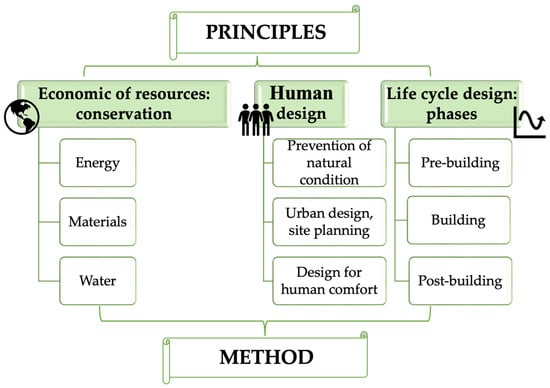
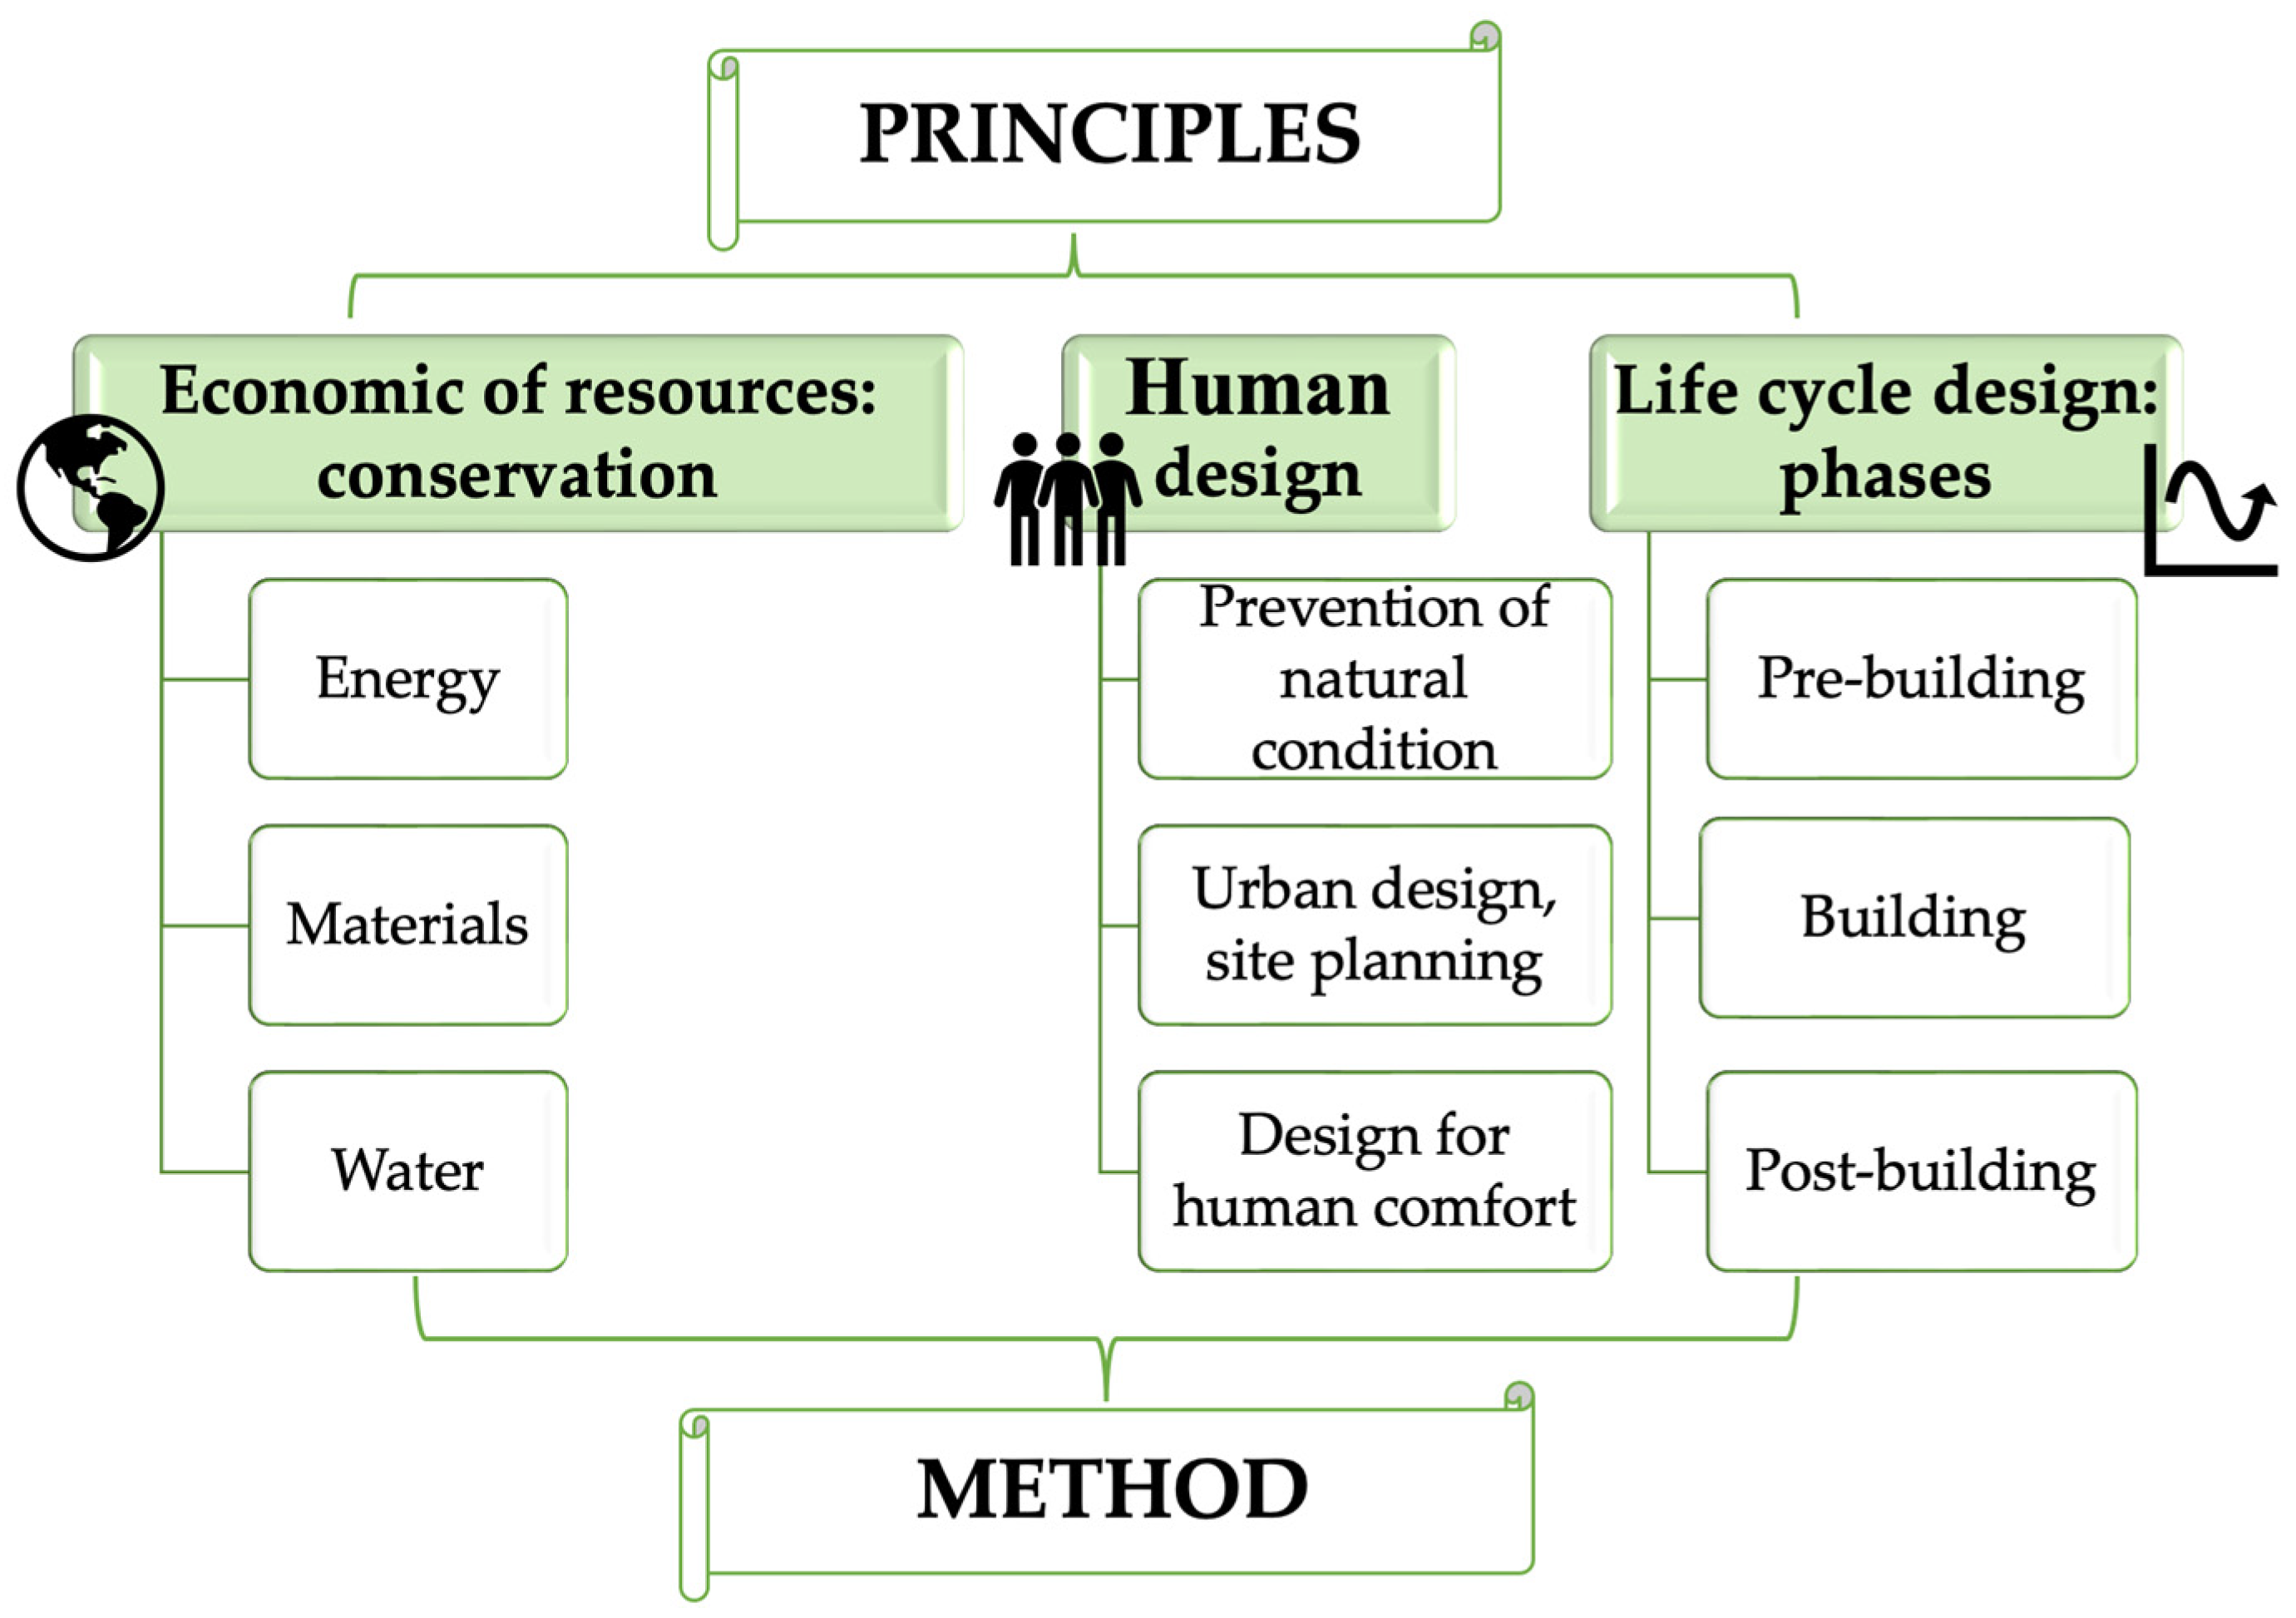

Publisher’s Note: MDPI stays neutral with regard to jurisdictional claims in published maps and institutional affiliations. |
© 2022 by the authors. Licensee MDPI, Basel, Switzerland. This article is an open access article distributed under the terms and conditions of the Creative Commons Attribution (CC BY) license (https://creativecommons.org/licenses/by/4.0/).