


Perceptions of Parents of the Quality of the Public Transport Services Used by Children to Commute to School

 ,
,  ,
,  ,
,  and
and
Abstract
1. Introduction
2. Literature Review
2.1. Conceptualization of the Effect of Parenting Styles on Children’s Risk Perceptions on Roads
2.2. Measurement of the Perception of Transport Users of the Quality of Public Transportation
2.2.1. Transportation
2.2.2. Infrastructure
2.2.3. Information
2.2.4. Safety Behavior of Drivers
2.2.5. Safety of Transportation Systems
2.2.6. Safety Policy
3. Materials and Methods
3.1. Participants and Data Collection
3.2. Data Analysis
3.2.1. Exploratory Factor Analysis (EFA)
3.2.2. Reliability of the Research Instrument
3.2.3. Confirmatory Factor Analysis (CFA)
4. Results
4.1. Descriptive Statistics
4.2. Results of the EFA
4.2.1. Primary Statistics of the Variables Used in the EFA
4.2.2. Extraction Results of the EFA
4.2.3. Validity and Reliability Tests of the Questionnaire
4.2.4. Internal Consistency Reliability
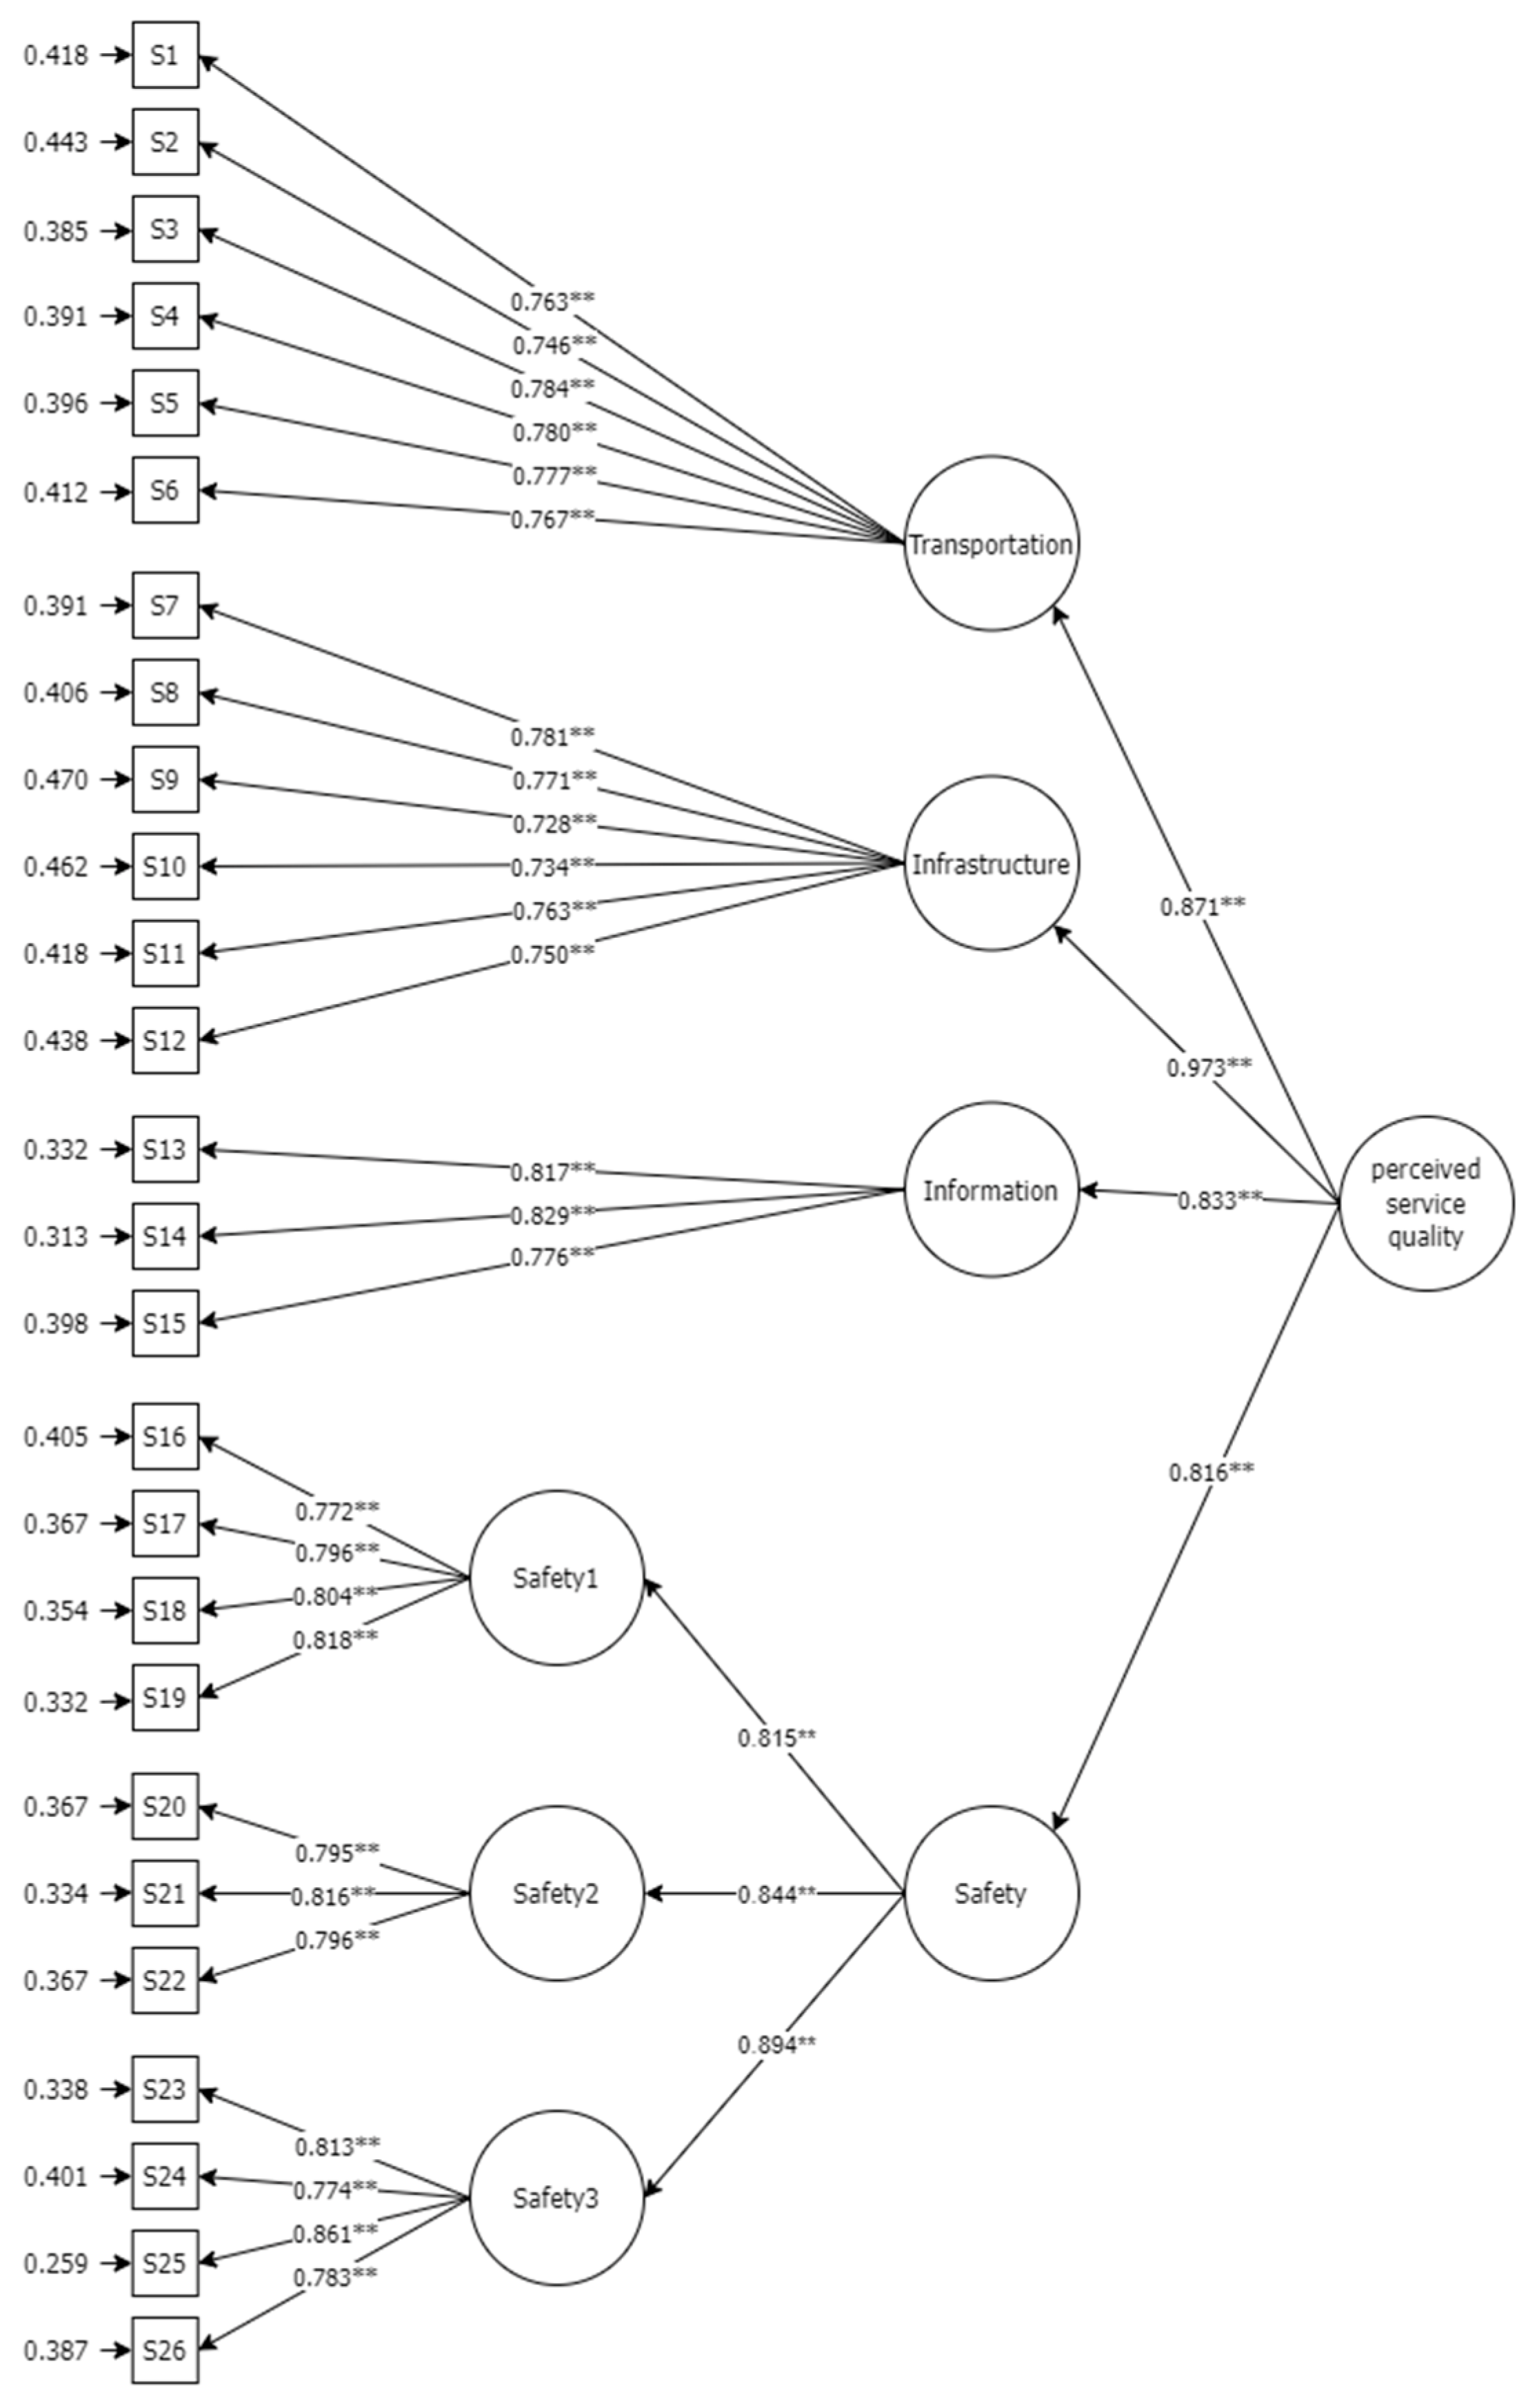
4.3. Results of the Third-Order CFA
5. Discussion and Conclusions
5.1. Transportation
- The use of public transportation to travel to school for students should be convenient and have no obstacles to using the service, such as easy access for getting on and off the bus, a sufficient amount of seating, and a fast travel time, which was in line with the studies of de Oña, Estévez and de Oña [20], Yao, Xu, Zhang and Li [70], d’Ovidio, Leogrande, Mancarella, Schinzano and Viola [72].
- The public transport should be connected to other modes of transport, so that students can adjust their travel plans accordingly. This was consistent with the findings of de Oña, Estévez and de Oña [20], Yao, Xu, Zhang and Li [70], Deepa, Mondal, Raman, Pinjari, Bhat, Srinivasan, Pendyala and Ramadurai [76].
5.2. Infrastructure
- The bus station must be clean and well-equipped (with an adequate roof, lighting, and seating) to ensure the trust and safety of the users. (which was consistent with Prasad and Maitra [17], de Oña, Estévez and de Oña [20], Sakellariou, Kotoula, Morfoulaki and Mintsis [75], Ikeda, Mavoa, Cavadino, Carroll, Hinckson, Witten and Smith [79], Mindell, Ergler, Hopkins and Mandic [80]).
5.3. Information
- There should be an information service for traveling to school by public transport. In addition, the service point should be clear and easy to understand for the public, which corresponded to the studies of de Oña, Estévez and de Oña [20], Atombo and Dzigbordi Wemegah [69], Yao, Xu, Zhang and Li [70], d’Ovidio, Leogrande, Mancarella, Schinzano and Viola [72], Sukhov, Lättman, Olsson, Friman and Fujii [82].
5.4. Safety
6. Limitations and Suggestions for Future Studies
Author Contributions
Funding
Institutional Review Board Statement
Informed Consent Statement
Data Availability Statement
Acknowledgments
Conflicts of Interest
References
- Queiroz, M.M.; Celeste, P.; Moura, F. School commuting: The influence of soft and hard factors to shift to public transport. Transp. Res. Procedia 2020, 47, 625–632. [Google Scholar] [CrossRef]
- Nasrudin, N.a.; Nor, A.R.M. Travelling to School: Transportation Selection by Parents and Awareness towards Sustainable Transportation. Procedia Environ. Sci. 2013, 17, 392–400. [Google Scholar] [CrossRef]
- Road Safety Thailand Road Safety Policy Foundation. Students Road Accident. Available online: http://www.roadsafetythai.org (accessed on 1 August 2022). (In Thai).
- McDonald, N.C. Children’s mode choice for the school trip: The role of distance and school location in walking to school. Transportation 2008, 35, 23–35. [Google Scholar] [CrossRef]
- McMillan, T.E. The relative influence of urban form on a child’s travel mode to school. Transp. Res. Part A Policy Pract. 2007, 41, 69–79. [Google Scholar] [CrossRef]
- Schlossberg, M.; Greene, J.; Phillips, P.P.; Johnson, B.; Parker, B. School trips: Effects of urban form and distance on travel mode. J. Am. Plan. Assoc. 2006, 72, 337–346. [Google Scholar] [CrossRef]
- Black, C.; Collins, A.; Snell, M. Encouraging walking: The case of journey-to-school trips in compact urban areas. Urban Stud. 2001, 38, 1121–1141. [Google Scholar] [CrossRef]
- Johansson, M. Environment and parental factors as determinants of mode for children’s leisure travel. J. Environ. Psychol. 2006, 26, 156–169. [Google Scholar] [CrossRef]
- Ewing, R.; Schroeer, W.; Greene, W. School location and student travel analysis of factors affecting mode choice. Transp. Res. Rec. 2004, 1895, 55–63. [Google Scholar] [CrossRef]
- Fotel, T.; Thomsen, T.U. The Surveillance of Children’s Mobility. Surveill. Soc. 2003, 1, 536. [Google Scholar] [CrossRef]
- Martin, S.; Carlson, S. Barriers to children walking to or from school: United States, 2004. Mortal. Wkly. Rep. MMWR 2005, 54. [Google Scholar] [CrossRef]
- Injury Data Collaboration Center Division of Injury Prevention. Situation of Death from Road Accidents in Thailand; Injury Data Collaboration Center Division of Injury Prevention: Bangkok, Thailand, 2020. (In Thai) [Google Scholar]
- Public Health Statistics. Child Injuries. Available online: https://www.emro.who.int/health-topics/child-injuries/index.html (accessed on 17 June 2022). (In Thai).
- Mokarami, H.; Alizadeh, S.S.; Rahimi Pordanjani, T.; Varmazyar, S. The relationship between organizational safety culture and unsafe behaviors, and accidents among public transport bus drivers using structural equation modeling. Transp. Res. Part F Traffic Psychol. Behav. 2019, 65, 46–55. [Google Scholar] [CrossRef]
- Dianat, I.; Javadivala, Z.; Asghari-Jafarabadi, M.; Asl Hashemi, A.; Haslegrave, C.M. The use of schoolbags and musculoskeletal symptoms among primary school children: Are the recommended weight limits adequate? Ergonomics 2013, 56, 79–89. [Google Scholar] [CrossRef]
- Quiñonez, L.L.; Pires, F.M.; Martini, L.C. Proposal for a Real-time On-Board Monitor to Evaluate the Comfort Level in Scholar Transportation. In Proceedings of the 2019 IEEE 10th Annual Information Technology, Electronics and Mobile Communication Conference (IEMCON), Vancouver, BC, Canada, 17–19 October 2019; pp. 1113–1117. [Google Scholar]
- Prasad, P.; Maitra, B. Identifying areas of interventions for improvement of shared modes for school trips. Transp. Res. Part A Policy Pract. 2019, 121, 122–135. [Google Scholar] [CrossRef]
- Ratanavaraha, V.; Jomnonkwao, S.; Khampirat, B.; Watthanaklang, D.; Iamtrakul, P. The complex relationship between school policy, service quality, satisfaction, and loyalty for educational tour bus services: A multilevel modeling approach. Transp. Policy 2016, 45, 116–126. [Google Scholar] [CrossRef]
- Ratanavaraha, V.; Jomnonkwao, S. Model of users׳ expectations of drivers of sightseeing buses: Confirmatory factor analysis. Transp. Policy 2014, 36, 253–262. [Google Scholar] [CrossRef]
- de Oña, J.; Estévez, E.; de Oña, R. Public transport users versus private vehicle users: Differences about quality of service, satisfaction and attitudes toward public transport in Madrid (Spain). Travel Behav. Soc. 2021, 23, 76–85. [Google Scholar] [CrossRef]
- Yekimov, S.; Nianko, V.; Pistunov, I.M.; Lopatynskyi, Y.; Valentyna, S. Improving the Quality of Transport Services of Urban Public Transport. Transp. Res. Procedia 2022, 61, 78–82. [Google Scholar] [CrossRef]
- Pollard, E.L.; Lee, P.D. Child well-being: A systematic review of the literature. Soc. Indic. Res. 2003, 61, 59–78. [Google Scholar] [CrossRef]
- Waygood, E.O.D.; Friman, M.; Olsson, L.E.; Taniguchi, A. Transport and child well-being: An integrative review. Travel Behav. Soc. 2017, 9, 32–49. [Google Scholar] [CrossRef]
- McMillan, T.E. Urban form and a child’s trip to school: The current literature and a framework for future research. J. Plan. Lit. 2005, 19, 440–456. [Google Scholar] [CrossRef]
- Stark, J.; Meschik, M.; Singleton, P.A.; Schützhofer, B. Active school travel, attitudes and psychological well-being of children. Transp. Res. Part F Traff. Psychol. Behav. 2018, 56, 453–465. [Google Scholar] [CrossRef]
- Bolobonov, D.; Frolov, A.; Borremans, A.; Schuur, P. Managing public transport safety using digital technologies. Transp. Res. Procedia 2021, 54, 862–870. [Google Scholar] [CrossRef]
- Stoop, J.A.; Thissen, W.A. Transport safety: Trends and challenges from a systems perspective. Saf. Sci. 1997, 26, 107–120. [Google Scholar] [CrossRef]
- Fyhri, A.; Hjorthol, R. Children’s independent mobility to school, friends and leisure activities. J. Transp. Geogr. 2009, 17, 377–384. [Google Scholar] [CrossRef]
- National Statistical Office. Public Bus Accident; Department of Land Transport: Bangkok, Thailand, 2019. (In Thai) [Google Scholar]
- De Oña, J. Understanding the mediator role of satisfaction in public transport: A cross-country analysis. Transp. Policy 2021, 100, 129–149. [Google Scholar] [CrossRef]
- de Oña, J.; de Oña, R.; Eboli, L.; Forciniti, C.; Mazzulla, G. An ordered regression model to predict transit passengers’ behavioural intentions. Case Stud. Transp. Policy 2018, 6, 449–455. [Google Scholar] [CrossRef]
- Allen, J.; Eboli, L.; Forciniti, C.; Mazzulla, G.; de Dios Ortúzar, J. The role of critical incidents and involvement in transit satisfaction and loyalty. Transp. Policy 2019, 75, 57–69. [Google Scholar] [CrossRef]
- Westman, J.; Johansson, M.; Olsson, L.E.; Mårtensson, F.; Friman, M. Children’s affective experience of every-day travel. J. Transp. Geogr. 2013, 29, 95–102. [Google Scholar] [CrossRef]
- Hillman, C.H.; Pontifex, M.B.; Raine, L.B.; Castelli, D.M.; Hall, E.E.; Kramer, A.F. The effect of acute treadmill walking on cognitive control and academic achievement in preadolescent children. Neuroscience 2009, 159, 1044–1054. [Google Scholar] [CrossRef]
- Mitra, R. Independent mobility and mode choice for school transportation: A review and framework for future research. Transp. Rev. 2013, 33, 21–43. [Google Scholar] [CrossRef]
- Panter, J.R.; Jones, A.P.; van Sluijs, E.M.; Griffin, S.J. Attitudes, social support and environmental perceptions as predictors of active commuting behaviour in school children. J. Epidemiol. Community Health 2010, 64, 41–48. [Google Scholar] [CrossRef] [PubMed]
- Curtis, C.; Babb, C.; Olaru, D. Built environment and children’s travel to school. Transp. Policy 2015, 42, 21–33. [Google Scholar] [CrossRef]
- Qureshi, I.A.; Lu, H. Urban transport and sustainable transport strategies: A case study of Karachi, Pakistan. Tsinghua Sci. Technol. 2007, 12, 309–317. [Google Scholar] [CrossRef]
- Rezaei, P.; Aghabayk, K.; Bates, L. The effect of parenting styles on children’s risk perception on roads. Int. J. Transp. Eng. 2022, 9, 801–818. [Google Scholar] [CrossRef]
- van den Berg, P.; Waygood, E.O.D.; van de Craats, I.; Kemperman, A. Factors affecting parental safety perception, satisfaction with school travel and mood in primary school children in the Netherlands. J. Transp. Health 2020, 16, 100837. [Google Scholar] [CrossRef]
- Morton, C.; Caulfield, B.; Anable, J. Customer perceptions of quality of service in public transport: Evidence for bus transit in Scotland. Case Stud. Transp. Policy 2016, 4, 199–207. [Google Scholar] [CrossRef]
- Abenoza, R.F.; Cats, O.; Susilo, Y.O. Travel satisfaction with public transport: Determinants, user classes, regional disparities and their evolution. Transp. Res. Part A Policy Pract. 2017, 95, 64–84. [Google Scholar] [CrossRef]
- Choi, S.; Ko, J.; Kim, D. Investigating commuters’ satisfaction with public transit: A latent class modeling approach. Transp. Res. Part D Transp. Environ. 2021, 99, 103015. [Google Scholar] [CrossRef]
- de Oña, J.; de Oña, R.; Eboli, L.; Mazzulla, G. Perceived service quality in bus transit service: A structural equation approach. Transp. Policy 2013, 29, 219–226. [Google Scholar] [CrossRef]
- dell’Olio, L.; Ibeas, A.; Cecín, P. Modelling user perception of bus transit quality. Transp. Policy 2010, 17, 388–397. [Google Scholar] [CrossRef]
- Guirao, B.; García-Pastor, A.; López-Lambas, M.E. The importance of service quality attributes in public transportation: Narrowing the gap between scientific research and practitioners’ needs. Transp. Policy 2016, 49, 68–77. [Google Scholar] [CrossRef]
- Olowosegun, A.; Moyo, D.; Gopinath, D. Multicriteria evaluation of the quality of service of informal public transport: An empirical evidence from Ibadan, Nigeria. Case Stud. Transp. Policy 2021, 9, 1518–1530. [Google Scholar] [CrossRef]
- Westman, J.; Olsson, L.E.; Gärling, T.; Friman, M. Children’s travel to school: Satisfaction, current mood, and cognitive performance. Transportation 2017, 44, 1365–1382. [Google Scholar] [CrossRef]
- van Lierop, D.; El-Geneidy, A. Enjoying loyalty: The relationship between service quality, customer satisfaction, and behavioral intentions in public transit. Res. Transp. Econ. 2016, 59, 50–59. [Google Scholar] [CrossRef]
- Tao, D.; Zhang, R.; Qu, X. The role of personality traits and driving experience in self-reported risky driving behaviors and accident risk among Chinese drivers. Accid. Anal. Prev. 2017, 99, 228–235. [Google Scholar] [CrossRef] [PubMed]
- Allen, J.; Muñoz, J.C.; de Dios Ortúzar, J. On the effect of operational service attributes on transit satisfaction. Transportation 2020, 47, 2307–2336. [Google Scholar] [CrossRef]
- Nguyen-Phuoc, D.Q.; Phuong Tran, A.T.; Nguyen, T.V.; Le, P.T.; Su, D.N. Investigating the complexity of perceived service quality and perceived safety and security in building loyalty among bus passengers in Vietnam—A PLS-SEM approach. Transp. Policy 2021, 101, 162–173. [Google Scholar] [CrossRef]
- Tanglai, W.; Chen, C.-F.; Rattanapan, C.; Laosee, O. The Effects of Personality and Attitude on Risky Driving Behavior Among Public van Drivers: Hierarchical Modeling. Saf. Health Work 2022, 13, 187–191. [Google Scholar] [CrossRef]
- Susilo, Y.O.; Liu, C. The influence of parents’ travel patterns, perceptions and residential self-selectivity to their children travel mode shares. Transportation 2016, 43, 357–378. [Google Scholar] [CrossRef]
- Shokoohi, R.; Hanif, N.R.; Dali, M. Influence of the socio-economic factors on children’s school travel. Procedia-Soc. Behav. Sci 2012, 50, 135–147. [Google Scholar] [CrossRef]
- Kotoula, K.; Botzoris, G.; Morfoulaki, M.; Aifandopoulou, G. The existing school transportation framework in Greece–Barriers and problems comparing to other European countries. Transp. Res. Procedia 2017, 24, 385–392. [Google Scholar] [CrossRef]
- Loitz, C.C.; Spencer-Cavaliere, N. Exploring the Barriers and Facilitators to Children’s Active Transportation to and from School from the Perspectives of Practitioners. J. Phys. Act. Health 2013, 10, 1128–1135. [Google Scholar] [CrossRef] [PubMed]
- Mitra, R.; Buliung, R.N. The influence of neighborhood environment and household travel interactions on school travel behavior: An exploration using geographically-weighted models. J. Transp. Geogr. 2014, 36, 69–78. [Google Scholar] [CrossRef]
- Haustein, S.; Thorhauge, M.; Cherchi, E. Commuters’ attitudes and norms related to travel time and punctuality: A psychographic segmentation to reduce congestion. Travel Behav. Soc. 2018, 12, 41–50. [Google Scholar] [CrossRef]
- Yazdanpanah, M.; Hadji Hosseinlou, M. The role of personality traits through habit and intention on determining future preferences of public transport use. Behav. Sci. 2017, 7, 8. [Google Scholar] [CrossRef]
- Onwezen, M.C.; Antonides, G.; Bartels, J. The Norm Activation Model: An exploration of the functions of anticipated pride and guilt in pro-environmental behaviour. J. Econ. Psychol. 2013, 39, 141–153. [Google Scholar] [CrossRef]
- Chen, C.-F.; Chao, W.-H. Habitual or reasoned? Using the theory of planned behavior, technology acceptance model, and habit to examine switching intentions toward public transit. Transp. Res. Part F Traffic Psychol. Behav. 2011, 14, 128–137. [Google Scholar] [CrossRef]
- Kassirer, J. Changing Transportation Behaviours: A Social Marketing Planning Guide; Transport Canada: Ottawa, ON, Canada, 2010. [Google Scholar]
- Meloni, I.; Sanjust, B.; Sottile, E.; Cherchi, E. Propensity for voluntary travel behavior changes: An experimental analysis. Procedia-Soc. Behav. Sci 2013, 87, 31–43. [Google Scholar] [CrossRef]
- Zhang, K.; Zhou, K.; Zhang, F. Evaluating bus transit performance of Chinese cities: Developing an overall bus comfort model. Transp. Res. Part A Policy Pract. 2014, 69, 105–112. [Google Scholar] [CrossRef]
- Singh, N.; Vasudevan, V. Understanding school trip mode choice—The case of Kanpur (India). J. Transp. Geogr. 2018, 66, 283–290. [Google Scholar] [CrossRef]
- Motta, R.A.; Da Silva, P.C.M.; Santos, M.P.D.S. Crisis of public transport by bus in developing countries: A case study from Brazil. Int. J. Sustain. Dev. Plan. 2013, 8, 348–361. [Google Scholar] [CrossRef]
- Stevens, J.P. Applied Multivariate Statistics for the Social Sciences; Lawrence Erlbaum Associates: Mahwah, NJ, USA, 1996. [Google Scholar]
- Atombo, C.; Dzigbordi Wemegah, T. Indicators for commuter’s satisfaction and usage of high occupancy public bus transport service in Ghana. Transp. Res. Interdiscip. Perspect. 2021, 11, 100458. [Google Scholar] [CrossRef]
- Yao, D.; Xu, L.; Zhang, C.; Li, J. Revisiting the interactions between bus service quality, car ownership and mode use: A case study in Changzhou, China. Transp. Res. Part A Policy Pract. 2021, 154, 329–344. [Google Scholar] [CrossRef]
- Salam, S.; Muley, D.; Kharbeche, M. Assessment of School Bus Assistant’s Safety Perspective in the State of Qatar. Procedia Comput. Sci. 2022, 201, 142–149. [Google Scholar] [CrossRef]
- d’Ovidio, F.D.; Leogrande, D.; Mancarella, R.; Schinzano, A.; Viola, D. A Multivariate Analysis of the Quality of Public Transport Services. Procedia Econ. Financ 2014, 17, 238–247. [Google Scholar] [CrossRef]
- Agyeman, S.; Cheng, L. Analysis of barriers to perceived service quality in Ghana: Students’ perspectives on bus mobility attributes. Transp. Policy 2020, 99, 63–85. [Google Scholar] [CrossRef]
- Ahmed, A.; Parvez, M.R.; Hasan, M.H.; Nur, F.N.; Moon, N.N.; Karim, A.; Azam, S.; Shanmugam, B.; Jonkman, M. An intelligent and secured tracking system for monitoring school bus. In Proceedings of the 2019 International Conference on Computer Communication and Informatics (ICCCI), Coimbatore, India, 23–25 January 2019; pp. 1–5. [Google Scholar]
- Sakellariou, A.; Kotoula, K.; Morfoulaki, M.; Mintsis, G. Identification of quality indexes in school bus transportation system. Transp. Res. Procedia 2017, 24, 212–219. [Google Scholar] [CrossRef]
- Deepa, L.; Mondal, A.; Raman, A.; Pinjari, A.R.; Bhat, C.R.; Srinivasan, K.K.; Pendyala, R.M.; Ramadurai, G. An analysis of individuals’ usage of bus transit in Bengaluru, India: Disentangling the influence of unfamiliarity with transit from that of subjective perceptions of service quality. Travel Behav. Soc. 2022, 29, 1–11. [Google Scholar] [CrossRef]
- Ren, J.; Jin, W.; Wu, W. School Bus Stop Selection and Routing with Walking Accessibility. In Proceedings of the 19th COTA International Conference of Transportation Professionals, Nanjing, China, 6–8 July 2019; pp. 1458–1469. [Google Scholar]
- Taplin, J.H.; Sun, Y. Optimizing bus stop locations for walking access: Stops-first design of a feeder route to enhance a residential plan. Environ. Plan. B Urban Anal. City Sci. 2020, 47, 1237–1259. [Google Scholar] [CrossRef]
- Ikeda, E.; Mavoa, S.; Cavadino, A.; Carroll, P.; Hinckson, E.; Witten, K.; Smith, M. Keeping kids safe for active travel to school: A mixed method examination of school policies and practices and children’s school travel behaviour. Travel Behav. Soc. 2020, 21, 57–68. [Google Scholar] [CrossRef]
- Mindell, J.S.; Ergler, C.; Hopkins, D.; Mandic, S. Taking the bus? Barriers and facilitators for adolescent use of public buses to school. Travel Behav. Soc. 2021, 22, 48–58. [Google Scholar] [CrossRef] [PubMed]
- Bhatnagar, A.; Gupta, A.; Joshi, A.; Bolia, N. An integrated framework for the improvement of school bus services: Understanding commuters’ perceptions for sustainable school bus transportation. Habitat Int. 2022, 126, 102602. [Google Scholar] [CrossRef]
- Sukhov, A.; Lättman, K.; Olsson, L.E.; Friman, M.; Fujii, S. Assessing travel satisfaction in public transport: A configurational approach. Transp. Res. Part D Transp. Environ. 2021, 93, 102732. [Google Scholar] [CrossRef]
- Karimi, S.; Aghabayk, K.; Moridpour, S. Impact of driving style, behaviour and anger on crash involvement among Iranian intercity bus drivers. IATSS Res. 2022, 10. [Google Scholar] [CrossRef]
- Davey, J.; Wishart, D.; Freeman, J.; Watson, B. An application of the driver behaviour questionnaire in an Australian organisational fleet setting. Transp. Res. Part F Traff. Psychol. Behav. 2007, 10, 11–21. [Google Scholar] [CrossRef]
- Ammar, K.; Jalmoud, M.; Boushehri, A.; Fakhro, K. A real-time school bus tracking and monitoring system. In Proceedings of the 2019 IEEE 10th Annual Information Technology, Electronics and Mobile Communication Conference (IEMCON), Vancouver, BC, Canada, 17–19 October 2019; pp. 0654–0660. [Google Scholar]
- Valero-Mora, P.M.; Zacares, J.J.; Sánchez-García, M.; Tormo-Lancero, M.T.; Faus, M. Conspiracy beliefs are related to the use of smartphones behind the wheel. Int. J. Environ. Res. Public Health 2021, 18, 7725. [Google Scholar] [CrossRef]
- Chee, P.; Irwin, J.; Bennett, J.M.; Carrigan, A.J. The mere presence of a mobile phone: Does it influence driving performance? Accid. Anal. Prev. 2021, 159, 106226. [Google Scholar] [CrossRef]
- Chang, H.-L.; Yeh, C.-C. The life cycle of the policy for preventing road accidents: An empirical example of the policy for reducing drunk driving crashes in Taipei. Accid. Anal. Prev. 2004, 36, 809–818. [Google Scholar] [CrossRef]
- Varmazyar, S.; Mortazavi, S.B.; Hajizadeh, E.; Arghami, S. The relationship between driving aberrant behavior and self-reported accidents involvement amongst professional bus drivers in the public transportation company. Health Scope 2013, 2, 110–115. [Google Scholar] [CrossRef]
- Hendrix, J.A.; Kennedy, E.K. Supporting students on school buses: Results from a nationally representative sample of head transportation officials. Prev. Sch. Fail. Altern. Educ. Child. Youth 2020, 65, 79–88. [Google Scholar] [CrossRef]
- Huang, Y.-W.; Lin, P.-C.; Wang, J. The influence of bus and taxi drivers’ public self-consciousness and social anxiety on aberrant driving behaviors. Accid. Anal. Prev. 2018, 117, 145–153. [Google Scholar] [CrossRef] [PubMed]
- Jomnonkwao, S.; Ratanavaraha, V. Measurement modelling of the perceived service quality of a sightseeing bus service: An application of hierarchical confirmatory factor analysis. Transp. Policy 2016, 45, 240–252. [Google Scholar] [CrossRef]
- Davis, G.A.; Abulhassan, Y. Establishing the basis for a school bus emergency evacuation time standard. Transp. Res. Interdiscip. Perspect. 2021, 10, 100389. [Google Scholar] [CrossRef]
- Olympia, R.P.; Weber, C.; Brady, J.; Ho, S. Emergency and disaster preparedness of school transportation staff and school buses in the United States: Compliance with recommendations for school transportation safety. Pediatric Emerg. Care 2017, 33, 718–723. [Google Scholar] [CrossRef]
- Deb, S.; Ali Ahmed, M.; Das, D. Service quality estimation and improvement plan of bus Service: A perception and expectation based analysis. Case Stud. Transp. Policy 2022, 10, 1775–1789. [Google Scholar] [CrossRef]
- Velicer, W.; Fava, J. Effects of Variable and Subject Sampling on Factor Pattern Recovery. Psychol. Methods 1998, 3, 231–251. [Google Scholar] [CrossRef]
- Hair, J.F.; Black, W.C.; Babin, B.J.; Anderson, R.E. Multivariate Data Analysis; Pearson Education Limited: Hoboken, NJ, USA, 2013. [Google Scholar]
- Wheaton, B.; Muthén, B.; Alwin, D.F.; Summers, G.F. Assessing Reliability and Stability in Panel Models. Sociol. Methodol. 1977, 8, 84–136. [Google Scholar] [CrossRef]
- Hu, L.-t.; Bentler, P.M. Cutoff criteria for fit indexes in covariance structure analysis: Conventional criteria versus new alternatives. Struct. Equ. Model. 1999, 6, 1–55. [Google Scholar] [CrossRef]
- Hooper, D.; Coughlan, J.R.; Mullen, M. Structural Equation Modeling: Guidelines for Determining Model Fit. Electron. J. Bus. Res. Methods 2008, 6, 53–60. [Google Scholar] [CrossRef]
- Browne, M.W.; Cudeck, R. Alternative ways of assessing model fit. Sociol. Methods Res. 1992, 21, 230–258. [Google Scholar] [CrossRef]
- Steiger, J.H. Understanding the limitations of global fit assessment in structural equation modeling. Personal. Individ. Differ. 2007, 42, 893–898. [Google Scholar] [CrossRef]
- Byrne, B.M. Structural Equation Modeling with AMOS: Basic Concepts, Applications and Programming; Pearson Education Limited: Hoboken, NJ, USA, 2010; p. 396. [Google Scholar]
- Hair, J.F.; Black, W.C.; Babin, B.J.; Anderson, R.E. Multivariate Data Analysis: A Global Perspective: Pearson Education International; Pearson Education Limited: Hoboken, NJ, USA, 2010. [Google Scholar]
- Garson, D. Partial Least Squares: Regression and Path Modeling; Statistical Associates Publishing: Asheboro, NC, USA, 2012. [Google Scholar]
- Tabachnick, B.G.; Fidell, L.S. Using Multivariate Statistics; Allyn and Bacon: Boston, MA, USA, 2001. [Google Scholar]
- Allison, P.D. Multiple Regression: A Primer; Pine Forge Press: Thousand Oaks, CA, USA, 1999. [Google Scholar]
- Berry, W.D.; Feldman, S.; Stanley Feldman, D. Multiple Regression in Practice; Sage Publications Inc.: Thousand Oaks, CA, USA, 1985. [Google Scholar]
- Pallant, J.F. SPSS Survival Manual: A Step by Step Guide to Data Analysis Using IBM SPSS/Julie Pallant; McGraw Hill Education: New York, NY, USA, 2013. [Google Scholar]
- Tavakol, M.; Dennick, R. Making sense of Cronbach’s alpha. Int. J. Med. Educ. 2011, 2, 53–55. [Google Scholar] [CrossRef] [PubMed]
- Fornell, C.; Larcker, D.F. Structural Equation Models with Unobservable Variables and Measurement Error: Algebra and Statistics. J. Mark. Res. 1981, 18, 382–388. [Google Scholar] [CrossRef]


| Authors (Year) | Methodology | Perceived Service Quality | |||||
|---|---|---|---|---|---|---|---|
| Transportation | Infrastructure | Information | Safe Behavior of Driver | Safety of Transportation Systems | Safety Policy | ||
| dell’Olio, Ibeas and Cecín [45] | Ordered probit model | √ | √ | - | - | - | √ |
| de Oña, de Oña, Eboli and Mazzulla [44] | Structural equation modeling | √ | √ | √ | √ | - | - |
| Guirao, García-Pastor and López-Lambas [46] | Factorial analysis, multiple regression analysis, and multiple indicators multiple causes (MIMIC) models | √ | - | √ | - | - | - |
| Morton, Caulfield and Anable [41] | Confirmatory factor analysis | √ | √ | √ | - | - | √ |
| van Lierop and El-Geneidy [49] | Structural equation modeling | - | - | √ | √ | √ | √ |
| Abenoza, Cats and Susilo [42] | Logistic regression analysis | √ | √ | √ | √ | √ | |
| Westman, Olsson, Gärling and Friman [48] | Multivariate analyses of variance (MANOVAs) and analyses of variance (ANOVAs) | √ | - | - | - | - | - |
| Tao, Zhang and Qu [50] | Structural equation modeling | - | - | - | √ | - | - |
| Allen, Muñoz and de Dios Ortúzar [51] | Structural equation modeling and MIMIC models | - | √ | - | √ | - | - |
| Choi, Ko and Kim [43] | Ordered probit model | - | - | - | - | - | √ |
| Nguyen-Phuoc, Phuong Tran, Nguyen, Le and Su [52] | Partial least square and structural equation modeling | - | - | - | √ | √ | √ |
| Olowosegun, Moyo and Gopinath [47] | Multi criteria-based approach | √ | √ | - | √ | - | √ |
| Tanglai, Chen, Rattanapan and Laosee [53] | Hierarchical regression model | - | - | - | √ | - | - |
| Category | Detail | Frequency | Valid Percent |
|---|---|---|---|
| Sex (Parent) | Male | 337 | 44.90 |
| Female | 413 | 55.10 | |
| Marital status (Parent) | Single | 27 | 3.60 |
| Married | 540 | 72.00 | |
| Other | 183 | 24.40 | |
| Education (Parent) | Primary school | 95 | 12.70 |
| Secondary school | 179 | 23.90 | |
| High school | 245 | 32.70 | |
| Diploma/High vocational certificate | 128 | 17.10 | |
| Bachelor’s degree and above | 100 | 13.30 | |
| Other | 3 | 0.4 | |
| Profession (Parent) | Government/state enterprise | 68 | 9.10 |
| Private company | 152 | 20.30 | |
| Own business/trade | 166 | 22.10 | |
| Farmer | 57 | 7.60 | |
| General employee | 280 | 37.30 | |
| Butler/housekeeper | 18 | 2.40 | |
| Other | 9 | 1.20 | |
| Own vehicle (Parent) | None | 69 | 9.20 |
| Motorcycle | 357 | 47.60 | |
| Personal car | 177 | 23.60 | |
| Other | 147 | 19.60 | |
| Driving license (Parent) | None | 148 | 19.70 |
| Personal car | 505 | 67.30 | |
| Motorcycle | 22 | 2.90 | |
| Car and motorcycle | 75 | 10.00 | |
| Sex (Child) | Male | 368 | 49.10 |
| Female | 382 | 50.90 | |
| Education (Child) | Primary school | 395 | 52.70 |
| Secondary school | 222 | 29.60 | |
| High school | 133 | 17.70 | |
| Transport mode (Child) | Personal car | 113 | 15.10 |
| Motorcycle | 302 | 40.30 | |
| School bus | 78 | 10.40 | |
| Public bus | 215 | 28.70 | |
| Other | 42 | 5.60 | |
| Male | 368 | 49.10 |
| Code | Variables | References |
|---|---|---|
| Trans | Transportation | |
| S1 | There are services or facilities to use public transport to travel to school. | [20,69,70] |
| S2 | There is a regular public transport service that connects to the school. | [20,69,70] |
| S3 | In the area, various types of public transport can be selected for commuting to school (e.g., school buses, vans, and public buses). | [20,69,70,71] |
| S4 | Traveling by public transportation to school is convenient and fast. | [20,70,72] |
| S5 | Traveling by public transportation to school follows the planned time. | [70,73,74,75] |
| S6 | Traveling by public transport to school gives freedom and flexibility to plan. | [20,70,76] |
| Infra | Infrastructure | |
| S7 | You can easily access public transport. | [20,70] |
| S8 | There are signs clearly indicating the entry points to public transport services for users. | [77,78] |
| S9 | Public transport has a clear route for service. | [77,78] |
| S10 | Public transport has a clear schedule. | [72,77,78] |
| S11 | Public transport terminals are clean and well-equipped (with roof, lighting, and adequate seating). | [17,20,75,79,80] |
| S12 | The school has sufficient public transport stops. | [69,81] |
| Inform | Information | |
| S13 | There is an information center to provide accurate and clear answers to questions about public transport to school. | [20,70,82] |
| S14 | There is information about traveling to school by public transport and service points, and the routes are clear and easy to understand. | [20,69,70,72,82] |
| S15 | There is an application to recommend the use of transportation systems, presenting accurate and up-to-date information that can respond to travel planning. | [72,82] |
| Safety1 | Safe behavior of drivers | |
| S16 | Public transport drivers observe speeds appropriate to the route and the environment without risk. | [14,83,84,85] |
| S17 | Public transport drivers do not use phones or other communication devices while driving. | [85,86,87] |
| S18 | Public transport drivers do not smoke, use intoxicants, or any narcotics while driving. | [18,19,88] |
| S19 | Public transport drivers do not suddenly change lanes. | [83,89,90] |
| Safety2 | Safety of transportation systems | |
| S20 | Public transport always uses the left lane to pick up passengers. | [14,91] |
| S21 | Public transportation stops at a safe spot. When parking on the road and picking up passengers, drivers always park on the left side. | [14,91] |
| S22 | Public transport drivers do not drive off the road, except for emergencies or necessities. | [85,90] |
| Safety3 | Safety policy | |
| S23 | The staff check that the students are orderly (sitting or getting out of the car) before leaving the car. | [71,72,73,90] |
| S24 | Public transport has equipment to prevent accidents, such as falling from the car. | [18,92,93,94] |
| S25 | When traveling to school by public transportation, you can secure your belongings from theft. | [20,69,70,72] |
| S26 | Traveling to school by public transport is safe from accidents. | [20,69,82,95] |
| Model Fit Index | Cutoff Value | References |
|---|---|---|
| Chi-square/degree of freedom | <5 | Wheaton, Muthén, Alwin and Summers [98] |
| Standardized root mean square residual (SRMR) | ≤0.08 | Hu and Bentler [99] |
| Root mean square of approximation (RMSEA) | ≤0.07 | Steiger [102] |
| Comparative fit index (CFI) | ≥0.90 | Hu and Bentler [99] |
| Tucker–Lewis index (TLI) | ≥0.80 | Hooper, Coughlan and R. Mullen [100] |
| Code | Variable | Mean | SD | Skewness | Kurtosis |
|---|---|---|---|---|---|
| Trans | Transportation | ||||
| S1 | There are services or facilities to use public transport to travel to school. | 2.83 | 1.15 | −0.01 | −0.76 |
| S2 | There is a regular public transport service that connects to the school. | 2.89 | 1.18 | 0.00 | −0.81 |
| S3 | In the area, various types of public transport can be selected for commuting to school (e.g., school buses, vans, and public buses). | 2.80 | 1.22 | 0.11 | −0.93 |
| S4 | Traveling by public transportation to school is convenient and fast. | 2.86 | 1.16 | 0.02 | −0.71 |
| S5 | Traveling by public transportation to school follows the planned time. | 2.92 | 1.16 | −0.07 | −0.75 |
| S6 | Traveling by public transport to school gives freedom and flexibility to plan. | 2.85 | 1.15 | 0.06 | −0.73 |
| Infra | Infrastructure | ||||
| S7 | You can easily access public transport. | 2.96 | 1.17 | −0.08 | −0.75 |
| S8 | There are signs clearly indicating the entry points to public transport services for users. | 2.92 | 1.13 | −0.03 | −0.67 |
| S9 | Public transport has a clear route for service. | 3.05 | 1.16 | −0.20 | −0.68 |
| S10 | Public transport has a clear schedule. | 2.87 | 1.13 | −0.03 | −0.71 |
| S11 | Public transport terminals are clean and well-equipped (with a roof, lighting, and adequate seating). | 2.87 | 1.11 | −0.01 | −0.56 |
| S12 | The school has sufficient public transport stops. | 2.96 | 1.11 | −0.10 | −0.63 |
| Inform | Information | ||||
| S13 | There is an information center to provide accurate and clear answers to questions about public transport to school. | 2.73 | 1.11 | 0.13 | −0.57 |
| S14 | There is information about traveling to school by public transport and service points, and the routes are clear and easy to understand. | 2.75 | 1.12 | 0.13 | −0.58 |
| S15 | There is an application to recommend the use of transportation systems, presenting accurate and up-to-date information that can respond to travel planning. | 2.67 | 1.16 | 0.10 | −0.78 |
| Safety1 | Safe behavior of drivers | ||||
| S16 | Public transport drivers observe speeds appropriate to the route and the environment without risk. | 3.00 | 1.09 | −0.09 | −0.48 |
| S17 | Public transport drivers do not use phones or other communication devices while driving. | 3.09 | 1.12 | −0.27 | −0.53 |
| S18 | Public transport drivers do not smoke, use intoxicants, or any narcotics while driving. | 3.11 | 1.16 | −0.23 | −0.73 |
| S19 | Public transport drivers do not suddenly change lanes. | 3.10 | 1.11 | −0.33 | −0.56 |
| Safety2 | Safety of transportation systems | ||||
| S20 | Public transport always uses the left lane to pick up passengers. | 3.10 | 1.10 | −0.16 | −0.59 |
| S21 | Public transportation stops at a safe spot. When parking on the road and picking up passengers, drivers always park on the left side. | 3.12 | 1.13 | −0.27 | −0.67 |
| S22 | Public transport drivers do not drive off the road, except for emergencies or necessities. | 3.12 | 1.17 | −0.23 | −0.79 |
| Safety3 | Safety policy | ||||
| S23 | The staff check that the students are orderly (sitting or getting out of the car) before leaving the car. | 2.99 | 1.09 | −0.16 | −0.60 |
| S24 | Public transport has equipment to prevent accidents, such as falling from the car. | 2.95 | 1.11 | −0.13 | −0.69 |
| S25 | When traveling to school by public transportation, you can secure your belongings from theft. | 3.05 | 1.14 | −0.28 | −0.67 |
| S26 | Traveling to school by public transport is safe from accidents. | 3.04 | 1.19 | −0.23 | −0.80 |
| S1 | S2 | S3 | S4 | S5 | S6 | S7 | S8 | S9 | S10 | S11 | S12 | S13 | S14 | S15 | S16 | S17 | S18 | S19 | S20 | S21 | S22 | S23 | S24 | S25 | S26 | |
| S1 | 1.00 | |||||||||||||||||||||||||
| S2 | 0.63 | 1.00 | ||||||||||||||||||||||||
| S3 | 0.68 | 0.67 | 1.00 | |||||||||||||||||||||||
| S4 | 0.56 | 0.56 | 0.64 | 1.00 | ||||||||||||||||||||||
| S5 | 0.59 | 0.56 | 0.58 | 0.60 | 1.00 | |||||||||||||||||||||
| S6 | 0.52 | 0.55 | 0.63 | 0.60 | 0.59 | 1.00 | ||||||||||||||||||||
| S7 | 0.50 | 0.52 | 0.46 | 0.54 | 0.52 | 0.49 | 1.00 | |||||||||||||||||||
| S8 | 0.54 | 0.51 | 0.50 | 0.56 | 0.50 | 0.46 | 0.63 | 1.00 | ||||||||||||||||||
| S9 | 0.46 | 0.47 | 0.42 | 0.50 | 0.49 | 0.44 | 0.66 | 0.59 | 1.00 | |||||||||||||||||
| S10 | 0.45 | 0.43 | 0.39 | 0.46 | 0.45 | 0.49 | 0.55 | 0.58 | 0.62 | 1.00 | ||||||||||||||||
| S11 | 0.48 | 0.51 | 0.50 | 0.51 | 0.55 | 0.52 | 0.52 | 0.54 | 0.53 | 0.56 | 1.00 | |||||||||||||||
| S12 | 0.45 | 0.47 | 0.42 | 0.50 | 0.52 | 0.47 | 0.56 | 0.56 | 0.57 | 0.57 | 0.60 | 1.00 | ||||||||||||||
| S13 | 0.49 | 0.43 | 0.48 | 0.48 | 0.49 | 0.55 | 0.49 | 0.49 | 0.40 | 0.47 | 0.54 | 0.51 | 1.00 | |||||||||||||
| S14 | 0.47 | 0.49 | 0.49 | 0.50 | 0.52 | 0.50 | 0.49 | 0.53 | 0.44 | 0.52 | 0.55 | 0.53 | 0.66 | 1.00 | ||||||||||||
| S15 | 0.47 | 0.40 | 0.52 | 0.50 | 0.49 | 0.53 | 0.41 | 0.47 | 0.34 | 0.44 | 0.48 | 0.45 | 0.66 | 0.64 | 1.00 | |||||||||||
| S16 | 0.36 | 0.36 | 0.37 | 0.43 | 0.36 | 0.37 | 0.47 | 0.44 | 0.42 | 0.35 | 0.39 | 0.39 | 0.42 | 0.45 | 0.39 | 1.00 | ||||||||||
| S17 | 0.32 | 0.34 | 0.30 | 0.39 | 0.38 | 0.31 | 0.47 | 0.44 | 0.46 | 0.36 | 0.37 | 0.36 | 0.35 | 0.37 | 0.32 | 0.48 | 1.00 | |||||||||
| S18 | 0.33 | 0.33 | 0.33 | 0.43 | 0.38 | 0.35 | 0.49 | 0.42 | 0.49 | 0.38 | 0.39 | 0.43 | 0.34 | 0.39 | 0.32 | 0.49 | 0.67 | 1.00 | ||||||||
| S19 | 0.31 | 0.34 | 0.31 | 0.42 | 0.40 | 0.37 | 0.46 | 0.43 | 0.41 | 0.39 | 0.44 | 0.39 | 0.35 | 0.39 | 0.33 | 0.44 | 0.46 | 0.50 | 1.00 | |||||||
| S20 | 0.33 | 0.28 | 0.32 | 0.38 | 0.36 | 0.35 | 0.44 | 0.39 | 0.42 | 0.38 | 0.36 | 0.35 | 0.41 | 0.35 | 0.35 | 0.63 | 0.43 | 0.42 | 0.43 | 1.00 | ||||||
| S21 | 0.32 | 0.30 | 0.30 | 0.45 | 0.36 | 0.34 | 0.41 | 0.37 | 0.39 | 0.41 | 0.31 | 0.32 | 0.32 | 0.35 | 0.32 | 0.60 | 0.39 | 0.45 | 0.46 | 0.64 | 1.00 | |||||
| S22 | 0.35 | 0.33 | 0.29 | 0.36 | 0.35 | 0.31 | 0.52 | 0.42 | 0.51 | 0.38 | 0.36 | 0.45 | 0.35 | 0.35 | 0.28 | 0.43 | 0.63 | 0.62 | 0.41 | 0.45 | 0.50 | 1.00 | ||||
| S23 | 0.32 | 0.24 | 0.31 | 0.41 | 0.36 | 0.34 | 0.40 | 0.41 | 0.42 | 0.35 | 0.37 | 0.35 | 0.34 | 0.37 | 0.34 | 0.62 | 0.41 | 0.47 | 0.46 | 0.57 | 0.67 | 0.48 | 1.00 | |||
| S24 | 0.32 | 0.32 | 0.28 | 0.40 | 0.38 | 0.36 | 0.42 | 0.42 | 0.47 | 0.44 | 0.44 | 0.40 | 0.32 | 0.38 | 0.27 | 0.35 | 0.37 | 0.43 | 0.60 | 0.42 | 0.48 | 0.49 | 0.46 | 1.00 | ||
| S25 | 0.35 | 0.33 | 0.32 | 0.42 | 0.41 | 0.38 | 0.52 | 0.47 | 0.49 | 0.47 | 0.46 | 0.46 | 0.36 | 0.39 | 0.28 | 0.45 | 0.46 | 0.47 | 0.66 | 0.49 | 0.52 | 0.54 | 0.55 | 0.69 | 1.00 | |
| S26 | 0.39 | 0.41 | 0.42 | 0.49 | 0.44 | 0.43 | 0.54 | 0.47 | 0.53 | 0.46 | 0.48 | 0.49 | 0.42 | 0.45 | 0.35 | 0.44 | 0.45 | 0.52 | 0.58 | 0.40 | 0.47 | 0.50 | 0.44 | 0.61 | 0.66 | 1.00 |
| Code | Component | |||||
|---|---|---|---|---|---|---|
| 1 | 2 | 3 | 4 | 5 | 6 | |
| S3 | 0.816 | |||||
| S2 | 0.724 | |||||
| S1 | 0.722 | |||||
| S4 | 0.660 | |||||
| S6 | 0.633 | |||||
| S5 | 0.627 | |||||
| S10 | 0.708 | |||||
| S9 | 0.693 | |||||
| S12 | 0.593 | |||||
| S8 | 0.591 | |||||
| S7 | 0.567 | |||||
| S11 | 0.459 | |||||
| S17 | 0.759 | |||||
| S18 | 0.748 | |||||
| S19 | 0.717 | |||||
| S16 | 0.698 | |||||
| S24 | 0.765 | |||||
| S25 | 0.739 | |||||
| S23 | 0.716 | |||||
| S26 | 0.642 | |||||
| S15 | 0.734 | |||||
| S13 | 0.709 | |||||
| S14 | 0.631 | |||||
| S20 | 0.795 | |||||
| S21 | 0.731 | |||||
| S22 | 0.644 | |||||
| Eigenvalue | 14.565 | 2.444 | 1.391 | 1.145 | 1.099 | 1.004 |
| % of variance | 45.517 | 7.639 | 4.348 | 3.578 | 3.433 | 3.137 |
| Cumulative % | 45.517 | 53.155 | 57.504 | 61.082 | 64.515 | 67.652 |
| Parameters | Value | |
|---|---|---|
| Kaiser–Meyer–Olkin Measure of Sampling Adequacy | 0.963 | |
| Bartlett’s Test of Sphericity: | Approx. Chi-Square | 17437.927 |
| df | 561 | |
| Sig. | <0.001 | |
| Factors/Indicators | Items | Cronbach’s Alpha | Min. | Max. | Mean | SD | SK | KU |
|---|---|---|---|---|---|---|---|---|
| PSQ | 26 | 0.955 | ||||||
| Transportation | 6 | 0.899 | 1 | 5 | 2.86 | 1.17 | 0.02 | −0.79 |
| Infrastructure | 6 | 0.891 | 1 | 5 | 2.94 | 1.14 | −0.07 | −0.68 |
| Information | 3 | 0.851 | 1 | 5 | 2.72 | 1.13 | 0.11 | −0.65 |
| Safety behavior of drivers | 4 | 0.867 | 1 | 5 | 3.08 | 1.12 | −0.22 | −0.66 |
| Safety of transportation systems | 3 | 0.843 | 1 | 5 | 3.11 | 1.14 | −0.22 | −0.69 |
| Safety policy | 4 | 0.881 | 1 | 5 | 3.01 | 1.13 | −0.2 | −0.7 |
| Factor | Code | Beta | p-Value | CR | AVE |
|---|---|---|---|---|---|
| Transportation | S1 | 0.763 | <0.001 | 0.897 | 0.592 |
| S2 | 0.746 | <0.001 | |||
| S3 | 0.784 | <0.001 | |||
| S4 | 0.780 | <0.001 | |||
| S5 | 0.777 | <0.001 | |||
| S6 | 0.767 | <0.001 | |||
| Infrastructure | S7 | 0.781 | <0.001 | 0.888 | 0.570 |
| S8 | 0.771 | <0.001 | |||
| S9 | 0.728 | <0.001 | |||
| S10 | 0.734 | <0.001 | |||
| S11 | 0.763 | <0.001 | |||
| S12 | 0.750 | <0.001 | |||
| Information | S13 | 0.817 | <0.001 | 0.849 | 0.652 |
| S14 | 0.829 | <0.001 | |||
| S15 | 0.776 | <0.001 | |||
| Safety1: Safe behavior of drivers | S16 | 0.772 | <0.001 | 0.875 | 0.636 |
| S17 | 0.796 | <0.001 | |||
| S18 | 0.804 | <0.001 | |||
| S19 | 0.818 | <0.001 | |||
| Safety2: Safety of the transportation systems | S20 | 0.795 | <0.001 | 0.844 | 0.644 |
| S21 | 0.816 | <0.001 | |||
| S22 | 0.796 | <0.001 | |||
| Safety3: Safety policy | S23 | 0.813 | <0.001 | 0.883 | 0.654 |
| S24 | 0.774 | <0.001 | |||
| S25 | 0.861 | <0.001 | |||
| S26 | 0.783 | <0.001 |
| Model | df | p | AIC | CFI | TLI | RMSEA | SRMR | CR | ||
|---|---|---|---|---|---|---|---|---|---|---|
| Third-Order CFA | 758.098 | 276 | <0.001 | 2.747 | 48285.639 | 0.962 | 0.955 | 0.048 | 0.038 | 0.977 |
Publisher’s Note: MDPI stays neutral with regard to jurisdictional claims in published maps and institutional affiliations. |
© 2022 by the authors. Licensee MDPI, Basel, Switzerland. This article is an open access article distributed under the terms and conditions of the Creative Commons Attribution (CC BY) license (https://creativecommons.org/licenses/by/4.0/).
Share and Cite
Jomnonkwao, S.; Banyong, C.; Nanthawong, S.; Janhuaton, T.; Ratanavaraha, V.; Champahom, T.; Jongkol, P. Perceptions of Parents of the Quality of the Public Transport Services Used by Children to Commute to School. Sustainability 2022, 14, 13005. https://doi.org/10.3390/su142013005
Jomnonkwao S, Banyong C, Nanthawong S, Janhuaton T, Ratanavaraha V, Champahom T, Jongkol P. Perceptions of Parents of the Quality of the Public Transport Services Used by Children to Commute to School. Sustainability. 2022; 14(20):13005. https://doi.org/10.3390/su142013005
Chicago/Turabian StyleJomnonkwao, Sajjakaj, Chinnakrit Banyong, Supanida Nanthawong, Thananya Janhuaton, Vatanavongs Ratanavaraha, Thanapong Champahom, and Pornsiri Jongkol. 2022. "Perceptions of Parents of the Quality of the Public Transport Services Used by Children to Commute to School" Sustainability 14, no. 20: 13005. https://doi.org/10.3390/su142013005
APA StyleJomnonkwao, S., Banyong, C., Nanthawong, S., Janhuaton, T., Ratanavaraha, V., Champahom, T., & Jongkol, P. (2022). Perceptions of Parents of the Quality of the Public Transport Services Used by Children to Commute to School. Sustainability, 14(20), 13005. https://doi.org/10.3390/su142013005