1. Introduction
The pharmaceutical manufacturing industry is not only a high-tech industry with huge market potential, but it is an important part of the health industry, which affects the national economy, people’s livelihoods, and the realization of regional sustainable development [
1,
2]. In 2020, the Chinese pharmaceutical manufacturing industry achieved a revenue of 250.54 million CNY, and its total investment increased by 28.4%, making it an increasingly important position in the regional and national economy. Innovation is the core driving force for the sustained growth of the pharmaceutical manufacturing industry, and innovation plays an irreplaceable and important role in the development of the pharmaceutical manufacturing industry [
3,
4]. Innovation efficiency reflects the level of industrial innovation and is an important indicator to measure the degree of industrial innovation and development [
5,
6,
7]. Scientific measurement of the innovation efficiency of the pharmaceutical manufacturing industry is crucial for grasping the current situation and problems of the innovation and development of the industry, understanding the innovation and development trends of the industry, and promoting the sustainable and high-quality development of the pharmaceutical manufacturing industry.
As an important indicator for measuring the level of innovation development, innovation efficiency has always attracted the attention of scholars [
8,
9]. The existing research on innovation efficiency were sorted out, and the literature was reviewed from the perspectives of research objects and research approaches and methods.
In terms of research objectives, the research on innovation efficiency includes the industry level, the enterprise level, and the regional level. The research on enterprise innovation efficiency mostly analyzes the influence of enterprise innovation behavior, innovation driving force, innovation strategy, and other factors on innovation efficiency from a microperspective [
10,
11,
12,
13]. The research on regional innovation efficiency mainly focuses on the comparison of innovation efficiency levels among different regions and the reasons for the differences in efficiency [
14,
15,
16]. Research at the industry level not only studies the differences in innovation efficiency between different industries, but also analyzes the innovation efficiency of a specific industry [
17,
18,
19]. Most studies on specific industries choose high-tech industries or their sub-sectors as research objects. Ye and Liu measured and decomposed the efficiency of the high-tech industries of different provinces of China [
20]. Liu and Zhang [
21] compared the innovation efficiency of Chinese high-tech industries by the form of ownership. Chen and Meng [
22] studied the trend of the innovation efficiency in China’s high-tech industry during 2000–2011. Liu et al. [
23] explored the influence of the industrial development environment on the innovation efficiency of the high-tech industry. Most studies have found that China’s high-tech industries have low innovation efficiency and large regional differences [
24,
25]. Few studies focus on the innovation efficiency of the pharmaceutical industry. Liu [
26] reported innovation inefficiency in the Chinese pharmaceutical industry by applying a dynamic network DEA. Shi [
27] focused on the effect of agglomeration on the innovation efficiency of Chinese pharmaceutical manufacturing industry. Lai [
28] studied the innovation efficiency of the pharmaceutical manufacturing industry and its impact on regional industrial competitiveness.
Regarding research approaches, early scholars regarded innovation efficiency as the ratio of a single input to a single output and could not deal with the problem of multiple inputs or outputs [
18]. Recent research views innovation as a complex process with multiple inputs and outputs [
29,
30]. Some studies divide the innovation process into two interdependent stages [
26,
31]. In terms of research methods, the data envelopment method (DEA) or the stochastic frontier method (SFA) are often used to evaluate the efficiency of industrial innovation [
32,
33]. Compared with the DEA model, the SFA model has more restrictions in the choice of production function, the degree of compliance with the basic assumptions, and the amount of data. Some scholars use the SFA model to study the innovation efficiency of specific regions and specific industries and its related factors [
34,
35]. DEA is a nonparametric method that can determine the relative efficiency of decision-making units without determining the production function, and is more widely used [
36,
37]. Kocher et al. [
38] used DEA to analyze and compare the productivity of economic research in 21 OECD countries. To measure the innovation efficiency of high-tech industries in different provinces in China from 1999 to 2018, Chen et al. [
39] adopted a two-stage network data envelopment analysis (DEA) with shared inputs. Klevenhusen et al. [
40] combined DEA with regression analysis to assess the contribution of international trade to innovation efficiency in OECD member countries. Using a two-stage meta-frontier dynamic network DEA model, Feng et al. [
41] explored the innovation efficiency in 57 countries from 2013 to 2017. Based on the SBM-DEA model considering energy consumption and environmental pollution, Liang and Xu [
42] analyzed sustainable innovation efficiency and its convergence at the regional level.
As the literature review suggests, few studies on industrial innovation efficiency involve pharmaceutical manufacturing, and fewer studies analyze it from the perspective of the innovation ecosystem. In order to reflect the new innovation paradigm and the innovation characteristics of the pharmaceutical industry, analyze the efficiency of different innovation stages, and compare the differences between regions, this paper analyzes the innovation efficiency of Chinses pharmaceutical manufacturing industry from the perspective of an innovation ecosystem.
The innovations of this study are reflected in the following two aspects: First, most existing studies on the innovation efficiency of China’s pharmaceutical manufacturing industry regard the innovation as a single process or two-stage processes, including technology innovation-commercialization. Basing on the perspective of innovation ecosystem, this research divided the innovation process of the pharmaceutical industry into three stages connected end to end, providing a new perspective for related research. Secondly, using the latest year data to measure the innovation data of the pharmaceutical industry in 26 provinces in China from 2009 to 2020, and using the DEA-Malmquist index to conduct a comprehensive survey and calculation from the two dimensions of time and space, which has good practical significance.
The remainder of the paper is organized as follows:
Section 2 describes the status quo of the development and innovation of the Chinese pharmaceutical industry and the theoretical framework of the pharmaceutical industrial innovation ecosystem.
Section 3 specifies the methodology, index system, and data. In
Section 4, the results of the efficiency of each state are shown, and a discussion is conducted.
Section 5 concludes the study with policy implications, as well as the limitations and prospects of the research.
2. Status of the Pharmaceutical Industry and Theoretical Model
2.1. The Development and Innovation Status of Chinese Pharmaceutical Industry
In recent years, the number of Chinese pharmaceutical manufacturing enterprises has increased rapidly, the industrial operating revenue and profit have increased significantly, and the pharmaceutical manufacturing industry has achieved rapid development. According to data from China High-tech Industry Statistical Yearbook 2021, in 2020, there were 8170 pharmaceutical manufacturing enterprises above the designated size in China, including 1563 large and medium-sized enterprises. From the perspective of industry classification, there are 2473 manufactures of chemical medicine, 1540 manufactures of finished traditional Chinese herbal medicine, and 909 manufactures of biopharmaceutical products. From the perspective of the operating income and profit, in 2020, the operating income of China’s pharmaceutical manufacturing industry reached 2.51 trillion CNY, and the total profit was 369.3 billion CNY, becoming the second largest industry in the high-tech industry of China after the electronics and communication equipment manufacturing industry.
Focusing on the innovation and development status of China’s pharmaceutical manufacturing industry, from the perspective of new product data, the investment in new product development in China’s pharmaceutical manufacturing industry is rising, reaching 88.32 billion CNY in 2020. The number of new product development projects has increased steadily, reaching 42 and 145, and sales revenue from new products continued to rise, reaching 769.81 billion CNY in 2020. The innovation and development of China’s pharmaceutical manufacturing industry has shown a good momentum, but the gap between regions in the innovation and development is large. The development and innovation of medicine in each region is shown in
Table 1.
2.2. Innovation Process Model of Pharmaceutical Industry
Innovation efficiency is defined as the ability to transform innovation investments into products and profits [
43,
44]. Innovation ecosystems are the intersection of ecology and innovation management. Granstrand and Holgersson [
45] defined innovation ecosystem as an evolving collection that includes actors, activities, human elements, and associated institutions and relationships. More and more scholars combine ecological theory with innovation system to carry out research on innovation efficiency [
46,
47].
Innovation in the pharmaceutical industry is characterized by high investment, high risk, and long cycle [
3]. The pharmaceutical industry has a high entry barrier and requires a lot of R and D investment to support innovation, but the innovation success rate is low and the risk is high. Innovation in the pharmaceutical industry has a closed R and D cycle with an obvious sequential relationship, and later R and D is strongly dependent on earlier results. China’s pharmaceutical manufacturing industry is striving to transform from a single imitation innovation, digestion, and absorption innovation to an integrated innovation and original innovation [
28], so it is necessary to think about innovation from the perspective of the innovation ecosystem.
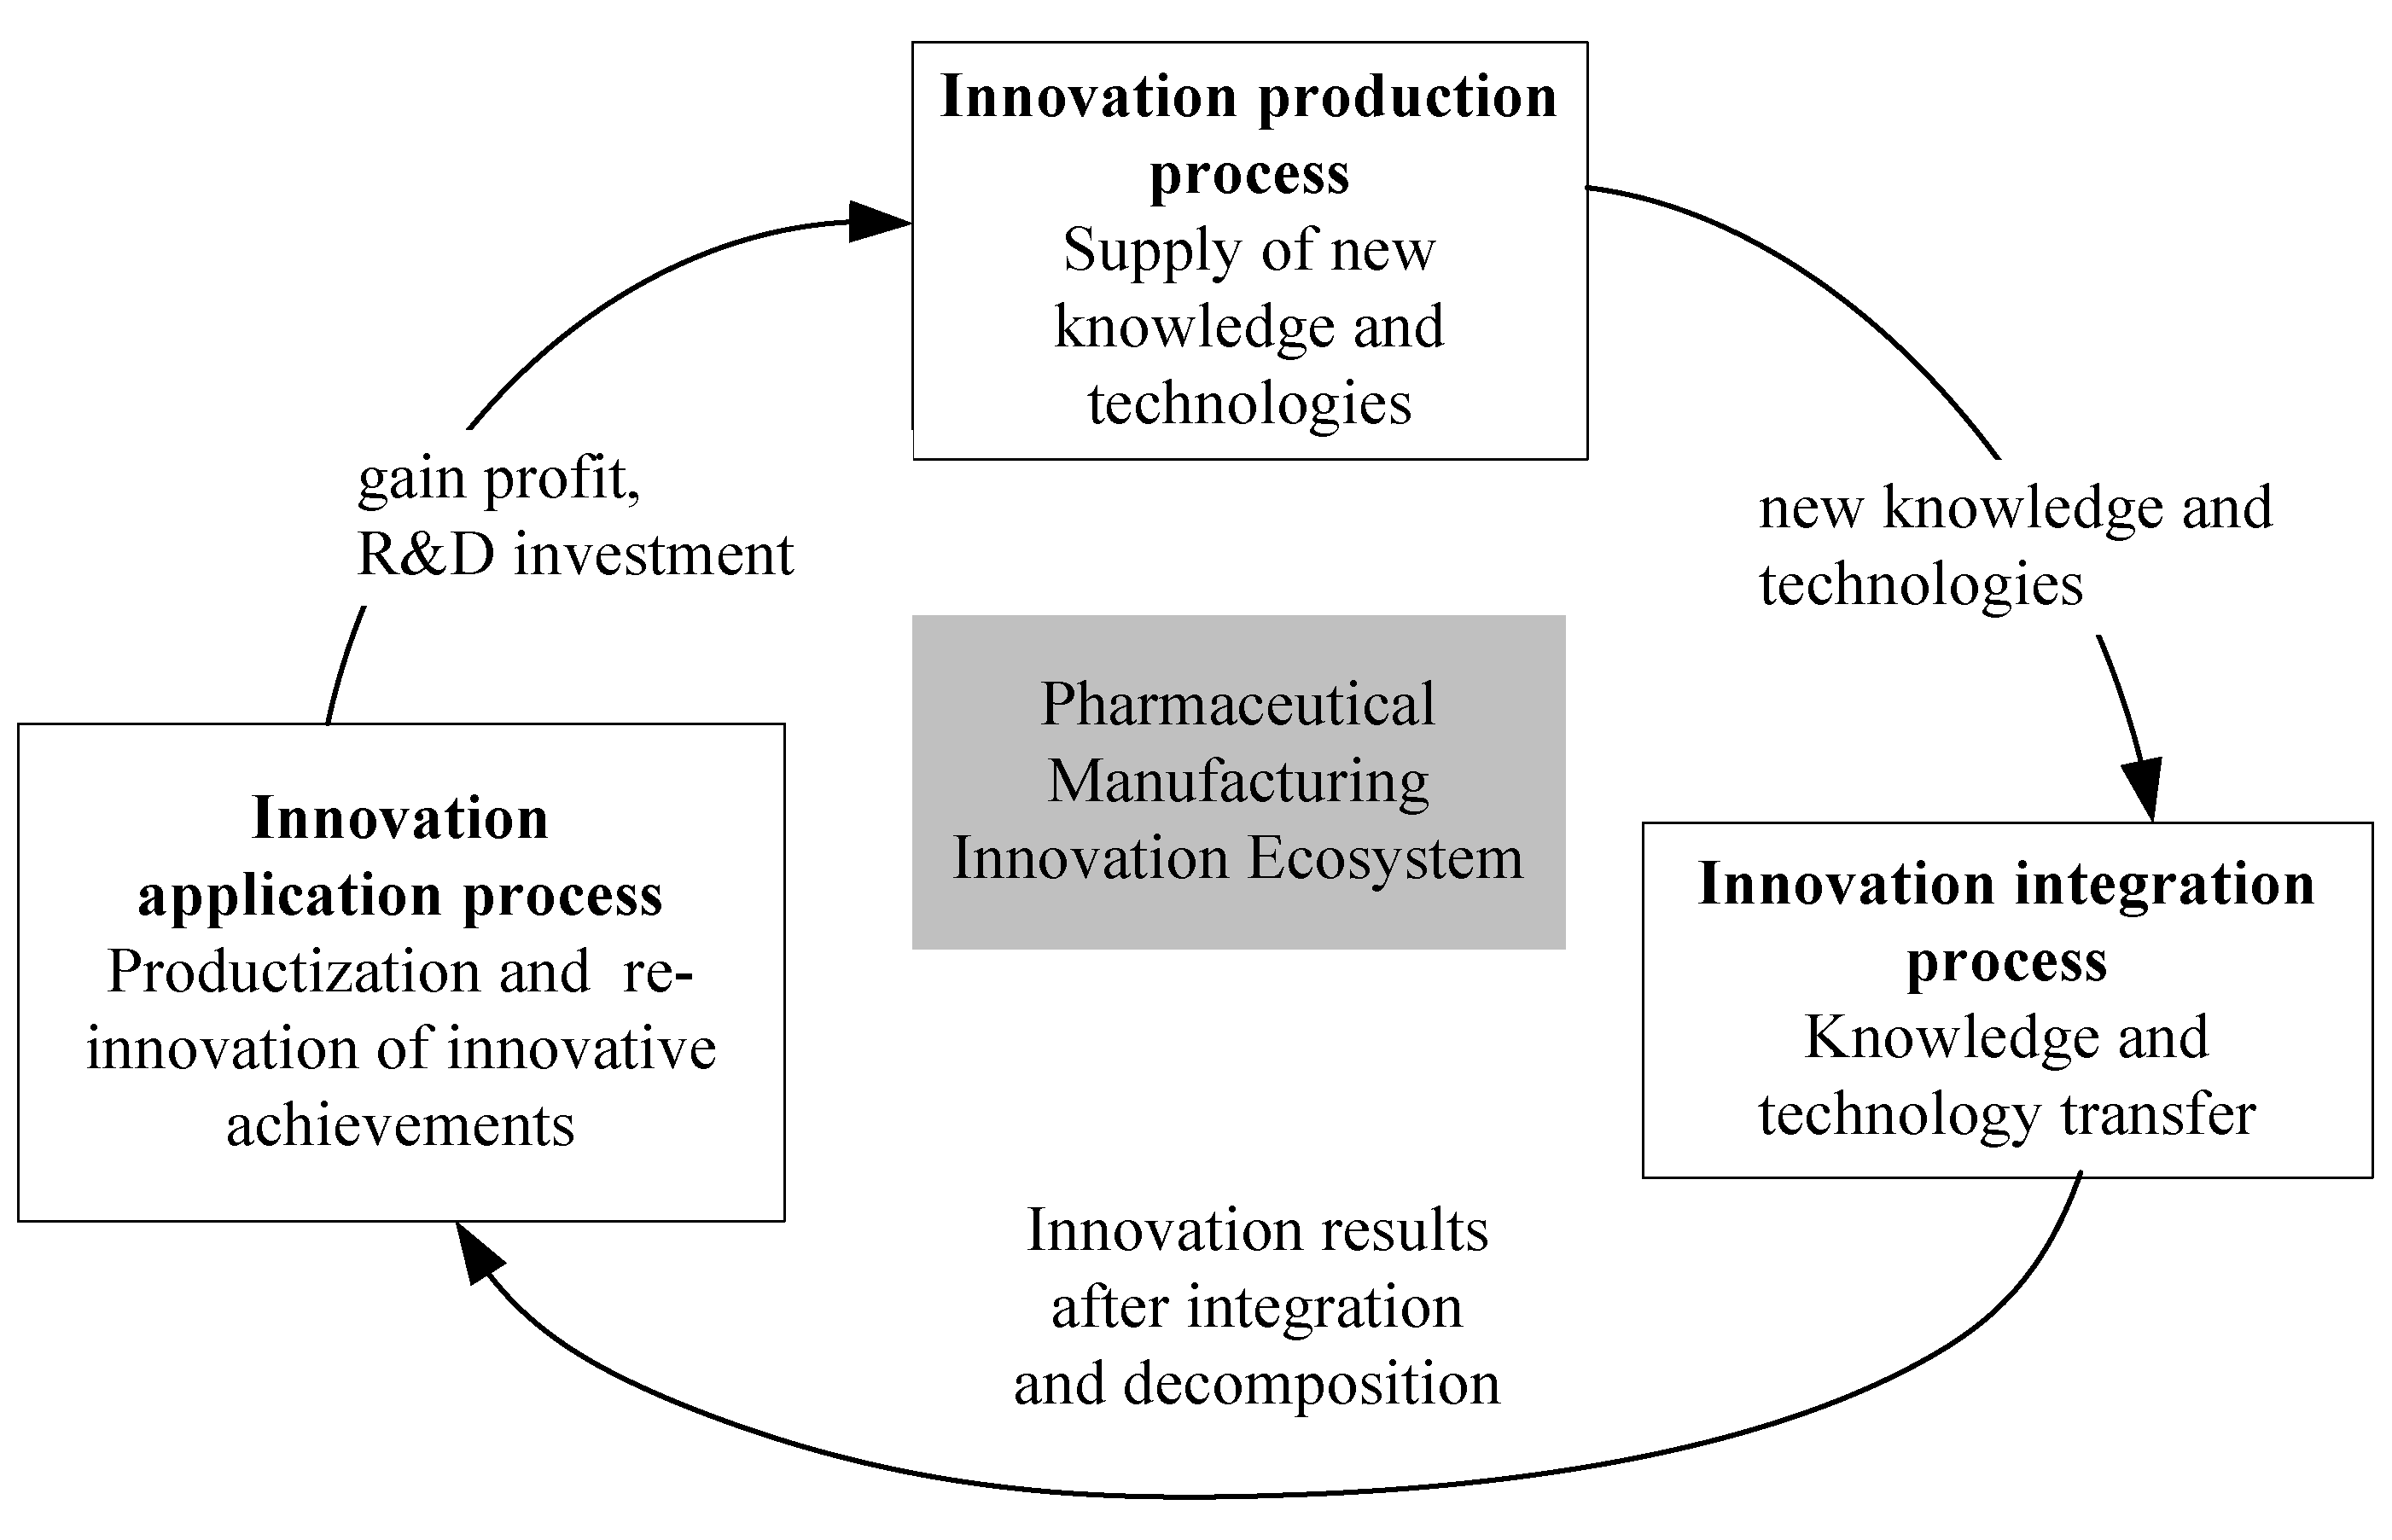
Based on the above analysis, this paper integrates the innovation activities of the pharmaceutical manufacturing industry into the innovation ecosystem and divides the innovation activities into three processes: innovative production, innovative integration, and innovative application with reference to the operation law of the natural ecosystem.
The innovation production process is similar to the process in which autotrophs perform photosynthesis to produce organic matter and provide energy in natural ecosystems, and the main body is the innovation production community. The innovation production community of the pharmaceutical manufacturing industry includes universities, scientific research institutes, medical institutions, and enterprise R and D institutions, which conduct scientific research activities in the pharmaceutical manufacturing industry, and convert various R and D investments such as human, financial, and material into new technologies and new knowledge in the health field.
The innovation integration process is similar to the stage in which the complex organic matter in the natural ecosystem is decomposed into absorbable and usable substances, and the main body is the innovation integration community. The pharmaceutical manufacturing innovation integration community includes the government and intermediary innovation service groups that provide assistance and supplements to the pharmaceutical manufacturing industry, production activities, carry out technology and knowledge conversion and transfer, and organize and decompose new technologies and new knowledge generated in the innovation production stage into resources that can be absorbed and utilized by innovative application systems.
The innovative application process is similar to the process in which heterotrophs transfer energy through predation, parasitism, and other activities in natural ecosystems, and the main body is the innovative application community. The pharmaceutical manufacturing innovative application community is mainly composed of organizations that purchase pharmaceutical innovations and realize the productization of innovations, digest and absorb the innovative technologies and knowledge that have been decomposed and sorted through the integration stage and apply them to production. Additionally, the innovative application community uses its own resources and energy to reinnovate and realize value proliferation.
The above three stages form an end-to-end cyclical cycle, and the output of each stage becomes the input of the next stage, contributing to the dynamic evolution of the innovation ecosystem of the pharmaceutical manufacturing industry. The innovation process model of the pharmaceutical manufacturing industry is shown in
Figure 1.
3. Methodology and Data
3.1. DEA-Malmquist Method
The traditional DEA method uses the CCR model or the BCC model to analyze the cross-sectional data at the same time point, and gradually expand from a single process to two or three stages, but it is still a static analysis, and it is difficult to describe the trend of innovation efficiency. Fare et al. [
48] first combined DEA with the Malmquist index in 1994 to analyze the changes and development trends of panel data efficiency from a dynamic perspective. DEA-Malmquist method has been widely used in the study of innovation efficiency [
49,
50,
51,
52].
Malmquist index is based on the concept of the distance function. For period t, Xt and Yt are input and output, separately, represents the output distance function, and is the distance function from the combined input data of production units to the effective frontier.
The Malmquist index of decision-making unit
Mi from
t period
t + 1 period is expressed as Formula (1).
is the geometric mean based on the Malmquist index of period t and period t + 1, representing the output efficiency from period t to period t + 1, which can describe the total factor productivity (tfpch) of this production activity, which in this paper represents pharmaceutical innovation efficiency in a specific stage of an industrial innovation ecosystem.
When
is greater than 1, the innovation efficiency of this stage increases; when
is less than 1, the innovation efficiency of this stage decreases. Then, decompose Equation (1) into two parts: technical efficiency (
effch) and technological progress (
tech), as shown in Equation (2).
In Formula (2), is the technical efficiency, which measures the relative output changes caused by technological innovation and management, organization, institutional innovation, and economies of scale. When its value is greater than 1, the technical efficiency of a certain stage in the pharmaceutical manufacturing industry innovation ecosystem increases; when its value is less than 1, the technical efficiency of a certain stage in the pharmaceutical manufacturing industry innovation ecosystem decreases. is the technological progress, which measures the degree of technological innovation, including the application of new technologies and inventions. When its value is greater than 1, the technical level of a certain stage in the pharmaceutical manufacturing industry innovation ecosystem is improved, and when its value is less than 1, the technical level of a certain stage in the pharmaceutical manufacturing industry innovation ecosystem is reduced.
3.2. Indicator Selection
In the stage of innovation production, the innovation production community conducts scientific research activities in the pharmaceutical manufacturing industry and converts R and D investment into new technologies and new knowledge in the field of pharmaceutical manufacturing. The scientific research activities of the pharmaceutical manufacturing industry are composed of personnel input and capital investment. The personnel input is described by the workload calculated by the personnel according to the time they actually engage in the research and development activities, that is, the full-time equivalent of an R and D personnel; the capital input is described by the internal expenditure of scientific and technological activities funds for research and experimental development, that is, the internal expenditure of R and D funds.
In the innovation integration stage, the innovation integration community transforms and transfers technology and knowledge and organizes and decomposes new technologies and new knowledge generated in the innovation production stage into resources that the innovation application system can absorb and utilize. In addition to the number of patent applications and effective invention patents produced in the production stage, the input indicators at this stage also include domestic technology expenditures that reflect the innovation integration community’s ability to integrate and transform technology and knowledge. The output of the integration stage is the situation in which the innovative technology and knowledge of the pharmaceutical manufacturing industry are put into the application stage after being decomposed and sorted, and is represented by the expenditure on new product development and the number of new product development projects.
In the innovative application stage, the innovative application community digests and absorbs the innovative technologies and knowledge decomposed and organized in the integration stage, applies it to production, and uses its own resources for reinnovation. The input indicators of the innovative application stage are the new product development expenditure and the number of new product development projects produced in the innovation integration stage. The output of the application stage includes not only the economic benefits of healthy innovative applications, that is, the sales revenue of new products, but also the R and D investment returned to the innovation production stage after realizing the economic benefits, that is, the full-time equivalent of an R and D personnel and the internal expenditure of the R and D funds. The input and output indicators of each stage are shown in
Table 2.
3.3. Data
The research period is 2009–2020, and the original data used in the research are all from 2010 to 2021 “China High-tech Industry Statistical Yearbook”. Missing data in individual years were imputed using the mean method. Due to the lack of data in Inner Mongolia, Tibet, Gansu, Qinghai, Ningxia, Xinjiang, Hong Kong, Macau, and Taiwan and the relatively low proportion of pharmaceutical manufacturing industry, the above 9 provinces were excluded, and 25 provinces and cities were selected for the research. There is a certain lag between the input and output of each stage of the pharmaceutical manufacturing industry’s innovation ecosystem. Considering the characteristics of the long R and D cycle of the pharmaceutical industry and the availability of panel data, the lag between each stage is set to 2 years, and the innovation cycle of the pharmaceutical industry with three stages from the perspective of the ecosystem is 6 years. That is, the input of the innovation production stage is t years, the output of the innovation production stage and the input of the integration stage is t + 2 years, the output of the innovation integration stage and the input of the application stage is t + 4 years, and the output of the innovative application output stage is t + 6 years.
4. Empirical Research
Applying DEAP2.1, the efficiency of the production stage, integration stage, and application stage of the pharmaceutical manufacturing innovation ecosystem was calculated. Additionally, the dynamic innovation efficiency of China in different years and the innovation efficiency of each province in the same period was analyzed from the time dimension and the spatial dimension.
4.1. Efficiency Analysis of Innovation Production Stage
In the time dimension,
Table 2 shows the dynamic innovation efficiency value of China’s pharmaceutical manufacturing industry of innovation production stage from 2011 to 2018.
From the perspective of time, it can be seen from
Table 3 that from 2010 to 2016, the average value of dynamic innovation efficiency in the production stage of China’s pharmaceutical manufacturing innovation ecosystem was 0.977, that is, the efficiency of the production stage decreased at an average annual rate of 2.3% during this period. The reason for the decline in efficiency is due to technological regression, with an average annual rate of technological regression of 20.9%, while the overall increase in technical efficiency at this stage has an average annual increase of 23.5%.
Longitudinal comparison shows that China’s pharmaceutical manufacturing industry fluctuates greatly in terms of technical efficiency, technological progress and overall innovation efficiency in the production stage, and technical efficiency and technological progress are changing in the opposite direction. Affected by both technical efficiency and technological progress, the overall innovation efficiency has shown an upward trend, with a significant improvement since 2012. It shows that the technical efficiency improvement and technological progress of the production stage of the innovation ecosystem of China’s pharmaceutical manufacturing industry are not synchronized, and the innovation efficiency of the production stage can be significantly optimized only when the two are improved at the same time.
Table 4 shows the innovation efficiency and ranking of the pharmaceutical manufacturing innovation ecosystem at the production stage of each province. According to
Table 3, the provinces are compared horizontally. In terms of technical efficiency, the efficiency of all provinces has improved. Among them, Zhejiang ranks first with 1.584, which is 34.9% higher than the national average. In terms of technological progress, all provinces and regions experienced technological regressions, among which the minimum regression value in Shanxi was 0.868, which was 4.8% higher than the national average. In terms of overall innovation efficiency, the efficiency of 13 provinces and autonomous regions has improved, of which Tianjin is the highest at 1.159, which is 18.2% higher than the national average. It can be seen that the technical efficiency, technological progress, and innovation efficiency of China’s pharmaceutical manufacturing innovation ecosystem in the production stage are significantly different, with the gaps between the maximum and minimum values being 58.4%, 14.4%, and 41.6%, respectively.
4.2. Efficiency Analysis of Innovation Integration Stage
In the innovation integration stage, the innovation efficiency changes in the time dimension of China’s pharmaceutical manufacturing industry innovation efficiency and the comparison of the provinces in the spatial dimension are shown in
Table 5 and
Table 6 respectively.
It can be seen from
Table 4 that, considering the time dimension, the average dynamic innovation efficiency in the integration stage of China’s pharmaceutical manufacturing industry innovation ecosystem from 2012 to 2018 was 0.930, that is, the efficiency in the integration stage decreased at an average annual rate of 7% during this period. The reason for the decrease in efficiency is due to technological progress, with the average annual technological progress rate decreasing by 8.4% while the average annual technical efficiency increased by 1.5%.
The longitudinal comparison shows that both the technical efficiency and the technological progress of China’s pharmaceutical manufacturing industry fluctuate greatly, while the overall innovation efficiency fluctuates more obviously in the later stages than in the early stages. The technical efficiency fluctuated in an “M” shape, with the highest and lowest efficiency values appearing in 2013–2015 and 2016–2018, respectively. Except for 2014–2017, the value of technological progress is less than one, that is, technological progress has not been achieved in most years. Under the combined effect of technical efficiency improvement and technological progress, the innovation efficiency value fluctuates close to one, with efficiency improvement in 2015–2017 and a negative growth in the remaining years.
A horizontal comparison of various provinces and regions shows that the integration stage of the pharmaceutical manufacturing innovation ecosystem has obvious differences between regions in terms of technical efficiency, technological progress, and innovation efficiency. The gaps between the maximum and minimum values of each indicator were 23.7%, 17.4%, and 44.6%, respectively. In terms of technical efficiency and technological progress, 18 and 5 provinces and autonomous regions have achieved progress, respectively. The highest in the whole country is in Shanxi and Guangdong, separately. The average annual technical efficiency improvement and technological progress rate are 16.4% and 8.0%, respectively, which are 14.9% and 16.4% higher than the national average. In terms of overall innovation efficiency, a total of seven provinces and autonomous regions have achieved efficiency improvement. Shanxi has the highest efficiency in the country, with an average annual efficiency improvement of 18.4%, which is 25.4% higher than the national average.
4.3. Efficiency Analysis of Innovative Application Stage
In the innovative application stage, the innovation efficiency changes in the time dimension and the spatial dimension of the innovation efficiency of China’s pharmaceutical manufacturing industry are compared in
Table 7 and
Table 8, respectively.
Observing from the time dimension, it can be seen from
Table 6 that the dynamic innovation efficiency in the application stage of China’s pharmaceutical manufacturing industry innovation ecosystem from 2014 to 2020 is less than one, except for 2015–2017 and 2018–2020, with an average value of 0.976, that is, the efficiency of the application stage during this period is of an annual average of 2.4% speed decrease. The reason for the decline in efficiency is the decrease in technological progress.
The time dimension comparison shows that the technical efficiency and technological progress fluctuate significantly in the innovative application stage, and the overall innovation efficiency fluctuates more in the later stages than in the early stages. Technical efficiency fluctuates in an “M” shape, with the highest and lowest efficiency values appearing in 2015–2017 and 2014–2016, respectively. Technological progress decreased year by year from 2014 to 2019, then increased in 2018–2020, but the technological progress has not yet been achieved. Technological efficiency and technological progress change in the opposite direction in most years, indicating that in a period of high technological innovation, the efficiency of technology and organizational management may often be ignored, resulting in a decline in technical efficiency and a reduction in the overall increase in innovation efficiency. However, during the difficult period of technological innovation, the efficiency of technology and organizational management is often emphasized, which leads to an increase in technical efficiency and promotes the improvement of overall innovation efficiency to a certain extent.
According to
Table 7, a horizontal comparison of various provinces and regions shows that the application stages of China’s pharmaceutical manufacturing innovation ecosystem are significantly different in terms of technical efficiency, technological progress, and innovation efficiency. The gap between the maximum and minimum values of the three indicators is 17.7%, 16.8%, and 23.1%. In terms of technical efficiency, a total of 17 provinces and autonomous regions achieved efficiency improvement, of which Tianjin had the highest efficiency improvement of 12.6%, which is 11.2% higher than the national average. In terms of technological progress, five provinces and autonomous regions achieved technological progress, the highest being Jiangsu, with a technological progress rate of 5.0%, 8.8% higher than the national average. In terms of overall innovation efficiency, a total of 10 provinces and autonomous regions achieved efficiency improvements, of which Tianjin had the highest efficiency improvement of 9.1%, which is 11.5% higher than the national average.
4.4. Comprehensive Comparison of Innovation Efficiency at Different Stages
When comparing the innovation efficiency of production, integration, and application stages in China’s pharmaceutical manufacturing innovation ecosystem, the innovation efficiency of each province and stage is shown in
Figure 2a–c.
It can be seen from
Figure 2a–c that among the three stages, the innovation efficiency of the innovation integration stage is relatively low, the innovative application stage is the second, and the innovation production stage is the highest. In the stage of innovative production, 3 of the 13 provinces with improved innovation efficiency had an average annual innovation efficiency increase in more than 10%, and 6 of the 13 provinces with a decline in innovation efficiency dropped by more than 10%. In the innovation integration stage, 1 of the 7 provinces with improved innovation efficiency increased their average annual innovation efficiency by more than 10%, and 12 of the 19 provinces with decreased innovation efficiency dropped by more than 10%. In the innovative application stage, none of the 10 provinces with improved innovation efficiency had an average annual increase in more than 10% in innovation efficiency, and 2 of the 16 provinces with a decline in innovation efficiency dropped by more than 10%.
On comparing the provinces, it is found that a total of five provinces achieved innovation efficiency improvement at all stages, namely Beijing, Guangdong, Shanghai, Jiangsu, and Zhejiang. Three provinces, including Tianjin, Hebei, and Shanxi, achieved innovation efficiency improvement in two stages. Nine provinces, including Anhui, Fujian, Shandong, Shannxi, Heilongjiang, Inner Mongolia, Hubei, Liaoning, and Chongqing, achieved innovation efficiency improvement in one stage. There are also seven provinces that experienced a decline in innovation efficiency at all stages, namely Jiangxi, Guizhou, Hainan, Hunan, Yunan, Guangxi, and Jilin. There are obvious differences in innovation efficiency between different provinces at different stages. It is worth noting that most of the provinces with high innovation efficiency in the pharmaceutical industry are concentrated in the east, while the provinces with low efficiency are mostly distributed in the west and northeast regions. This result may be related to factors, such as the more developed economy in the eastern region and the agglomeration of pharmaceutical industries in the east forming economies of scale.
5. Conclusions and Policy Implications
5.1. Conclusions
- (1)
The innovation efficiency of China’s pharmaceutical manufacturing industry has declined from 2009 to 2020, and the decline rate of innovative production, innovation integration, and innovative application is 2.3%, 7%, and 2.4%, respectively. In terms of changing trends, the efficiency of innovation in China’s pharmaceutical manufacturing industry in 2009–2020 has fluctuated to a certain extent, and the industry has not yet achieved steady growth in innovation efficiency, which is in line with previous studies [
26]. At all stages of innovation, the efficiency of innovation, and the efficiency of technology have increased, but the improvement of technological efficiency and technological progress has not been synchronized, resulting in a decline in the overall innovation efficiency.
- (2)
Interregional comparisons found that there were obvious differences in innovation efficiency among provinces, with the phenomenon of high in the east and low in the west and northeast, which was consistent with the conclusions of Liu (2020) [
26]. Five eastern provinces, Beijing, Guangdong, Shanghai, Jiangsu, and Zhejiang, have achieved innovation efficiency improvement in three stages, and have certain advantages in innovation. The innovation efficiency of the seven western or northeastern provinces, such as Jilin, Guangxi, and Guizhou, is declining at all stages, and there is a big gap with the advanced provinces.
5.2. Limitations and Prospects
The differences in innovation efficiency in different stages and regions were analyzed from the perspective of an innovation ecosystem. However, the factors affecting innovation efficiency and the reasons causing the differences are not covered in this study. In the follow-up research, we will examine which factors influence innovation efficiency and analyze the causes of regional differences.
5.3. Policy Implications
- (1)
Focus on improving technical efficiency:
Make up for the shortcomings of slow improvement in technical efficiency and out-of-sync with technological progress in the various innovation processes of China’s pharmaceutical manufacturing industry. Coordinate all links of the pharmaceutical manufacturing industry chain, avoid homogenization construction, improve the scale efficiency of the pharmaceutical manufacturing industry from the perspective of organization and management, and create agglomeration effects and economies of scale through innovative industrial organization models and management models. Especially in the period where there are many innovation achievements and technological progress in the pharmaceutical manufacturing industry, it is even more necessary to integrate high-quality resources and high-quality platforms, carry out cross-department, cross-institutional, and cross-regional cooperation, realize cluster development, and improve the operational efficiency of the pharmaceutical manufacturing innovation ecosystem.
- (2)
Improve the efficiency of the whole process of innovation:
In the innovative production stage, relying on the scientific and technological innovation platform in the pharmaceutical field and the high-value patent cultivation demonstration center, strengthens basic research and original innovation. In the innovation integration stage, support the establishment, introduction, and development of service organizations, such as industry associations, property rights exchange centers, technology and financial intermediaries, and promote the transaction of pharmaceutical innovation technology. In the innovative application stage, standardize the operation of the market on one hand, and give full play to the leading effect of leading enterprises on the other.
- (3)
Bridge the gap in innovation efficiency across regions:
Thoroughly explore the reasons for differences in innovation across regions. Play the leading role of advanced regions, promote the cross-regional flow of innovation elements, and narrow the differences between regions. With the help of the development of the digital economy and technological innovation, promote the integration and innovation of the pharmaceutical manufacturing industry and the new generation of information technology. Establish a high-level innovation center and platform for the pharmaceutical manufacturing industry and give play to the leading role and demonstration effect of leading enterprises in various fields. Enhance the vertical and horizontal integration capabilities of the industrial chain, promote industrial innovation radiation and synergies, and form unique competitive advantages.


