Article

Regional Differences and Key Influencing Factors of Fertilizer Integrated Efficiency in China

1
Environmental Science and Engineering Key Discipline, Nanjing Xiaozhuang University, Nanjing 211171, China
2
School of Geography and Ocean Science, Nanjing University, Nanjing 210093, China
3
School of Environmental Engineering, Nanjing Institute of Technology, Nanjing 211167, China
*
Author to whom correspondence should be addressed.
Sustainability 2022, 14(20), 12974; https://doi.org/10.3390/su142012974
Submission received: 28 August 2022 / Revised: 1 October 2022 / Accepted: 7 October 2022 / Published: 11 October 2022

Abstract

:
Overuse and low efficiency of chemical fertilizers have caused severe non-point source pollution in China. The investigation of regional difference and the key influencing factors of fertilization intensities (FI) and efficiency can provide references for decision-makers to establish efficient policies for fertilizer use. Using simple models of fertilizer allocation efficiency (FAE) and fertilizer integrated efficiency (FIE), it was found that the east of China excessively used fertilizers, and both the middle and west showed both excessive and insufficient fertilizer use. The average values of the FIE in the east, middle and west of China were 0.69, 0.68 and 0.64, respectively, all of which were at low efficiency. The inter-provincial differences of FIE throughout the country ranged from 0.47 in Shannxi to 0.94 in Shanghai. The population aging rate (PAR), effective irrigation rate (EIR), natural disasters affected rate (DAR) and disaster damaged rate (DDR) are considered the key factors influencing the FIE, based on the new concept of cumulative weight (CW). PAR and EIR are the positive factors, while DAR and DDR are negative. The average FIE is now 0.67 in China, which implies that the increase of chemical fertilizer use efficiency or the reduction of chemical fertilizer amount has a potential of approximate 33%, with the current grain yield and other inputs unchanged. The increase of fertilizer use efficiency should be conducted under local conditions. Optimized intensification of grain production should be given more attention in the east, and implementing disaster prevention and reduction technologies and water-saving irrigation technologies are the preference in the middle and west of China.

1. Introduction

Chemical fertilizers have made great contributions to ensuring the food security of 1.4 billion Chinese people and the exporting of large volumes of agricultural products to the world. In 2019, China’s agricultural chemical fertilizer use was 52.51 million tonnes, accounting for about one third of the world’s chemical fertilizer consumption. The total grain output of China was 663.84 million tonnes, which was about 24.4% of the world’s total grain output, with a grain yield of 5733.52 kg ha−1 [1]. However, some problems, such as low fertilizer use efficiency and severe non-point source pollution, have appeared due to the high intensity of chemical fertilizer input [2]. The prevention and control of agricultural non-point source pollution has aroused considerable concern for environmental protection in China. In 2015, the Ministry of Agriculture of China put forward an action plan for zero growth of chemical fertilizer use by 2020. In 2019, the central government required that relevant agencies “strengthen the control of agricultural non-point source pollution, carry out the action of saving fertilizer in agriculture to realize the negative growth of chemical fertilizer and pesticide use” [3]. China is one of the largest agricultural countries in the world, with large regional differences and diverse agricultural production conditions. Actively carrying out research on regional differences in fertilizer use efficiency and its influencing factors can effectively evaluate the effectiveness of current government policies in fertilizer reduction and provide empirical evidence for policy optimization, which is of great practical significance and scientific value for achieving the objectives above.
From the perspective of fertilizer technical efficiency, research on fertilizer use efficiency includes two main methods: parameter based stochastic frontier analysis (SFA) and non-parameter data envelopment analysis (DEA) [4,5]. Cai et al. [6] calculated the fertilizer use efficiency of rice production by using the SFA method based on the micro survey data of rice growers in Hubei Province. The results showed that the fertilizer use efficiency of rice growers was only 0.64 in 2018. If the efficiency loss is completely eliminated, fertilizer use efficiency still has 36% potential for improvement. Shi et al. [7] calculated the chemical fertilizer use efficiency of 15 major wheat producing provinces in China from 1998 to 2013 by using statistical data and a single input technical efficiency measurement model based on the SFA method. It was found that the chemical fertilizer use efficiency for wheat in China was low, with an average of 0.45. Cai and Chen [8] used the fixed effect SFA (WH-SFA) model and counterfactual analysis method to investigate the impact of agricultural mechanization on fertilizer use efficiency and its fertilizer reduction effect; they believed that fertilizer use efficiency in China’s wheat production was generally on the rise from 1998 to 2017, with an average of 0.73. By using DEA, Zhu and Ma [9] pointed out that the average fertilizer use efficiency for winter wheat and summer maize in Hebei, Henan and Shandong provinces were 0.77 and 0.64, respectively, and the efficiencies of different varieties and regions were significantly different. Based on the micro data of 358 apple growers in the Loess Plateau, Zhang et al. [10] studied chemical fertilizer use efficiency and its influencing factors for apple production by using the DEA single factor efficiency model. The results showed that the average chemical fertilizer utilization efficiency was 0.43.
The studies outlined above mostly took the total of nitrogen (N), phosphate (P2O5, P) and potash (K2O, K) fertilizer as a single input to study the efficiency of chemical fertilizer use in China by using complex methods, without pointing out the key influencing factors. Considering the impact of the ratio of N, P and K fertilizers on grain production, the present study used a new simple method of “Relative Productivity Proportion Weight” (RPPW) [11] to measure the allocation efficiency of NPK chemical fertilizers in China. Then, the chemical fertilizer integrated efficiency (FIE) was also calculated considering the scale impact of grain yield to explore regional difference and their key influencing factors for chemical fertilizer use efficiency. On the one hand, this will improve the calculation method of fertilizer use efficiency, and on the other hand provide decision-making references for reducing fertilizer use and increasing its efficiency in China’s agricultural sustainable development.

2. Materials and Methods

2.1. Relative Fertilizer Productivity (RFP)

RFP relates to the ratio of chemical fertilizer productivity (FP) of one decision making unit (DMU) to the maximum chemical FP of all DMUs in a year, which is also called Fertilizer net efficiency [12]. The formulas are:
R F P = F P F P max
F P = Y F I
where RFP refers to the relative fertilizer productivity of N, P, K or total NPK fertilizer; FP refers to the fertilizer productivity [13], which means the ratio between grain crop yield per unit sowing area and the input of N, P, K or total NPK fertilizer (kg kg−1) of one DMU in a year. FP is equal to the chemical fertilizer partial factor productivity (PFP) [14], FPmax represents the maximum FP of N, P, K or total NPK fertilizer among all DMUs studied; Y represents the grain yield per unit sowing area of one DMU in a year (kg ha−1); FI is the fertilization intensity (kg ha−1) of N, P, K or total NPK fertilizer per unit sowing area.

2.2. Fertilizer Allocation Efficiency (FAE)

At present, most studies on fertilizer efficiency usually take the total of N, P, and K as one fertilizer input, ignoring the impact of the allocation of N, P and K fertilizers on the output. FAE brings the different amounts of N, P and K into analysis, which refers to the average relative fertilizer productivity of the weighted RFP of N, P, and K fertilizers. Based on the previous work, a modified model was proposed to calculate the FAE [11]. The measurement is to multiply the RFP of N, P, and K fertilizer by its proportion in the sum of the three RFPs, respectively, then add them together, and raise to the power of 2/3. Therefore, it is called the “Relative Productivity Proportion Weight" (RPPW) method. The formula is given as:
F A E = ( R F P N 2 + R F P P 2 + R F P K 2 R F P N + R F P P + R F P K ) 2 3
where FAE represents the fertilizer allocation efficiency; RFPN, RFPP, and RFPK represent the RFP of N, P and K fertilizers, respectively.

2.3. Fertilizer Integrated Efficiency (FIE)

Fertilizer allocation efficiency is based on the comparative relationship between chemical NPK’s FI and grain yield, without considering the yield scale effect of grain crops. For example, the FP of 800 kg ha−1 grain yield to 20 kg ha−1 chemical FI is the same as that of 8000 kg ha−1 grain yield to 200 kg ha−1 chemical FI, and their RFPs are also the same, but their yield scales are evidently different. In order to reflect the grain yield scale of fertilizer use, the concept of FIE was put forward by Liu et al. [15], which refers to the combination of FAE, the net fertilizer efficiency, with the grain yield scale on which the FAE is based. The higher the FIE, the better the comprehensive effect of fertilization intensity (FI) and crop yield. The FIE formula is given as:
F I E = ( G Y C × F A E ) 1 2
G Y C = Y Y max
where FIE represents the chemical fertilizer integrated efficiency; GYC represents the grain yield coefficient, the ratio of a yearly grain yield per unit sowing area of one DMU to the maximum grain yield among all DMUs (Y/Ymax), Ymax is the maximum grain yield (kg ha−1).
The values of FAE and FIE are in the range of 0–1. The closer the value is to 1, the higher the fertilizer use efficiency is, and vice versa. Referring to the classification of technical efficiency in the relevant literature [16], various ranges of fertilizer efficiency as <0.60, 0.60~0.70, 0.70~0.80, 0.80~0.90 and 0.90~1 are classified into five types of very low, low, medium, high and very high efficiency, respectively, in the current study.

2.4. Gray Correlation Analysis

A model of the gray correlation analysis [17,18] is used to quantitatively analyze the relationship between fertilizer use efficiency and the influencing factors, seeking for the key influencing factors (i.e. the most closely related factors). The principle is to compare the similarity or dissimilarity of the change trend of data sequence of fertilizer use efficiency (i.e. reference data sequence (x0)) with corresponding data sequence of influencing factors (i.e. comparative data sequence(xi)). It is assumed that all influencing factors have positive effects on fertilizer use efficiency. If some factors have negative effects, they should be reversed before calculation. If the change trends of two sequences are more similar, the correlation degree is higher; otherwise the correlation degree is lower. The calculation of correlation degree is given as:
This supposes that the reference data sequence (x0) and the comparison data sequence(xi) are as follows:
x 0 = ( x 0 ( 1 ) , x 0 ( 2 ) , , x 0 ( n ) ) , x i = ( x i ( 1 ) , x i ( 2 ) , , x i ( n ) ( i = 1 , 2 , , m ) )
where, n represents the number of DMUs, or provinces, n = 30 in this study; m represents the number of influencing factors, m = 8 in this study, which will be discussed later.
ξ i ( k ) = min i min k x 0 ( k ) x i ( k ) + ρ max i max k x 0 ( k ) x i ( k ) ( x 0 ( k ) x i ( k ) + ρ max i max k x 0 ( k ) x i ( k )
where, k = 1, 2, …, n; k represents different province, ξ i ( k ) is the i influencing factor’s correlation coefficient between the comparison and the reference sequence of the k-th province, ρ represents the resolution coefficient, which improves the significance of the difference between the correlation coefficients. The value of ρ is between 0–1, usually = 0.5. min i min k x 0 ( k ) x i ( k ) represents the minimum difference between the comparison and the reference sequences, max i max k x 0 ( k ) x i ( k ) represents the maximum difference between the comparison and the reference sequences.
According to the ξ i ( k ) , the average value of correlation coefficient of all provinces, i.e., the correlation degree, can be obtained by the following formula:
γ i = 1 n i = 1 n ξ i ( k )
where γ i is the correlation degree between the comparison sequence xi and the reference sequence x0. The higher the correlation degree, the closer the relationship between the fertilizer use efficiency and the influencing factor.
Usually, the correlation degree is used to determine the rank in the order of influencing factors, but cannot determine which factors are the main factors. The present study put forward a new idea of cumulative weight (CW) to choose the main influencing factors by the following formula:
c w = ( γ i γ i )
where cw represents the cumulative weight and γ i γ i is the weight of one influencing factor. When the value of cw is equal or greater than the 65% set in this study, the factors, whose weights are included in cw, are considered as the main influencing factors.

2.5. Data Source

The data of the amounts of N, P, K and compound fertilizers, the crops sown area, and grain yield (including cereal crops, potato crops and legume crops) of all provinces in the same year are mainly from China Statistical Yearbook 2014 and 2019 [1] on the website of the Bureau of Statistics of the People’s Republic of China. Since the contents of N, P, K in compound fertilizer are not given in the Yearbook, their proportion in compound fertilizer is considered as 1:1:1 by referring to the relevant literature [19,20] and FAO Database [21]. According to the regional division of China 30 provinces into eastern, central and western parts by Wang et al. [4], the eastern region includes the 10 provinces and cities of Beijing, Tianjin, Liaoning, Hebei, Shandong, Shanghai, Jiangsu, Zhejiang, Fujian and Guangdong; the central region the eight provinces of Heilongjiang, Jilin, Henan, Shanxi, Anhui, Jiangxi, Hubei and Hunan; the western region the 12 provinces and cities of Neimeng (Inner Mongolia), Sichuan, Chongqing, Shaanxi, Gansu, Ningxia, Qinghai, Xinjiang, Guizhou, Yunnan, Guangxi and Xizang (Tibet). Because Hainan Province is not adjacent to any province and the data for Hong Kong, Macao and Taiwan are not available, they are not studied in this paper.

3. Results

3.1. Regional Differences of Fertilizer Use Efficiency in China

3.1.1. Regional Differences in Fertilization Intensity (FI) in China

There are significant differences in FIs because China has a vast territory with diverse landscape, natural conditions and social-economic development. This paper selected the intensity of chemical fertilizer use in 2019 to reveal the regional differences of chemical fertilizer use in China (Figure 1). In 2019, the spatial pattern of chemical FI in China ranged from large in the east to small in the west. The chemical FIs in the eastern, central and western regions were 376.0, 295.6 and 248.8 kg ha−1, respectively, with an average value of 307 kg ha−1. They exceeded the upper limit of 250 kg ha−1, required by the national ecological county-township construction of China, and much higher than the 225 kg ha−1 which is the internationally recognized safety upper limit for chemical fertilizer use. In the eastern region, the highest FI was in Fujian with the value of 546.8, and the lowest in Shanghai with 274 kg ha−1. In the central region, the highest was 440 kg ha−1 in Henan, the lowest 150.9 kg ha−1 in Heilongjiang. In the western region the highest was 384.6 kg ha−1 in Shaanxi, and the lowest 110.3 kg ha−1 in Qinghai. The variation coefficient of chemical FIs in the three regions from east to west were 0.218, 0.318 and 0.356, respectively, which showed that the regional differences among the three regions were gradually increasing. From the view of fertilizer input, it is obvious that there is a coexistence of excessive with insufficient use in the same region, as in Henan with a high FI of 440.2 kg ha−1, and Heilongjiang with a low FI of 150.9 kg ha−1, both in the central region. It is well known that China is one of the largest countries in the world with various geographical conditions. Henan is the largest agricultural province in China with a large population and less per capita cropland, so the pressure on food supply is great, resulting in more fertilizers for grain production. Heilongjiang is situated in the Northeast of China with a large area of cropland, a short agricultural history, small population density and much less food pressure, whose agricultural investment gave priority to agricultural machinery due to the shortage of labor force, so the amount of chemical fertilizer input was relatively low [12]. Therefore the differences in fertilizer use in different provinces within the same region are consistent with their grain production conditions.
The spatial patterns of China’s chemical FI were characterized by: (1) High and excessive inputs in all provinces of the east, excessive inputs in most provinces of the middle; insufficient inputs in most provinces of the west. (2) The inter provincial difference in FI in the eastern region was smaller, and that in the central and western regions was larger.

3.1.2. Regional Differences in FAE in China

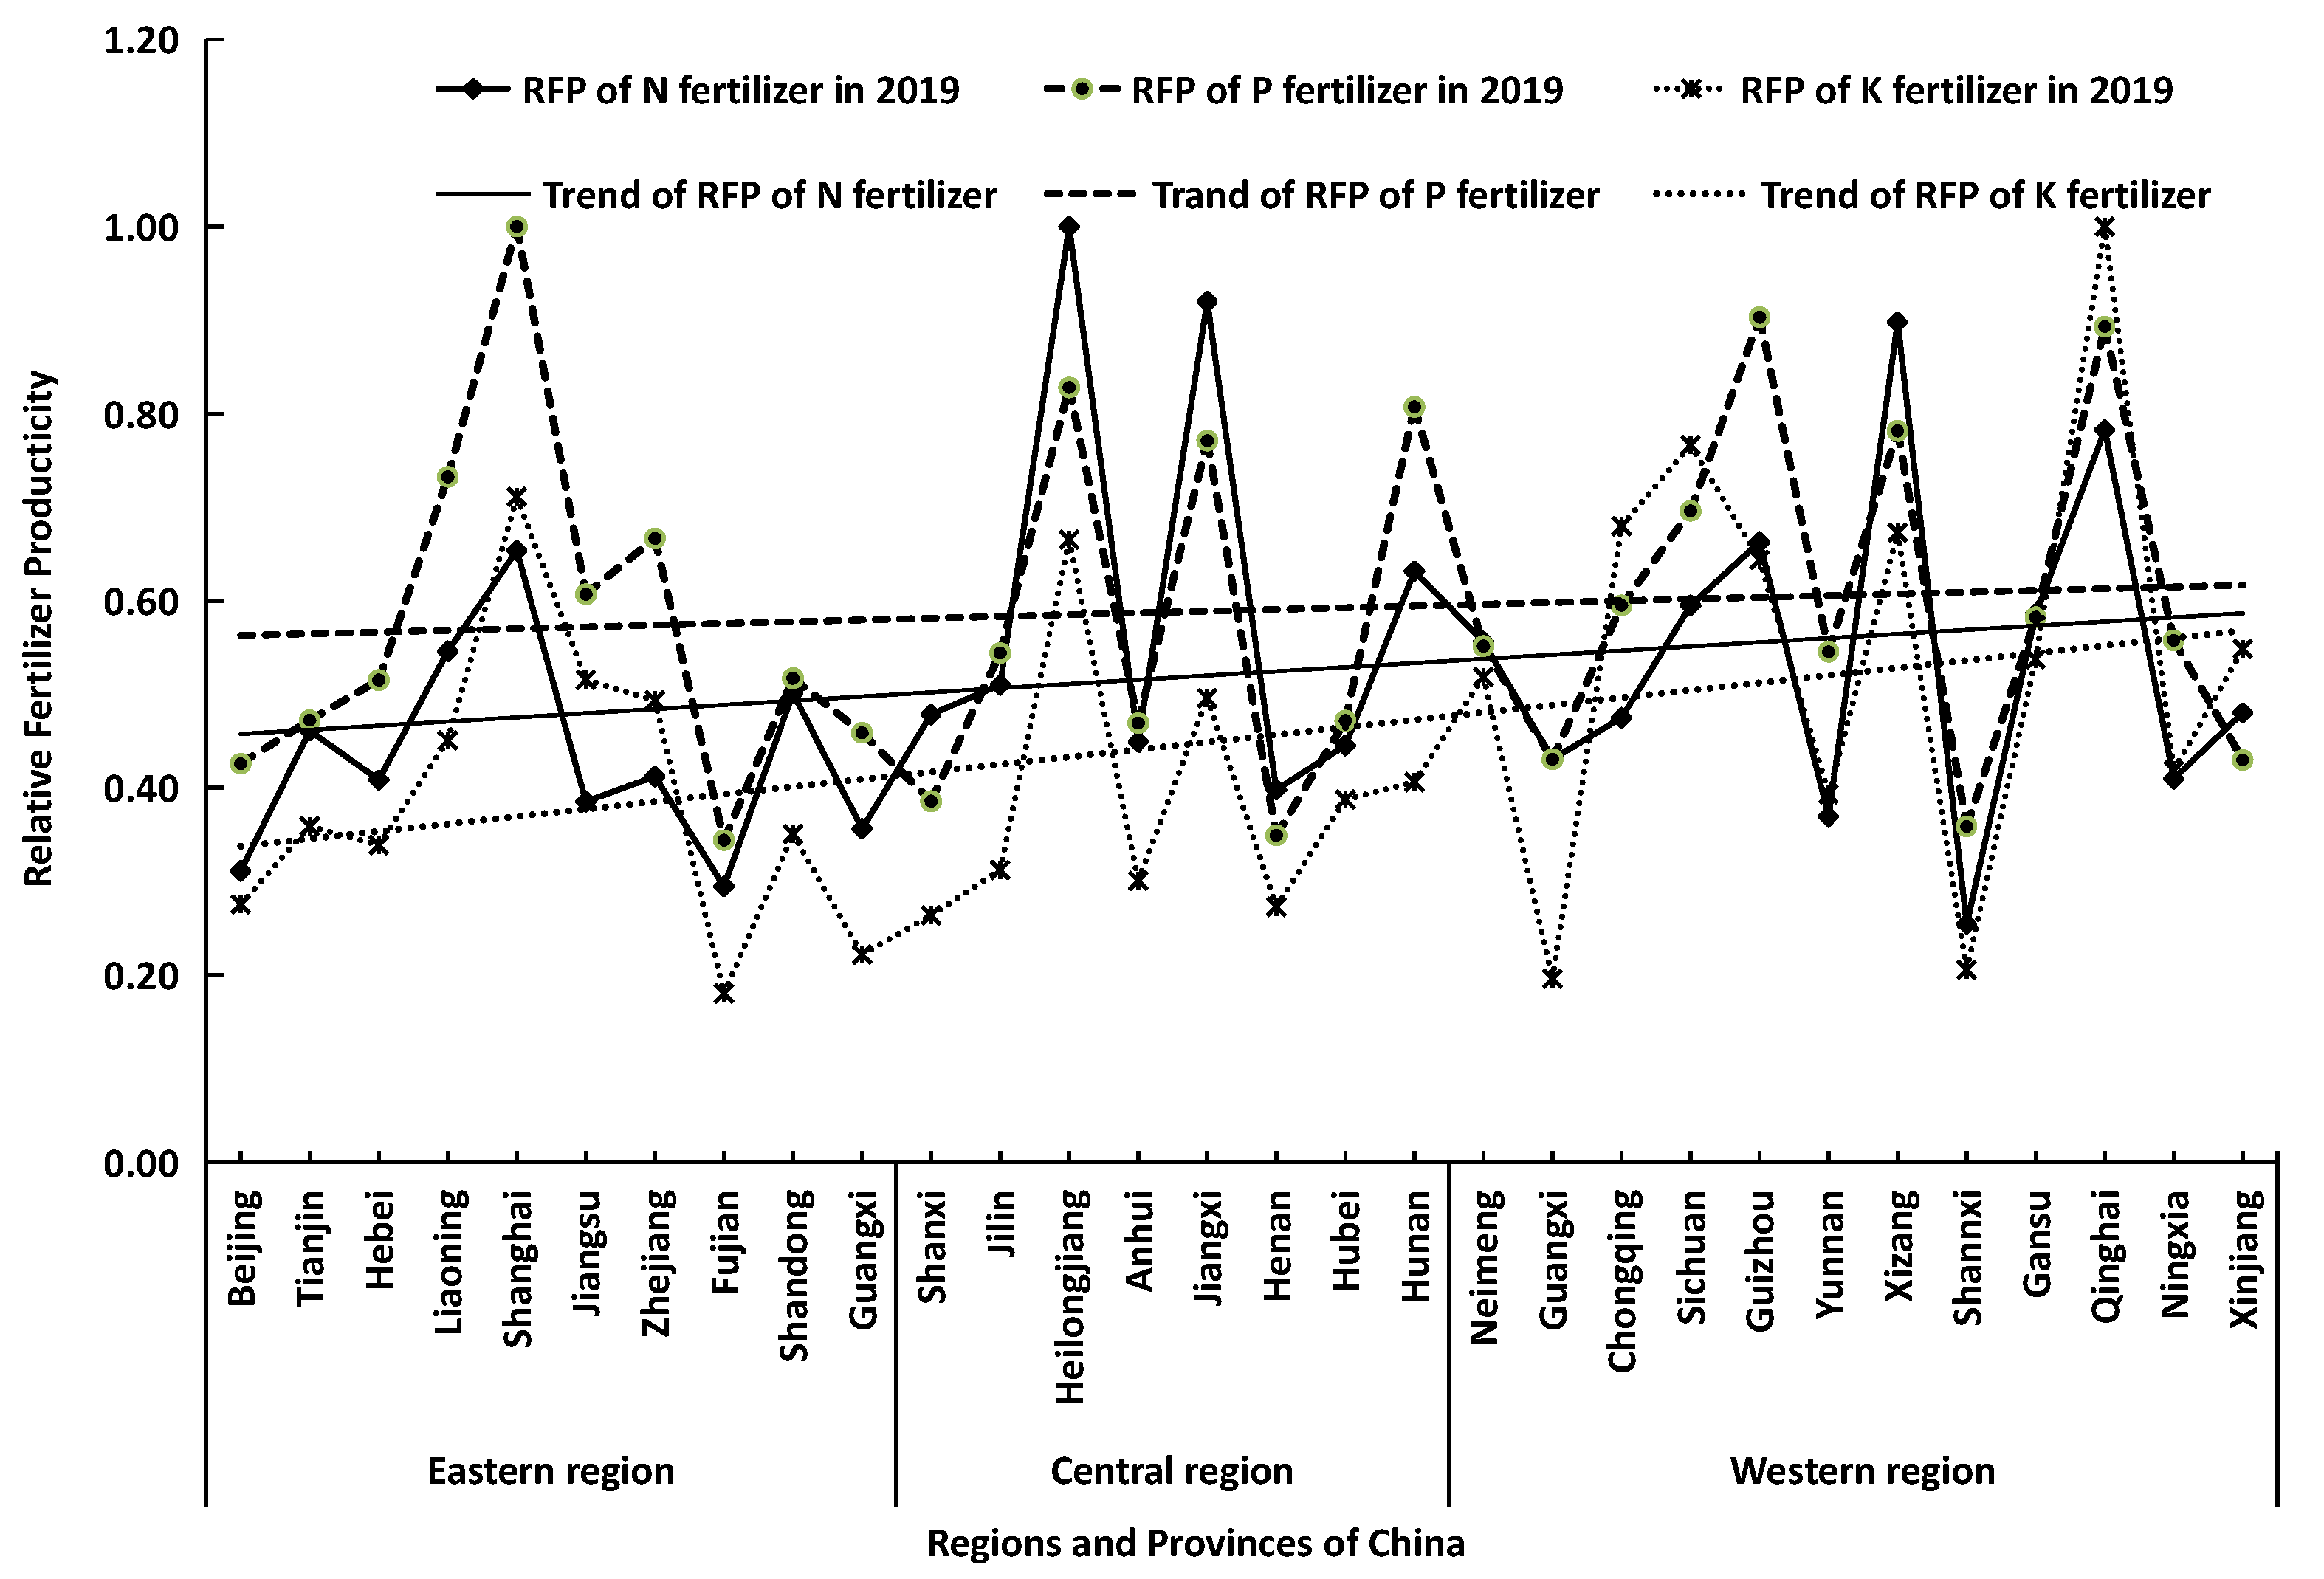
FAE is the synthesis of the individual efficiency of N, P and K fertilizer use, that is, the weighted average of the relative productivity of N, P and K fertilizers. According to Equations (1) and (2), the RFP of N, P and K fertilizers in all provinces of China in 2019 was calculated (Figure 2). The results showed that the RFPP, efficiency of P fertilizer, was the highest, followed by RFPN and RFPK, with values of 0.59, 0.52 and 0.45, respectively. This indicates that there are 41%, 48% and 55% efficiency potentials to be improved for N, P and K fertilizers, respectively, and the reduction of K fertilizer should be carried out first. From the perspective of provinces, Shanghai had the highest P fertilizer efficiency, followed by Guizhou and Qinghai; meanwhile, Fujian had the lowest. Heilongjiang had the highest N fertilizer efficiency, followed by Jiangxi and Xizang, but Shaanxi had the lowest. Qinghai had the highest K fertilizer efficiency, followed by Sichuan and Shanghai, while Fujian had the lowest. Overall, the RFPs of N, P and K in the eastern region were lower than those in the central and the western regions of China.
FAEs of 30 provinces of China were measured according to Equation (3). In 2019, two provinces of Qinghai and Heilongjiang had very high FAE with values of 0.93 and 0.90, respectively; four provinces had high FAE; four provinces had medium FAE; and 20 provinces had low and very low FAE, the lowest value being 0.44 (Table 1). In general, the FAEs in China in 2019 were at a low efficiency level, with an average of 0.65.
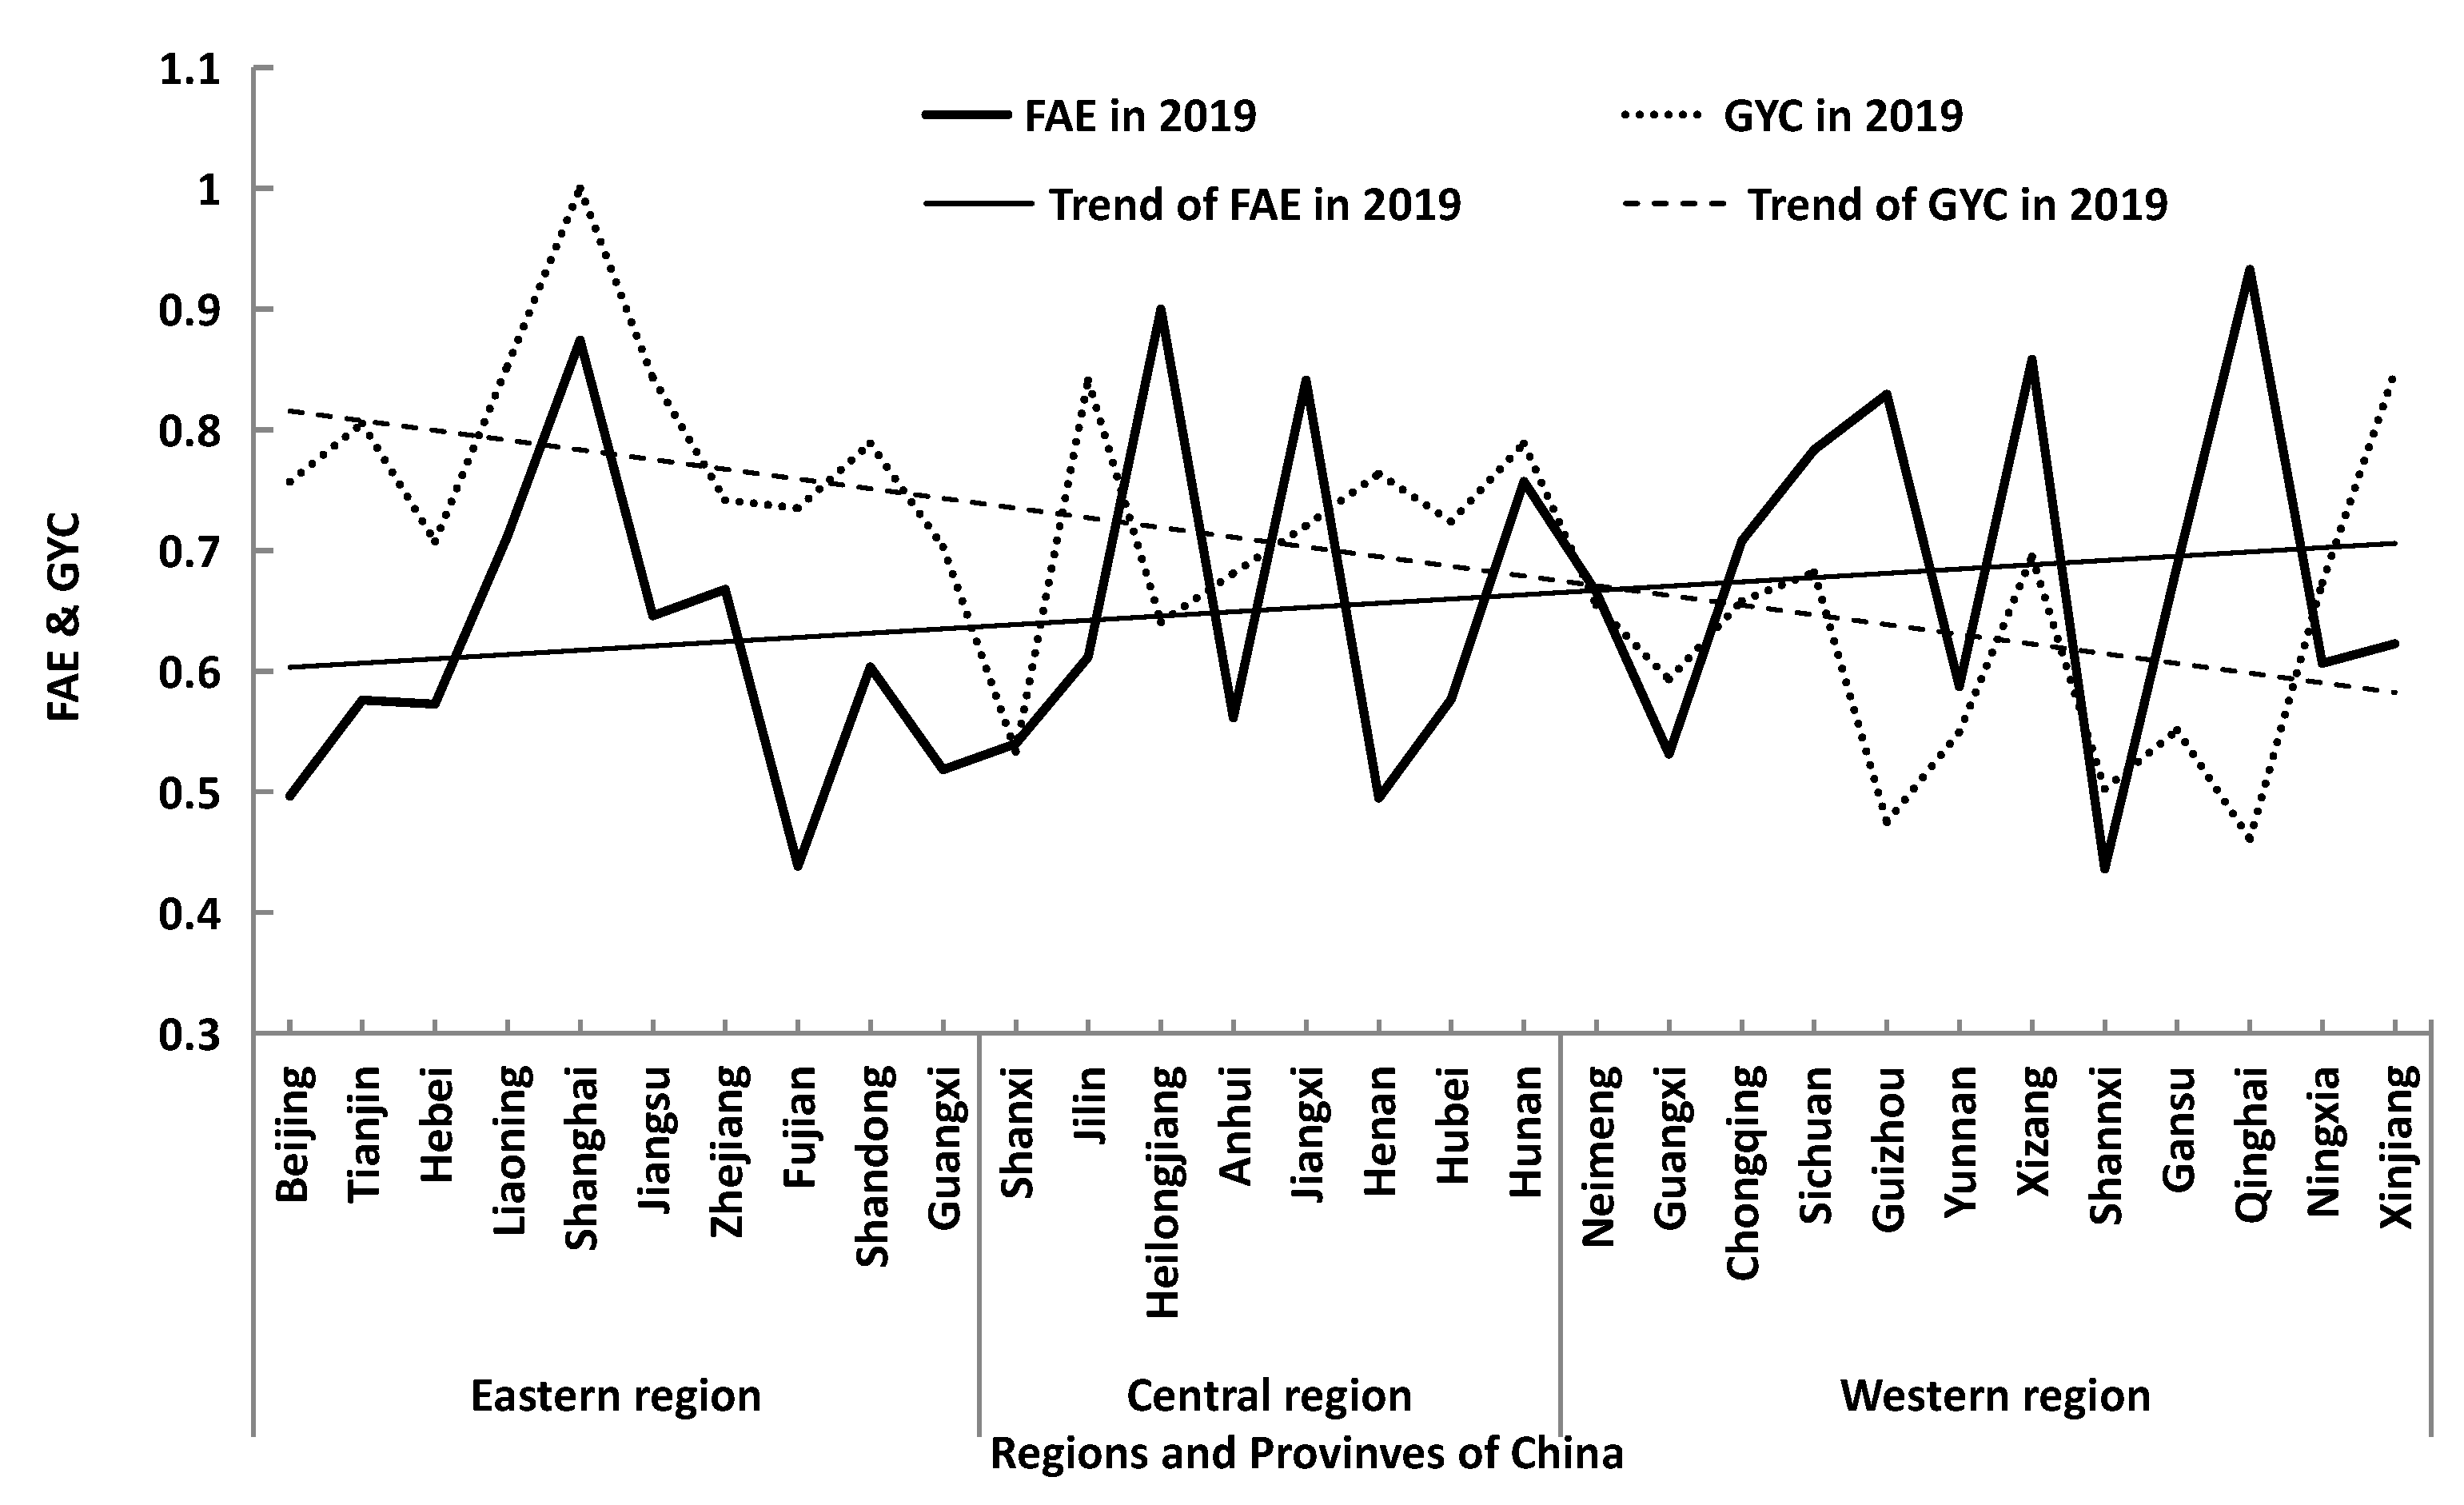
The FAEs of three regions of China increased from the eastern to the western regions, mainly due to the corresponding decrease of FIs from east to west (Figure 1), which played a leading role in the regional change of FAE.

3.1.3. Regional Differences of FIE in China

FAE is a kind of net efficiency, which only reflects the comparative relationship between fertilizer input and grain output, without considering the impact of grain yield scale [14]. Grain yield scale can be expressed by grain yield coefficient (GYC). The larger the coefficient, the higher the grain yield. The FAE was higher in western China in 2019, where the GYC was relatively lower, while the contrary is the case in eastern China. For example, the FAE of Qinghai Province was the highest in China, but the grain yield was the lowest (Figure 3). This showed that the FAE cannot really reflect the real or final purpose of chemical fertilizer use in grain production. Therefore, to accurately indicate fertilizer use efficiency and its spatial variation law in China, the GYC of 30 provinces was calculated by using Equation (5) (Figure 3). Then the FIE for each was obtained by using Equation (4) (Table 2).
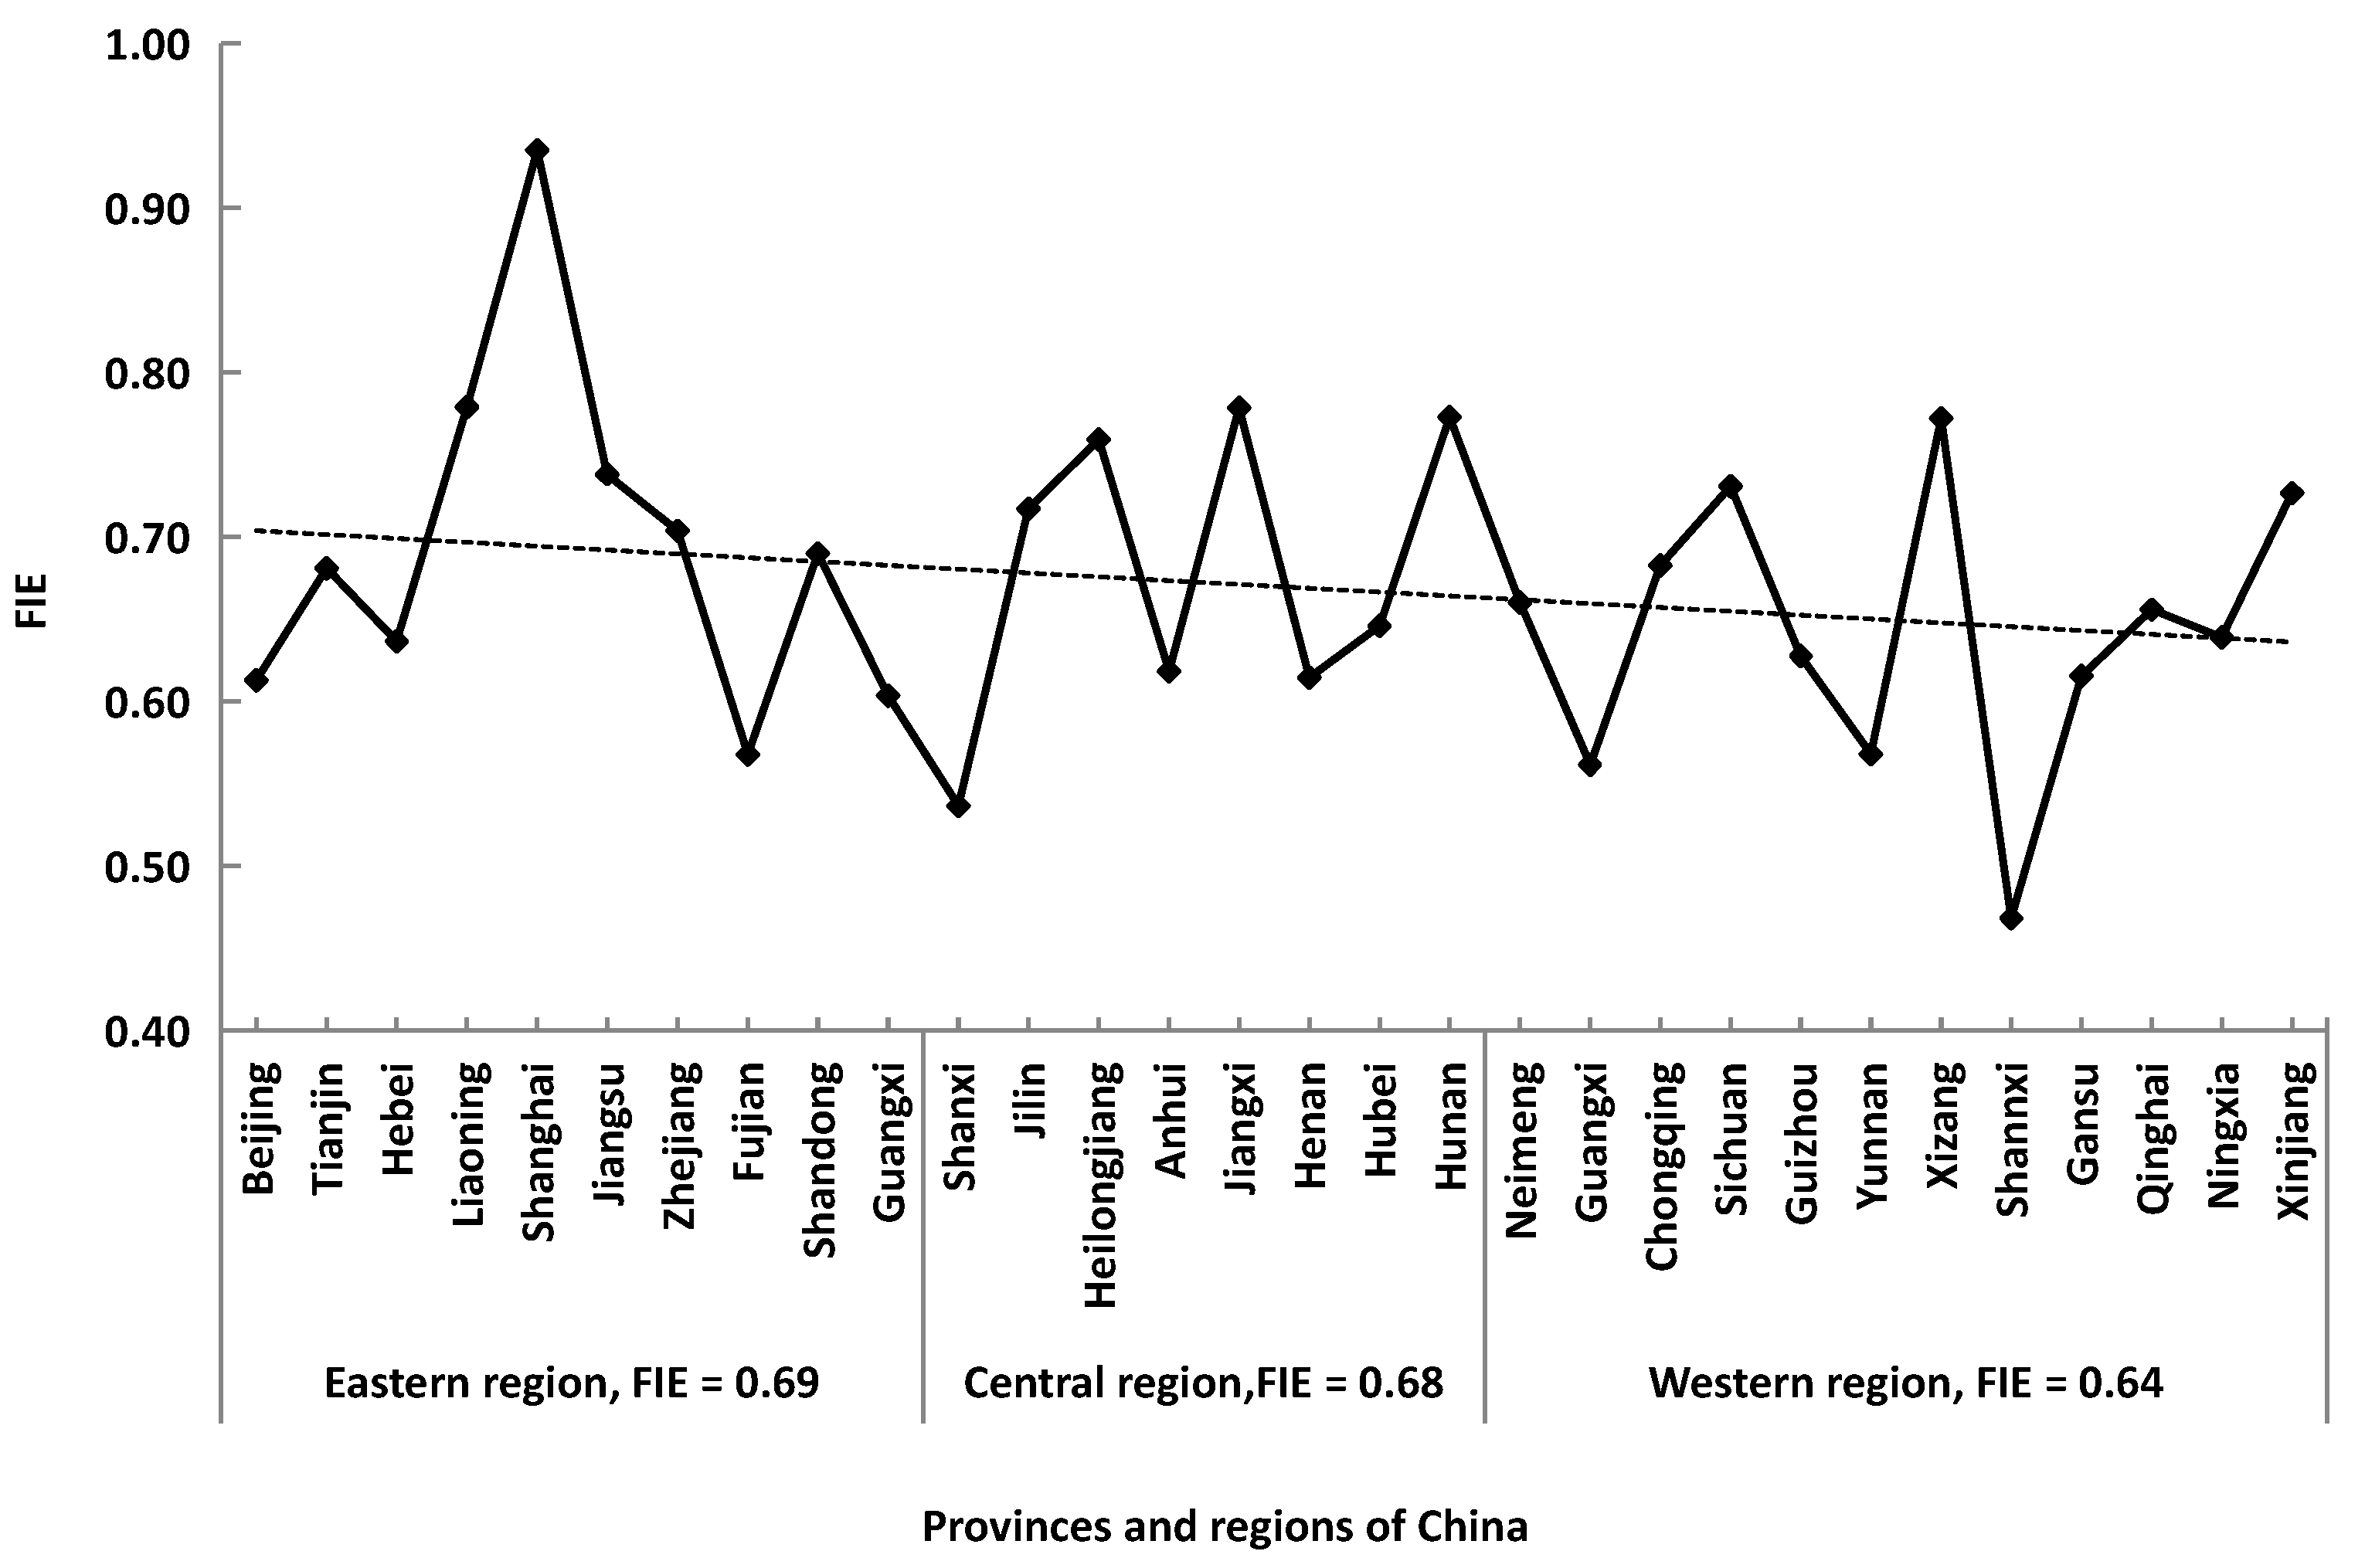
In 2019, Shanghai was at very high level of FIE among the 30 provinces in China, but there were no provinces at high level. There were 10 provinces at medium level, 14 provinces at low level, and five provinces at very low level: Yunnan, Fujian, Guangxi, Shanxi and Shaanxi. The average FIE of China was 0.67, which was a low level efficiency, like the FAE. In general, the FIE tended to decrease from east to west mainly due to the effect of GYC. On average, values of FIEs for the three regions had little difference, from 0.69 to 0.64, but there were obvious fluctuation within each region (Figure 4). The highest FIEs in the eastern, central and western region were 0.94 for Shanghai, 0.78 for Jiangxi and 0.77 for Xizang, respectively. By contrast, the lowest FIEs in these three regions were 0.57 for Fujian, 0.54 for Shanxi and 0.47 for Shannxi, respectively.
There may be two reasons for the high FIE in the East and the low FIE in the west of China. The first one is the social and economic development. The eastern region has a high level of social and economic development, including a high level of agricultural technology and production intensification. Therefore it used less chemical fertilizer and achieved more grain output. Meanwhile, the central and western regions have a low level of social and economic development and rely more chemical fertilizer input to increase grain output, resulting in the loss and waste of chemical fertilizer to a certain extent. The second reason is the natural conditions. The eastern region has good water conditions, which is helpful for the utilization of chemical fertilizer. By contrast, the western region suffers from a poor natural environment and serious soil erosion, which is not conducive to the absorption and utilization of chemical fertilizer, resulting in low fertilizer use efficiency [4].

3.2. Key Factors Influencing Fertilizer Efficiency in China

There are many factors affecting fertilizer use efficiency in China. The previous studies have provided different alternatives [4,22]. Referencing relevant literature and considering the availability of data, there are eight indicators selected in the present study as the influencing factors on chemical fertilizer use efficiency for gray relational analysis (Table 3).
In fact, the FI of China reached a peak in 2014, then it decreased due to the movement towards fertilizer reduction. In order to increase the reliability, two year average FIEs of 30 provinces in 2014 and 2019 as the reference sequence and the corresponding average values of eight influencing factors illustrated in Table 3, as the comparison sequences were brought into the gray correlation analysis to find out the key factors affecting China’s fertilizer use efficiency.
According to Equations (6)–(9), the Gray correlation degrees of eight influencing factors were obtained after four negative factors, UR, FIL, DAR, and DDR, were treated as positive indicators. The top five influencing factors were DAR, PAR, DDR, EIR and FIL in rank order from high γi to low, which were determined as the five main influencing factors because their CW is more than 65% (Table 4). In order to confirm the reliability of the Gray correlation analysis, Pearson correlation analysis was also conducted between FIE and the eight influencing factors. The first five influencing factors (i.e., EIR, MCI, DAR, PAR and DDR) with the largest Pearson correlation coefficients passed the 5% or 10% significance test (Table 4). They were also considered as the five main influencing factors in the Pearson method, while the DAR and DDR showed as negative. Therefore, the common influencing factors in these two methods can be confidently considered as key. They were DAR, PAR, DDR and EIR, of which PAR and EIR have positive effects on the FIE, and the DAR and DDR are negative.

4. Discussion

Generally speaking, chemical fertilizers in China’s agriculture are now overused and it is an urgent task for China to reduce the FI and increase fertilizer use efficiency, realizing negative growth for chemical fertilizer use. Therefore, it is essential to recommend farmers the appropriate amount of fertilizer use in grain production. At present, the common methods to determine appropriate FI include the fertilizer effect function method, nutrient balance method and the method based on plant or soil testing [29]. These methods need to spend a lot of money and time on field trails and soil and plant sample tests. Based on the characteristics of decentralized land management of households in China, Zhu [30] believed that, in a certain region, the soil-climate condition, agro-economic condition and gain yields are relatively consistent and the average appropriate FI of this region, which is obtained through a large number of field experiments, can be used to replace the appropriate FI of each field. There is a little difference between the yields obtained by average FI for the region and those obtained by appropriate FI for each field. Ju X. [31] believed that the appropriate FI depends on the target yield (TY) of crops, with which a model of appropriate FI was built. The TY comprehensively reflects the agricultural production condition of each field. Farmers are most familiar with the target yield of their own fields, which is a relatively reliable reference for the recommendation of appropriate FI. Determining the appropriate FI according to the TY of grain crops, fertilizers are neither wasted nor insufficient. Base on the Soil Testing and Formulated Fertilization Program (STFFP) implemented since 2005 [32], the Chinese government yearly releases guidance on scientific fertilization of main crops (such as wheat, rice, maize, potato and bean) of the country, and the local government will give more specific recommendations for fertilizer usage according to the local situation. For example, rice and wheat are the first two main crops in China, and the Minastry of Agriculture and Rural Affairs of China gave some recommendations about their FIs (Table 5) in 2021 [33]. It is very convenient and helpful for local government, agricultural technology extension workers and farmers to use fertilizer efficiently.
The different proportion of N, P and K chemical fertilizer use will inevitably affect the efficiency of fertilizer use in crop growth. The model of FAE constructed in this study not only considers the quantity of fertilizers used, but also the types, which is helpful in analyzing the efficiency of individual fertilizers. Therefore, the FAE model provides a simple method to calculate the relative efficiency of various fertilizer inputs, especially when the dimensions of fertilizer types are inconsistent [11].
FAE reflects the relative efficiency of fertilizer use, which is equivalent to the fertilizer technical efficiency (FTE) in data envelopment analysis (DEA). In order to prove the feasibility of the FAE model, the calculation for China’s 30 provincial FTE in 2019 were conducted by the method of DEA. It was found that the results obtained by the two methods were very close: their Pearson correlation coefficient was 0.99, the average values of two methods were 0.65 and 0.66, and the liner trends of the two group data coincided (Figure 5). It can be seen in Figure 5 that the fluctuation of FAE values is relatively stable; especially, Shanghai, Heilongjiang and Qinghai provinces with FTE of 1 in DEA analysis are also distinguished in this study. This indicates that the FAE model in the present study is reasonable.
The FIE model simultaneously considers the net efficiency of chemical fertilizer input and the scale of grain yield output, which is convenient to distinguish the situation of the same chemical fertilizer productivity with different output scales. This is similar to that of DEA method not only considering the pure TE but also the scale of output, and the improvement of super-efficiency DEA from traditional DEA, to identify some decision-making units whose technical efficiencies are equal to 1 [34,35]. The calculation results of the FIE model comprehensively reflect the effect of chemical fertilizer utilization, which is in line with the actual situation of chemical fertilizer use and grain production in China. In 2019, the regional FIE change trend of East (0.69) > Middle (0.68) > West (0.64) of China is basically consistent with of Wang et al.’s results on China’s technical efficiency for chemical fertilizer [4], but there is a great difference between their values of efficiency. The average value of chemical fertilizer technical efficiency in China by Wang et al. from 2015 to 2017 is about 0.15–0.35, which seems too low. This may be due to the different selection of variables and research methods. The data selected by Wang et al. are the panel data of the 28 provinces (excluding Hainan, Xizang, Hong Kong, Macao and Taiwan) of China from 1991 to 2017. Four indicators are selected as input variables: total agricultural chemical fertilizer used, number of agricultural employees, crop sowing area, total power of agricultural machinery, in addition to the total output value of agriculture as the output variable. In the present study, the FIs of N, P and K in 2019 were selected as three input variables and the grain yield data was used as the output variable. The results for fertilizer use efficiency are not disturbed by other factors, so it is a more convenient method with which to characterize fertilizer use efficiency. The FIE of China in 2019 was 0.67, which was basically consistent with the results of Cai and Tao’s study [36] whose average fertilizer use efficiency of China from 1998 to 2017 was 0.65 using the SFA method, and the regional differences of efficiency from East, Middle to West were 0.65, 0.69, 0.62, respectively. Generally speaking, the efficiency of agricultural chemical fertilizer use in China at present is at a low level. Under the condition that other inputs in grain production in China remain unchanged, the fertilizer reduction potential would reach 33% without lowering the established output. Based on the natural conditions and economic development conditions in China, the regional differences of chemical fertilizer use efficiency with the trend of eastern region > central region > western region illustrated in the present study are more reasonable.
The four key factors of DAR, PAR, DDR and EIR in the present study which influence the FIE, could be generalized into population aging, natural disaster and effective irrigation. These mechanisms to affect fertilizer use efficiency should be explored. Population aging is the inevitable trend of China’s social development and human civilization progress. According to the sixth census of China, China’s rural population over the age of 60 is about 99.3 million, accounting for 56% of the country’s elderly population. It can be seen that population aging in rural area is more serious than that in urban areas. Moreover, the population aging in the eastern region is greater than that in the central region, and that in the central region is greater than that in the western region [37]. It is predicted that the population over 60 years old in China will increase by 12 million annually from 2020 to 2040 and population aging in rural areas will become more serious in future [38]. The aging population has a positive correlation with the efficiency of chemical fertilizer use. It seems that the older the agricultural labors are, the more experience they have, and they will pay more attention to intensive cultivation, which is conducive to the increase of chemical fertilizer use efficiency [23]. However, Li and Ma [39] and Cai et al. [6] believe that the aging population is not helpful for the increase of fertilizer use efficiency. The reason is that the older the farmers, the lower their physical strength and willingness to accept new fertilizer-saving technologies. They will not easily change the habit and behavior of increasing material inputs to maintain high output. Therefore the older farmers dislike actively reducing the amount of fertilizer use.
On the surface, the two opposite opinions above on the positive and negative effects of older laborers on fertilizer use efficiency are reasonable. In fact, the essence of population ageing impact on fertilizer use efficiency is that, with the development of urbanization, more and more rural young and middle-aged laborers increasingly go out to work in cities and the cultivated land area per capita in rural areas is significantly increased. The elders are not suitable for heavy agricultural production, either physically or mentally. More and more families transfer their lands to young and middle-aged farmers or agricultural production institutions, which promotes intensive agricultural production, which adapts to the wide application of modern agricultural machinery and technology, conducive to the reduction in labor and fertilizer input to improve agricultural production and fertilizer use efficiency. This can make up for the shortage of agricultural labors under the background of China’s aging population. This analysis is helpful to clarify the debate on the positive or negative effects of population aging on fertilizer use efficiency to a certain extent.
China is one of the countries prone to natural disasters [40], which have a significant negative impact on fertilizer use efficiency. It seems that farmers will choose to sow again after suffering from natural disasters, or would like to invest more chemical fertilizers to make up the loss of output caused by disasters [41]. Therefore natural disasters result in excessive use of chemical fertilizer and reduce fertilizer use efficiency. Drought and flood are the main natural disasters affecting crop yield in China. Especially, drought imparts greater impacts on large areas of China and has more frequent occurrence in western and central regions, becoming the main restrictive factor for China’s agricultural stability and food security [42]. This also proves that effective irrigation has a significant positive impact on the efficiency of chemical fertilizer use.
Therefore, in order to reduce the excessive use of chemical fertilizer use for the controlling of non-point source pollution and for developing sustainable agriculture in China, it is important to grasp the key influencing factors and take different measures in different areas according to local conditions. First of all, the eastern region should further promote agricultural intensification, accelerate the process of agricultural mechanization, strengthen agricultural technology training for young farmers and the cultivation of agricultural scientific and technological talents, and effectively solve the problem of labor shortage caused by population aging. At the same time, optimized agricultural intensification should be paid more attention to in the east. That is, intensive agriculture should be developing towards green, low carbon and intelligent methods and at an appropriate scale, which makes full use of resources, such as livestock manure and straw, and be constructed as an intelligent high-tech modern ecological agriculture supported by networking, big data, robotics and other technologies. The central and western regions should pay more attention to strengthening the construction of farmland water conservancy and other infrastructures, and develop scientific water management technologies, such as drip irrigation, sprinkler irrigation, anti-seepage and other water-saving irrigation technologies. This will provide good growth conditions for crops, effectively resist the impact of drought on grain production and improve the efficiency of chemical fertilizer use for the win–win development of agricultural ecology and economy. Secondly, all provinces in China, especially in the central and eastern regions, should improve the disaster prevention and reduction system further. This includes disaster prediction and early warning, formulation of disaster emergency plans, disaster relief, post-disaster recovery and reconstruction, etc. Due to the higher risk of agricultural natural disasters in China, the government should gradually establish and improve the agricultural insurance system to make up for the losses caused by natural disasters to ensure the enthusiasm of farmers in grain production. Furthermore, the research institutes should continue to develop and cultivate new anti-disaster crop varieties that are resistant to drought, flood, insects or freezing for the upgrading of the disaster resistance of crops to reduce the losses caused by natural disasters.

5. Conclusions

The chemical fertilization intensity in China’s eastern and central regions at the present is generally high and excessive, exceeding the internationally recognized safety upper limit of 225 kg ha−1. Most provinces in the western region have insufficient chemical fertilizer use. The inter-provincial differences in FI in the eastern region is small, but bigger in the central and western regions. In 2019, the FIE in the eastern, central and western regions was 0.69, 0.68 and 0.64, respectively, all of which belonged to the low efficiency level, with an average of 0.67. This implies that the increase of chemical fertilizer use efficiency or the reduction of chemical fertilizer amount has a potential of approximately 33% with current grain yield and other inputs unchanged.
Population aging (resulting in agricultural intensification), effective irrigation and natural disasters are the key factors affecting the chemical fertilizer use efficiency of China. More and more families transfer their croplands to young and middle-aged farmers or agricultural production institutions because of population aging, which promotes intensive agricultural production and is conducive to increasing the fertilizer use efficiency. Developments in effective irrigation and anti-disaster technologies are also important for the reduction of chemical fertilizer use. Based on these key influencing factors, various areas should pay different attention to them for the reduction of fertilizer use and the sustainable development of China’s agriculture.

Author Contributions

Original draft, methodology, review and editing, Q.L.; review and editing and data curation, W.T.; review and data curation, L.P. and L.Z. All authors have read and agreed to the published version of the manuscript.

Funding

This work was supported by the National Natural Science Foundation of China (Grant No. 42171245), the National Social Science Foundation of China (Grant No. 20BJY201), and the Program of Environmental Science and Engineering Key Discipline of Nanjing City, China (2021–2025).

Institutional Review Board Statement

Not applicable.

Informed Consent Statement

Not applicable.

Data Availability Statement

All the data used in this study is public.

Conflicts of Interest

The authors declare no conflict of interest.

References

  1. National Bureau of Statistics of China. National Data. Available online: http://data.stats.gov.cn/ (accessed on 1 January 2021).
  2. Zhang, Y.; Liu, W.Z. Analysis and prospects of the green evolution of Chinese farmer’s fertilization policy. Agric. Outlook 2020, 16, 25–29. [Google Scholar]
  3. Liu, Q.P.; Pu, L.J. Comparation of fertilizer allocation and integrated efficiency between China and major developed countries. Soil Fertil. Sci. China 2021, 6, 328–335. [Google Scholar]
  4. Wang, P.P.; Han, Y.J.; Zhang, Y. Characteristics of change and influencing factors of the technical efficiency of chemical fertilizer use for agricultural production in China. Resour. Sci. 2020, 42, 1764–1776. [Google Scholar] [CrossRef]
  5. Yu, L.X.; Zhang, B.; Bai, X.G. Technical efficiency of apple production on Loess Plateau and its influencing factors. J. Arid. Land Resour. Environ. 2018, 32, 68–74. [Google Scholar]
  6. Cai, X.Y.; Zhang, J.B.; Wang, X. Land fragmentation, cognition of land quality, and efficiency of fertilizer application: Based on a survey data of rice growers in Hubei Province. Res. Agric. Mod. 2021, 42, 869–879. [Google Scholar]
  7. Shi, C.L.; Zhu, J.F.; Luan, J. Analysis of wheat chemical fertilizer input efficiency and its influencing factors in China—Based on the 15 major wheat producing provinces in China. Agric. Technol. Econ. 2015, 69–78. [Google Scholar] [CrossRef]
  8. Cai, R.; Chen, P. Does agricultural machinery service improve fertilizer input efficiency: Take wheat as example. J. China Agric. Univ. 2021, 26, 265–274. [Google Scholar]
  9. Zhu, N.; Ma, J. Measure of chemical fertilizer utilization rate in grain production and its determinants. J. Technol. Econ. 2014, 33, 91–96. [Google Scholar]
  10. Zhang, B.; Bai, X.G. Fertilizer use efficiency and its affecting factors in apple production in Loess Plateau. J. Arid. Land Resour. Environ. 2017, 31, 55–61. [Google Scholar]
  11. Liu, Q.; Wu, T.Y.; Tu, W.; Pu, L. Analysis on the changes of fertilization intensity and efficiency in China’s grain production from 1980 to 2019. J. Sci. Food Agric. 2022. [Google Scholar] [CrossRef] [PubMed]
  12. Liu, Q.; Wu, T.Y.; Pu, L.; Sun, J. Comparison of fertilizer use efficiency in grain production between developing countries and developed countries. J. Sci. Food Agric. 2022, 102, 2404–2412. [Google Scholar] [CrossRef]
  13. Zhou, F.; Jin, S.T. International Comparison of agricultural fertilizer utilization rate from the perspective of productivity. World Agric. 2016, 4, 35–44. [Google Scholar]
  14. Zhang, F.S.; Wang, J.Q.; Zhang, W.F.; Cui, Z.L.; Ma, W.Q.; Chen, X.P.; Jiang, R.F. Nutrient use efficiencies of major cereal crops in China and measures for improvement. Acta Pedol. Sin. 2008, 45, 915–924. [Google Scholar]
  15. Liu, Q.; Sun, J.; Pu, L. Comparatively analysis on fertilization intensity and integrated efficiency in China and Euro-American major countries in 1961—2017. Trans. Chin. Soc. Agric. Eng. (Trans. CSAE) 2020, 36, 9–16. [Google Scholar]
  16. Tu, Z.G. The coordination of industrial growth with environment and resource. Econ. Res. J. 2008, 2, 93–105. [Google Scholar]
  17. Dong, W.; Zeng, J.; Wang, Q.; Jiang, X.; Huang, T. Exploration of the profile-effect relationship of Siraitia grosvenorii aqueous extracts related to their laxative effect on the basis of gray correlation analysis. BMC Complement. Med. Ther. 2021, 21, 235. [Google Scholar] [CrossRef]
  18. Zhang, S.H.; Huang, G.Y.; Zhang, Y.F.; Li, B.J. Screening of key grain production technologies based on gray relational analysis. J. Henan Agric. Univ. 2021, 55, 356–363. [Google Scholar]
  19. Song, D.P.; Zuo, Q.; Liu, B.S.; Zou, G.Y.; Liu, D.S. Estimation of spatio-temporal variability and health risks of nitrogen emissions from agricultural non-point source pollution: A case study of the Huaihe River Basin, China. J. Agro-Environ. Sci. 2018, 37, 1219–1231. [Google Scholar]
  20. Liu, X.Y. Study on Nutrients Balance and Requirements in Agricultural Production in China; Chinese Academy of Agricultural Science: Beijing, China, 2018; p. 96. [Google Scholar]
  21. FAO. FAOSTAT. Data. Available online: http://www.fao.org/faostat/en/#data (accessed on 1 January 2022).
  22. Wang, S.G.; Liu, Y.; Tian, X.; Yan, B.J. The Estimation of fertilizer use efficiency in agriculture and the improving ways. J. Environ. Econ. 2017, 3, 101–114. [Google Scholar]
  23. Wang, Z.Y.; Li, G.C.; Zhou, X.S. Structure change of rural labor force, grain production and fertilizer using efficiency promotion: An empirical study based on stochastic frontier production function and Tobit model. J. China Agric. Univ. 2018, 23, 158–168. [Google Scholar]
  24. Pan, D. The Spatial-temporal difference of driving effects for fertilizer use intensity change and its determinants in China. Econ. Geogr. 2014, 34, 121–126. [Google Scholar]
  25. Yang, Z.X.; Han, H.Y. Technical efficiency of fertilizer and its influencing factors: Based on wheat and corn empirical study. J. China Agric. Univ. 2011, 16, 140–147. [Google Scholar]
  26. Zhao, H.Y.; Zhang, Q.w.; Zhou, X.K. Temporal and spatial characteristics of drought in China under climate change. Chin. J. Agrometeorol. 2021, 42, 69–79. [Google Scholar]
  27. Du, X.D.; Jin, X.B.; Yang, X.L.; Yang, X.H.; Xiang, X.M.; Zhou, Y.K. Spatial-temporal pattern changes of main agriculture natural disasters in China during 1990–2011. J. Geogr. Sci. 2015, 25, 387–398. [Google Scholar] [CrossRef]
  28. Cao, Y.Q.; Feng, X.X.; Wang, F.; Qi, J.W. Effects of agro-meteorological disasters on the yield of main grain crops in Liaoning Province. J. Catastrophol. 2020, 35, 1–7. [Google Scholar]
  29. Zhao, Y.N.; Xu, X.; Sun, X.M.; Yan, J.Y.; Huang, Y.F.; Ye, Y.L. GIS-based NPK recommendation and fertilizer formulae for wheat production in different regions of Henan Province. J. Plant Nutr. Fertil. 2021, 27, 938–948. [Google Scholar]
  30. Zhu, Z.L. On the methodology of recommendation for the application rate of chemical fertilizer nitrogen to crops. Plant Nutr. Fertil. 2006, 12, 1–4. [Google Scholar]
  31. Ju, X.T. Improvement and validation of theoretical N rate (TNR)----discussing the methods for N fertilizer recommendation. Acta Pedol. Sin. 2015, 52, 249–261. [Google Scholar]
  32. Sun, Z.; Li, X. Technical efficiency of chemical fertilizer use and its influencing factors in China’s rice production. Sustainability 2021, 13, 1155. [Google Scholar] [CrossRef]
  33. Department of Planting Management, Minastry of Agriculture and Rural Affairs of China. Guidance on Scientific Fertilization of Main Crops in Spring of 2021. Available online: http://www.moa.gov.cn/gk/nszd_1/2020/202002/t20200226_6337754.htm (accessed on 5 May 2022).
  34. Yang, L.; Ouyang, H.; Fang, K.; Ye, L.; Zhang, J. Evaluation of regional environmental efficiencies in China based on super-efficiency-DEA. Ecol. Indic. 2015, 51, 13–19. [Google Scholar] [CrossRef]
  35. Tone, K. A slacks-based measure of efficiency in data envelopment analysis. Eur. J. Oper. Res. 2001, 130, 498–509. [Google Scholar] [CrossRef] [Green Version]
  36. Cai, R.; Tao, S.M. Spatial difference and dynamic change of agricultural fertilizer input efficiency in China. J. Huazhong Agric. Univ. (Soc. Sci. Ed.) 2020, 6, 57–66. [Google Scholar]
  37. Ke, Z.J.; Deng, H.H. Analysis on regional differences and convergence of population aging in China. Stat. Decis. Mak. 2021, 19, 68–71. [Google Scholar]
  38. Wang, X.Q. Current situation of rural population aging and its impact on agricultural economy. World Trop. Agric. Inf. 2021, 11, 85–86. [Google Scholar]
  39. Li, K.Q.; Ma, D.D. On the investment behavior and decision mechanism of farmers’ fertilizer reduction in ecologically vulnerable regions: Taking 421 households in 4 counties of Shanxi Province as an example. J. Nanjing Agric. Univ. (Soc. Sci. Ed.) 2018, 18, 138–145. [Google Scholar]
  40. Xu, X. “One belt and one road” cooperation in disaster prevention and mitigation: Challenges and responses. Int. Stud. 2017, 1, 33–43. [Google Scholar]
  41. Zhang, F.; Hu, H. Study on farmer’s chemical fertilizer input behavior and non-point source pollution. Acta Agric. Jiangxi 2012, 24, 183–186. [Google Scholar]
  42. Long, F.; Yang, C.Y.; Peng, L.L. An empirical analysis of the impact of natural disasters on grain production in China: Taking rice as an example. Chin. Rural. Econ. 2011, 5, 33–44. [Google Scholar]
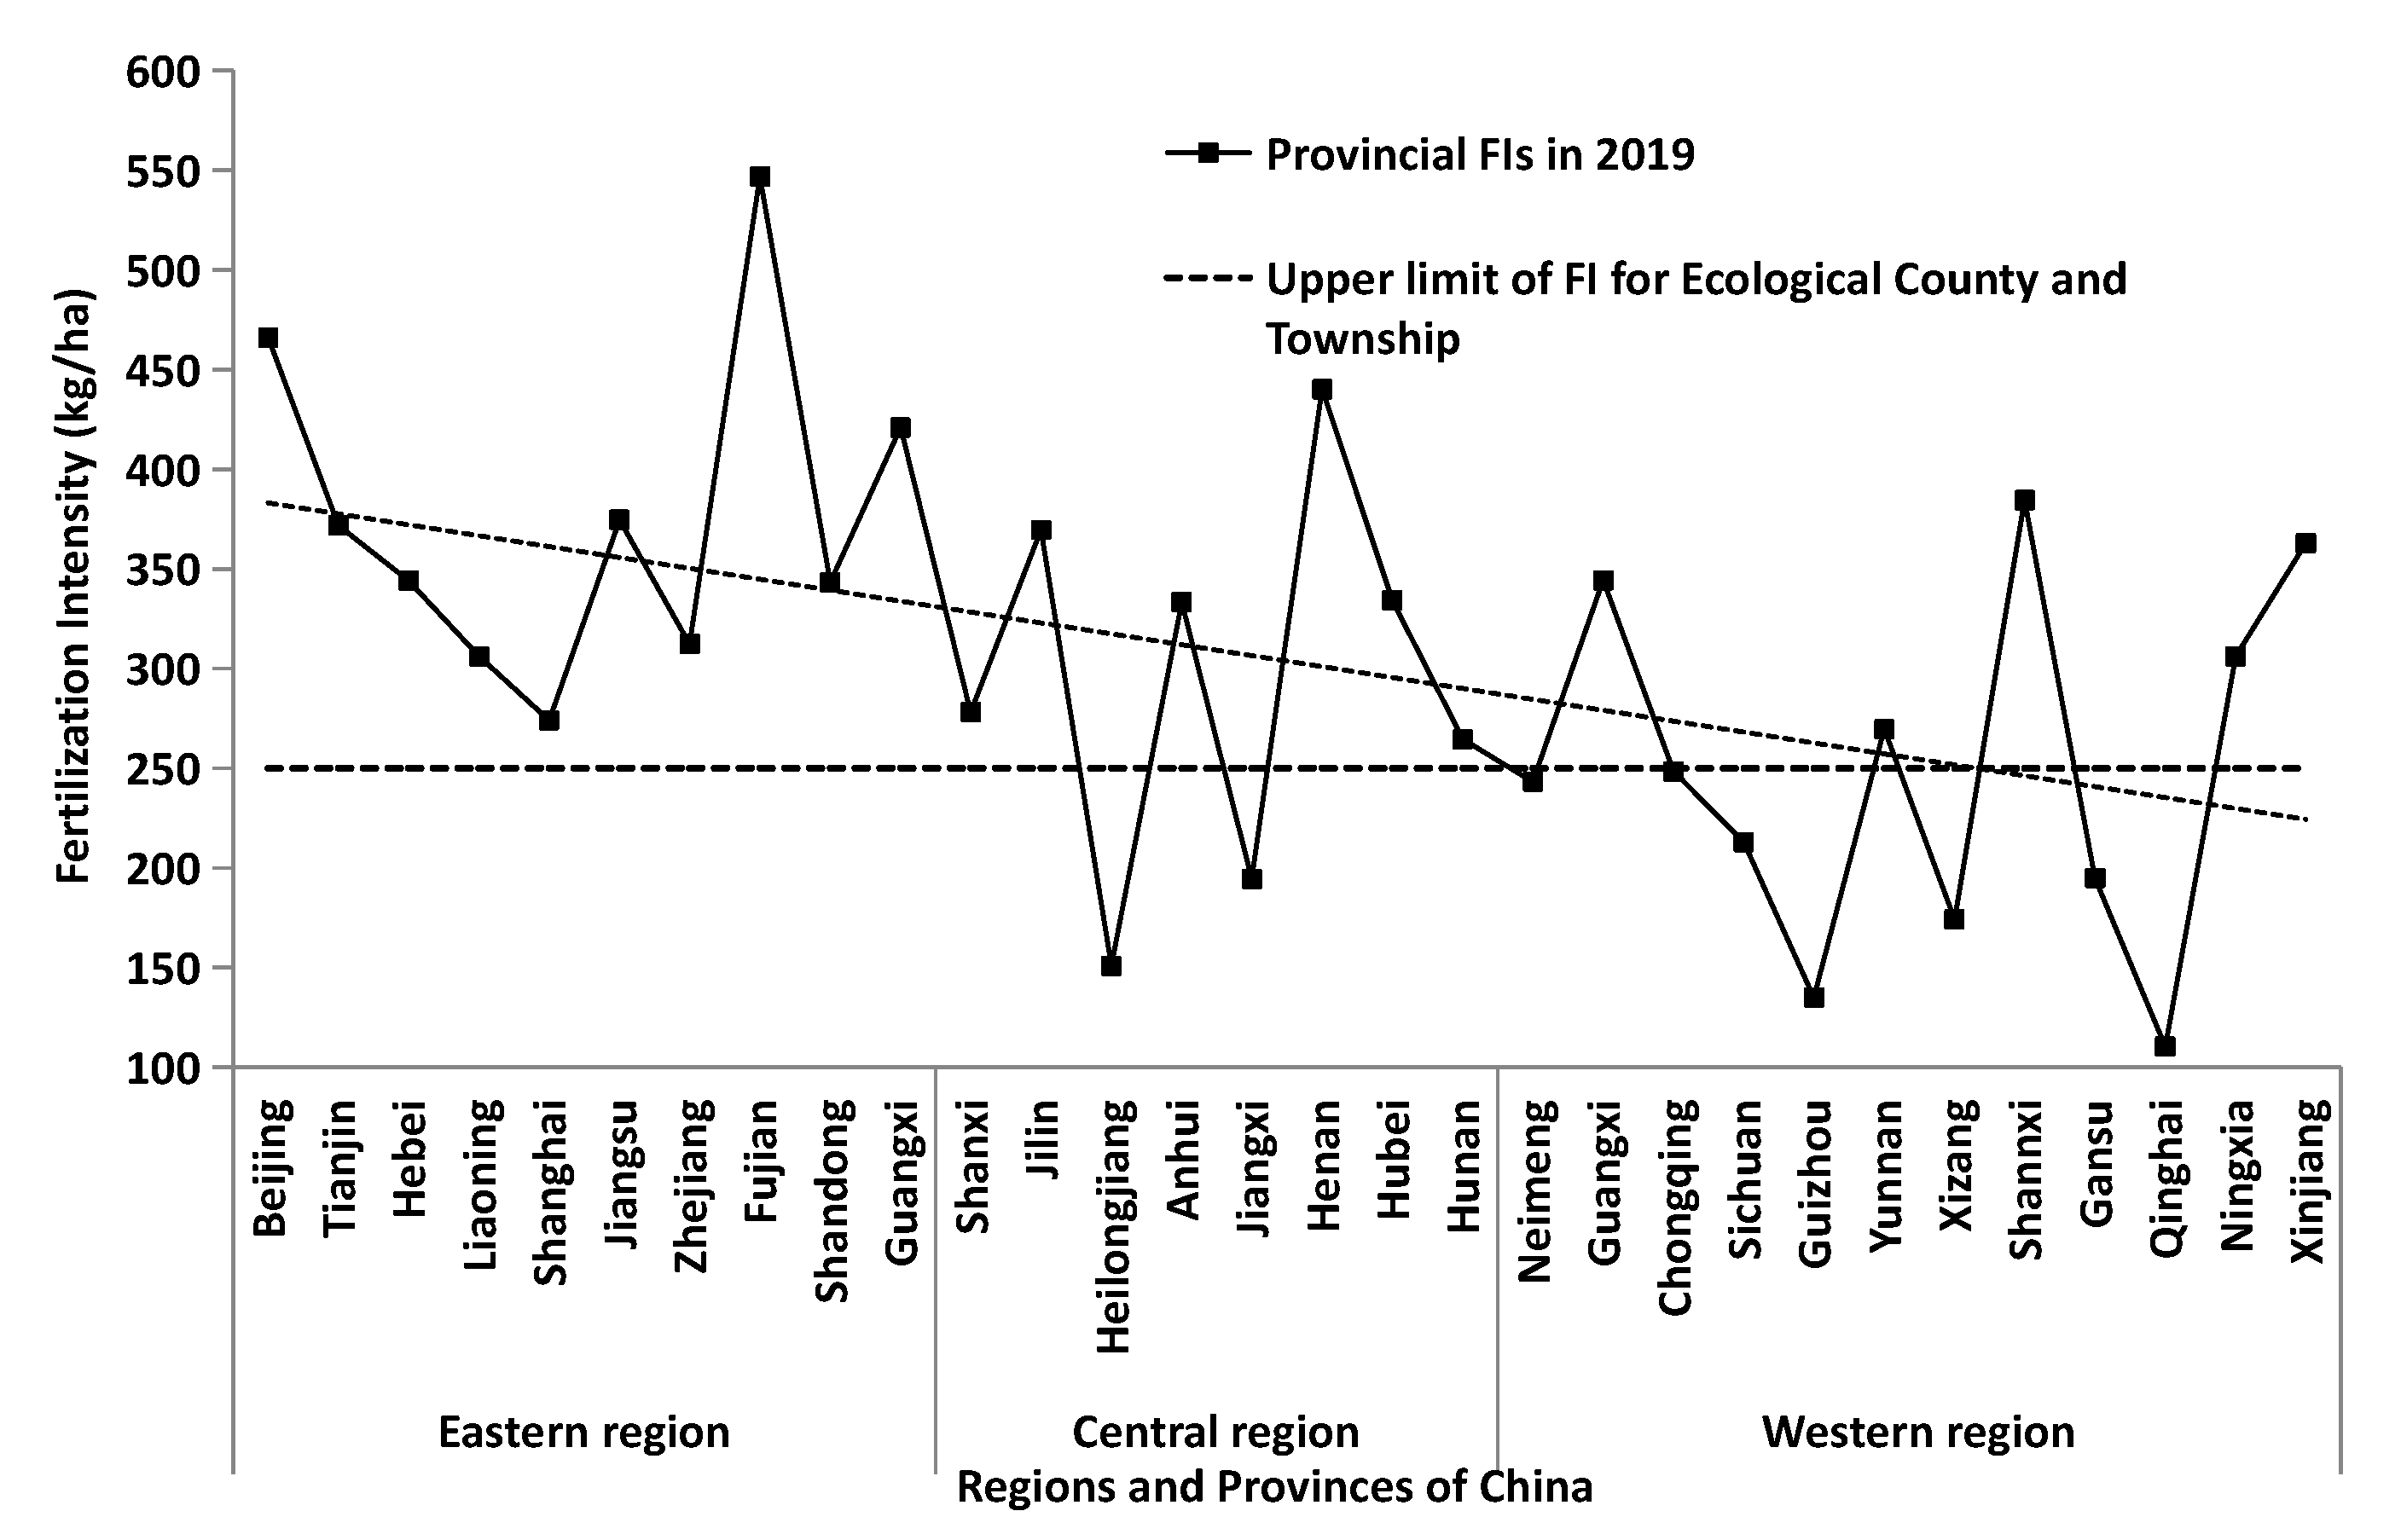
Figure 1. Differences in chemical fertilization intensity (FI) among provinces in Eastern, Central and Western China in 2019.
Sustainability 14 12974 g001
Figure 2. Differences in relative fertilizer productivity (RFP) for N, P and K fertilizers among provinces in eastern, central and western Regions of China in 2019.
Sustainability 14 12974 g002
Figure 3. Differences of FAE and GYC among provinces in eastern, central and western regions of China in 2019.
Sustainability 14 12974 g003
Figure 4. Differences of FIE among provinces in eastern, central and western regions of China in 2019.
Sustainability 14 12974 g004
Figure 5. Comparison between the values of FAE of China’s 30 provincial fertilizer use in 2019 in this study and the corresponding values by DEA method.
Sustainability 14 12974 g005
Table 1. FAEs of 30 provinces of China in 2019.
Prov.QinghaiHeilongjiangShanghaiXizangJiangxiGuizhouSichuanHunanLiaoningChongqing
FAE0.930.900.870.860.840.830.780.670.710.71
Type
Prov.GansuZhejiangNeimengJiangsuXinjiangJilinNingxiaShandongYunnanHubei
FAE0.690.670.670.650.620.610.610.600.590.58
Type
Prov.TianjinHebeiAnhuiShanxiGuangxiGuangdongBeijingHenanFujianShannxi
FAE0.580.570.560.540.530.520.50.490.440.44
Type
Table 2. The FIE of 30 provinces of China in 2019.
Prov.ShanghaiLiaoningJiangxiHunanXizangHeilongjiangJiangsuSichuanXinjiangJilin
FIE0.940.780.780.770.770.760.740.730.730.72
Type
Prov.ZhejiangShandongChongqingTianjinNeimengQinghaiHubeiNingxiaHebeiGuizhou
FIE0.700.690.680.680.660.660.650.640.640.63
Type
Prov.AnhuiGansuHenanBeijingGuangdongYunnanFujianGuangxiShanxiShannxi
FIE0.620.620.610.610.600.570.570.560.540.47
Type
Table 3. Factors influencing chemical fertilizer use efficiency in China’s grain production.
FactorsExpressionsDefinitionThe Presumed Direction of Influence
PARPopulation aging rateIt indicates the level of social and economic development and is conducive to the intensification of agricultural production.Positive [23]
URUrbanization rateIt is the proportion of urban population to total populationNegative [4,24]
FILFarmer income levelIt is expressed as RMB Yuan per capita of farmers’ disposable income.Positive or Negative [25]
MCIMultiple cropping indexIt is expressed as the ratio of crop sowing area to cultivated land area.Positive
FSFarming scaleIt is measured by the cultivated land per capita of rural population. Positive
EIREffective irrigation rateIt is expressed as the ratio of irrigation area to cultivated land area.Positive
DDRDisaster damaged rateIt is the ratio of disaster damaged area to affected area, i.e. disaster intensity [26,27]Negative
DARDisaster affected rateIt is expressed as the ratio of the disaster affected area of crops to the sown area of crops [28]Negative
Table 4. Comparison of influencing factors’ ranks by Gray correlation analysis with Pearson correlation analysis.
FactorsGray Correlation AnalysisPearson Correlation Analysis
γi γ i γ i CW (%)RankPearson corr.Sig.Rank
DAR0.9790.136141−0.364 **0.0443
PAR0.9750.1352720.344 *0.0584
DDR0.9660.134403−0.302 *0.0995
EIR0.9520.1325440.425 **0.0171
FIL0.9250.1286650.1760.3437
MCI0.8940.1247960.377 **0.0372
FS0.7660.1068970.2670.1476
UR0.7640.10610080.0970.6058
Note: ** Correlation is significant at the 0.05 level (2-tailed). * Correlation is significant at the 0.1 level (2-tailed).
Table 5. Some recommended FIs for the target yields (TY) of rice and wheat in some regions and provinces of China.
CropsRegionsProvincesYT (kg hm−2)FIs (kg hm−2)
RiceNortheastJilin, Liaoning and some parts of Neimeng<7500N: 104–133, P: 46–58, K: 40–50
Upper Yangtze RiverEast Sichuan, Chongqing, South Shaanxi, etc.>9750N: 180–210, P: 60–90, K: 75–120
Middle Yangtze RiverAnhui, Northeast Hunan, North Jiangxi, etc.>8250N: 150–180, P: 60–105, K: 60–120
Lower Yangtze RiverJiangsu, North Zhejiang>9000N: 180–270, P: 75–90, K: 90–120
Winter
wheat
North China Plain irrigatedShandong, Tianjin, part of Hebei, etc.N: 68–88
Middle & Lower YangtzeHubei, Hunan, Jiangxi, Zhejiang, Shanghai, etc. 6000–8250N: 68–81 with some KCI
Spring
wheat
Northwest irrigated areaXinjiang, Central Neimeng, North Ningxia, etc. 6000–8250N: 158–211, P: 81–95, K: 45–53
Publisher’s Note: MDPI stays neutral with regard to jurisdictional claims in published maps and institutional affiliations.