Article

Experimental Study on the Interplay between Different Brine Types/Concentrations and CO2 Injectivity for Effective CO2 Storage in Deep Saline Aquifers

School of Science, Engineering and Environment (SEE), University of Salford, Manchester M5 4WT, UK
*
Author to whom correspondence should be addressed.
Sustainability 2022, 14(2), 986; https://doi.org/10.3390/su14020986
Submission received: 18 September 2021 / Revised: 24 December 2021 / Accepted: 13 January 2022 / Published: 16 January 2022
(This article belongs to the Special Issue New Frontiers in Carbon Capture, Utilization and Storage (CCUS))

Abstract

:
Salt precipitation during CO2 storage in deep saline aquifers can have severe consequences on injectivity during carbon storage. Extensive studies have been carried out on CO2 solubility with individual or mixed salt solutions; however, to the best of the authors’ knowledge, there is no substantial study to consider pressure decay rate as a function of CO2 solubility in brine, and the range of brine concentration for effective CO2 storage. This study presents an experimental core flooding of the Bentheimer sandstone sample under simulated reservoir conditions to examine the effect of four different types of brine at a various ranges of salt concentration (5 to 25 wt.%) on CO2 storage. Results indicate that porosity and permeability reduction, as well as salt precipitation, is higher in divalent brines. It is also found that, at 10 to 20 wt.% brine concentrations in both monovalent and divalent brines, a substantial volume of CO2 is sequestered, which indicates the optimum concentration ranges for storage purposes. Hence, the magnitude of CO2 injectivity impairment depends on both the concentration and type of salt species. The findings from this study are directly relevant to CO2 sequestration in deep saline aquifers as well as screening criteria for carbon storage with enhanced gas and oil recovery processes.

1. Introduction

The consumption of fossil fuels has led to global warming and ozone layer depletion due to a massive increase in the atmospheric greenhouse gas emissions [1,2,3,4,5]. Carbon dioxide (CO2) is the major concern in global warming since its concentration in the atmosphere has increased tremendously over the past decades [6,7]. Carbon Capture and Storage (CCS) technology has the potential to reduce CO2 emissions from anthropogenic sources and safely sequester it in underground formations such as depleted oil and gas reservoirs or deep saline formations [8,9,10,11,12,13]. This technology has the capability to decrease the emissions of CO2 up to 17% by 2050 [14]. Therefore, the injection of CO2 into depleted hydrocarbon reservoirs, deep coal beds, and deep saline aquifers, commonly referred to as geological sequestration, is currently attracting much attention to tackle the global warming challenge [15].
The injection of CO2 in deep saline aquifers (sequestration) provides the greatest potential for CO2 storage due to their large capacity, trapping mechanism, and broad distribution [16,17]. One of the major problems encountered during CO2 sequestration in deep saline aquifers is the vaporization of formation brine. This vaporization results in a salt precipitation effect which eventually might have a severe impact on the injectivity, thereby blocking CO2 storage [18,19,20,21]. Salt precipitation in deep saline aquifers occurs as a result of the injection of a large amount of CO2 into the formation water, thereby leading to water evaporation as well as an increase in the molar fraction of water in the CO2 stream [22]. The concentration of the dissolved salt in the brine builds up continuously as the result of the vaporization progresses. At an extent under the thermodynamic state of the deep saline aquifers, the concentration of salt exceeds its solubility, resulting in the precipitation of extra salt from the aqueous phase. This phenomenon is also referred to as salting out, which alters the porosity and permeability of the formation [23,24].
Field studies of CO2 injection found robust evidence of salt precipitation effects as reported for the Snohvit and Ketzin reservoir [18,25]. This was found to be the result of high levels of NaCl in the formation water, as a case of antarctictite precipitation, reported by Sminchak and colleagues [26]. Several experimental studies [21,27] and numerical simulations [28] indicated that salt precipitation reduces permeability in a wide range of 13% to 83% and decreases porosity within the range of 2% to 15%. Some researchers proposed that salt precipitation accumulates close to the wellbore, where brine vaporization and the gas flow are at the highest level [21,27,29,30]. Several factors affect salt precipitation, such as, (i) saturation of solid salt, (ii) the rate of drying out, (iii) the spread of precipitated salts in the pores of the rock, and (iv) the petrophysical characteristics of the rock. In addition to aforementioned factors, other parameters, including the radius and charge of the ions, temperature of the saline fluid, the concentration of salt, and the solvent static dielectric constant, are important in salt precipitation [31,32,33,34,35].
There are some experiments conducted into the drying out and salting out processes in the storage of CO2 within rock pores [21,28]. Peysson and colleagues [21] reported that the salt precipitation process and the amount of salt deposited are related to various parameters such as the salinity of the initial brine; there is a large salt deposit when the brine concentration is high, and a sufficiently high gas injection rate can overcome the capillary forces to limit the precipitation of salts close to the injection well. Pruess [28] stated that the counterflow of CO2 and brine can greatly increase the aqueous phase salinity and can promote substantial salt precipitation, even in formations with low dissolved solids. The report also demonstrated that salt precipitation occurs only in the dry-out region around the injection well, but not in the two-phase zone beyond the dry-out region. In a simulation study, Hurter and colleagues [24] investigated salt precipitation during CO2 storage and it was found that the dry-out region can spread to over 10 m over a two-year period of storage.
The laboratory core flooding experiment on dry CO2 was performed by Ott and colleagues [20] on salt water sandstone (Berea) with a complete permeability (500 mD) and porosity of 22%. This experimental study was conducted at two different injection rates (2.2 and 4.4 mL/min). An X-ray tomography was utilized to quantify the salt precipitation. The results showed that the precipitation pattern is independent of the injection rate. At both injection rates, the accumulation of local salt was observed by the mechanism of capillary backflow. CO2 core flood tests were also conducted by Bacci and colleagues [27] on a sandstone core sample (St. Bees), which was fully saturated with brine, gaining many alteration levels as a result of halite scaling. The results presented a reduction range of 4 to 29% in porosity and 30 to 86% in permeability.
Furthermore, it is important to understand the role of different salts on CCS, including the predominant salts that are found in the formations suitable for CCS. Different kinds of salts are presented in brines that are found in storage locations, but the most common salts are NaCl, KCl, MgCl2, and CaCl2 [36]. In order to predict the safe storage capacity of reservoir rocks, an understanding of the CO2–H2O–salt system is required. According to Tong and colleagues [37], the solubility trapping of CO2 in saline aquifers accounts for 90% of the estimated total storage capacity and the solubility of carbon dioxide in the brine (salt water) can be used in the estimation of the total amount of CO2 stored. Therefore, studies of the phase equilibria of CO2 in aqueous systems and ions, such as Na+, K+, Mg2+, Ca2+, and Cl-, in wide formation temperature and pressure ranges is important.
Different systems such as CO2–brine [38,39], CO2–H2O [39,40,41,42,43], CO2–H2O–NaCl [44,45,46], and CO2–H2O–KCl [36,47], have been studied at different pressures and temperatures. The output of these studies state that CO2 solubility in a deep saline aquifer is sensitive to the pressure range and increase in pressure with a decrease in temperature, resulting in an increase in CO2 solubility. Moreover, solubility is directly related to the concentration of salt in each component and thus, an increase in salt concentration results in salt precipitation. Findings presented that the salting-out effect of KCl is lower than that of NaCl and CaCl2 [39]. In addition, the salting-out effect is more in MgCl2 as compared to either NaCl or KCl that have a similar effect [36].
Experimental data are available on the extent of CO2 solubility in NaCl solutions (brine) and deionized water at the different conditions necessary for CCS. The solubility of CO2 in CaCl2 brine has been studied at temperatures between 25 to 151 °C, a pressure range of 0 to 5802 psi, and a molality of 1 to 6 mol/kg. CO2 solubility in KCl and MgCl2 brines has also been studied at a salinity of up to 4 mol/kg in the literature [6]. Furthermore, extensive studies have been carried out on the study of CO2 solubility with individual and/or mixed salt solutions in the literature. However, an understanding of the injectivity problems associated with CO2 injection in different formations still needs further investigation, and there is no substantial study with respect to pressure decay rate and brine concentration range for the effective storage of CO2 in a deep saline aquifer.
Therefore, in this work, a wide range of brine concentrations for different salt types are experimentally investigated to understand the optimum brine concentration range of different salt types for effective CO2 storage in a deep saline sandstone aquifer. Additionally, saline aquifers situated within sandstone formations are targeted in this study. The work focuses more on the interplay between the fluids rather than the fluid–rock interaction, as is the case of carbonate rocks. The inertness of the sandstone rocks with regard to its participation in the dynamics of underground water and CO2 interaction should not discount its importance. This study aims to establish a benchmark for the dynamic between CO2 and different brines in porous media at CO2 supercritical conditions. This entails the testing of different salts to see the interaction between CO2 and salt concentrations for possible screening criterion for CO2 sequestration sites in deep saline aquifers. To achieve these objectives, core flooding experiments were conducted to mimic the CO2 injection in sandstone reservoirs and the effect of different salt concentrations on injectivity was determined. Furthermore, pressure decay tests were caried out to evaluate the solubility of CO2 under different conditions and the interaction of the CO2 in the porous medium. The results of this work will significantly contribute towards predicting the rate of solubility of CO2 in a porous media, as well as the storage capacity concerning the type of salt in the brine solution.

2. Materials and Methods

2.1. Concept of the CO2–Water–Rock Interaction

The interaction of CO2, brine, and the rock formation minerals play an important role during CO2 sequestration in deep saline aquifers. First, carbon dioxide dissolves in the water (brine) within the formation, followed by the attainment of equilibrium between the dissolved CO2 and the formation of carbonic acid (H2CO3), which finally dissociates into HCO 3   and CO 3 2 + .
CO 2 ( g )   CO 2 ( aq )
CO 2 ( aq ) + H 2 O   ( l ) H 2 CO 3 ( aq ) H + +   HCO 3 2 H + +   CO 3 2
From the above reactions (see Equation (2)), the carbonate anion ( CO 3 2 ) interacts with cations such as Ca2+ and Mg2+ to precipitate carbonate minerals, with the type of reactions that occur being dependent on the mineral composition of the formation rock. However, these reactions are affected by temperature, pressure, multiphase flow of CO2 and water, as well as the rock and brine compositions. Other factors, such as injection scenarios, can affect the interactions between the circulating fluid and the rock alongside permeability impairment after CO2 injection, thereby leading to dissolution fluctuation [48]. This permeability impairment is basically caused by salt precipitation near the injection well due to the fact that salt precipitation occurs only in pore space predominantly occupied by brine during the precipitation process [49]. According to Zhang and colleagues [50], two mechanisms could be responsible for an extreme reduction in rock (core) permeability as well as porosity. The first mechanism involves the capillary-driven back flow responsible for the transport of brine closer to the injection area. In this region, the pore spaces are predominantly filled with salt. On the other hand, the second possible mechanism in the injection area is a boundary effect. Since brine initially occupied all the pore spaces of the core, the injection of CO2 gas at the injection area possibly leads to the evaporation of the brine, thereby resulting in the clogging of the injection area. Thus, core permeability will be zero at this area due to clogging [50].
Hurter et al. [24] and Yang et al. [51] predicted that the solubility of CO2 and brine affects the injection process and flow properties in three ways: (i) the dissolution of CO2 in brine apparently increases its density; (ii) the dissolution of CO2 leads to a reaction with water, forming an acid; and (iii) H2O dissolved into CO2 increases the salinity of the brine. However, the level of CO2 solubility in brine depends primarily on pressure, temperature, total salinity, and brine composition. Other contributing factors are the density difference between carbon dioxide and the brine, CO2 saturations, the kinetics of solubility, and the diffusion of CO2 in the brine [52]. Thus, CO2 solubility increases with increasing pressure and decreases with increasing temperature and brine salinity [53,54,55,56,57]. Furthermore, some reactions may lead to mineral dissolution, and thereby promote the formation of migration pathways, while others may be beneficial to CO2 storage. Thus, it is essential to understand the magnitude and direction of such reactions in order to ensure the host formation of CO2 sequestering is safe over a long period [58,59,60].

2.2. Materials

2.2.1. Core Samples

In this study, homogeneous quartz-based Bentheimer sandstone core samples, with a 1 inch diameter and 3 inch length, were obtained from Kocurek industries USA [61]. The reference permeability and porosity reported by the supplier were between 1500–3500 md and 23–26%, respectively. The core sample is categorized as homogenous and was selected based on its physical properties and its suitability to accommodate different flow conditions. This sandstone was also selected because of fewer interactions between the core sample and the injected fluid. In this case, the interplay between the brines and the CO2 alone is considered, without the interference from phenomena like mineral dissolution, as would happen in carbonate rocks.

2.2.2. Gases

Helium and liquid carbon dioxide (sourced from BOC UK) with 99% purity were used in this study. Helium was used to measure the porosity of the core sample using Helium Porosimetry. The characterization of the fluid (CO2) was also conducted using PVTsim Reservoir software to determine the density and viscosity of the fluid.

2.2.3. Brine Preparation

The brine samples were prepared using four different salts (NaCl, KCl, CaCl2, and MgCl2 obtained from Sigma-Aldrich, Gillingham, UK) which are notably present in the formation water of deep saline aquifers. The main brine component present in saline aquifers is NaCl, typically in the range of 70 to 90% [62]. The brine concentration in deep saline aquifers has been reported to be in the range of 2 to 25 wt.% [63]. Brine concentration increases with respect to reservoir depth in the range of 800 to 2000 m. In this work, the selected brine concentrations were 5, 10, 15, 20, and 25 wt.%, which covered the salinity range of a typical deep saline aquifer. The brines of various concentrations were made by dissolving the necessary amount of salt in distilled water and stirring it. A magnetic stirrer was employed to gently swirl the brine to enable the appropriate salt dissolution after saturation of the Bentheimer core sample.
It should be noted that the idea behind using the wt.% is because of the macro effects of salt concentration on CO2 storability. As much as mol% is important, the variation in wt.% and salt type is vital in understanding the dynamic extent to which these parameters affect the rock properties and CO2 injectivity. Testing these caveats can provide additional knowledge for effective sequestration processes. In addition, every reservoir has different and distinct characteristics, and this work brings to light and accentuates the distinction between salt types with regard to their mass concentrations. Furthermore, the possible mitigation strategies can be adopted to annul the effects of injectivity during deep saline aquifer CO2 storage.

2.3. Method

The current experimental method that been established from the literature states that geological sequestration of CO2 in saline aquifers would preferentially occur at supercritical conditions [64,65]. The critical point is 31.1 °C and 7.38 MPa. At a temperature and pressure greater than the critical, CO2 becomes a supercritical fluid with a high density like a liquid, but moves like a gas. This means it can be stored in great amounts and easily occupy the entire available space. That was why we adopted the operating condition of a temperature and pressure at 45 °C and 1500 psig, respectively. This injection condition was also used in other studies, such as those carried out by Ott et al. [66] and Bacci et al. [27]. On the other hand, the injection rate was chosen based on the simulation performed by Calabrese et al. [67]. They showed that the storage efficiency decreases as the injection rate increases; hence, we selected a low injection rate of 3 mL/min so the denser CO2 could fall to the bottom of the gas zone and dissolve in the aquifer. Other studies, such as those carried out by Peysson et al. [21] and Ott et al. [20], adopted this injection rate as well.

2.3.1. Porosity and Permeability Measurement

Laboratory measurements of the reservoir properties of the core samples were first carried out to verify the actual values and magnitudes from those supplied by the manufacturer. This involved using laboratory core flooding employing the branded equipment (CoreLab PREL 300, University of Salford, Manchester, UK) and helium porosimetry for permeability and porosity measurements, respectively. The rock absolute gas permeability was measured by core flooding equipment that works on the principle of Darcy’s law. Darcy experimentally defined fluid flow in porous media as being proportional to the differential pressure per unit length. Thus, Darcy’s formula to obtain permeability can be expressed as:
k = 2000   L A   Q   P atm ( P o 2   P i 2 )
In addition, helium porosimetry enables the determination of the porosity of rock cores using the grain volume of the core sample, which is the volume of the rock grains or solids alone without the voids enclosed therein. The equipment works based on Boyles Law, and the grain volume is evaluated using the expression:
V g = V c V r ( P 1 P 2 P 2 P a ) + V v ( P 2 P 2 P a )
Details of the procedure are presented elsewhere [68,69].

2.3.2. Core Flooding Procedure

The apparatus (shown in Figure 1) and the experimental procedures have been reported previously by Edem et al. [68,69]. The basic physical parameters of the core sample were measured after drying the core in an oven at 75 °C for 24 h to remove any trace of solvent and moisture present after cleaning with Soxhlet extraction. The Bentheimer sandstone was then immersed in a vacuum chamber containing different brine concentrations (5 wt.%, 10 wt.%, 15 wt.%, 20 wt.%, and 25 wt.%) for 24 h. This was done to remove any entrapped air bubbles in the core sample. After undergoing external saturation with the desired brine, the core sample was then wrapped in heat shrink and aluminum foil to prevent CO2 permeation into the Viton sleeve before it was inserted into the Viton sleeve in the core holder. When CO2 permeates into the Viton sleeve, it causes damage that could lead to the bursting of the sleeve, thereby ruining the experiments. Next, the same concentration of the brine used for the external saturation was injected into the core sample to ensure sufficient saturation. The dead volume excess brine was then evacuated to allow the test to be conducted using just the brine in the core sample.
To maintain the desired experimental temperature, the core holder was wrapped with a heat jacket and the temperature regulator was adjusted until a temperature of 45 °C was displayed on the SmartFlood software. Hydraulic oil (pressure medium) was pumped into the annulus of the core holder with the help of a hydraulic pump to provide the overburden pressure of 2500 psig. A pressurized liquid CO2 cylinder was connected to ‘’fluid accumulator B’’, with a capacity of 500 mL, and the back pressure (BPR) was set to 1500 psig to maintain the pressure at the operating condition of 1500 psig.
The pressure decay test was carried out first, and this involves measuring the drop or decrease in pressure of CO2 in an aqueous brine solution in the saturated core sample. To conduct the test, CO2 was injected into the brine-saturated core sample by opening the Accumulator B delivery valve, and the pore pressure reduction (decay) was recorded over a period until no more significant drop in pore pressure was observed. Equation (5) shows the calculation of the pressure decay rate.
Pressure   Decay   Rate   ( psi min ) = initial   injected   pressure final   pressure time   taken   for   the   pressure   change
After the equilibration of the system pressure, an Eldex pump was switched on to aid in applying pressure to the fluid (CO2), thereby allowing it to flow into the core sample in the core holder. The injection rate for this work was adjusted to 3 mL/min and the recording, as well as the logging, of the pore pressure began. As CO2 traverses the saturated core sample, the gas effluent was routed to the gas meter, which in turn accounted for the volume of effluent CO2 collected. An air-tight measuring cylinder with a laboratory rubber stopper was placed at the downstream core holder and the upstream gas meter. The brine displaced by the CO2 was collected by this measuring cylinder while maintaining an air-tight passageway for the CO2 to enter the gas meter to accurately measure the gas effluent. Therefore, the brine saturation can be evaluated by Equation (6).
Brine   Saturation   ( % ) = 100 ( 100 × Water   Collected Pore   Volume )
In this experimental setup, the pressure measurement was achievable via pressure gauges and a transducer (with accuracy of 0.01%). The overburden pressure and the backpressure were measured using pressure gauges, while the upstream pressure and differential pressure were measured through a pressure transducer.
After measuring the volume of the CO2 effluent and water collected, the core flooding rig was depressurized, and the core sample was removed from the core holder. The sample was dried, and changes in porosity were assessed as well as the permeability reduction. The experiments were repeated for different brine types and concentrations while the other parameters were kept constant.
The core sample was thoroughly cleansed by Soxhlet extraction for 48 h using methanol heated to 70 °C. A moderate temperature was permitted so that the methanol did not boil off. Thereafter, the core was subjected to testing for porosity and permeability before using it for another core flooding experiment. Evaluation of the porosity was to ensure that there were no salt deposits in the respective core samples.

3. Results and Discussion

This section presents the results obtained for the effects of different brine types and concentration on (i) flow behavior, (ii) pressure decay rates, (iii) CO2 solubility and storage, and (iv) reduction in porosity and permeability of a Bentheimer sandstone core sample, respectively. It has been established that CO2 reaches its critical condition at a temperature of 31 °C (88 °F) and pressure of 7.38 MPa (1070 psia) [70]. Deep saline aquifers in a sandstone formation extend up to 2400 m (~8000 ft) deep and 20 °C/km (1.4 °F/100 ft), as reported by Yang et al. [51]; as such, the temperature chosen for this experiment was 45 °C. Furthermore, the injection pressure was maintained between 1100 to 1200 psig to simulate the reservoir pressure (1500 Psig). Thus, under these conditions, CO2 will remain in a supercritical state throughout the simulated CO2 injection experimentation. The temperature of the system was kept constant to maintain uniformity throughout the investigation.

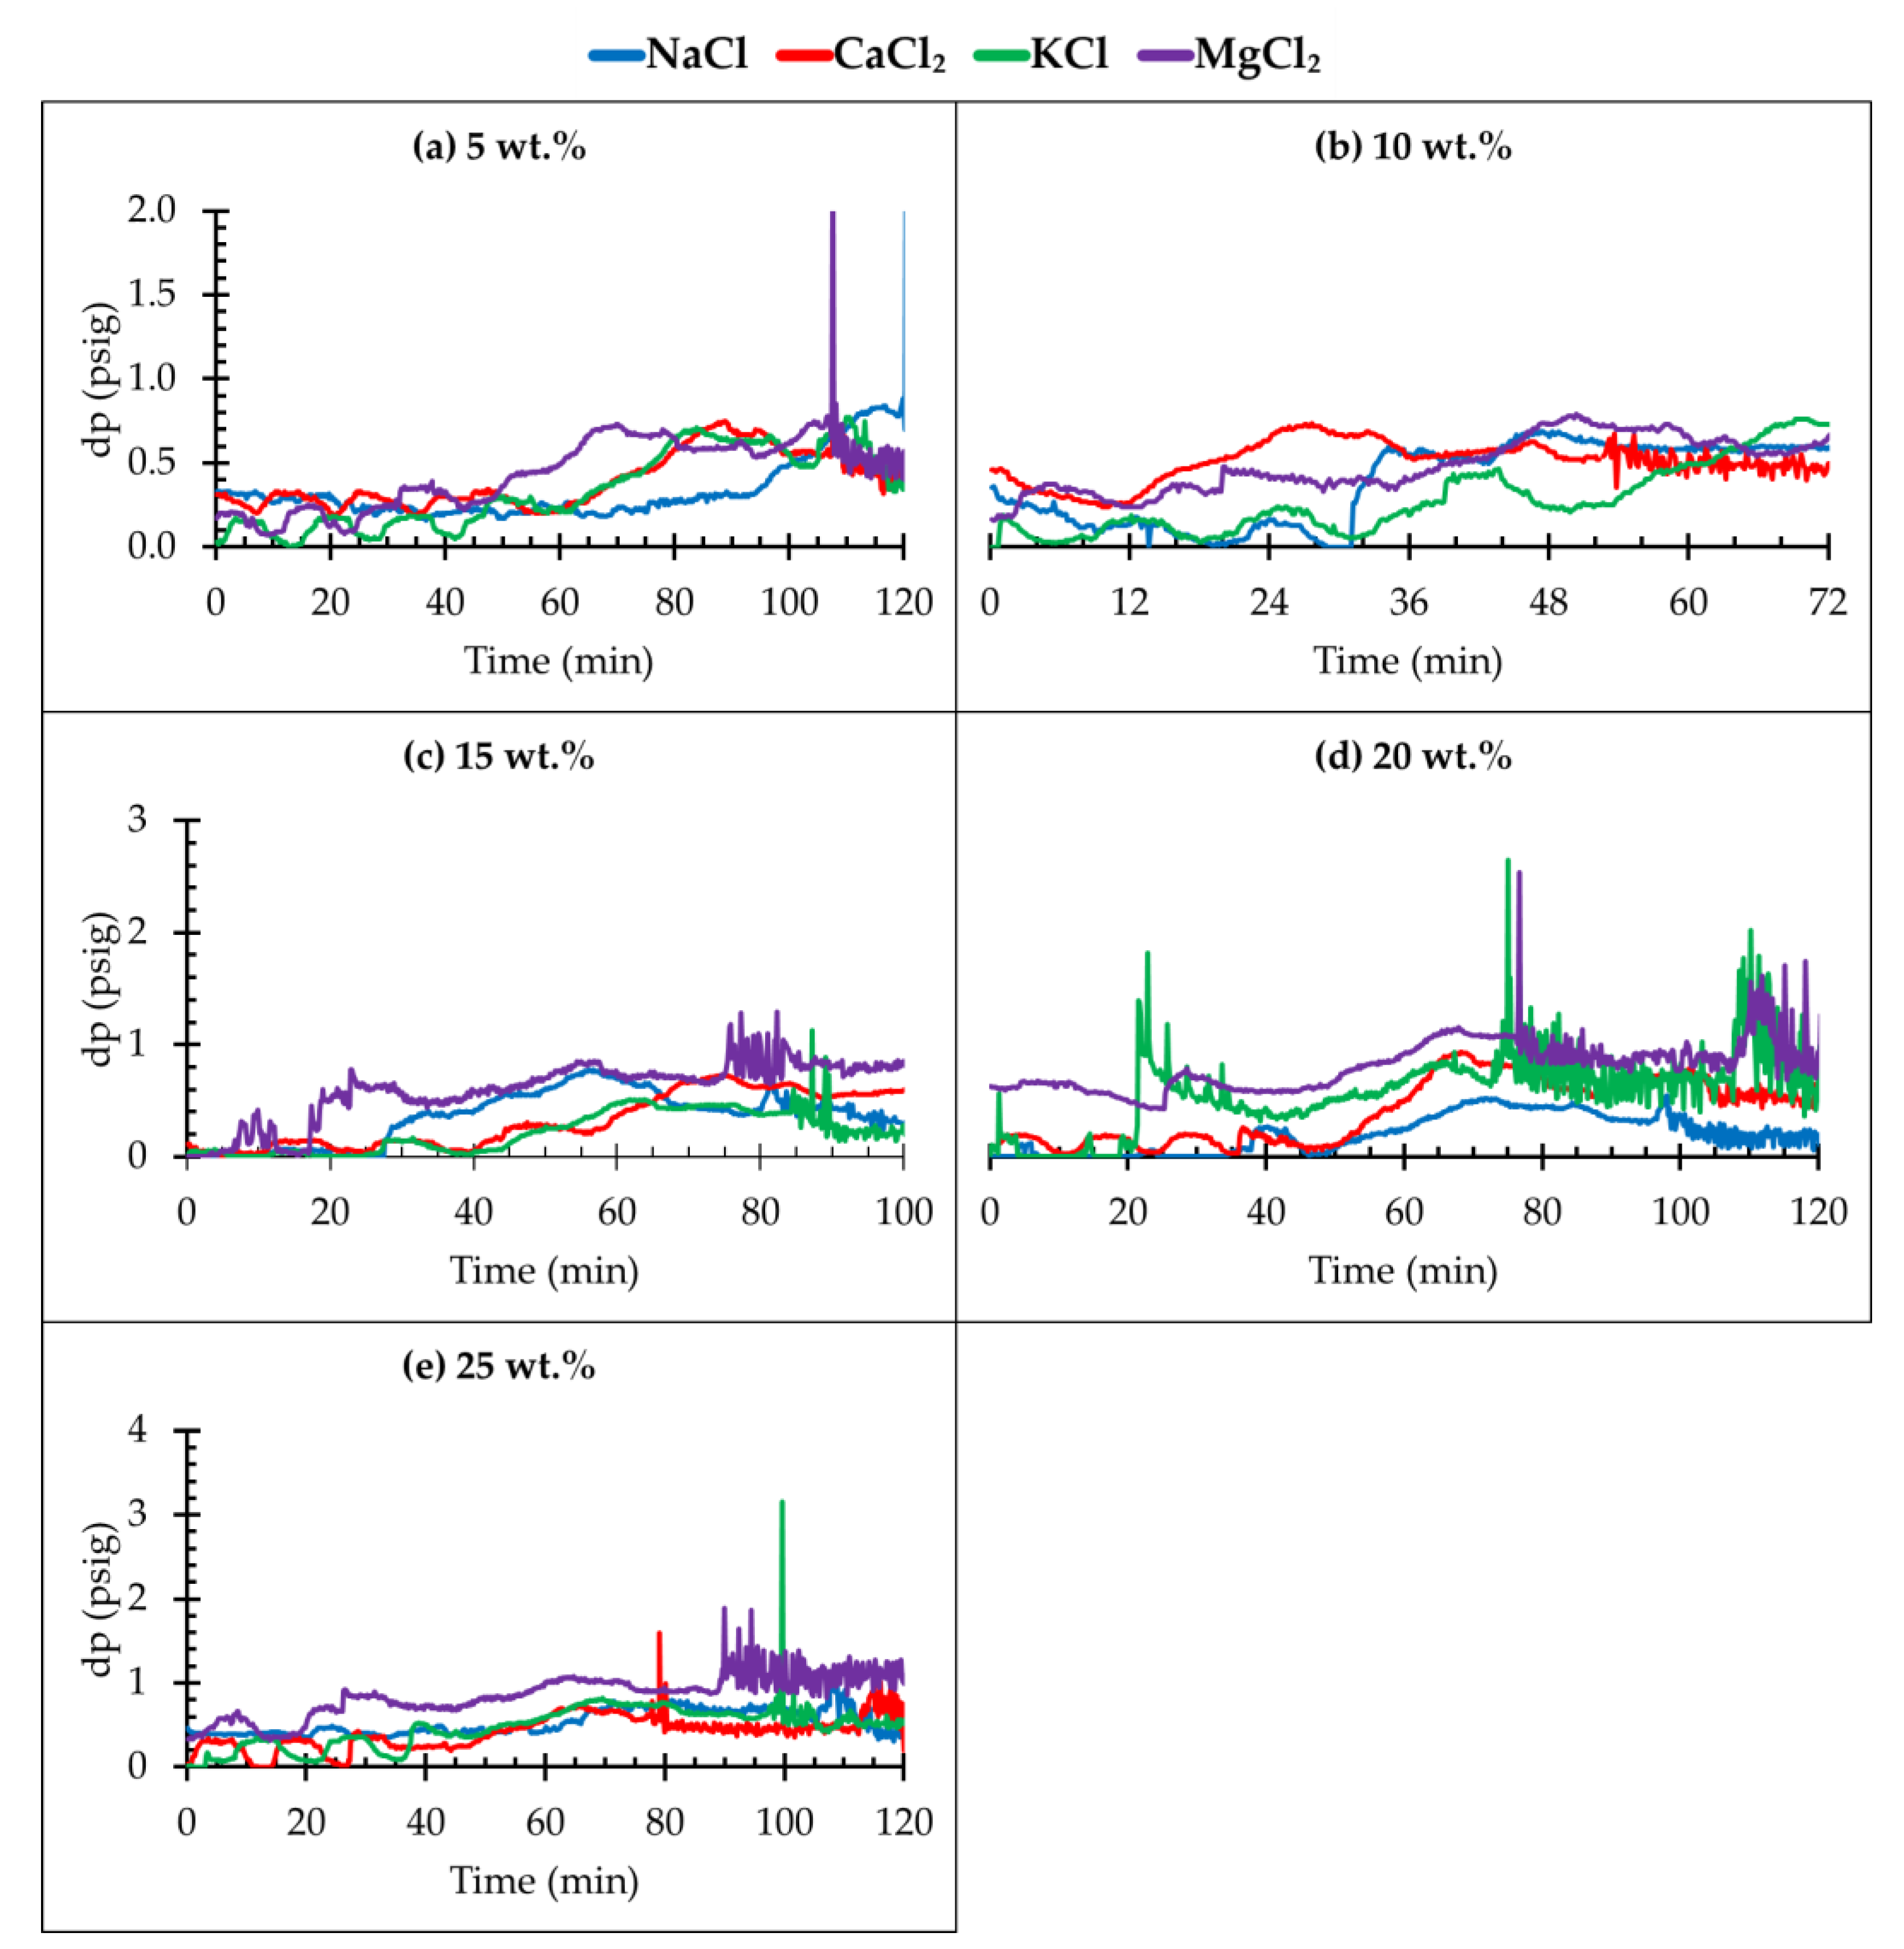
3.1. Investigation of CO2–Brine Flow Behaviour for Different Salt Types and Concentrations

The flow behavior of CO2 was investigated based on the expanse of differential pressure changes and time as the drainage process takes place. It can conveniently be used to estimate the extent of the behavior for supercritical CO2 with respect to the type and concentration of brine saturating the core sample. This is based on the Darcian inference that the permeability of a fluid to a porous medium is a function of the differential pressure (dp). Figure 2a–e show the core flooding results of the differential pressure response with time for various concentrations of brine.
Figure 2a shows differential pressure (dp) vs. time plots, which depicts the flow behavior of supercritical CO2 in different brines at 5 wt.% salt concentration. The first high fluctuation was observed at the 107 min mark, which correspond to CO2 breakthrough for the MgCl2 brine tests with a 5 wt.% concentration. However, such a high fluctuation was observed for CaCl2 and KCl quite later when the CO2 breakthrough occurred. NaCl brine at 5 wt.% was found to have the highest fluctuation of differential pressure as compared to other brines. This indicates that there was a continuous slug-type flow in the NaCl brine scenario which resulted in different variable pressure responses, and this type of flow pattern is characterized by lighter, fast-moving, continuous fluid separated by relatively large gas pockets (gas bubbles).
The available mobile aqueous phase during the CO2 injection provided the pathway for this slug-like flow due to the lower density of the brine, which did not fully occupy the narrower pore spaces within the pore matrix.
Figure 2b shows the dP vs. time plot, which depicts the flow behavior of supercritical CO2 in different brines at a 10 wt.% salt concentration. There was an early breakthrough of CO2 in CaCl2 and MgCl2 divalent brine as compared to NaCl and KCl brine, as shown in Figure 2b with the 10 wt.% concentration. This was owing to their propensity for salting-out effects. Both divalent salt solutions have higher differential pressure fluctuations at 10 wt.% concentration compared to the monovalent brine, even though the KCl brine exhibited continuously higher fluctuations toward the end of the run. The NaCl brine scenario is very stable at this concentration, and this might be attributed to CO2 and the brine flowing together as a single unit.
In the case of a high differential pressure fluctuation observed in any brine scenario, the solubility can be postulated to be low due to the higher capillary pressures within the pore matrix, and that is indicative of interfacial tension between the competing fluids being relatively high. Due to the high fluctuations in differential pressure that leads to a slug fluid flow regime, the solubility of CO2 in NaCl brine will be significantly low as compared to other brines (KCl, MgCl2, and CaCl2) with the same concentration, as confirmed in the literature [6]. On the other hand, high solubility is observed if the gas pocket is smaller and when the differential pressure becomes high. This can be seen in the case of MgCl2, where the dP increased steadily from the 50 min mark, unlike in other brine scenarios. This can be attributed to the onset of the drying-out effect of the MgCl2 brine, where the CO2 imbibes the moisture and thus increases the now moisture-laden CO2 plume’s viscosity. Similarly, the trend was observed in the CaCl2 brine before the 50 min mark. KCl exhibited similar behavior during the CO2 injection at this concentration, which infers that the CO2 solubility is substantial in most of the brines tested.
At a 15 wt.% concentration, the earlier breakthrough of CO2 was observed in MgCl2 brine, followed by NaCl, KCl, and CaCl2, as shown in Figure 2c. This implies that a substantial amount of CO2 was dissolved in the CaCl2 brine, which exhibited a late breakthrough time as compared to the other brines with all the tests carried out under the same conditions with very good repeatability. It is also worth noting that all the brines at a concentration of 15 wt.% exhibited different differential pressure fluctuation before and after breakthrough. This can be attributed to the reduction in space of the pore volume of the core sample occupied by higher density brine within the pore matrix of the core sample.
An early breakthrough time of CO2 was observed in the KCl brine, followed by MgCl2, NaCl, and CaCl2 brines at a 20 wt.% concentration, as presented in Figure 2d. Since KCl brine has the highest fluctuation of differential pressure and early breakthrough, the storability of CO2 in this brine is the lowest as compared to other brine concentrations, which is largely because of the amount of water displaced in relation to other scenarios. This is similar to the findings of Abba [71], where KCl exhibited the highest dp trend after CO2 breakthrough. The solubility of CO2 in the brine solution of NaCl is slightly lower than that in the CaCl2 brine, and both are considerably lower than that in KCl and MgCl2 brines.
According to Figure 2e for a 25 wt.% concentration, CaCl2 showed the early breakthrough, followed by NaCl, MgCl2, and KCl brines, respectively. MgCl2 and KCl brines showed the highest level of differential pressure fluctuation as compared to NaCl brine and CaCl2 brine. This high level of fluctuation in differential pressure and the reduction in solubility of CO2 in the brine is due to the salting-out effect (salt-induced precipitation). This can be further explained by the fact that when the ions are dissolved, some of the water will not be available for solute interaction as a result of vaporization, and thus be salted-out from the aqueous phase.
Furthermore, the size of K+ is larger than that of Na+, even though both possess the same anion. According to Bostrom and colleagues [38], the hydration action of Na+ is bigger than that of K+, which implies that there are less free H2O molecules acting on CO2 molecules in the aqueous NaCl brine as compared to the KCl brine. Therefore, the salting-out effect of NaCl is higher than that of KCl under the same conditions of temperature, pressure, concentration, and injection rate. Furthermore, the ion charge density is overwhelmingly more important than the size of the ion in terms of the salting-out effect [6]. However, that was not the case in this work. The amount of water present in the core sample played a significant role with respect to the observed trend, and more brine was retained in the NaCl scenarios than for the other brines.

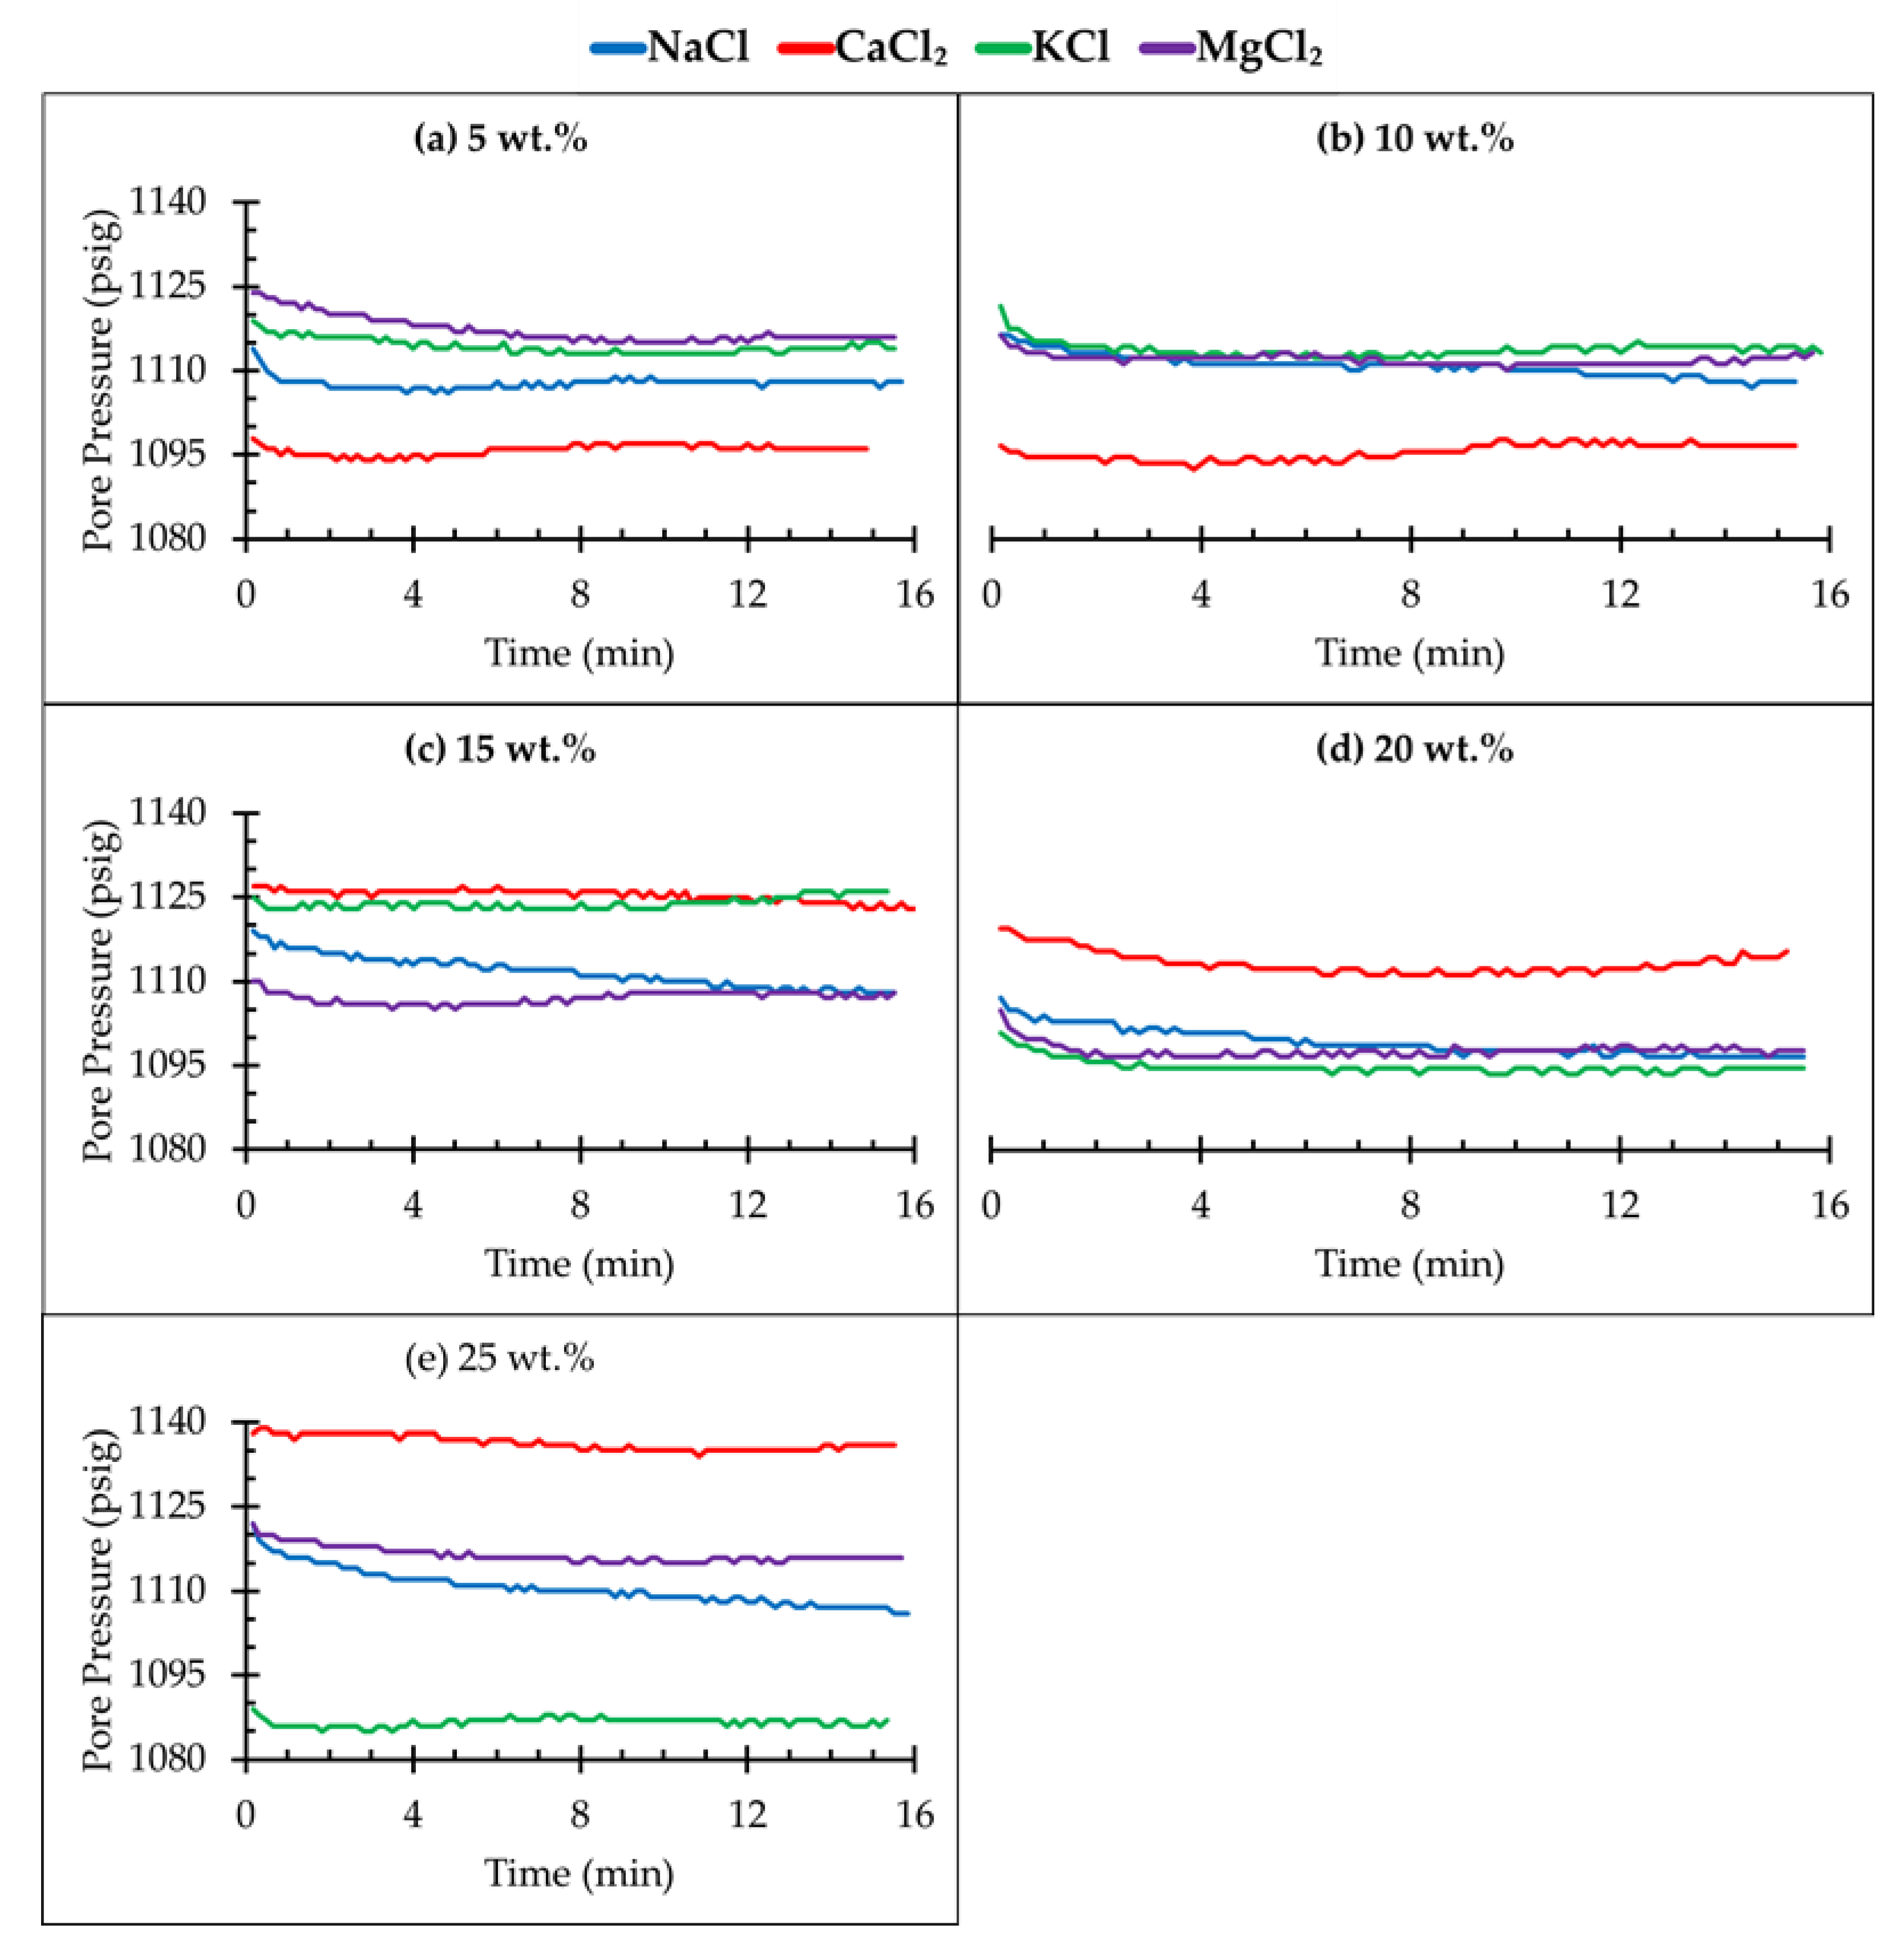
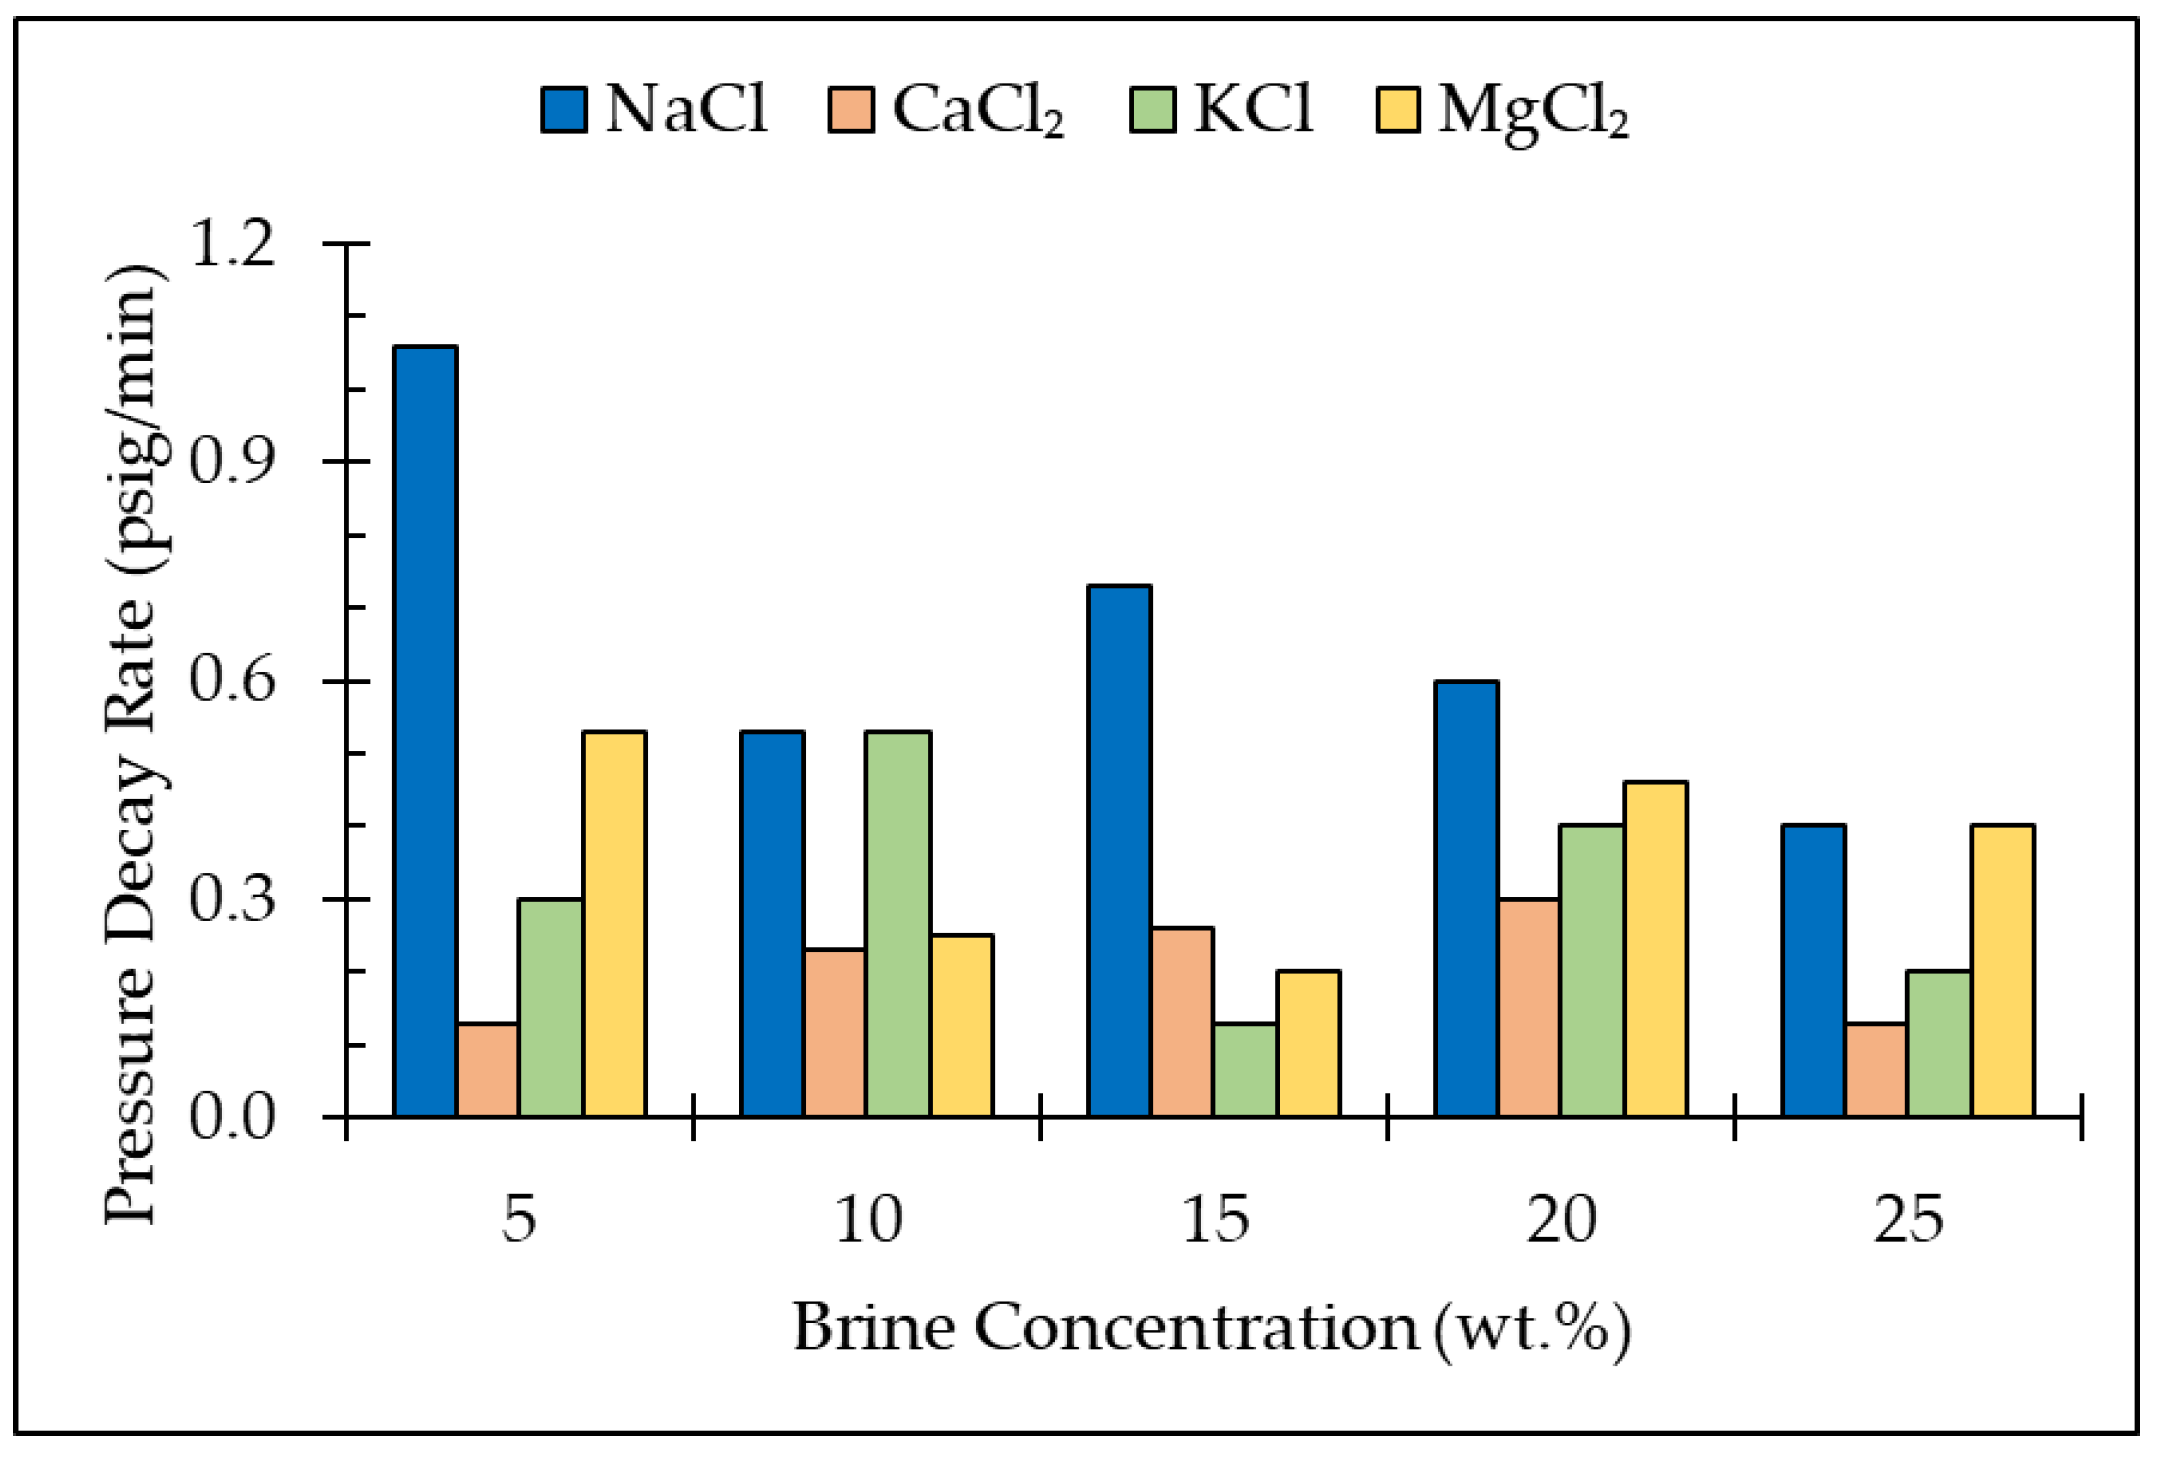
3.2. Pressure Decay Test

The solubility of CO2 varies for different brine types and it is important for CO2 storage in deep saline aquifers. A comprehensive study of CO2 solubility in different brine solutions was evaluated using an in-line pressure decay test. The results for the pressure decay tests and brine saturation (evaluated based on Equations (5) and (6)) for various brine types and concentrations is presented in Table 1. Each test was carried out three times to ensure the validity of the results.
Figure 3 shows the pressure decay trend for the various brine types and concentrations in the core sample with all salt types at different concentrations. Based on the initial CO2 injection pressure and constant pressure attained at the end of the pressure decay test, pressure decay rate was obtained for all the concentrations of brine with respect to salt type. CO2 was injected into the brine-saturated core sample to the desired pressure. A reduction in pressure was expected over a period owing to the CO2 dissolution in the simulated formation brine. This reduction in pressure can be used to infer the solubility of the CO2 in the brines at different concentrations, and to investigate and make inferences of the interplay between the in situ fluids. As such, a high-pressure decay rate in the pressure decay test (PDT) signifies higher solubility.
As shown in Table 1, NaCl has the highest decay rates in all the flooding scenarios, indicating that CO2 solubility was highest in the NaCl solutions; however, after the tests, the amount of water displaced (recovered) from the core sample at the downstream of the backpressure regulator was lower in the NaCl salts than the other brine solutions. For that reason, the amount of retained water within the core sample was higher and, hence, more interactions with the injected CO2 occurred. That is, more avenues were available for CO2 to dissolve within the brine. Furthermore, the solubilities of the divalent salts (CaCl2 and MgCl2) were found to be similar under different conditions, as substantiated in the literature [6], much like the monovalent salts (NaCl and KCl).
Figure 3a presents the pressure decay trend for the 5 wt.% brine concentration. The pressure decay rate for the CaCl2 brine solution is the lowest compared to other salts and it is highest for NaCl. The pressure decay rates of KCl and MgCl2 are in the middle ranges, in which KCl showed lower pressure decay rate compared to NaCl. The late breakthrough time of CO2 in NaCl, displayed in Figure 3a, confirms that more CO2 was stored at this concentration compared to other salt scenarios. Furthermore, Figure 3b–e showed the change in pore pressure for other concentrations of salts. The pressure decay rate varied for other salt types for salt concentration and initial water saturation.
As shown in Figure 3b, the monovalent salt solution exhibited the same kind of trend as the divalent salt. This behavioral pattern in the decay test leads to the two monovalent and two divalent brines having the same pressure decay rate of 0.53 psi/min and 0.25 psi/min, respectively. This can clearly be seen in Figure 4. This indicates that the solubility of CO2 is higher in the monovalent salt brines (NaCl and KCl) as compared to the divalent brines (CaCl2 and MgCl2). The initial water of saturation was also higher in the core sample saturated with the monovalent brine than the divalent brine, and that is why more CO2 dissolved in the former than the latter.
In addition, from Figure 3c and Figure 4, the decay rate was found to be the highest with the sandstone saturated with the NaCl brine. This can be attributed to the fact that the initial water of saturation was higher in this case, thereby leading to the higher value of pressure decay rate of about 0.73 psi/min. Conversely, despite the same amount of initial water saturation in the KCl brine as NaCl, both produced different pressure decay rates at this concentration. MgCl2 displayed a sharp decline in pressure over time as compared to CaCl2. This is due to the availability of pore spaces in the core sample saturated with MgCl2. Further, the level of brine saturation is less compared to sandstone saturated with CaCl2 brine. Thus, NaCl brine possessed the highest level of solubility with respect to the 15 wt.% brine.
Moreover, by considering Figure 3d, all of the salt concentrations exhibited the same kind of trend immediately after injection of CO2, but then displayed different pressure decay rates. In addition, NaCl brine has the highest pressure decay rate of 0.60 psi/min, as compared to CaCl2 with the lowest pressure decay rate of 0.30 psi/min. This is due to the dissolution of CO2 in the core sample containing a higher initial water saturation from the NaCl brine. KCl and MgCl2 showed the same trend with a pressure decay rate of 0.40 psi/min and 0.46 psi/min, respectively. Thus, NaCl brine displayed the highest level of CO2 solubility as compared to the others. At the highest concentration of all salt types (25 wt.%), Figure 3e, the sharp decline in pore pressure is not observed at this concentration. This was as a result of the reduction in the tortuous flow paths of the porous medium with high saline brines [72]. NaCl and MgCl2 brines had the highest values of pressure decay rate while CaCl2 had the lowest value of 0.13 psi/min. This implies that the solubility of CO2 was higher in all NaCl concentrations as compared to other types of salts. Thus, the pressure decay rate (PDR) is a function of CO2 solubility in different brine types and concentrations. To further support the points made, Figure 4 shows the relationship between the pressure decay rate and the brine concentration. Critical CO2 solubility, at the operating conditions in all the brine types, can be inferred from this relationship. The critical CO2 solubility in NaCl and MgCl2 brines was found to be at concentrations of 5 wt.% where the PDR is highest within the tested ranges. The highest PDR for KCl brine was realized at 10 wt.% with CaCl2 at 20 wt.%.

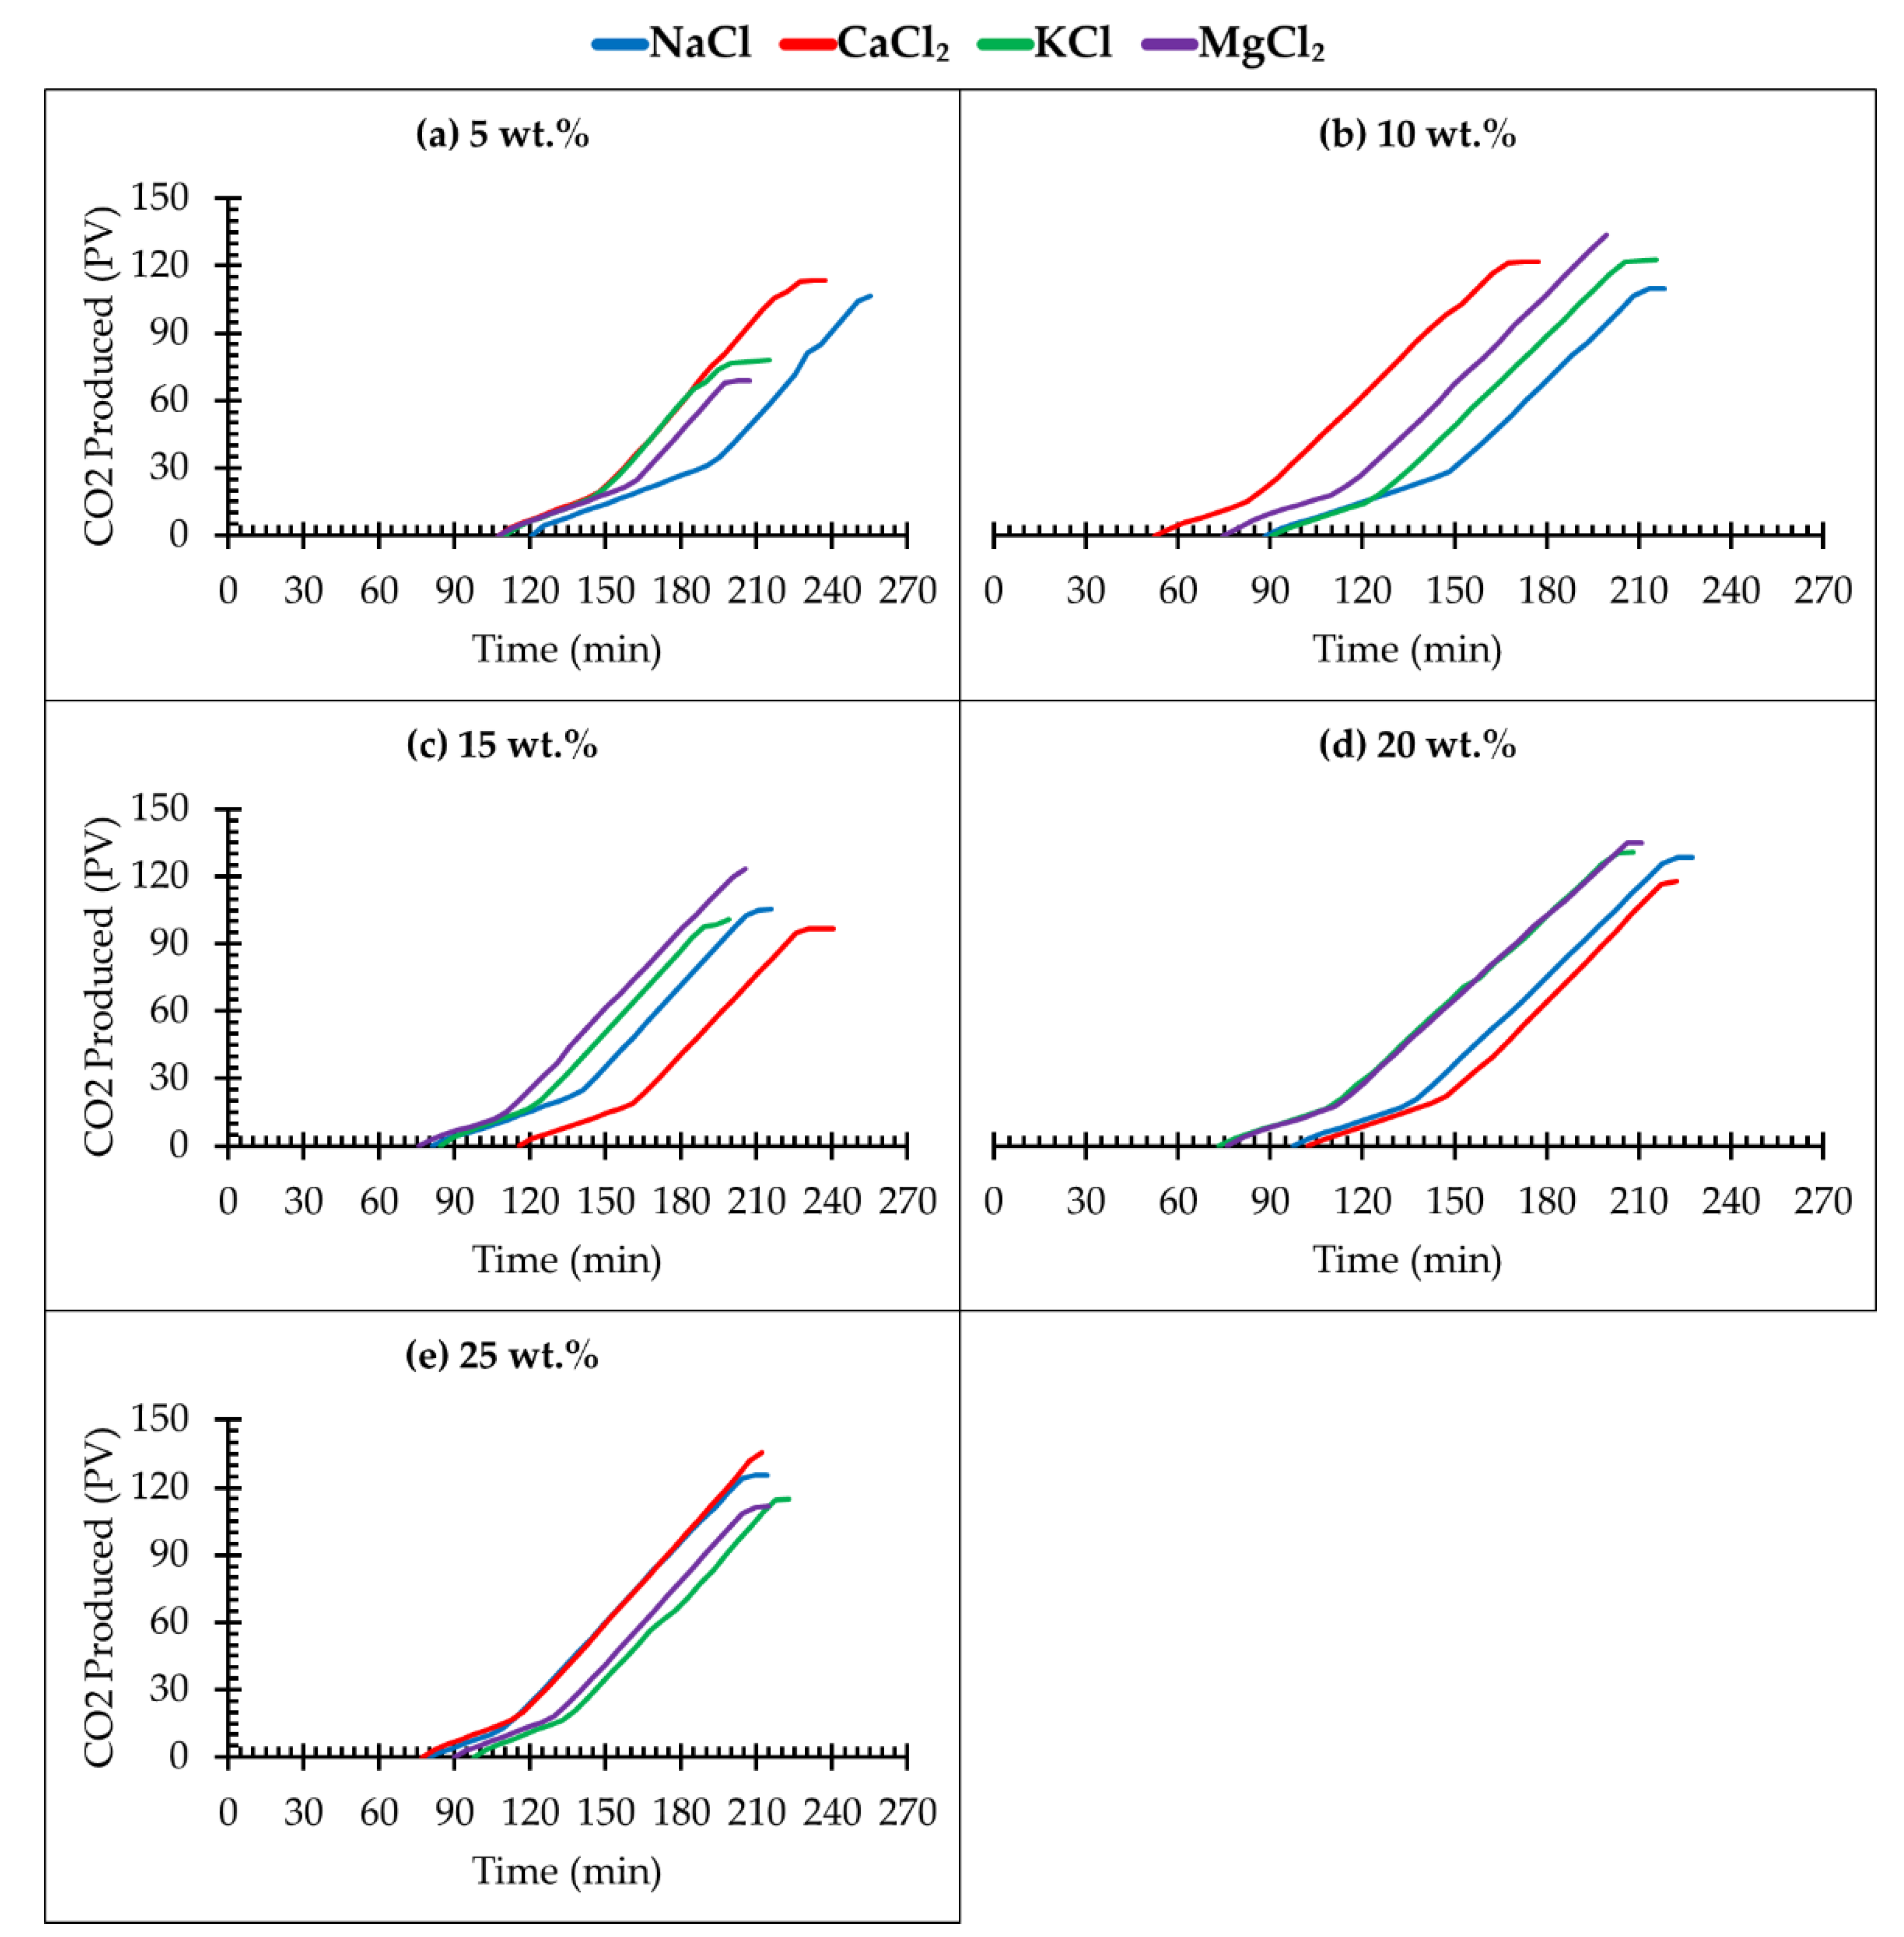
3.3. Effect of Different Salt Types and Concentration on CO2 Storage

The brines used in the experiments conducted were prepared from the four most common salts found in deep saline aquifers. Breakthrough time of CO2 from the core sample saturated with different brines and salinities varied. From Figure 5a, the breakthrough time of CO2 in NaCl brine took longer as compared to other brine salinities (CaCl2, KCl, and MgCl2). This indicates a greater interaction as a result of retention time between CO2 and the host brine at 5 wt.% salinity, thereby resulting in less CO2 production. Thus, more CO2 is stored at the 5 wt.% NaCl brine, followed by MgCl2 brine and KCl. The CaCl2 brine exhibited the same characteristics for storage. Moreover, the salting-out effect or precipitation was not well pronounced initially for all types of brine at this salinity (5 wt.%). This can be seen around the 100 min mark, as shown in Figure 5a, after a breakthrough for the various brines.
Furthermore, the early breakthrough of CO2 for CaCl2 brine at 10 wt.% salinity is a result of low solubility of CO2 in the brine (see Figure 5b). This is because there was less retention or interaction of the CO2 and brine within the core sample. In this regard, CO2 breakthrough was realized sooner from the core sample, and the initial water saturation was lower at this condition as compared to the high solubility cases in KCl and NaCl brines at this salinity. Additionally, the late breakthrough time observed in NaCl and KCl (monovalent salt) is a clear indication of the dissolution of CO2 in the core sample at this salinity, as showed in Figure 5b with the 10 wt.% salinity. In this case, less CO2 was produced since a significant volume of CO2 was dissolved in the NaCl brine saturating the core sample. The trend of CO2 produced in the MgCl2 brine scenario at this salinity falls in between CaCl2 and KCl brines, respectively, as seen in Figure 5. The above findings are in agreement with the experimental results obtained from the work of Duan and Sun [73], in that a NaCl brine with the equivalent molality has greater solubility than a CaCl2 brine.
Figure 5c shows the CO2 recovered after saturating the core sample with 15 wt.% brine. It is pertinent to state that the solubility of CO2 in CaCl2 brine was second only to NaCl, but exhibited a later breakthrough time than all the other brine scenarios. This is confirmed previously in Figure 4. In this case, it is postulated that CO2 has interacted substantially with the brine and dissolved within the pore spaces of the core sample in the case of CaCl2. It is also important to note that, at this salinity (15 wt.%), the dissolution of the predominant salt in aquifers (NaCl) and breakthrough time has changed drastically as compared to the previous salinity. CO2 exhibited the lowest solubility in the KCl brine at a 15 wt.% salinity, but MgCl2 presented the earliest breakthrough. This observation is not unconnected to the drying-out effect of the divalent brine (MgCl2), which leads to early breakthrough and CO2 production as compared to KCl brines.
Figure 5d shows the breakthrough results of a 20 wt.% salinity. As the concentration of brine increases, the solubility of CO2 in different brines changes with respect to breakthrough time and CO2 produced. KCl and MgCl2 tend to have similar breakthrough time as well as CO2 produced at this salinity (20 wt.%). Furthermore, CaCl2 appeared to have the latest breakthrough time compared to other brines (KCl and MgCl2), followed slightly by NaCl brine. In this scenario (20 wt.% salinity), CO2 produced is significantly more than that produced from the previous salinities. CO2 exhibited the lowest level of storability in MgCl2 and KCl brine scenarios as a result of excessive production of CO2 and early breakthrough.
Due to the high level of salinity of all brines, as illustrated in Figure 5e with 25 wt.% of salt, the breakthrough time was invariably shorter for the various brine concentrations. This indicated that less CO2 can be dissolved and stored at this concentration. The concentration of the brine makes it challenging to dissolve more CO2 as a result of an increase in brine density.
There is a consistency in the amount of CO2 produced from 5 wt.% to 10 wt.% salinity experiments in all the flooding scenarios. At 5 wt.%, more CO2 was produced in CaCl2 brine as compared to other brines, with NaCl having the least CO2 produced. This indicated that more CO2 was dissolved in NaCl than CaCl2 by solubility trapping as well as capillary and structural mechanisms. This incremental trend of CO2 produced from 5 wt.% to 10 wt.% can be related to the salinity of the brine, in that, as salinity increases, the amount of CO2 produced also increases. In addition, at this 5 wt.% concentration, a significant amount of CO2 was dissolved in the brine, thereby resulting in a further increase in brine density. As the density increases, it reduces the free path of the gas and creates an avenue for trapping and storing CO2 gas. In this regard, CO2 occupied more of the pore spaces within the core sample because of higher capillary pressure and, thus, interfacial tension [6] at the time where the brine gets more saturated with the CO2. Therefore, a further increase in density leads to less CO2 trapping due to an increase in the interfacial tension between the brine and the CO2; hence, not much interaction in terms of dissolution.
Furthermore, by considering the amount of CO2 dissolved/stored and produced with respect to the 10 wt.% salinity, it is pertinent to point out that, comparatively, CO2 storage was poor in lieu of the 5 wt.% concentration. This is because the brine had occupied more of the pore spaces and the solubility of CO2 in this brine is lower than the preceding one and eventually resulted in the excessive production and lower storage of CO2 in the core sample. The interaction between CO2, the 10 wt.% brines (NaCl, CaCl2, KCl, and MgCl2), and the core sample was not very pronounced here as compared to the 5 wt.% brines. At the 10 wt.% salinity, there was no significant or drastic change in density of the brine as the CO2 traversed the core sample. A lower interaction of CO2 and trapping within the core sample was realized at this brine salinity because of the higher amount of CO2 produced, and thus less sequestration of CO2 in the core sample was observed.
In addition, there was a decline in CO2 produced for the 15 wt.% brines in all the brine scenarios, with exception of the NaCl brine. This entailed significant storage of CO2 as compared to the other brine salinities and the CaCl2 brine possessed the highest CO2 storability. This may be due to brine saturation within the core sample, thus creating more room for CO2 sequestration. This brine concentration provided substantial pathways for a better sweep efficiency of CO2 within the core sample through a better brine distribution and profile along the longitudinal and transverse axes. Higher permeability could be responsible for more CO2 trapping since there is no restriction in the interaction between the in situ fluid and CO2. Conversely, low permeability could lead to the restriction of flow, which negates the interaction between the fluids. In the case of the 15 wt.% salinity, significant pore spaces were occupied by the brine, which eventually plugs the narrow paths reduces room for CO2 storage when it is injected into the core sample. Most of the narrower pore spaces of the core sample were occupied as a result of an increase in brine density [72]. Furthermore, as salinity increases, the solubility of CO2 in the brine drastically decreases [71]. The brine (15 wt.%) has a higher density than the 10 wt.% brine, and so CO2 was trapped within the pore spaces by virtue of an increase in density of the brine occupying the narrow pore space in the core sample. As observed from Figure 5d for the 20 wt.% concentration, KCl and MgCl2 exhibited the same trend with respect to CO2 production. This indicated that both brines stored similar amounts of CO2 in the core sample at the 20 wt.% salinity while the highest CO2 storage was observed for the NaCl and CaCl2 brines.
There is not much tendency for CO2 to be stored at 25 wt.% because of the high density of the brine. Although an appreciable amount of CO2 can be stored in the KCl and MgCl2 brines as compared to the NaCl and CaCl2 brines. The density of the brine played an important role for CO2 sequestration at the pore scale, and CO2 storability also depends on the nature of the rock during injection as a result of the offset of the local equilibrium. This offset results in changes in the petrophysical nature of the formation.

3.4. Porosity Reduction and Permeability Variation

The porosity and permeability of the core sample changed compared to reference measurements (as explained previously) after the core flooding experiments under different brine compositions and salt types. Table 2 summarizes the results of breakthrough time and reduction in porosity and permeability of the Bentheimer sandstone sample with different salts and brine concentrations. For NaCl brine compositions from 5 wt.% to 25 wt.%, it was observed that the porosity reduction increases down the trend from 1.15% to 6.15%, while permeability reduction was 37% to 51.7%. This indicates that an increase in brine concentration leads to a reduction in both the porosity and the permeability of the core sample, thus affecting CO2 injectivity.
In addition, by using the FEI Quanta FEG 250 high-resolution Scanning Electron Microscope (SEM) interfaced to EDAX Energy Dispersive X-ray Analysis (EDX), a significant amount of salt precipitate, and increased agglomeration salts after core flooding, was observed, as shown in Figure 6.
As shown in Figure 6, the salt precipitate occupied the rock matrix and blocked the flow path of CO2, which in turn could prevent the further injection of CO2 into the deep saline aquifers. Thus, this effect leads to a reduction in porosity of the formation, as well as an impairment of rock permeability.
Higher porosity reduction was noted in the case of CaCl2 brine with a 3.5% reduction in 5 wt.%, while 35.3% was recorded for the 25 wt.% CaCl2 brine composition. Here, the degree of reduction in porosity is higher than that of the NaCl brine. This is due to the presence of precipitated salt during CO2 injection, with its drying-out effects that eventually plug the smaller, narrower pores and thereby make the core sample exhibit less tortuous flow paths. However, a lower reduction in permeability was observed in this scenario, with 19.4% and 43.1% representing the lowest composition and highest brine composition, respectively. These variations in porosity and permeability reduction make it more complex to compare the salting-out effect of NaCl and CaCl2.
Consequently, a higher degree of reduction in porosity was observed within the different concentrations of brine prepared from KCl salt. The lowest KCl brine concentration was found to have a 20.8% porosity reduction, while the 25 wt.% brine had a reduction of 33.8%. There is a higher degree of blockage or plugging of the pore spaces in all the concentrations of this brine as compared to the NaCl brine. The permeability reduction increased with an increase in brine concentration.
The highest reduction in the reservoir properties (porosity and permeability) of the core sample was observed with brine prepared from MgCl2. The reduction in these properties indicates a higher amount of salt deposition inside the core sample. Porosity reduction was as high as 40.9%, while permeability impairment was as high as 63.3% for the highest brine concentration prepared from MgCl2. Thus, an increase in brine concentration resulted in a reduction of both the porosity and permeability of the core samples.
From all the results obtained, it is clear that the best salinity in terms of performance for CO2 storage in the deep saline aquifer is between the range of 10 to 20 wt.%, and this can be used as a possible criterion for screening purposes. Furthermore, reservoirs with high levels of divalent salts do not make very good sequestration sites. KCl also does affect the storability of the CO2 in deep saline aquifers. Interestingly, the interplay between the salt and the brine plays an important role in the drying-out effect and, hence, the CO2 storability. The pressure decay tests showcased the solubility of CO2 in different brine concentrations and types, and is an indication that the brines with higher CO2 solubilities will effectively present better sequestration. This was, however, not the case as subsequent tests regarding CO2 storage showed a different narrative. The ability of a salt to precipitate out of solution is also tied to its solubility and, hence, the drying-out effect and CO2 storability will be affected by that phenomenon.
The results effectively showed that aquifers with a significant proportion of divalent salts are expected to present challenges to the injectivity during CO2 aquifer storage. This is in the form of permeability and porosity reduction, and also the CO2 solubility in brine. The findings detailed only the fluid interactions (CO2 and brines) without the reactionary proponent—the rock. This is to better understand the extent to which salt type and concentration could affect the overall sequestration processes. Individual tests were essential to ascertain their unique dispositions when it comes to injectivity investigations in porous media at elevated reservoir conditions. As such, this data will provide an avenue to screen storage sites for an effective injection strategy. Harnessing the potential of an aquifer to leverage all the CO2 trapping mechanisms can be affected with these findings. Preference for the type of trapping mechanism can be ascertained by knowing the dominant salt type in terms of mineralization, solubility, and ability to trap free CO2.
The limitation of this study is that it only applies to sandstone rocks, and perhaps this effect cannot be extended to more reactive formation types such as carbonates; however, it is indicative of possible underlying inferences.

4. Conclusions

The interaction between CO2 and the various salt concentrations in a core sample with respect to CO2 stored and produced (collected), the solubility of CO2, pressure decay rate, CO2–brine flow behavior, and a reduction of sandstone porosity and permeability has been studied. The following conclusions can be drawn from this work:
  • The optimum range for CO2 sequestration in deep saline aquifers is within the range of 10 wt.% to 20 wt.% concentration (salinity). A substantial volume of CO2 was found to be stored at this range of brine concentration;
  • An increase in the brine density because of an increase in salinity reduces the free flow path of gas, as well as reduces the CO2 storage capacity;
  • Breakthrough times of CO2 from the core sample at lower brine concentrations are longer than those of the higher brine concentrations. This implies that the CO2–brine–rock interaction is predominant at lower brine concentrations;
  • A higher pressure decay rate indicates high solubility of CO2 in different brine solutions in a porous media. The solubility of CO2 is clearly dependent on the salt type as well as the concentration of the brine;
  • The high fluctuation of differential pressure (dp) indicates that there is a slug-type flow in the core sample as the CO2 is injected into the simulated deep saline aquifer;
  • The salting-out effect at the highest brine concentration is greater in MgCl2 and CaCl2 brine as compared to NaCl and KCl brine;
  • An increase in brine concentration leads to a reduction in both the porosity and permeability of the core sample. Thus, the decrease in permeability is generally observed due to salt deposition, which was influenced by the concentration of the brines tested;
  • Salt solubility in water/aqueous phase also affects the storability of CO2 in deep saline aquifers with highly insoluble salts precipitating out more easily than their higher solubility counterparts. The drying-out effect was observed to be more noticeable in the divalent brine scenarios compared to the monovalent scenarios. However, KCl showed a lower tolerance in terms of CO2 storability compared to its monovalent counterpart, NaCl.
Future work would cover the carbonate rock counterparts and the evaluation of similar salt types on injectivity. The effluent water chemistry will be characterized to investigate the rock matrix subsistence and other morphological deterioration of the carbonate rocks during CO2 storage. Furthermore, CO2–brine relative permeabilities at different concentrations and conditions will be carried out, and its effect of brine type on the injectivity of CO2 for aquifer storage will be investigated. In addition, tests on brines comprised of a mixture of different salts in varying proportions will be carried out to identify mitigating salt species in terms of storage efficiency.

Author Contributions

Conceptualization, D.E.E., A.N., and M.B.; methodology, D.E.E. and M.K.A.; writing—original draft preparation, D.E.E. and Z.N.; writing—review and editing, all authors; supervision, A.N. and M.B. All authors have read and agreed to the published version of the manuscript.

Funding

This research received no external funding.

Institutional Review Board Statement

Not applicable.

Informed Consent Statement

Not applicable.

Data Availability Statement

Not applicable.

Conflicts of Interest

The authors declare no conflict of interest.

Nomenclature

Across sectional area of the flow (cm2)
Qflow rate (cm3/s)
ΔVvolume of the gas passing through the core sample (cm3)
ΔTtime (s)
Kpermeability of the sample (millidarcies, md)
Llength of the core sample (cm)
Paabsolute atmospheric pressure (atm)
P1upstream pressure (atm)
P2downstream pressure (atm)
ΔPdifferential pressure (psig)
Vflow volume (mL)
Vcvolume of sample chamber (mL)
Vggrain volume (mL)
Vrvolume of reference chamber (mL)
Vvvolume of valve displacement (mL)
µfluid viscosity (cP)

References

  1. Raza, A.; Gholami, R.; Meiyu, G.; Rasouli, V.; Bhatti, A.A.; Rezaee, R. A review on the natural gas potential of Pakistan for the transition to a low-carbon future. Energy Sources Part A Recovery Util. Environ. Eff. 2019, 41, 1149–1159. [Google Scholar] [CrossRef]
  2. Raza, A.; Meiyu, G.; Gholami, R.; Rezaee, R.; Rasouli, V.; Sarmadivaleh, M.; Bhatti, A.A. Shale gas: A solution for energy crisis and lower CO2 emission in Pakistan. Energy Sources Part A Recovery Util. Environ. Eff. 2018, 40, 1647–1656. [Google Scholar] [CrossRef]
  3. Ahmed Bhuiyan, M.; Rashid Khan, H.U.; Zaman, K.; Hishan, S.S. Measuring the impact of global tropospheric ozone, carbon dioxide and sulfur dioxide concentrations on biodiversity loss. Environ. Res. 2018, 160, 398–411. [Google Scholar] [CrossRef]
  4. Bensouilah, R.; Knani, S.; Mansour, S.; Ksibi, Z. Chapter 2—Air pollution (volatile organic compound, etc.) and climate change. In Current Trends and Future Developments on (Bio-) Membranes; Figoli, A., Li, Y., Basile, A., Eds.; Elsevier: Amsterdam, The Netherlands, 2020; pp. 31–46. [Google Scholar] [CrossRef]
  5. Dincer, I.; Zamfirescu, C. Comprehensive energy systems: Part A—Section 1.3: Environmental Dimensions of Energy; Elsevier: Amsterdam, The Netherlands, 2018. [Google Scholar]
  6. Liu, Y.; Hou, M.; Yang, G.; Han, B. Solubility of CO2 in aqueous solutions of NaCl, KCl, CaCl2 and their mixed salts at different temperatures and pressures. J. Supercrit. Fluids 2011, 56, 125–129. [Google Scholar] [CrossRef]
  7. Keong, C.Y. Chapter 3—The United Nations’ journey to global environmental sustainability since Stockholm: The paradox. In Global Environmental Sustainability; Keong, C.Y., Ed.; Elsevier: Amsterdam, The Netherlands, 2021; pp. 63–212. [Google Scholar] [CrossRef]
  8. Baena-Moreno, F.M.; Rodríguez-Galán, M.; Vega, F.; Alonso-Fariñas, B.; Vilches Arenas, L.F.; Navarrete, B. Carbon capture and utilization technologies: A literature review and recent advances. Energy Sources Part A Recovery Util. Environ. Eff. 2019, 41, 1403–1433. [Google Scholar] [CrossRef]
  9. Cuéllar-Franca, R.M.; Azapagic, A. Carbon capture, storage and utilisation technologies: A critical analysis and comparison of their life cycle environmental impacts. J. CO2 Util. 2015, 9, 82–102. [Google Scholar] [CrossRef]
  10. Sokama-Neuyam, Y.A.; Ursin, J.R.; Boakye, P. Experimental Investigation of the Mechanisms of Salt Precipitation during CO2 Injection in Sandstone. C—J. Carbon Res. 2019, 5, 4. [Google Scholar] [CrossRef] [Green Version]
  11. Holloway, S. An overview of the underground disposal of carbon dioxide. Energy Convers. Manag. 1997, 38, S193–S198. [Google Scholar] [CrossRef]
  12. Holloway, S. Safety of the underground disposal of carbon dioxide. Energy Convers. Manag. 1997, 38, S241–S245. [Google Scholar] [CrossRef]
  13. Gunter, W.D.; Bachu, S.; Law, D.H.S.; Marwaha, V.; Drysdale, D.L.; Macdonald, D.E.; McCann, T.J. Technical and economic feasibility of CO2 disposal in aquifers within the Alberta sedimentary basin, Canada. Energy Convers. Manag. 1996, 37, 1135–1142. [Google Scholar] [CrossRef]
  14. IPCC. Climate Change 2014: Mitigation of Climate Change. Contribution of Working Group III to the Fifth Assessment Report of the Intergovernmental Panel on Climate Change; Cambridge University Press: Cambridge, UK; New York, NY, USA, 2014; p. 1454. [Google Scholar]
  15. Spycher, N.; Pruess, K.; Ennis-King, J. CO2-H2O mixtures in the geological sequestration of CO2. I. Assessment and calculation of mutual solubilities from 12 to 100 C and up to 600 bar. Geochim. Cosmochim. Acta 2003, 67, 3015–3031. [Google Scholar] [CrossRef]
  16. IPCC. IPCC Special Report on Carbon Dioxide Capture and Storage. Prepared by Working Group III of the Intergovernmental Panel on Climate Change; Cambridge University Press: Cambridge, UK; New York, NY, USA, 2005; p. 442. [Google Scholar]
  17. Zhao, H.; Liao, X.; Chen, Y.; Zhao, X. Sensitivity analysis of CO2 sequestration in saline aquifers. Pet. Sci. 2010, 7, 372–378. [Google Scholar] [CrossRef] [Green Version]
  18. Grude, S.; Landrø, M.; Dvorkin, J. Pressure effects caused by CO2 injection in the Tubåen Fm., the Snøhvit field. Int. J. Greenh. Gas Control 2014, 27, 178–187. [Google Scholar] [CrossRef]
  19. Muller, N.; Qi, R.; Mackie, E.; Pruess, K.; Blunt, M.J. CO2 injection impairment due to halite precipitation. Energy Procedia 2009, 1, 3507–3514. [Google Scholar] [CrossRef] [Green Version]
  20. Ott, H.; Roels, S.; De Kloe, K. Salt precipitation due to supercritical gas injection: I. Capillary-driven flow in unimodal sandstone. Int. J. Greenh. Gas Control 2015, 43, 247–255. [Google Scholar] [CrossRef] [Green Version]
  21. Peysson, Y.; André, L.; Azaroual, M. Well injectivity during CO2 storage operations in deep saline aquifers—Part 1: Experimental investigation of drying effects, salt precipitation and capillary forces. Int. J. Greenh. Gas Control 2014, 22, 291–300. [Google Scholar] [CrossRef] [Green Version]
  22. Miri, R.; Hellevang, H. Salt precipitation during CO2 storage—A review. Int. J. Greenh. Gas Control 2016, 51, 136–147. [Google Scholar] [CrossRef]
  23. Cinar, Y.; Riaz, A. Carbon dioxide sequestration in saline formations: Part 2—Review of multiphase flow modeling. J. Pet. Sci. Eng. 2014, 124, 381–398. [Google Scholar] [CrossRef]
  24. Hurter, S.; Berge, J.G.; Labregere, D. Simulations for CO2 injection projects with compositional simulator. In Proceedings of the Offshore Europe, Scotland, UK, 4–7 September 2007. [Google Scholar]
  25. Baumann, G.; Henninges, J.; De Lucia, M. Monitoring of saturation changes and salt precipitation during CO2 injection using pulsed neutron-gamma logging at the Ketzin pilot site. Int. J. Greenh. Gas Control 2014, 28, 134–146. [Google Scholar] [CrossRef] [Green Version]
  26. Sminchak, J.; Zeller, E.; Bhattacharya, I. Analysis of unusual scale build-up in a CO2 injection well for a pilot-scale CO2 storage demonstration project. Greenh. Gases Sci. Technol. 2014, 4, 357–366. [Google Scholar] [CrossRef]
  27. Bacci, G.; Korre, A.; Durucan, S. Experimental investigation into salt precipitation during CO2 injection in saline aquifers. Energy Procedia 2011, 4, 4450–4456. [Google Scholar] [CrossRef] [Green Version]
  28. Pruess, K. Formation dry-out from CO2 injection into saline aquifers: 2. Analytical model for salt precipitation. Water Resour. Res. 2009, 45. [Google Scholar] [CrossRef] [Green Version]
  29. Kleinitz, W.; Koehler, M.; Dietzsch, G. The precipitation of salt in gas producing wells. In Proceedings of the SPE European formation damage conference, The Hague, The Netherlands, 21–22 May 2001. [Google Scholar]
  30. Pruess, K.; Müller, N. Formation dry-out from CO2 injection into saline aquifers: 1. Effects of solids precipitation and their mitigation. Water Resour. Res. 2009, 45. [Google Scholar] [CrossRef] [Green Version]
  31. Görgényi, M.; Dewulf, J.; Van Langenhove, H.; Héberger, K. Aqueous salting-out effect of inorganic cations and anions on non-electrolytes. Chemosphere 2006, 65, 802–810. [Google Scholar] [CrossRef] [PubMed]
  32. Hasseine, A.; Meniai, A.-H.; Korichi, M. Salting-out effect of single salts NaCl and KCl on the LLE of the systems (water+toluene+acetone),(water+cyclohexane+2-propanol) and (water+xylene+methanol). Desalination 2009, 242, 264–276. [Google Scholar] [CrossRef]
  33. Hey, M.J.; Jackson, D.P.; Yan, H. The salting-out effect and phase separation in aqueous solutions of electrolytes and poly (ethylene glycol). Polymer 2005, 46, 2567–2572. [Google Scholar] [CrossRef]
  34. Millero, F.J.; Huang, F.; Laferiere, A.L. Solubility of oxygen in the major sea salts as a function of concentration and temperature. Mar. Chem. 2002, 78, 217–230. [Google Scholar] [CrossRef]
  35. Miri, R.; van Noort, R.; Aagaard, P.; Hellevang, H. New insights on the physics of salt precipitation during injection of CO2 into saline aquifers. Int. J. Greenh. Gas Control 2015, 43, 10–21. [Google Scholar] [CrossRef]
  36. Jacob, R.; Saylor, B.Z. CO2 solubility in multi-component brines containing NaCl, KCl, CaCl2 and MgCl2 at 297 K and 1–14 MPa. Chem. Geol. 2016, 424, 86–95. [Google Scholar] [CrossRef]
  37. Tong, D.; Trusler, J.M.; Vega-Maza, D. Solubility of CO2 in aqueous solutions of CaCl2 or MgCl2 and in a synthetic formation brine at temperatures up to 423 K and pressures up to 40 MPa. J. Chem. Eng. Data 2013, 58, 2116–2124. [Google Scholar] [CrossRef]
  38. Boström, M.; Ninham, B. Contributions from dispersion and Born self-free energies to the solvation energies of salt solutions. J. Phys. Chem. B 2004, 108, 12593–12595. [Google Scholar] [CrossRef]
  39. Li, Z.; Dong, M.; Li, S.; Dai, L. Densities and solubilities for binary systems of carbon dioxide+ water and carbon dioxide+brine at 59 C and pressures to 29 MPa. J. Chem. Eng. Data 2004, 49, 1026–1031. [Google Scholar] [CrossRef]
  40. Austegard, A.; Solbraa, E.; De Koeijer, G.; Mølnvik, M. Thermodynamic models for calculating mutual solubilities in H2O–CO2–CH4 mixtures. Chem. Eng. Res. Des. 2006, 84, 781–794. [Google Scholar] [CrossRef]
  41. Chapoy, A.; Mohammadi, A.; Chareton, A.; Tohidi, B.; Richon, D. Measurement and modeling of gas solubility and literature review of the properties for the carbon dioxide—Water system. Ind. Eng. Chem. Res. 2004, 43, 1794–1802. [Google Scholar] [CrossRef]
  42. Diamond, L.W.; Akinfiev, N.N. Solubility of CO2 in water from −1.5 to 100 C and from 0.1 to 100 MPa: Evaluation of literature data and thermodynamic modelling. Fluid Phase Equilibria 2003, 208, 265–290. [Google Scholar] [CrossRef]
  43. Veiga, B.A.; dos Santos, J.T.F.; Junior, L.F.d.L.L.; Corazza, M.L. Phase equilibrium measurements and thermodynamic modelling for the systems involving valeric acid, ethanol, ethyl valerate and water plus CO2. J. Chem. Thermodyn. 2017, 112, 240–248. [Google Scholar] [CrossRef]
  44. Nighswander, J.A.; Kalogerakis, N.; Mehrotra, A.K. Solubilities of carbon dioxide in water and 1 wt.% sodium chloride solution at pressures up to 10 MPa and temperatures from 80 to 200. degree. C. J. Chem. Eng. Data 1989, 34, 355–360. [Google Scholar] [CrossRef]
  45. Rumpf, B.; Nicolaisen, H.; Öcal, C.; Maurer, G. Solubility of carbon dioxide in aqueous solutions of sodium chloride: Experimental results and correlation. J. Solut. Chem. 1994, 23, 431–448. [Google Scholar] [CrossRef]
  46. Spycher, N.; Pruess, K. A phase-partitioning model for CO2–brine mixtures at elevated temperatures and pressures: Application to CO2-enhanced geothermal systems. Transp. Porous Media 2010, 82, 173–196. [Google Scholar] [CrossRef] [Green Version]
  47. Kiepe, J.; Horstmann, S.; Fischer, K.; Gmehling, J. Experimental determination and prediction of gas solubility data for CO2+H2O mixtures containing NaCl or KCl at temperatures between 313 and 393 K and pressures up to 10 MPa. Ind. Eng. Chem. Res. 2002, 41, 4393–4398. [Google Scholar] [CrossRef]
  48. Izgec, O.; Demiral, B.; Bertin, H.J.; Akin, S. Experimental and numerical investigation of carbon sequestration in saline aquifers. In SPE/EPA/DOE Exploration and Production Environmental Conference; Society of Petroleum Engineers: Dallas, TX, USA, 2005. [Google Scholar]
  49. Liu, H.-H.; Zhang, G.; Yi, Z.; Wang, Y. A permeability-change relationship in the dryout zone for CO2 injection into saline aquifers. Int. J. Greenh. Gas Control 2013, 15, 42–47. [Google Scholar] [CrossRef]
  50. Zhang, S.; Liu, H.-H. Porosity–permeability relationships in modeling salt precipitation during CO2 sequestration: Review of conceptual models and implementation in numerical simulations. Int. J. Greenh. Gas Control 2016, 52, 24–31. [Google Scholar] [CrossRef]
  51. Yang, F.; Bai, B.; Tang, D.; Shari, D.-N.; David, W. Characteristics of CO2 sequestration in saline aquifers. Pet. Sci. 2010, 7, 83–92. [Google Scholar] [CrossRef] [Green Version]
  52. Belgodere, C.; Dubessy, J.; Vautrin, D.; Caumon, M.-C.; Sterpenich, J.; Pironon, J.; Robert, P.; Randi, A.; Birat, J.-P. Experimental determination of CO2 diffusion coefficient in aqueous solutions under pressure at room temperature via Raman spectroscopy: Impact of salinity (NaCl). J. Raman Spectrosc. 2015, 46, 1025–1032. [Google Scholar] [CrossRef]
  53. Uelker, B.; Alkan, H.; Pusch, G. Implications of the phase-solubility behaviour on the performance predictions of the CO2 trapping in depleted gas reservoir and aquifers. In Proceedings of the EUROPEC/EAGE Conference and Exhibition, London, UK, 11–14 June 2007. [Google Scholar]
  54. Olajire, A.A. A review of mineral carbonation technology in sequestration of CO2. J. Pet. Sci. Eng. 2013, 109, 364–392. [Google Scholar] [CrossRef]
  55. Balashov, V.N.; Guthrie, G.D.; Lopano, C.L.; Hakala, J.A.; Brantley, S.L. Reaction and diffusion at the reservoir/shale interface during CO2 storage: Impact of geochemical kinetics. Appl. Geochem. 2015, 61, 119–131. [Google Scholar] [CrossRef]
  56. Koukouzas, N.; Kypritidou, Z.; Purser, G.; Rochelle, C.A.; Vasilatos, C.; Tsoukalas, N. Assessment of the impact of CO2 storage in sandstone formations by experimental studies and geochemical modeling: The case of the Mesohellenic Trough, NW Greece. Int. J. Greenh. Gas Control 2018, 71, 116–132. [Google Scholar] [CrossRef]
  57. Liu, F.; Lu, P.; Griffith, C.; Hedges, S.W.; Soong, Y.; Hellevang, H.; Zhu, C. CO2–brine–caprock interaction: Reactivity experiments on Eau Claire shale and a review of relevant literature. Int. J. Greenh. Gas Control 2012, 7, 153–167. [Google Scholar] [CrossRef] [Green Version]
  58. Dilmore, R.; Lu, P.; Allen, D.; Soong, Y.; Hedges, S.; Fu, J.K.; Dobbs, C.L.; Degalbo, A.; Zhu, C. Sequestration of CO2 in mixtures of bauxite residue and saline wastewater. Energy Fuels 2008, 22, 343–353. [Google Scholar] [CrossRef]
  59. Pruess, K.; Garcia, J. Multiphase flow dynamics during CO2 disposal into saline aquifers. Environ. Geol. 2002, 42, 282–295. [Google Scholar] [CrossRef]
  60. Rochelle, C.A.; Czernichowski-Lauriol, I.; Milodowski, A. The impact of chemical reactions on CO2 storage in geological formations: A brief review. Geol. Soc. Lond. Spec. Publ. 2004, 233, 87–106. [Google Scholar] [CrossRef]
  61. INC, K.I. Details for Our Sandstone. Available online: https://kocurekindustries.com/sandstone-cores (accessed on 23 March 2019).
  62. Huang, Y.-H.; Yang, S.-Q.; Hall, M.R.; Zhang, Y.-C. The effects of NaCl concentration and confining pressure on mechanical and acoustic behaviors of brine-saturated sandstone. Energies 2018, 11, 385. [Google Scholar] [CrossRef] [Green Version]
  63. Bachu, S.; Bennion, B. Effects of in-situ conditions on relative permeability characteristics of CO2-brine systems. Environ. Geol. 2008, 54, 1707–1722. [Google Scholar] [CrossRef]
  64. Bachu, S. Sequestration of CO2 in geological media: Criteria and approach for site selection in response to climate change. Energy Convers. Manag. 2000, 41, 953–970. [Google Scholar] [CrossRef]
  65. Kaldi, J.G.; Gibson-Poole, C.M. Storage Capacity Estimation, Site Selection and Characterisation for CO2 Storage Projects; CO2CRC: Carlton, Australia, 2008. [Google Scholar]
  66. Ott, H.; de Kloe, K.; Taberner, C.; Marcelis, F.; Wang, Y.; Makurat, A. Rock/fluid interaction by injection of supercritical CO2/H2S: Investigation of dry-zone formation near the injection well. In Proceedings of the International Symposium of the Society of Core Analysts, Halifax, NS, Canada, 4–7 October 2010. [Google Scholar]
  67. Calabrese, M.; Masserano, F.; Blunt, M.J. Simulation of physical-chemical processes during carbon dioxide sequestration in geological structures. In SPE Annual Technical Conference and Exhibition; OnePetro: Dallas, TX, USA, 2005. [Google Scholar]
  68. Edem, D.; Abba, M.; Nourian, A.; Babaie, M.; Mohammed, N. The Effects of Different Salt Types and Concentration on CO2 Injectivity During CO2 Sequestration in Deep Saline Aquifers. In Proceedings of the SPE Nigeria Annual International Conference and Exhibition, Virtual, 11–13 August 2020. [Google Scholar]
  69. Edem, D.; Abba, M.; Nourian, A.; Babaie, M.; Naeem, Z. Experimental Investigation of the Extent of the Impact of Halite Precipitation on CO2 Injection in Deep Saline Aquifers. In Proceedings of the SPE Europec featured at 82nd EAGE Conference and Exhibition, Amsterdam, The Netherlands, 18–21 October 2021. [Google Scholar]
  70. Abba, M.K.; Abbas, A.J.; Nasr, G.G.; Al-Otaibi, A.; Burby, M.; Saidu, B.; Suleiman, S.M. Solubility trapping as a potential secondary mechanism for CO2 sequestration during enhanced gas recovery by CO2 injection in conventional natural gas reservoirs: An experimental approach. J. Nat. Gas Sci. Eng. 2019, 71, 103002. [Google Scholar] [CrossRef]
  71. Abba, M.K. Enhanced gas recovery by CO2 injection: Influence of monovalent and divalent brines and their concentrations on CO2 dispersion in porous media. J. Nat. Gas Sci. Eng. 2020, 84, 103643. [Google Scholar] [CrossRef]
  72. Abba, M.K.; Al-Othaibi, A.; Abbas, A.J.; Nasr, G.G.; Mukhtar, A. Experimental investigation on the impact of connate water salinity on dispersion coefficient in consolidated rocks cores during Enhanced Gas Recovery by CO2 injection. J. Nat. Gas Sci. Eng. 2018, 60, 190–201. [Google Scholar] [CrossRef]
  73. Duan, Z.; Sun, R. An improved model calculating CO2 solubility in pure water and aqueous NaCl solutions from 273 to 533 K and from 0 to 2000 bar. Chem. Geol. 2003, 193, 257–271. [Google Scholar] [CrossRef]
Figure 1. Schematic diagram of the core flooding experimental setup showing the path of the pressure decay test.
Sustainability 14 00986 g001
Figure 2. Differential pressure (dp) vs. time for flow behavior of CO2 in different salt concentrations.
Sustainability 14 00986 g002
Figure 3. Pressure decay test for different salt concentrations.
Sustainability 14 00986 g003
Figure 4. Pressure decay rate vs. brine concentration for all the salt types and concentrations.
Sustainability 14 00986 g004
Figure 5. CO2 collected after saturating the core sample at different salt concentrations.
Sustainability 14 00986 g005
Figure 6. (a) SEM micrograph of a fresh core sample before core flooding, (b) SEM micrograph after core flooding, showing the agglomeration of precipitated salt, and (c) mapping analysis from EDX using a SEM of the Bentheimer sandstone.
Sustainability 14 00986 g006
Table 1. Pressure decay evaluation for the core sample at different concentrations.
Salt TypeBrine
Concentration
(wt.%)
Pressure
Change
(psi)
Pressure
Decay
Rate
(psi/min)
Brine
Saturation
(%)
NaCl5%
10%
15%
20%
25%
16 ± 0.3
8 ± 0.3
11 ± 0.3
10 ± 0.3
6 ± 0.4
1.06
0.53
0.73
0.60
0.40
89
87
91
85
91
CaCl25%
10%
15%
20%
25%
2 ± 0.2
4 ± 0.2
4 ± 0.2
5 ± 0.3
2 ± 0.1
0.13
0.23
0.26
0.30
0.13
87
96
85
97
89
KCl5%
10%
15%
20%
25%
5 ± 0.2
8 ± 0.4
2 ± 0.3
6 ± 0.4
3 ± 0.2
0.30
0.53
0.13
0.40
0.20
85
90
91
92
96
MgCl25%
10%
15%
20%
25%
8 ± 0.4
4 ± 0.3
3 ± 0.5
7 ± 0.8
6 ± 0.2
0.53
0.25
0.20
0.46
0.40
89
89
95
95
93
Table 2. Summary of core flooding results for Bentheimer sandstone (at a reservoir pressure of 1100 psig and temperature of 45 °C).
Salt TypeSalt
Concentration
(wt.%)
% of Porosity
Reduction
% of Permeability
Reduction
NaCl5
10
15
20
25
1.2
1.9
3.4
3.6
6.2
37.0
42.0
49.1
50.0
51.7
CaCl25
10
15
20
25
3.5
24.6
25.3
27.4
35.3
19.4
27.5
31.0
37.0
43.1
KCl5
10
15
20
25
20.8
21.7
24.8
33.6
33.8
17.1
23.7
31.0
40.8
44.2
MgCl25
10
15
20
25
22.8
24.8
34.2
36.2
40.9
44.2
56.1
61.3
62.1
63.3
Publisher’s Note: MDPI stays neutral with regard to jurisdictional claims in published maps and institutional affiliations.

