Article

Milk Fat Depression and Trans-11 to Trans-10 C18:1 Shift in Milk of Two Cattle Farming Systems

1
Consiglio per la Ricerca in Agricoltura e l’Analisi dell’Economia Agraria (CREA), Centro di Ricerca Zootecnia e Acquacoltura (Research Centre for Animal Production and Aquaculture), Via Salaria 31, Monterotondo, 00016 Rome, Italy
2
Consiglio per la Ricerca in Agricoltura e l’Analisi dell’Economia Agraria (CREA), Centro di Ricerca Zootecnia e Acquacoltura (Research Centre for Animal Production and Aquaculture), S.S. 7 Via Appia, Bella Muro, 85051 Bella, Italy
*
Author to whom correspondence should be addressed.
Sustainability 2022, 14(2), 977; https://doi.org/10.3390/su14020977
Submission received: 11 October 2021 / Revised: 15 December 2021 / Accepted: 13 January 2022 / Published: 16 January 2022
(This article belongs to the Special Issue Biodiversity 2021: Agriculture, Environment and Wellbeing)

Abstract

:
Milk fat depression (MFD) syndrome, a consistent decrease in milk fat content, is related to important changes in fatty acid composition due to feed imbalances and the consequent ruminal metabolism alteration. Milk produced in two different farming systems was compared: Holstein Friesian fed with unified in intensive production and Podolica raised on a pasture in an extensive system. Milk chemical characteristics and fatty acid composition were determined comparing milk with a normal fat level (>3.8%) to milk with a low fat level (<3.2%) in each breeding system. Holstein Friesian milk showed the decrease in trans-11 and increase in trans-10 C18:1 (shift from trans-11 to trans-10 C18:1) in low fat with respect to normal fat milk with a consequent decrease in the trans-11/trans-10 C18:1 ratio. Even conjugated linoleic acid (CLA), C18:2 cis-9, trans-11, was lower while CLA trans-10, cis-12 was higher in low fat milk than in normal fat milk from Holstein Friesian. These changes, that are indicators of MFD syndrome, were not found in Podolica milk between fat levels. Holstein Friesian milk showed less short-chain fatty acids (9.48 % vs. 11.05%, p < 0.001), trans vaccenic acid (C18:1 trans-11, 0.51% vs. 3.39%, p < 0.001), rumenic acid (CLA C18:2 cis-9, trans-11, 0.32% vs. 1.45%, p < 0.001) and total CLA (0.53% vs. 1.91%, p < 0.001) contents than Podolica milk. Further losses of these human healthy nutrients in low fat Friesian milk reduced the nutritional quality of the milk, while the milk from animals raised on the pasture was of better quality even when the level of fat was low.

1. Introduction

Milk fatty acid composition depends on numerous intrinsic factors such as animal breed, lactation stages, birth season and environment factors such as the dairy cattle production system and feed management [1]. These factors are the same that also affect the milk fat content [2] and the rumen microorganism activity and fermentation [3], also because the rumen activity is strongly linked to diet composition [4].
Intensive dairy cattle diets containing high concentrations of highly digestible cereals are widely used to maximize milk production, but such diets often induce milk fat depression (MFD) syndrome [5,6]. The MFD syndrome consists of a remarkable decrease in milk fat content (50 % or more), without lactose and proteins modification, related to important changes in fatty acid composition due to feed imbalances and consequent ruminal metabolism alteration [7,8]. The mechanisms involved in MFD syndrome depend on a diet containing high concentrates and low levels of fiber, due to a high amount of corn silage, soy flour and oilseed in the ration but also lipid supplements rich in polyunsaturated fatty acids [9,10,11], that improve the content of fatty acids positive for human health [12], but often alter the rumen microorganisms’ activity [7,8].
There are several theories that could explain MFD in dairy ruminants: some of these consider that MFD is due to a direct inhibition of mammary gland synthesis of milk fat [13], while other theories consider this a consequence of the lipid precursors’ lack in the mammary gland [9]. Evidence accumulated over the past decade has focused attention on certain long-chain unsaturated fatty acids as proximal regulators of mammary gland lipogenesis [9,14]. These long-chain unsaturated fatty acids can be produced or modified by some members of the ruminal microbiota, for example, through biohydrogenation reactions [14]. The biohydrogenation pathway of linoleic acid (C18:2) produces stearic acid (C18:0) by intermediary conjugated linoleic acid (CLA) C18:2 cis-9, trans-11, but in conditions inducing MFD there is an alternative route that produces potent inhibitors of milk fat synthesis, the CLA isomers, mostly CLA trans-10, cis-12 [13]. Therefore, inhibitor isomers act on both de novo fatty acid biosynthesis and the uptake of circulating fatty acids. A relationship between MFD manifestation and the shift from trans-11 to trans-10 C18:1 has been demonstrated in dairy cows [15] with a decrease in trans-11 and increase in trans-10 C18:1 which can lead to a decrease in the trans-11/trans-10 C18:1 ratio [15]. MFD syndrome may affect milk quality, due to high levels of CLA trans-10, cis-12 and C18:1 trans-10, that can have unhealthy effects [16]; however, some authors have recently reported a possible beneficial effect of CLA trans-10, cis-12 on human health [17].
The pasture system, also, could cause MFD in cow’s milk, because sometimes the grazing is poor in fiber levels [11], or it could depend on the tannin level in the pasture. In fact, as reported by Morales et al. [18], tannins have antimicrobial properties and they can modify ruminal fatty acids biohydrogenation. On the other hand, even if a grazing system produces a low milk yield, that milk is high in quality and nutritional value because it is rich in CLA and n-3 fatty acids [19]. Extensive dairy cattle production systems, where autochthonous breeds are principally reared, are environmentally sustainable and the obtained milk has a healthy property regarding fatty acid profiles and antioxidant compounds. These characteristics are increasingly appreciated by consumers, who are looking for the quality and sustainability of products, obtained with low environmental impact and ensuring animal welfare [20]. Moreover, extensive production systems contribute to preserving both animal biodiversity, rearing local breeds in marginal areas, and economic sustainability, because the promotion of typical products in the market encourages artisanal techniques for milk processing [21].
The Holstein Friesian breed is a cosmopolitan breed widely selected for a high milk production and it is mainly bred intensively [22]. On the contrary, the Podolica breed is a local cow breed characterized by an extensive and sustainable production system [23], that contributes to maintaining biodiversity, landscape in rural areas and production of typical products with a low environmental impact using artisanal processing [24]. This breed represents one of the most important native Italian breeds raised mainly for beef production and it is an ancestor of other noted Italian breeds. Podolica cattle are seasonal with the calving concentrated in spring, when more food is available at pasture, and the natural pasture is often integrated by mixed hay from August to February [23]. In recent years, this breed is raised only in southern Italian regions due to the consistent reduction of the number of heads, and it is related to specific environments and traditional production systems [24]. However, there is an increasing demand for Podolica milk, and the dairy products especially “Caciocavallo” cheese are very appreciated on the market for their high quality [25,26].
In this work, milk produced in two different farming systems from two different bovine breeds was compared: Holstein Friesian in an intensive production system and Podolica raised on the pasture. The main chemical characteristics and milk fatty acid composition were determined. Furthermore, to evaluate the manifestation of MFD syndrome and its association with consistent changes in fatty acid profile, we compared normal fat level milk and low fat level milk in each breeding system. In particular, CLA trans-10, cis-12, the shift from trans-11 to trans-10 C18:1 with increase in trans-10 C18:1 and the change in trans-11/trans-10 C18:1 ratio were investigated as milk indicators of MFD syndrome.
The objective of this study is to valorise and encourage the diffusion of local breeds in extensive systems. Considering the high incidence of MFD in dairy animals, present even in extensively reared cows as reported by Rivero et al. [11], the goal is to verify whether the effects of MFD on milk quality are different between the two farming systems.

2. Materials and Methods

2.1. Animals

Milk samples were collected from morning milking from two different dairy farms, one located in Central Italy with Holstein Friesian cows raised in an intensive production system, feeding with unifeed, and the other sited in South of Italy with Podolica raised on the pasture without supplementation [23].
The Holstein Friesian cows were averaged between the first and second lactation (1.8 ± 0.8 lactation number, on average) with a milk daily yield of about 29.0 ± 7.6 L/day. The Podolica herd even had animals at the sixth lactation (3.7 ± 2.5 lactation number, on average), just to witness the greater hardiness and longevity of this breed, with a milk production of about 8 L/day. The samples were collected around peak lactation between the end of 2019 and during 2020. In all, about 120 samples were collected.
After analyzing the individual milk fat of the two herds, 14 animals for breed were chosen with a milk fat percentage below 3.2%, considered low fat milk (Lf), to be compared with an equal number of animals for breed showing milk fat values greater than 3.8%, defined as normal fat content (Nf).
This experiment is part of a larger national research project MIQUALAT funded by MIPAAF.

2.2. Sampling and Chemical Composition of Diets

Chemical and nutritional characteristics of diets were performed on a unifeed sample taken from mixing wagon, whilst for the pasture sample it was taken during the spring season. The food samples were dried at 60 °C until a constant weight and finely chopped and stored in a freezer at −20 °C until they were analyzed. The proximate composition of the diet was analyzed for dry matter concentration (AOAC, 2012; 988.05), ash (AOAC, 2012; 942.05), ether extract (AOAC, 2012; 920.39) and crude protein (AOAC, 2012; 988.05) [27].
The concentrations of neutral detergent fiber (NDF), acid detergent fiber (ADF) and non-structural carbohydrates (NSC) were analyzed according to the method described by Van Soest et al. [28]. The principal fatty acids were determined with the same method reported later for milk. Table 1 shows the chemical composition and fatty acids expressed as % of the total fatty acids methyl ester (FAME) of the unifeed and pasture. Each Friesian animal received 47 kg of unifeed daily containing the ingredients reported in Table 1.

2.3. Milk Sampling and Chemical Analysis

The milk samples of about 1 L were taken during the morning milking and placed on ice for transport. At the laboratory, these were gently shaken to prevent the fat from surfacing, and they were divided into 50 mL tubes and frozen at −20 °C for fatty acid analytical determinations. The samples were thawed at about + 4 °C two hours before analysis. The milk proximate composition (fat, total protein and lactose, expressed as % of fresh weight) of each sample was determined by infrared spectrophotometry on fresh milk (ISO 9622 IDF 141:2013) [29].

2.4. Fatty Acids Analysis

Fatty acids extraction was determined according to Folch et al. [30] with chloroform:methanol (2:1) (v:v). Fat was methylated with methanolic KOH and 1 µL was injected in the gas chromatography flame ionization detector (GC-FID) (Agilent Technologies, Santa Clara, CA, United States) with a capillary column CP-Sil88 100 m (0.25 mm, 0.20 µm, 100% cyanopropyl, Agilent Technologies), using C19:0 as the internal standard. The GC-FID conditions were: inlet splitless at 250 °C; FID at 250 °C; helium flow 1.2 mL/min. The oven temperature was: started at 60 °C held 4 min, increased 13 °C/min until 175 °C, held for 27 min, increased 4 °C/min until 215 °C held for 25 °C; increased 2 °C/min until 220 °C held for 5 min.
Peak identifications were completed by comparing the sample peaks with Supelco mix 37 (Sigma-Aldrich Merck, Darmstadt, Germany); mixture branched chain fatty acids BR2 and mixture branched chain fatty acids BR3 (Larodan, Solna, Sweden); mix CLA (Sigma-Aldrich Merck, Darmstadt, Germany) standard peaks. The fatty acid methyl ester was expressed as % of total fatty acids methyl ester (FAME). The amount of total saturated fatty acids (∑SFA), short-chain fatty acids (SCFA, from C4:0 to C12:0), branched chain fatty acids (BCFA), odd chain fatty acids (OCFA) and the others SFA (from C14:0 to C20:0), monounsaturated fatty acids (∑MUFA), subdivided in cis and trans configuration, total polyunsaturated fatty acids (∑PUFA), subdivided in n-6 and n-3, and CLA were determined as the percentage of total FAME. Furthermore, the n-6/n-3 PUFA ratio and trans-11/trans-10 C18:1 ratio were calculated.

2.5. Statistical Analysis

Variance analyses were performed for all data using a bi-factorial model with interaction, according to the following linear model: Yijk = µ + breedi + Fat level j + (breed × Fat level)ij + εijk, where µ = general mean; ε = residual error; breed (that includes also farming system and diet) and fat level as fix factors were considered. The level of significance between the groups was determined according to Tukey’s test with p < 0.05 as the limit to identify significant differences, using the PROC GLM procedure of SAS (SAS Inst. Inc., Cary, NC, USA) [31]. In addition, a correlation analysis within the same breed, between percentage of total fat content and some important fatty acids considered indicators of MFD syndrome, were performed by the PROC CORR procedure of SAS using the Pearson correlation coefficient with a significance threshold of p < 0.05. A principal component analysis (PCA) using all fatty acids and classes of fatty acids was performed with the Unscrambler 10.0 version of CAMO software (Aspen Technology Inc., Bedford, MA, USA), to study the score projection in the plane defined by the two first principal components and to analyze the loading component that absorbed the major variability in this plane.

3. Results and Discussion

3.1. Proximate Composition of Milk

The proximate composition of milk showed significant differences between breeds for the three components considered (Table 2). The low fat content (Lf) milk of Holstein Friesian had on average 2.86% of fat and a decrease of 1.36% compared with the normal fat level (Nf) milk, while protein content decreased from 3.37% to 2.89% on average. In milk from Podolica raised in the pasture system, fat content decreased by 1.66% compared to normal levels (p < 0.001), which presented very high values (on average 4.63%).
The amount of protein was significantly reduced in low fat milk only in the Friesian breed, while it was constant in the Podolica breed, affected by the reduction in the fat/protein (F/P) ratio because the denominator remained constant as the numerator decreased. The F/P ratio, that was 1.3 on average in normal fat milk, was instead 1.03 in Friesian Lf milk and 0.9 in Podolica Lf milk (Table 2). A decrease in milk fat content reaching values below 3% and reduction of the F/P ratio could be indexes of impaired ruminal function as occurs in MFD disease, even if Bauman and Griinari [9] in a review, and more recently other authors [32,33], pointed out that MFD is not usually associated with a reduction of proteins and lactose. However, the slight decrease in milk protein content would be consistent with other studies examining the effect of supplementation of the diet with unsaturated fats in sheep [34], even though the reasons for this unusual response are still uncertain [35]. Although lactose showed a significant difference between genetic types (4.68% in Friesian vs. 4.95% in Podolica milk, on average, p = 0.031), it was not influenced by the milk fat content (Table 2).
Because of the strong influence of milk fat on milk pricing and the consequent loss of quality, MFD is a serious economic problem for dairy producers and elucidating the mechanism underlying MFD thus has been of longstanding interest [6,36].

3.2. Fatty Acid Classes

Considering the main groupings of fatty acids (Table 3), total saturated fatty acids (∑SFA) were on average 65.5% in Podolica, without significant differences between high and low fat milk, while in Holstein Friesian ∑SFA decreased significantly (p < 0.05) in milk with low fat from 66.67 % to 63.96% (interaction breeding x fat level: p = 0.021). This significant difference, probably due to a reduced de novo synthesis from mammary cells of short and medium saturated fatty acids in animals Lf [37], was highlighted by the tendency to a lower amount of short-chain fatty acids (SCFA) in Holstein Friesian milk (8.94% in Lf vs. 10.02% in Nf, p = 0.097).
Although there were not significant differences in the content of ∑SFA between the breeds (p = 0.474), the different groupings, short-chain fatty acids (SCFA, with below to C12 carbon chain), branched chain fatty acids (BCFA) and odd chain fatty acids (OCFA) were significantly higher in the Podolica breed than in Holstein Friesian, underlining the different rumen activity due probably to the high roughage component of the Podolica diet [38].
∑MUFA and cis MUFA were significantly more abundant in Friesian than in Podolica; on the contrary, trans MUFA as C18:1 trans-11 and C18:1 trans-10, the major monounsaturated trans fatty acids, were higher in Podolica, increasing in proportion with the roughage diet as they are mainly of rumen derivation. Furthermore, ∑MUFA in Friesian significantly increased in milk with low fat from 26.49% to 29.60% (p < 0.01). This trend depends on the content of cis isomers, which are the most abundant MUFA (27.21% vs. 24.27% respectively for Lf and Nf in Friesian). In fact, as reported by Thanh et al. [37], the C18:1 cis-9 was higher in animals with fat feed integration that could be one of the probable causes of MFD. On the contrary, ∑MUFA in Podolica was 25.98% on average and it did not show a significant difference between high and low milk fat. Moreover, in Podolica, the trans and cis MUFA did not differ between the two levels of fat.
The content of ∑PUFA was lower in Holstein Friesian milk than in Podolica (p = 0.027) as well as for n-3 PUFA (p < 0.001), probably due to a pasture-based diet in Podolica, while on the contrary n-6 PUFA showed values significantly higher in Friesian (p < 0.001). No significant differences were reported between fat levels for both breeds. The n6/n3 ratio was significantly higher in Friesian (6.89% vs. 2.05%, respectively, for Friesian and Podolica), highlighting the high nutritional value of milk produced by animals raised extensively on pasture [39].
The increase of PUFA in cow’s milk is more important to meet consumer expectations [40]. Excessive intake of saturated fats has been considered one of the main causes of coronary heart diseases, and at present one of the most promising possibilities is to use grazing in order to improve the ratio between polyunsaturated and saturated fats in milk [39].
Generally, decreasing the amount of total fat in food from animals is equivalent to lowering the amount of saturated fatty acids and increasing the polyunsaturated fatty acids. The same thing does not happen in milk as saturated fatty acids are a large family whose components derive from different metabolic processes, some related to the animal and the diet and others related to rumen microorganisms and their activity [4,38]. From this it follows that not all the saturated fatty acids of milk have the same nutritional importance, and those of rumen derivation seem to improve human health; therefore, it is necessary to ensure a good functionality of the rumen bacteria to obtain milk quality [38]. The same concept is extended to CLAs (particularly rumenic acid, C18:2 cis-9, trans-11), and trans isomers of C18:1 as trans vaccenic fatty acid [39]. Milk and dairy products may be an important source of CLA, and increments of the levels of C18:1 trans-11 and PUFA, especially C18:3-n3 and CLA cis-9, trans-11 in milk in grazing cows are generally observed [12].

3.3. Content of Principal Saturated Fatty Acids

With the exception of C12:0, C14:0 and C17:0 anteiso, all principal saturated fatty acids showed significant differences between the two farming systems, with higher levels in Podolica milk than in Friesian milk (Table 4). Only the C16:0 was higher in Friesian than in Podolica milk, with a percentage of +7.38% on average, regardless of fat level.
In particular, the branched (iso and anteiso) and odd chain fatty acids, which are mainly of bacterial origin, are positively influenced by the rumen metabolism and by the fibrous portion of the diet [38], and certainly the diet of Podolica was richer in roughage matter (Table 1). These results were in agreement with Conte et al. [15] who reported a lower de novo synthesis of short and medium-chain fatty acids from mammary glands in animals fed a diet rich in oilseed and concentrate. In fact, the fatty acid from carbon numbers 4 to 14 are synthesized de novo in the mammary gland from acetate and butyric fatty acids that are precursors generated in the rumen by the fermentation of feed components [2]. The long-chain fatty acids instead are originated from dietary lipids and from the lipolysis of adipose tissue triacylglycerols [37].
In Holstein Friesian milk, both C10:0 and C12:0 content decreased significantly (p < 0.05) in the low fat milk compared to the normal fat one, without significant differences in the levels of the other SFA. On the contrary, in Podolica milk the C10:0 and C12:0 content increased significantly in Lf milk compared to Nf milk, while C15:0, C15:0 iso, C18:0 and C20:0 fatty acids were less present in Lf milk (Table 4).
These data highlight a joint effect of the major roughage content in the diet in grazing animals which causes an increase in low-chain fatty acids from rumen but, at the same time, a reduction in long-chain SFA, as the excess fiber did not satisfy the necessary intake of nutrients and animals producing less fat milk had accentuated this trend.
Higher values in C18:0 due to an incomplete biohydrogenation in the rumen are reported also by Thanh et al. [37]. Therefore, some factors could induce changes in milk’s odd and branched fatty acid content particularly during periods of negative energy balance. From these data and from the numerous significant differences found in the interaction between breed and level of fat, we hypothesized that the less level of fat in Podolica was due to a different pathway [37], inducing a particular form of MFD different from Friesian [37].

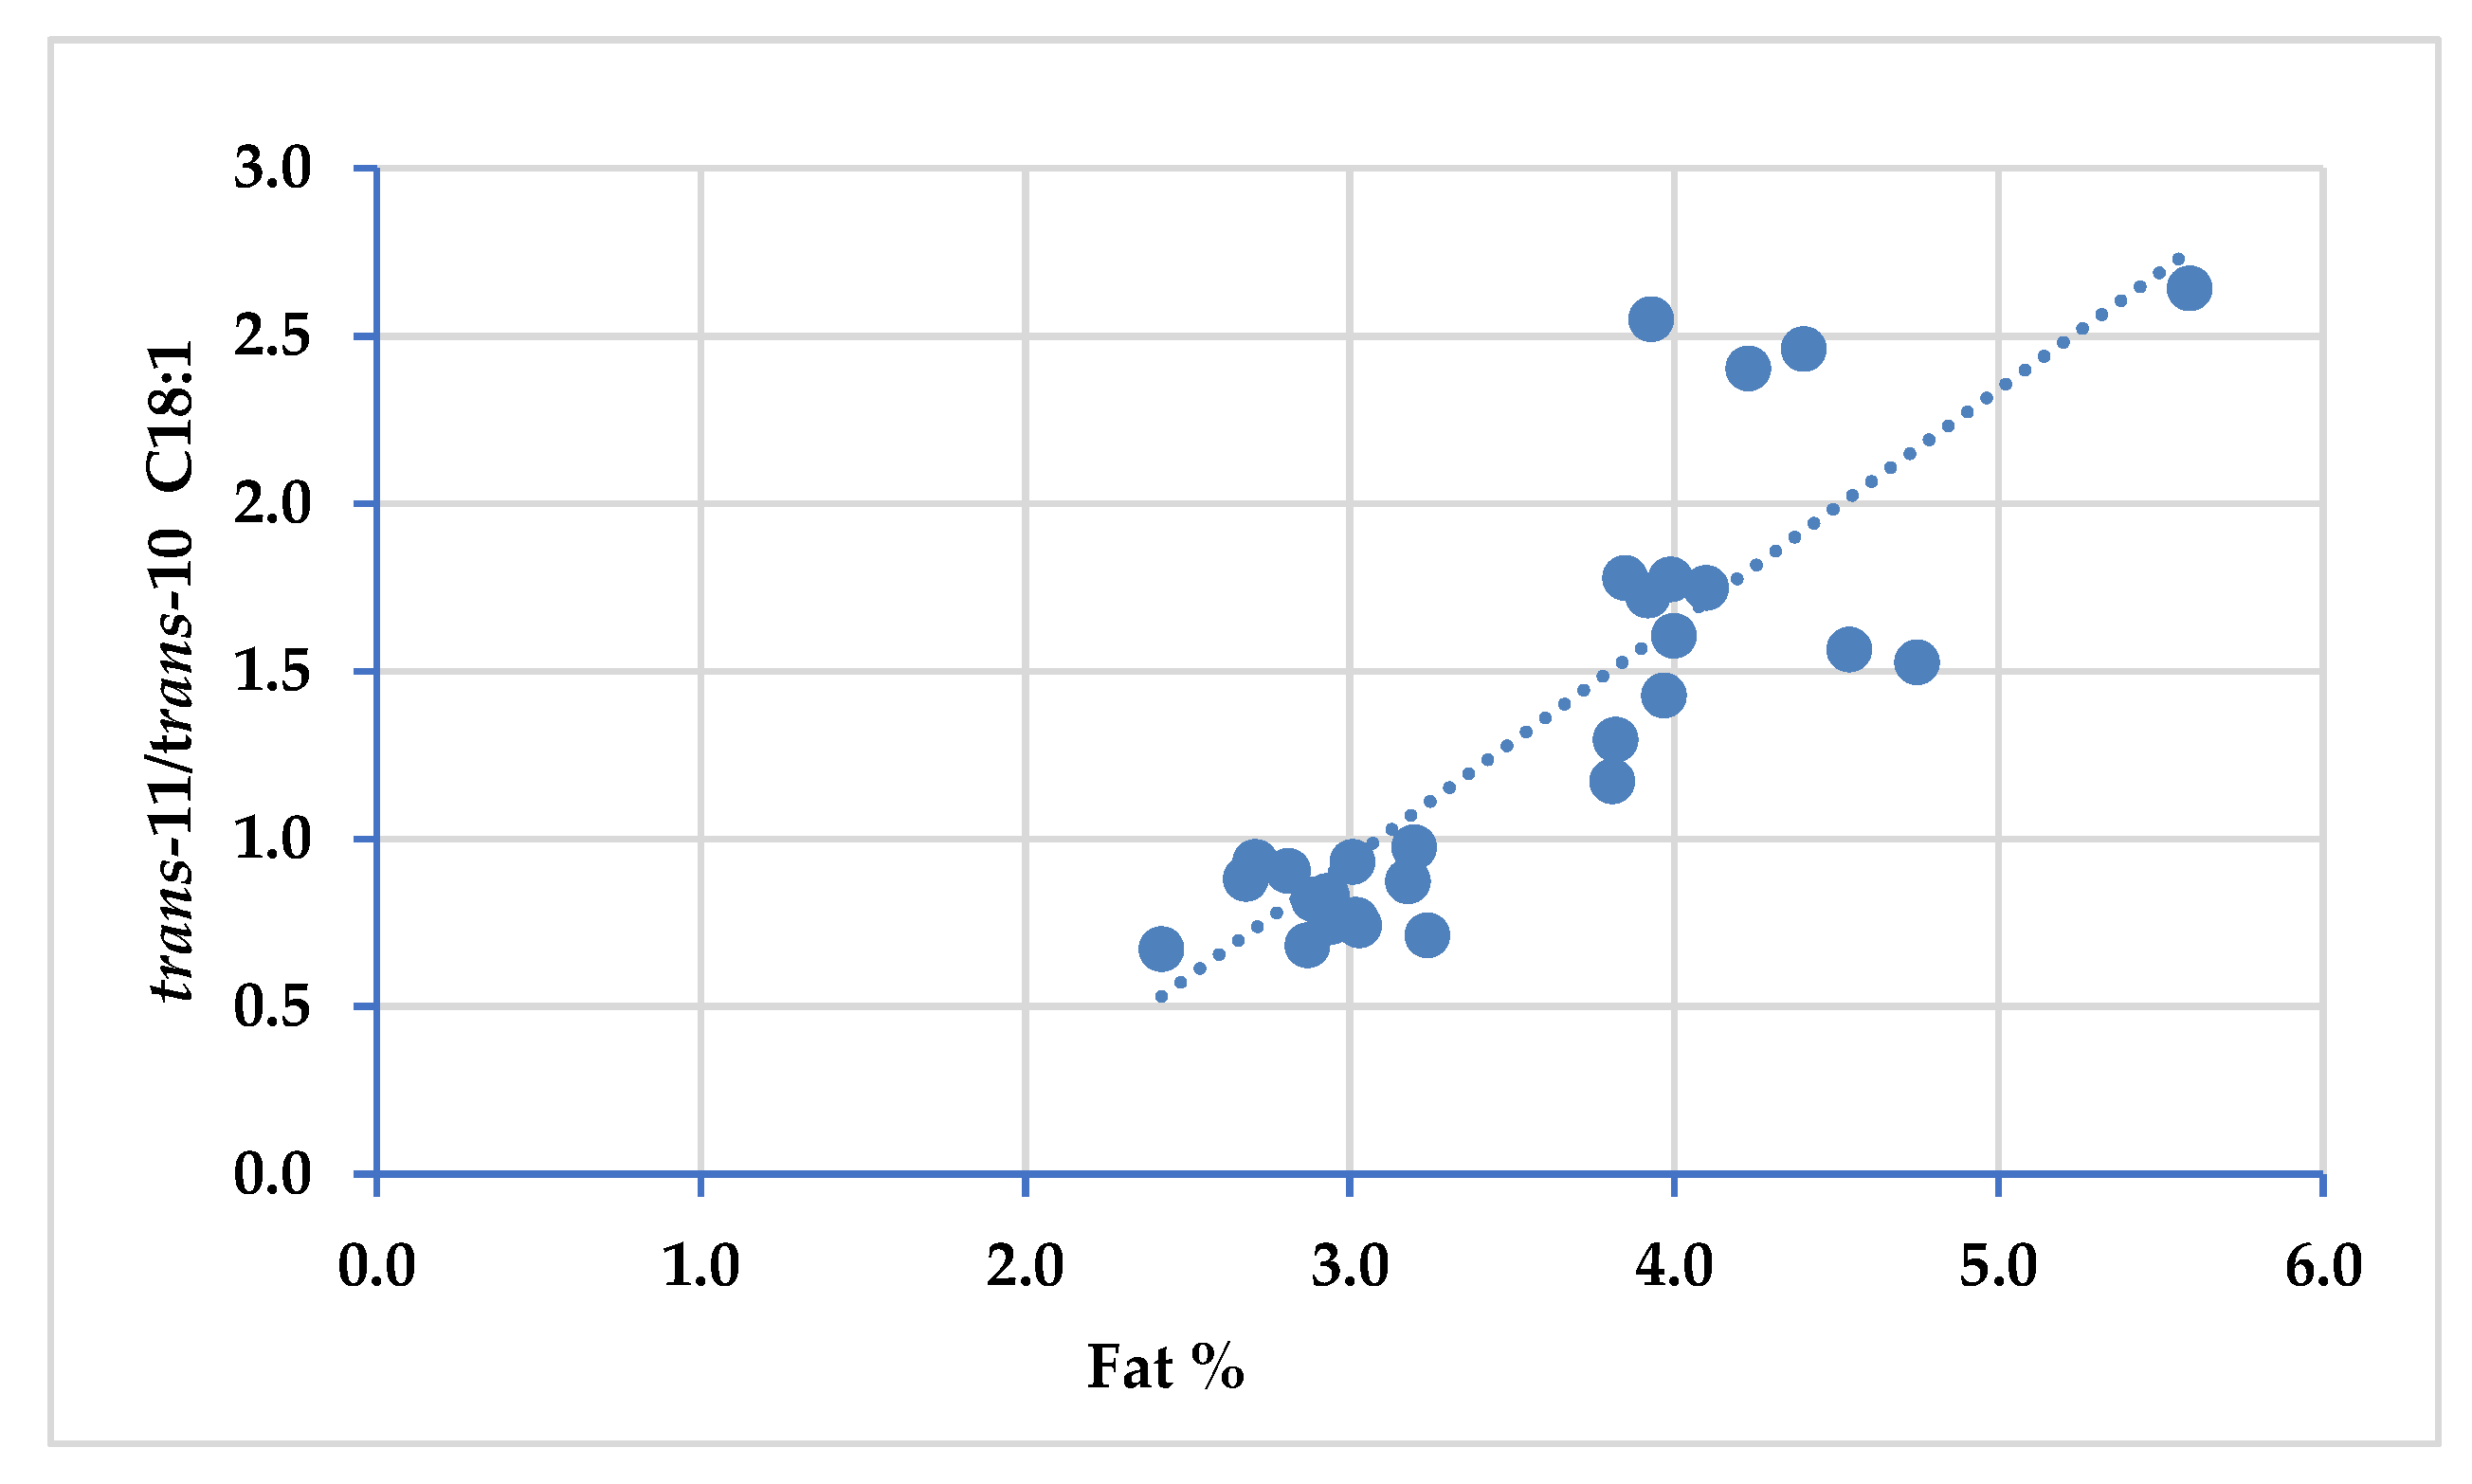
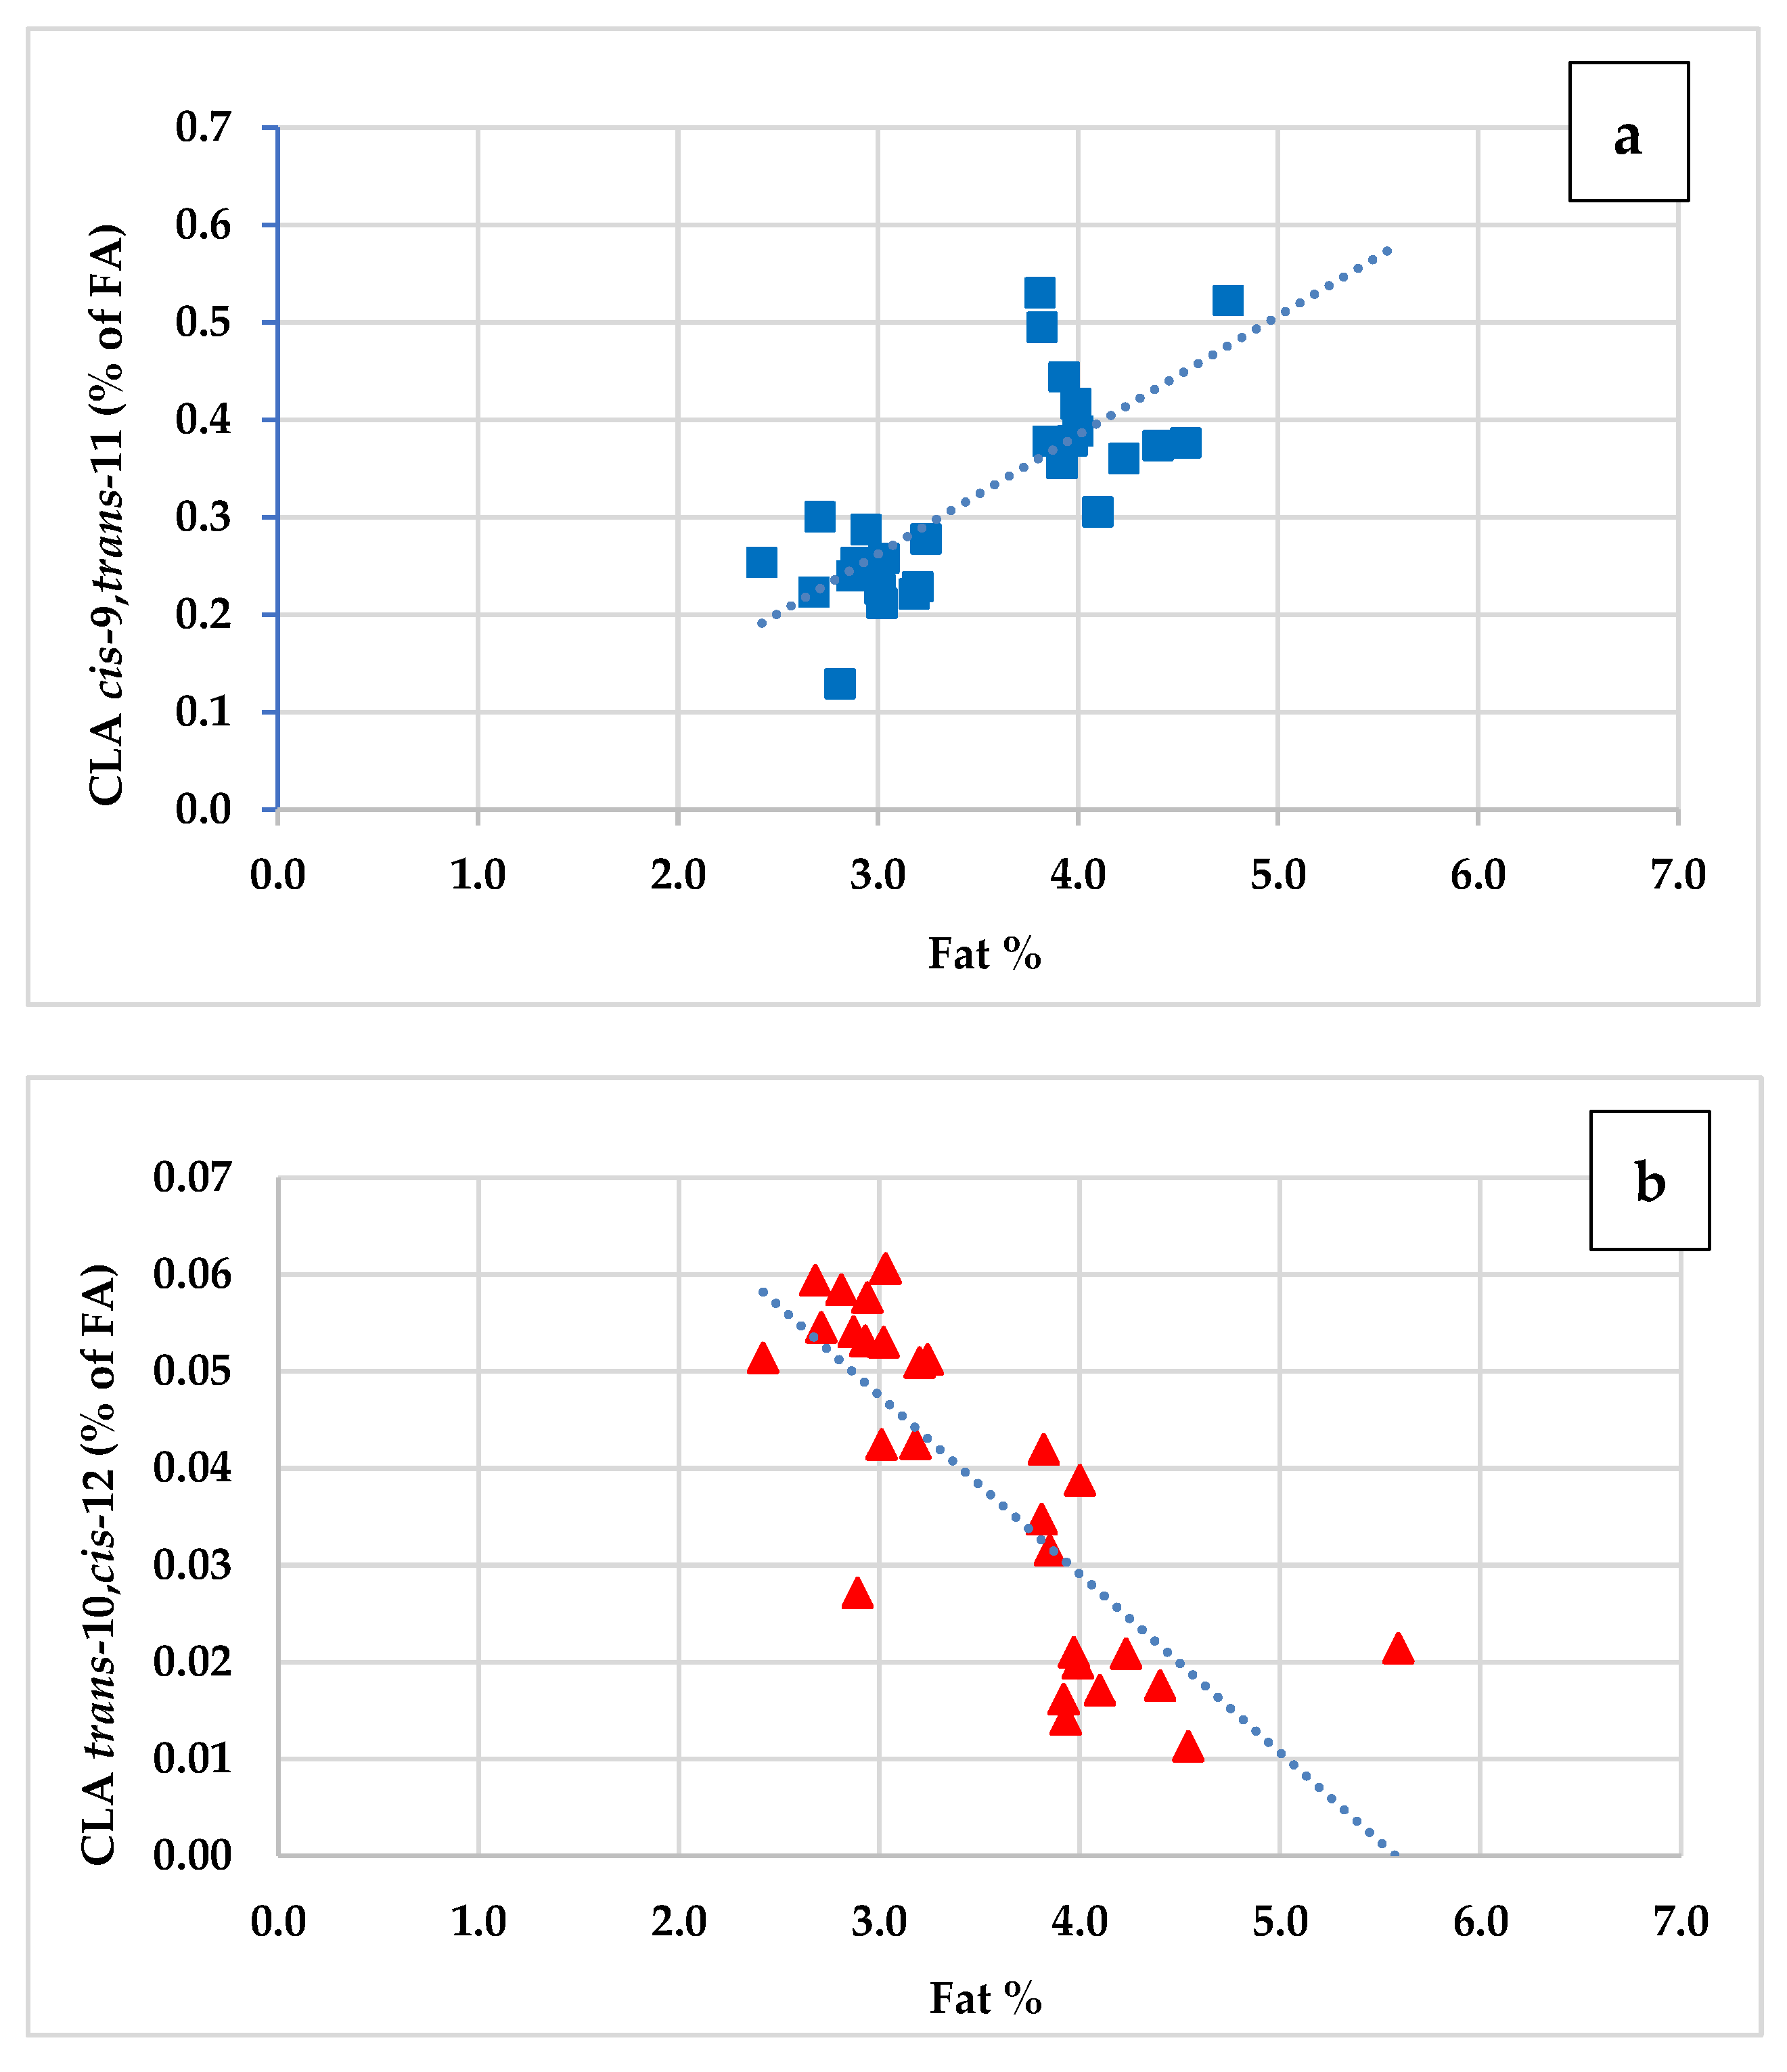
3.4. Trans and Cis Isomers of Oleic Acid (C18:1), Linoleic Acid (C18:2) and Coniugated Linoleic Fatty Acids (CLA)

Approximately 26% of the fatty acids in milk are MUFA with oleic acid (C18:1 cis-9), accounting for about 20% of the total fatty acids in milk. This fatty acid and trans vaccenic acid (C18:1 trans-11) are important for human health [2]. Our data showed C18:1 cis-9 higher percentage in Holstein Friesian than in Podolica milk (Table 5). Moreover, in the low fat milk of the Holstein Friesian breed there was a higher percentage of total MUFA than in normal fat milk due to the increase in C18:1 cis isomers, while trans isomers of C18:1 showed different trends: the trans-11 decreased and on the contrary the trans-10 increased compared to the Nf group (p < 0.01).
No significant differences were highlighted in Podolica milk for the two different fat levels of milk both for cis and trans isomers of C18:1, but the interaction breeding × fat level was significantly different for oleic and cis vaccenic fatty acids, showing an opposite trend between the fat levels in the two breeds (Table 5).
The C18:1 trans-11/trans-10 ratio, as referred to in different works [6,8,9], is affected by the fat milk level in animals that show MDF syndrome and it was lower in the Lf group than Nf in Friesian cows (0.82% vs. 1.83% in Lf vs. Nf). In the milk of animals with MDF syndrome there is a marked shift from trans-11 (which is usually the most representative trans isomer of C18:1) to trans-10 [8].
The phenomenon described above seems to be explained by various causes, both genetic and alimentary. Some authors [41,42] reported that C18:1 trans-10 is an inhibitor of steraoyl-CoA desaturase causing a slowdown in the de novo biosynthesis of fatty acids starting from acetate. An anomalous increase in trans fatty acids in milk is also associated with the MFD problem [15]. Thus, the trans-11/trans-10 C18:1 ratio, that was lower in low fat milk from the Friesian breed, could be linked to rumen environmental alterations and associated with changes in specific biohydrogenating bacteria [3,6]. Due to these findings, our data could confirm the relevance of the shift from trans-11 to trans-10 C18:1, in milk obtained from Holstein Friesian, in the intensive system as an index of MFD disease.
The “trans-10 shifted” biohydrogenation pathway is frequently established in the rumen when high starch and/or PUFA diets are fed to ruminants, resulting in the accumulation of C18:1 trans-10 in rumen [8,10,37]. However, some authors have highlighted that diets rich in PUFA inhibit the final phase of biohydrogenation causing only a deficiency of C18:0 and also limiting the synthesis of C18:1 cis-9 [8,43]. Considering our data on Podolica, which had taken advantage of a pasture rich in PUFA, we reported that some of these animals produced strangely low fat milk despite that this was a low-production milk breed. Moreover, in this group (Lf of Podolica) the shift trans-11 trans-10 did not occur, and it was excluded that the low amount of fat depended on an inadequate diet since the Nf group with identical milk production had a milk fat percentage of 4.63 ± 0.42%. It could be concluded that we are in the presence of MFD syndrome with different characteristics, where the rumen biohydrogenation pathway is changed before the formation of C18:0, showing a lower value in Lf animals (11.2% vs. 13.87% for Lf and Nf, respectively).
Therefore, a positive correlation was observed between the C18:1 trans-11/trans-10 ratio and fat percentage (r = 0.43, p < 0.001) in milk from Holstein Friesian (Figure 1), while this correlation was not found in milk from Podolica.
In Podolica milk, no significant differences between the C18:1 cis and trans forms were observed and the trans-11/trans-10 C18:1 ratio remained unchanged.
PUFA constituted about 5% of the total milk fatty acids and the main PUFA was linoleic acid (C18:2 cis-9, cis-12 or 18:2 n-6). In Holstein Friesian milk, the content of conjugated linoleic acid (CLA) C18:2 cis-9, trans-11 was 0.40% in Nf milk, but dropped to 0.24% in Lf (p < 0.01, Table 5). At the same time, we noted a significant increase in CLA trans-10, cis-12 from 0.03% to 0.05% (p < 0.01) in Holstein Friesian Lf, but there were no significant differences between the two Podolica milks with different fat levels.
CLA cis-9, trans-11 is the main CLA of the fatty acid biosynthesis pathway under normal conditions, but its level is lower in the presence of MFD syndrome. On the contrary, the increase in CLA trans-10, cis-12 is considered an indicator of MDF syndrome [13]. Furthermore, looking for differences between the breeds, Podolica milk had higher contents of CLA cis-9, trans-11, ΣCLA cis cis and ΣCLA (p < 0.001, p < 0.001, p < 0.001, respectively, Table 5) than Holstein Friesian milk. The increase in C18:1 trans-11 and CLA cis-9, trans-11 is potentially healthier for consumers; however, the effects of C18:1 trans-10 are not clear yet [44]. With the exception of some cis isomers of C18:1 and C18:2 n-6, which were higher in Holstein Friesians than in the Podolica breed, most of the trans isomers of C18:1, the isomers of C18:2 and CLA were higher percentages in Podolica, to underline the effect of grazing on these fatty acid contents [41].
A positive correlation was observed between CLA cis-9, trans-11 and fat percentage (r = 0.78, p < 0.001, Figure 2a) while a negative correlation was observed between CLA trans-10, cis-12 and fat percentage (r = 0.80, p < 0.001, Figure 2b) in Holstein Friesian milk. No significant correlations were found in Podolica milk [41,44].

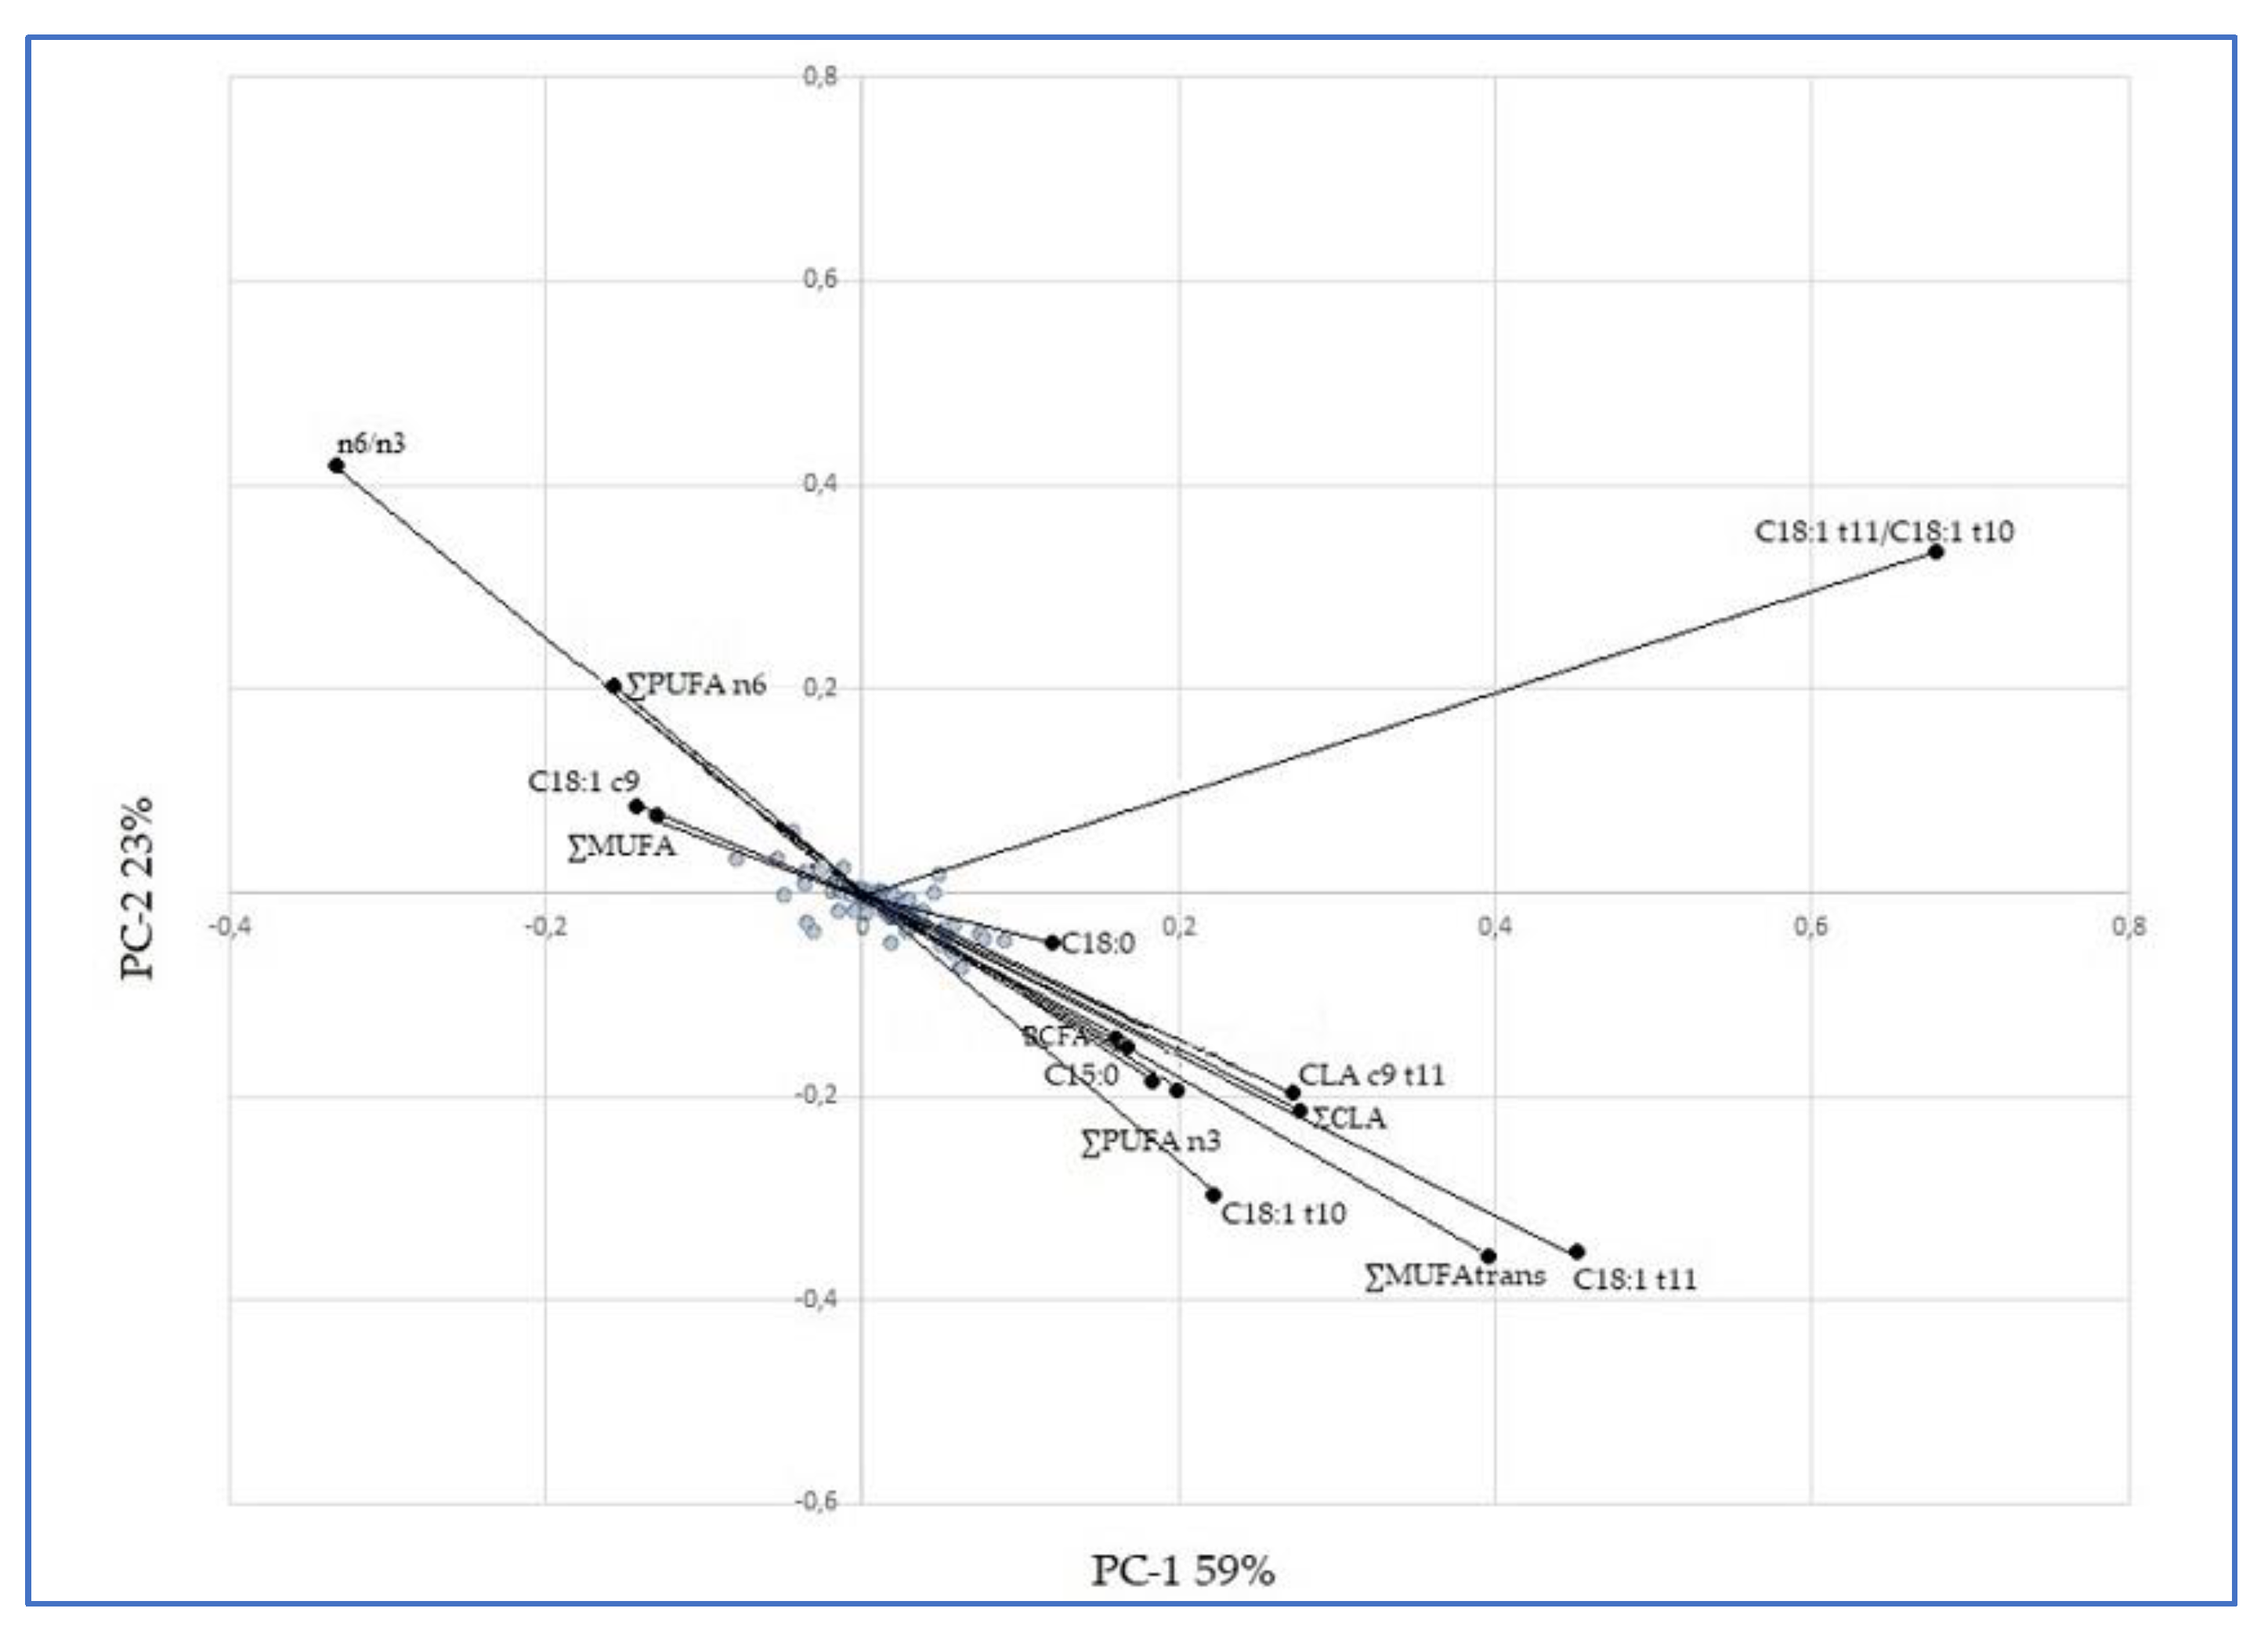
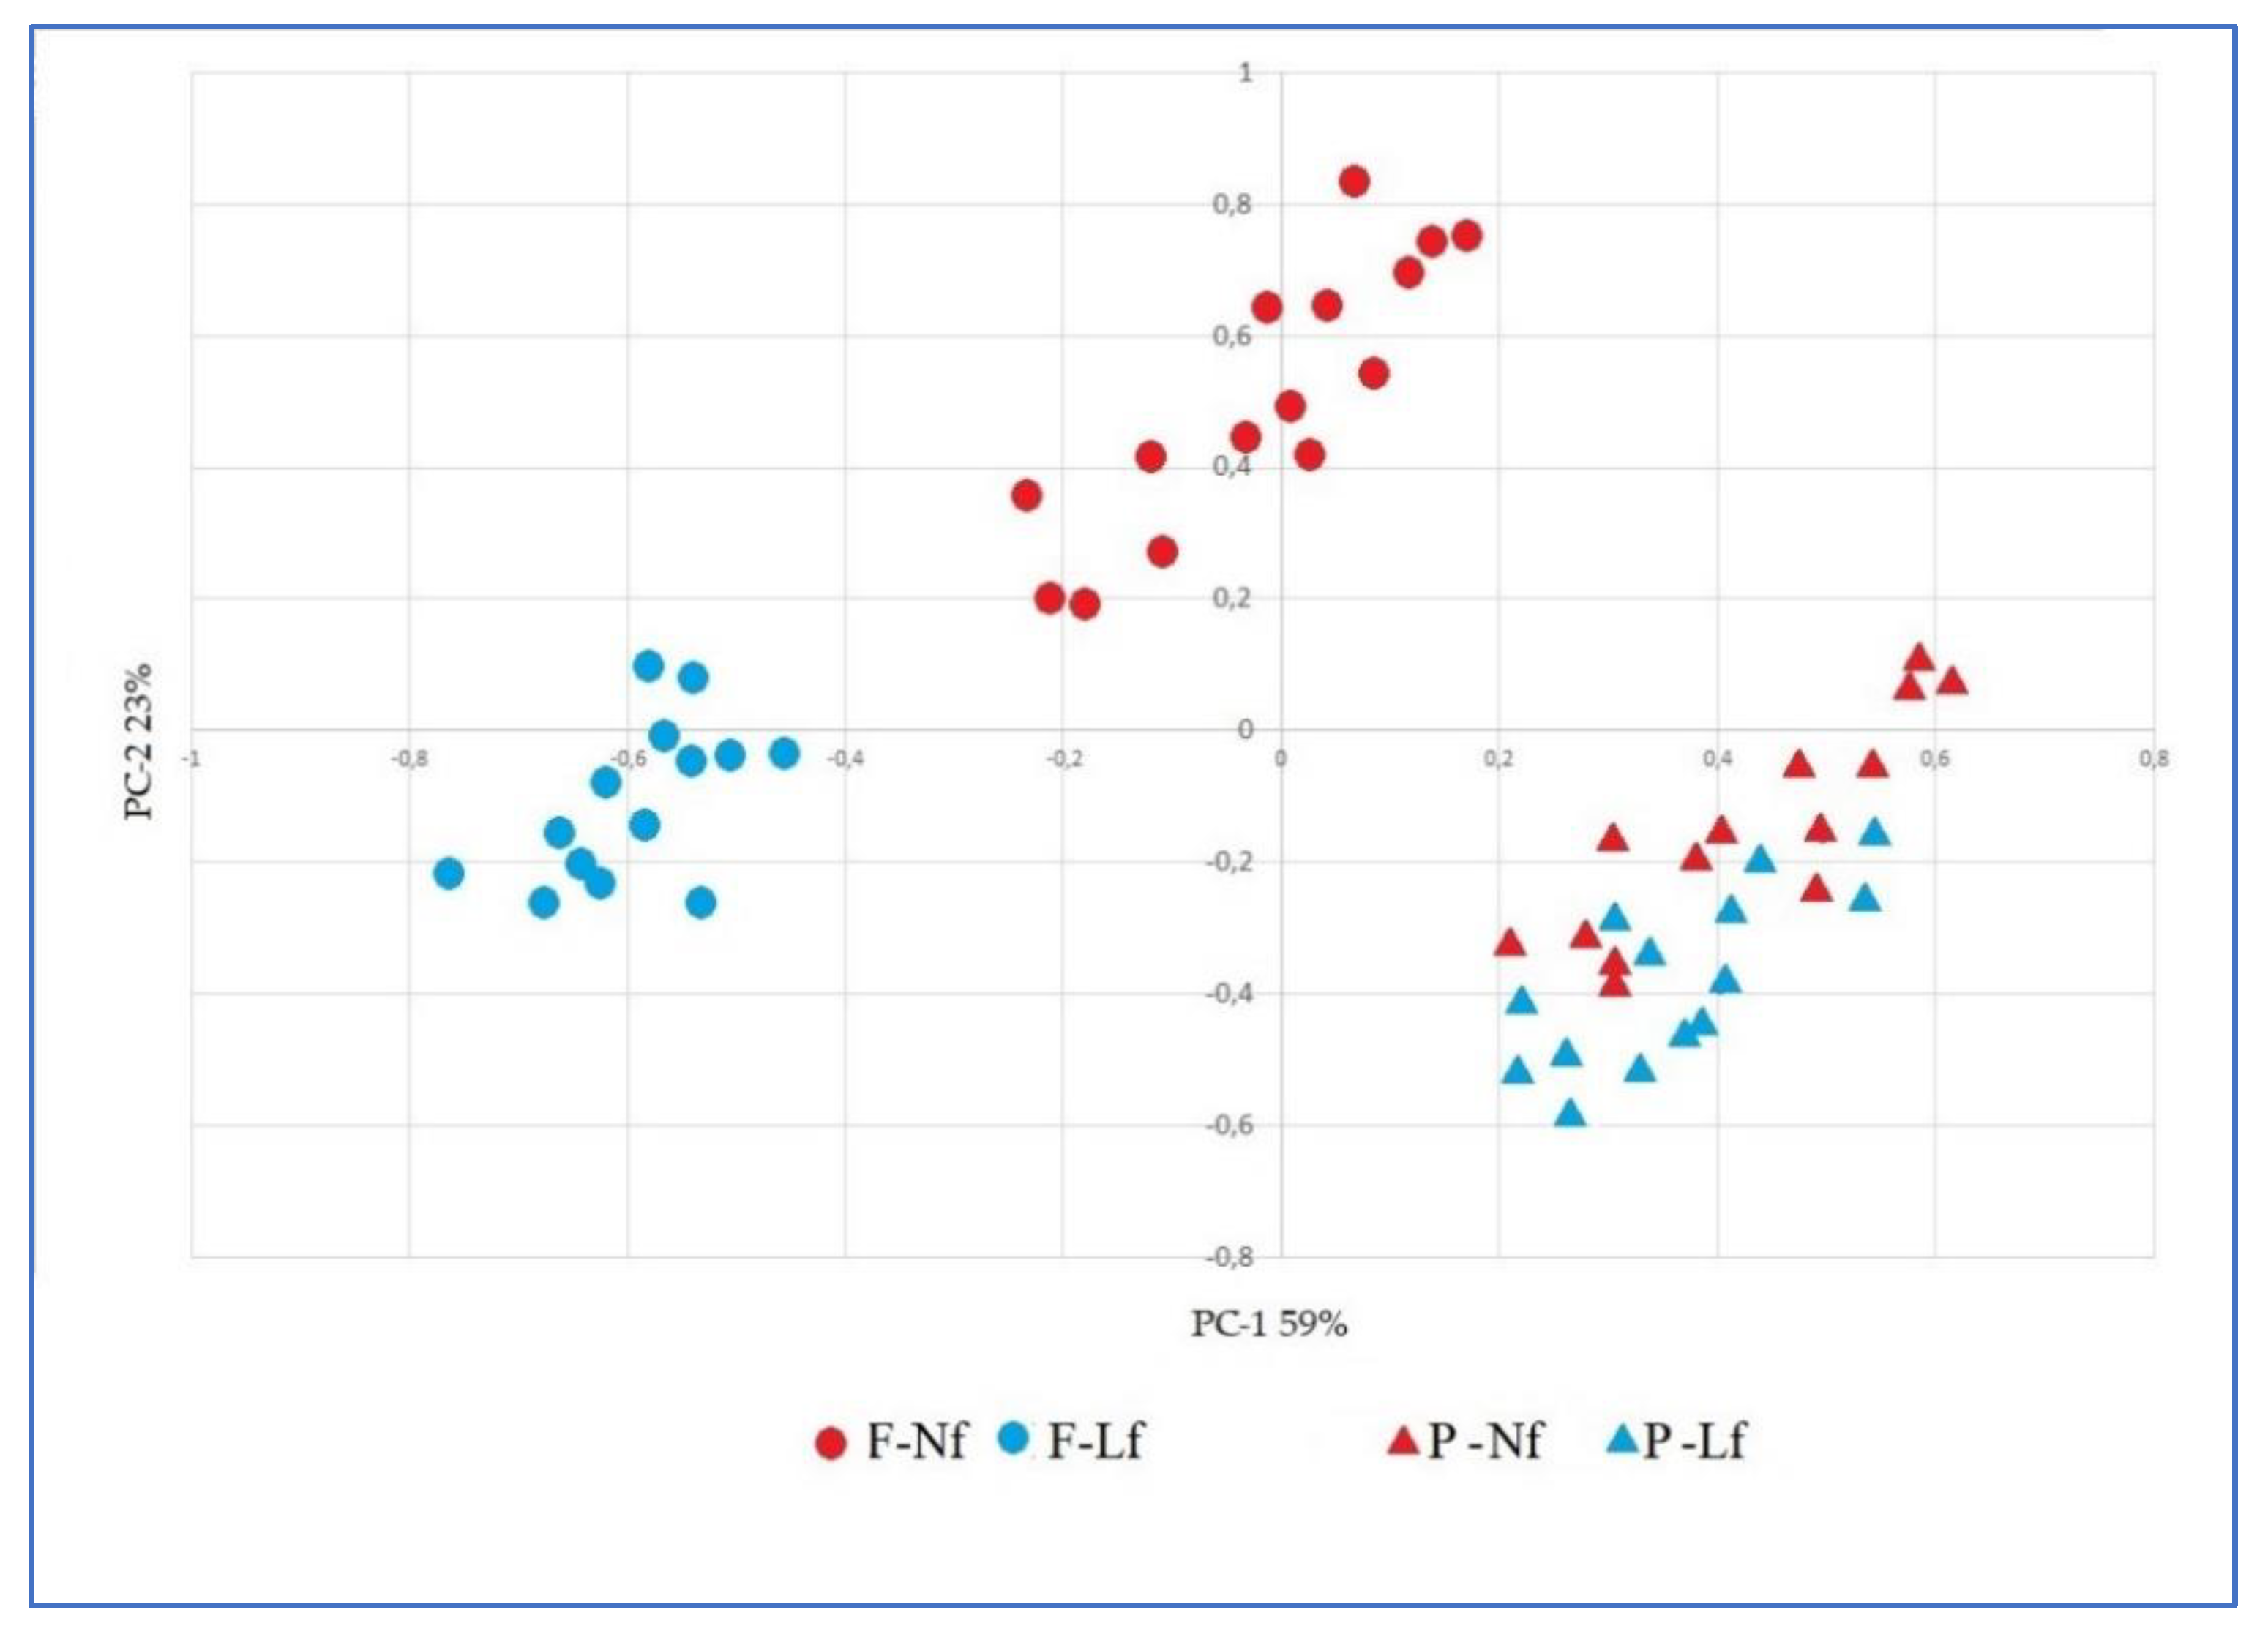
3.5. Principal Component Analysis (PCA)

For the PCA analysis, we used the parameters reported in the Table 3, Table 4 and Table 5 for a total of 47 variables. We obtained an R2 of 0.83 and 0.21 of the root mean square error (RMSE). PC-1 and PC-2 explained the 59% and 23% of variability and, using fat levels and breed as the grouping criterion for the scores plotted in the plan of the first two PCs (Figure 3), it was possible to highlight how the two breeds (Friesian and Podolica) were clearly separated. Moreover, in the Friesian group, animals were completely separated in two fat level groups (Nf and Lf), confirming the effect of the fat level; on the contrary, Podolica showed a uniform distribution of the milk samples, without expressing fat level effect.
The loading plot (Figure 4) reported the variables that absorbed the major variability on the first two PCs, highlighting the importance of some fatty acids and some classes of fatty acids to determine the difference in milk. This was especially true of the C18:1 trans-11/trans-10 ratio, followed by C18:1 trans-11, C18:1 trans-10, ΣMUFA trans, CLA cis-9, trans-11, and all the parameters linked to MFD syndrome [8,15].
Hence, the PCA confirmed the results obtained with each variable reported in the previous tables and in particular the importance of C18:1 trans-11 and trans-10 and their ratio.
The presence of the low fat level in milk produced by Podolica is not justified by the isomers that reduce rumen biohydrogenation. Certainly other factors both genetic [5,43] and nutritional [5,9,36] could explain the phenomenon, without forgetting the high intake of PUFA and tocopherols present in the pasture, which affect the correct trend in rumen microorganisms’ activity as reported by other authors [11,18,19].

4. Conclusions

As highlighted for the Holstein Friesian breed, in intensive milk production systems the combination of high production and quality does not always come together, even more so if there is in the middle a complex system such as the rumen, whose microbial activity is regulated by a subtle balance. The MFD syndrome therefore compromises the supply in milk of some nutrients considered healthy for humans, and the manifestation of MFD in Holstein Friesian was related to relevant changes in the milk fatty acid profile, including potentially antilipogenic fatty acids.
The results of this study highlight that the milk of intensively reared animals, such as Holstein Friesian, has fewer short-chain fatty acids, trans vaccenic acid, rumenic acid and total CLA and then is poorer in these nutrients in low fat milk, compromising the nutritional quality of the milk. While the quality of the milk of animals raised on the pasture extensively seems to be more stable.
Conversely, in Podolica the possible presence of MFD, linked to a decrease in total fat, did not change the quality of milk that was rich in healthy fatty acids such as CLA, probably due to the extensive breeding system and because Podolica is a native breed able to develop a high degree of adaptability to the environment.
These results may be stimulating for future research and to a better understanding of the different alterations in fat biosynthesis in the case of breeds raised on pasture such as the Podolica one. Elucidating the cause of this different responsiveness might help to understand diet-induced MFD, which continues to be an active research area given the economic value of milk fat content.

Author Contributions

Conceptualization, S.F., S.R. and M.C.; methodology and sampling, S.R., M.C., G.R., A.C. and C.M.; software, G.R. and M.C.; formal analysis, M.C., S.R. and G.R.; data curation, S.F., M.C., S.R. and G.R.; writing—original draft preparation, S.R., M.C. and S.F.; writing—review and editing, S.F., M.C., S.R., S.C., G.R., C.M. and A.C.; supervision, S.F., A.C., C.M. and S.C.; project administration, S.F., A.C., C.M. and S.C.; funding acquisition, A.C. All authors have read and agreed to the published version of the manuscript.

Funding

This research was funded by the Italian Ministry of Agriculture (MIPAAF) in the national research project MIQUALAT (D.M. 16844/7100/2019).

Institutional Review Board Statement

The ethical review and approval were not applied for this study because the milk samples were collected only by the normal routine milking of animals without any interference with animal health and welfare. The dairy herds involved in this study were raised by routine standard farming practices without interfering with their welfare.

Informed Consent Statement

Not applicable.

Data Availability Statement

The data presented in this study are available on request from the corresponding author.

Acknowledgments

We would like to thank “Azienda Capece” and “Azienda Marchetto” for their cooperation in providing milk samples and Domenico Rufrano for the technical support.

Conflicts of Interest

The authors declare no conflict of interest. The funders had no role in the design of the study, in the collection, analyses and interpretation of data, in writing the manuscript and in the decision to publish the results.

References

  1. Bakry, I.A.; Yang, L.; Farag, M.A.; Korma, S.A.; Khalifa, I.; Cacciotti, I.; Ziedan, N.I.; Jin, J.; Jin, Q.; Wei, W.; et al. A comprehensive review of the composition, nutritional value, and functional properties of camel milk fat. Foods 2021, 10, 2158. [Google Scholar] [CrossRef] [PubMed]
  2. Månsson, L.H. Fatty acids in bovine milk fat. Food Nutr. Res. 2008, 52, 1821. [Google Scholar] [CrossRef] [PubMed] [Green Version]
  3. Castillo-González, A.R.; Burrola-Barraza, M.E.; Domínguez-Viveros, J.; Chávez-Martínez, A. Rumen microorganisms and fermentation. Arch. Med. Vet. 2014, 46, 349–361. [Google Scholar] [CrossRef] [Green Version]
  4. Cao, Y.; Wang, D.; Wang, L.; Wei, X.; Li, X.; Cai, C.; Lei, X.; Yao, J. Physically effective neutral detergent fiber improves chewing activity, rumen fermentation, plasma metabolites, and milk production in lactating dairy cows fed a high-concentrate diet. J. Dairy Sci. 2021, 104, 5631–5642. [Google Scholar] [CrossRef]
  5. Peterson, D.G.; Matitashvili, E.A.; Bauman, D.E. Diet-induced milk fat depression in dairy cows results in increased trans-10,cis-12CLA in milk fat and coordinate suppression of mRNA abundance for mammary enzymes involved in milk fat synthesis. J. Nutr. 2003, 133, 3098–3102. [Google Scholar] [CrossRef] [Green Version]
  6. Weimer, P.J.; Stevenson, D.M.; Mertens, D.R. Shifts in bacterial community composition in the rumen of lactating dairy cows under milk fat-depressing conditions. J. Dairy Sci. 2010, 93, 265–278. [Google Scholar] [CrossRef] [PubMed] [Green Version]
  7. Kairenius, P.; Ärölä, A.; Leskinen, H.; Toivonen, V.; Ahvenjärvi, S.; Vanhatalo, A.; Huhtanen, P.; Hurme, T.; Griinari, J.M.; Shingfield, K.J. Dietary fish oil supplements depress milk fat yield and alter milk fatty acid composition in lactating cows fed grass silage-based diets. J. Dairy Sci. 2015, 98, 5653–5671. [Google Scholar] [CrossRef] [PubMed]
  8. Dewanckele, L.; Toral, P.G.; Vlaeminck, B.; Fievez, V. Invited review: Role of rumen biohydrogenation intermediates and rumen microbes in diet-induced milk fat depression: An update. J. Dairy Sci. 2020, 103, 7655–7681. [Google Scholar] [CrossRef]
  9. Bauman, D.E.; Griinari, J.M. Regulation and nutritional manipulation of milk fat low-fat milk syndrome. Livest. Prod. Sci. 2001, 70, 15–29. [Google Scholar] [CrossRef]
  10. Lock, A.L.; Overton, T.R.; Harvatine, K.J.; Giesy, J.; Bauman, D.E. Milk fat depression: Impact of dietary components and their interaction during rumen fermentation. In Proceedings of the Cornell Nutrition Conference, Ithaca, NY, USA, 18–20 October 2006; pp. 75–85. [Google Scholar]
  11. Rivero, M.J.; Anrique, R. Milk fat depression syndrome and the particular case of grazing cows: A review. Acta Agric. Scand. Sect. A—Anim. Sci. 2015, 65, 42–54. [Google Scholar] [CrossRef]
  12. Chilliard, Y.; Ferlay, A. Dietary lipids and forages interactions on cow and goat milk fatty acid composition and sensory properties. Reprod. Nutr. Dev. 2004, 44, 467–492. [Google Scholar] [CrossRef]
  13. Baumgard, L.H.; Corl, B.A.; Dwyer, D.A.; Saebø, A.; Bauman, D.E. Identification of the conjugated linoleic acid isomer that inhibits milk fat synthesis. Am. J. Physiol. 2000, 278, 179–184. [Google Scholar] [CrossRef] [Green Version]
  14. Bauman, D.E.; Griinari, J.M. Nutritional regulation of milk fat synthesis. Annu. Rev. Nutr. 2003, 23, 203–227. [Google Scholar] [CrossRef] [Green Version]
  15. Conte, G.; Dimauro, C.; Serra, A.; Macciotta, N.P.P.; Mele, M. A canonical discriminant analysis to study the association between milk fatty acids of ruminal origin and milk fat depression in dairy cows. J. Dairy Sci. 2018, 101, 6497–6510. [Google Scholar] [CrossRef] [Green Version]
  16. De Andrade, P.V.D.; Schmidely, P. Effect of duodenal infusion of trans10,cis12-CLA on milk performance and milk fatty acid profile in dairy goats fed high or low concentrate diet in combination with rolled canola seed. Reprod. Nutr. Dev. 2006, 46, 31–48. [Google Scholar] [CrossRef] [Green Version]
  17. Murru, E.; Carta, G.; Manca, C.; Sogos, V.; Pistis, M.; Melis, M.; Banni, S. Conjugated Linoleic Acid and Brain Metabolism: A Possible Anti-Neuroinflammatory Role Mediated by PPARα Activation. Front. Pharmacol. 2021, 11, 587140. [Google Scholar] [CrossRef] [PubMed]
  18. Morales, R.; Ungerfeld, E.M. Use of tannins to improve fatty acids profile of meat and milk quality in ruminants: A review. Chil. J. Agric. Res. 2015, 75, 239–248. [Google Scholar] [CrossRef] [Green Version]
  19. Schroeder, G.F.; Delahoy, J.E.; Vidaurreta, I.; Bargo, F.; Gagliostro, G.A.; Muller, L.D. Milk fatty acid composition of cows fed a total mixed ration or pasture plus concentrates replacing corn with fat. J. Dairy Sci. 2003, 86, 3237–3248. [Google Scholar] [CrossRef]
  20. Infascelli, L.; Tudisco, R.; Iommelli, P.; Capitanio, F. Milk quality and animal welfare as a possible marketing lever for the economic development of rural areas in southern Italy. Animals 2021, 11, 1059. [Google Scholar] [CrossRef] [PubMed]
  21. Sturaro, E.; Marchiori, E.; Cocca, G.; Penasa, M.; Ramanzin, M.; Bittante, G. Dairy systems in mountainous areas: Farm animal biodiversity, milk production and destination, and land use. Livest. Sci. 2013, 158, 157–168. [Google Scholar] [CrossRef]
  22. Brito, L.F.; Bedere, N.; Douhard, F.; Oliveira, H.R.; Arnal, M.; Peñagaricano, F.; Schinckel, A.P.; Baes, C.F.; Miglior, F. Review: Genetic selection of high-yielding dairy cattle toward sustainable farming systems in a rapidly changing world. Animal 2021, 15, 100292. [Google Scholar] [CrossRef]
  23. Cifuni, G.F.; Napolitano, F.; Riviezzi, A.M.; Braghieri, A.; Girolami, A. Fatty acid profile, cholesterol content and tenderness of meat from Podolian young bulls. Meat Sci. 2004, 67, 289–297. [Google Scholar] [CrossRef]
  24. Cosentino, C.; D’Adamo, C.; Naturali, S.; Pecora, G.; Paolino, R.; Musto, M.; Adduci, F.; Freschi, P. Podolian cattle: Reproductive activity, milk and future prospects. Ital. J. Agron. 2018, 13, 200–207. [Google Scholar] [CrossRef]
  25. Quinto, M.; Sevi, A.; Di Caterina, R.; Albenzio, M.; Muscio, A.; Rotunno, T. Quality of milk and Caciocavallo cheese from farms rearing Podolica and Italian Friesian cows. Ital. J. Food Sci. 2003, 15, 485–498. [Google Scholar]
  26. Pistoia, A.; Casarosa, P.; Poli, P.; Mani, D.; Ferruzzi, G. Caratteristiche qualitative del latte e del formaggio Caciocavallo nella razza bovina Podolica. Quality aspects of milk and Caciocavallo cheese in Podolica cattle. Large Anim. Rev. 2015, 21, 63–66. [Google Scholar]
  27. Association of Official Analytical Chemist (AOAC). Official Methods of Analysis, 19th ed.; AOAC International: Gaithersburg, MD, USA, 2012. [Google Scholar]
  28. Van Soest, P.J.; Robertson, J.B.; Lewis, B.A. Methods for Dietary Fiber, Neutral Detergent Fiber, and Nonstarch Polysaccharides in Relation to Animal Nutrition. J. Dairy Sci. 1991, 74, 3583–3597. [Google Scholar] [CrossRef]
  29. ISO 9622, IDF 141; Milk and Liquid Milk Products—Guidelines for the Application of Mid-Infrared Spectrometry. International Organization for Standardization: Geneva, Switzerland; International Dairy Federation: Brussels, Belgium, 2013. [Google Scholar]
  30. Folch, J.; Lees, M.; Stanley, S.G.H. A simple method for the isolation and purification of total lipides from animal tissues. J. Biol. Chem. 1957, 226, 497–509. [Google Scholar] [CrossRef]
  31. Statistical Analysis System Institute (SAS). User’s Guide: Statistics; Version 9.3; SAS Institute Inc.: Cary, NC, USA, 2011. [Google Scholar]
  32. Loften, J.R.; Linn, J.G.; Drackley, J.K.; Jenkins, T.C.; Soderholm, C.G.; Kertz, A.F. Invited review: Palmitic and stearic acid metabolism in lactating dairy cows. J. Dairy Sci. 2014, 97, 4661–4674. [Google Scholar] [CrossRef] [PubMed]
  33. Piantoni, P.; Lock, A.L.; Allen, M.S. Milk production responses to dietary stearic acid vary by production level in dairy cattle. J. Dairy Sci. 2015, 98, 1938–1949. [Google Scholar] [CrossRef]
  34. Toral, P.G.; Belenguer, A.; Shingfield, K.J.; Hervás, G.; Toivonen, V.; Frutos, P. Fatty acid composition and bacterial community changes in the rumen fluid of lactating sheep fed sunflower oil plus incremental levels of marine algae. J. Dairy Sci. 2012, 95, 794–806. [Google Scholar] [CrossRef] [PubMed] [Green Version]
  35. Toral, P.G.; Hervás, G.; Carreño, D.; Frutos, P. Does supplemental 18:0 alleviate fish oil-induced milk fat depression in dairy ewes? J. Dairy Sci. 2016, 99, 1133–1144. [Google Scholar] [CrossRef] [Green Version]
  36. Palmquist, D.L.; Jenkins, T.C. A 100-Year Review: Fat feeding of dairy cows. J. Dairy Sci. 2017, 100, 10061–10077. [Google Scholar] [CrossRef] [PubMed] [Green Version]
  37. Thanh, L.P.; Suksombat, W. Milk yield, composition, and fatty acid profile in dairy cows fed a high-concentrate diet blended with oil mixtures rich in polyunsaturated fatty acids. Asian-Australas. J. Anim. Sci. 2015, 28, 796–806. [Google Scholar] [CrossRef] [PubMed] [Green Version]
  38. Vlaeminck, B.; Fievez, V.; Cabrita, A.R.J.; Fonseca, A.J.M.; Dewhurst, R.J. Factors affecting odd- and branched-chain fatty acids in milk: A review. Anim. Feed Sci. Technol. 2006, 131, 389–417. [Google Scholar] [CrossRef]
  39. Srednicka-Tober, D.; Barański, M.; Seal, C.J.; Sanderson, R.; Benbrook, C.; Steinshamn, H.; Gromadzka-Ostrowska, J.; Rembiałkowska, E.; Skwarło-Sońta, K.; Eyre, M.; et al. Higher PUFA and n-3 PUFA, conjugated linoleic acid, α-tocopherol and iron, but lower iodine and selenium concentrations in organic milk: A systematic literature review and meta- and redundancy analyses. Br. J. Nutr. 2016, 115, 1043–1060. [Google Scholar] [CrossRef] [PubMed] [Green Version]
  40. Markey, O.; Souroullas, K.; Fagan, C.C.; Kliem, K.E.; Vasilopoulou, D.; Jackson, K.G.; Humphries, D.J.; Grandison, A.S.; Givens, D.I.; Lovegrove, J.A.; et al. Consumer acceptance of dairy products with a saturated fatty acid–reduced, monounsaturated fatty acid–enriched content. J. Dairy Sci. 2017, 100, 7953–7966. [Google Scholar] [CrossRef] [PubMed] [Green Version]
  41. Ferlay, A.; Bernard, L.; Meynadier, A.; Malpuech-Brug Ere, C. Production of trans and conjugated fatty acids in dairy ruminants and their putative effects on human health: A review. Biochimie 2017, 141, 107–120. [Google Scholar] [CrossRef]
  42. Bernard, A.; Leroux, C.; Chilliard, Y. Expression and nutritional regulation of Stearoyl-CoA desaturase genes in the ruminant mammary gland: Relationship with milk fatty acid composition. In Stearoyl-CoA Desaturase Genes in Lipid Metabolism; Ntambi, J.M., Ed.; Springer Science Business Media: New York, NY, USA, 2013; pp. 161–193. ISBN 9781461479697. [Google Scholar]
  43. Frutos, P.; Toral, P.G.; Hervás, G. Individual variation of the extent of milk fat depression in dairy ewes fed fish oil: Milk fatty acid profile and mRNA abundance of candidate genes involved in mammary lipogenesis. J. Dairy Sci. 2017, 100, 9611–9622. [Google Scholar] [CrossRef] [Green Version]
  44. Shingfield, K.J.; Chilliard, Y.; Toivonen, V.; Kairenius, P.; Givens, D.I. Trans fatty acids and bioactive lipids in ruminant milk. Adv. Exp. Med. Biol. 2008, 606, 3–65. [Google Scholar] [CrossRef]
Figure 1. Positive correlation between fat % and trans-11/trans-10 C18:1 ratio in milk from Holstein Friesian.
Sustainability 14 00977 g001
Figure 2. Positive correlation between fat % and CLA cis-9, trans-11 % of FA (a) and inverse correlation between fat % and CLA trans-10, cis-12 % of FA (b) in Friesian milk. CLA, conjugated linoleic acid, FA, total fatty acids.
Sustainability 14 00977 g002
Figure 3. Score of two principal components of milk samples produced from Holstein Friesian (F) and Podolica (P) with low fat (Lf) and normal fat (Nf) levels. The used variables were all fatty acids and classes of fatty acids reported in Table 3, Table 4 and Table 5 for a total of 47 variables.
Sustainability 14 00977 g003
Figure 4. PCA loading plot of the milk fat variables that absorbed the major variability on the first two PCs. ∑MUFA, total monounsaturated fatty acids; ∑PUFA, total polyunsaturated fatty acids; BCFA, branched chain fatty acids; t, trans; c, cis.
Sustainability 14 00977 g004
Table 1. Formulation, proximate and fatty acid composition of diets of Holstein Friesian cows fed with unifeed, and Podolica raised on pasture.
UnifeedPasture
Ingredient (% of total diet)
Triticale silage 49.2-
Alfalfa hay, second cut12.8-
Poliphyte hay2.1-
Barley grain10.7-
Corn grain8.6-
Sorghum grain6.4-
Soybean meal8.6-
Metho-Fat 10.75-
Mineral vitamin supplement 20.85-
Leguminosae -44.0
Gramineae-34.3
Asteraceae-10.0
Other plants-11.7
Chemical composition
Dry matter %59.4344.53
Ash (g/kg)61.658.5
Ether extract (g/kg)35.026.0
Crude protein (g/kg)180.2150.4
Non-structural carbohydrate (NSC) (g/kg) 460.0187.1
ADF 3 (g/kg)171.0307.0
NDF 3 (g/kg)264.0578.0
Fatty acids (% of total FAME 4)
C14:00.781.88
C16:016.9018.50
C18:02.893.30
Total SFA 422.0827.09
C18:1 n-9 18.138.97
Total MUFA 419.5310.45
C18:2 n-6 47.5617.23
C18:3 n-6 1.9011.06
C18:3 n-3 7.8631.69
Total PUFA 457.3259.98
1 Metho-Fat = fatty acid integration (Sepron S.r.l, Rome, Italy); 2 Mineral vitamin supplement (Sepron S.r.l, Rome, Italy); 3 ADF = acid detergent fiber; NDF = neutral detergent fiber; 4 FAME = total fatty acids methyl ester; SFA = saturated fatty acids; MUFA = monounsaturated fatty acids; PUFA = polyunsaturated fatty acids.
Table 2. Proximate composition of milk with low fat content (Lf) compared to milk with normal fat content (Nf) from two different breeds (Holstein Friesian and Podolica).
Holstein FriesianPodolicaRoot MSEp-Values
LfNfSign.LfNfSign.BreedFat LevelBreed × Fat Level
Fat %2.86 4.22 ***2.97 4.63 ***0.410.0420.0010.075
Protein %2.89 3.37 ***3.333.44ns0.230.0010.0010.008
Lactose %4.594.77ns5.014.89ns0.300.0310.9500.085
F/P 11.031.27***0.901.35***0.130.3930.0010.004
1 F/P: fat/protein ratio. *** Significantly different inside the breed (p < 0.001).
Table 3. Composition of milk fatty acids classes, expressed as percentages by weight of the total fatty acids, in milk with low fat content (Lf) compared to milk with normal fat content (Nf) from two different breeds (Holstein Friesian and Podolica).
Fatty AcidsHolstein FriesianPodolicaRoot MSEp-Values
LfNfSignLfNfSignBreedFat LevelBreed × Fat Level
SCFA8.9410.02ns11.66 10.43ns1.140.0010.9800.032
BCFA1.731.81ns3.113.12ns0.300.0010.5370.279
OCFA 2.142.06ns2.592.76ns0.270.0020.5470.260
∑SFA63.9666.67*65.6665.32ns3.160.4740.3780.021
cis MUFA 27.2124.27***18.8218.92ns2.240.0010.1120.004
trans MUFA 1.551.55ns5.815.96ns0.730.0010.7120.743
∑MUFA29.6026.49**25.3526.60ns2.490.0040.1500.001
n-6 PUFA 3.143.55ns1.801.75ns0.660.0010.2990.191
n-3 PUFA 0.620.58ns1.701.68ns0.170.0010.4740.783
n6/n36.317.46ns2.022.08ns2.380.0010.1570.272
∑PUFA4.534.91ns5.155.19ns0.740.0270.2730.257
∑SFA (total saturated fatty acids) = SCFA (short-chain fatty acids, from C4:0 to C12:0) + BCFA (branched chain fatty acids) + OCFA (odd chain fatty acids) + other SFA (C14:0, C16:0, C18.0 and C20:0) + those in trace (principal SFA are detailed in Table 4). ∑MUFA (total monounsaturated fatty acids) = cis MUFA (C18:1 cis isomers, detailed in Table 5, C14:1 cis-9, C16:1 cis-7, C16:1 cis-9 and C20:1 cis-9) + trans MUFA (C18:1 trans isomers, detailed in Table 5, and C16:1 trans-9). ∑PUFA (total polyunsaturated fatty acids) = n-6 PUFA (C18:2 n-6, C18:3 n-6, C20:2 n-6, C20:4 n-6, other long-chain PUFA n-6 in trace, isomers of C18:2 n-6 and of C18:2 conjugated linoleic acid (CLA) as detailed in Table 5) + n-3 PUFA (C18:3 n-3, C20:5 n-3 and other long-chain PUFA n-3 in trace). *, **, ***: significantly different inside the breed (p < 0.05, p < 0.01, p < 0.001, respectively).
Table 4. Content of principal SFA, expressed as percentages of total fatty acids, in milk with low fat content (Lf) compared to milk with normal fat content (Nf) from two different breeds (Holstein Friesian and Podolica).
Fatty AcidsHolstein FriesianPodolicaRoot MSEp-Values
LfNfSign.LfNfSign.BreedFat LevelBreed × Fat Level
C4:0 1.541.62ns2.202.14ns0.500.0010.9700.649
C6:0 1.481.54ns1.701.64ns0.250.0070.9610.386
C8:0 0.981.08ns1.221.11ns0.190.0030.9050.060
C10:0 2.232.67*3.022.54**0.520.0150.9250.003
C12:0 2.673.11*3.523.00*0.670.0580.9730.012
C14:0 iso0.130.15ns0.190.21ns0.030.0010.0190.825
C14:0 9.8810.20ns11.4910.04ns1.530.1810.3120.054
C15:0 iso0.230.28ns0.440.52**0.080.0010.0050.352
C15:0 anteiso0.430.50ns1.241.19ns0.220.0010.8990.338
C15:0 1.031.00ns1.271.43*0.190.0010.2860.082
C16:0 32.0433.18ns26.0124.45ns2.800.0010.9860.035
C17:0 iso0.370.35ns0.600.59ns0.110.0010.7590.907
C17:0 anteiso0.370.32ns0.340.32ns0.170.8100.4570.675
C17:00.640.62ns0.760.80ns0.110.0010.8490.139
C18:0 9.268.71ns11.2013.87***1.950.0010.0510.004
C20:00.200.19ns0.260.32*0.060.0010.1950.003
*, **, ***: significantly different inside the breed (p < 0.05, p < 0.01, p < 0.001, respectively), between Lf and Nf groups of each breed; ns = not significant.
Table 5. Trans and cis isomers of oleic (C18:1), linoleic (C18:2) and conjugated linoleic fatty acids (CLA), expressed as percentages of total fatty acids, in milk with low fat content (Lf) compared to milk with normal fat content (Nf) from two different breeds (Holstein Friesian and Podolica).
Holstein FriesianPodolicaRoot MSEp-Values
LfNfSign.LfNfSign.BreedFat LevelBreed × Fat Level
C18:1 cis-9 23.1520.18***15.39 16.33ns2.110.0010.0670.001
C18:1 cis-11 0.690.57*0.530.58ns0.110.0210.2430.001
C18:1 cis-12 0.240.21ns0.120.14ns0.050.0010.4180.265
C18:1 trans-9 0.260.22ns0.410.42ns0.130.0010.7470.368
C18:1 trans-10 0.500.32**1.651.62ns0.160.0010.5120.182
C18:1 trans-11 0.330.68**3.313.47ns0.310.0010.2890.453
C18:1 trans-12 0.170.22ns0.300.24ns0.090.0080.7340.024
C18:1 trans-11/trans-100.821.83***2.012.14ns0.370.0010.0010.001
ΣC18:2 trans trans 0.080.10ns0.180.21ns0.050.0010.1920.798
ΣC18:2 cis trans0.210.19ns0.350.36ns0.080.0010.7120.649
ΣC18:2 trans cis0.220.20ns0.550.60ns0.150.0010.3410.218
C18:2 cis-9 cis-122.672.97ns1.401.34ns0.590.0010.4370.259
CLA cis-9 trans-11 0.240.40**1.401.48ns0.100.0010.1640.171
CLA trans-7 cis-9 0.020.02ns0.010.01ns0.010.0010.3300.992
CLA trans-8 cis-10 0.020.02ns0.020.02ns0.010.0930.4490.708
CLA trans-10 cis-12 0.050.03**0.070.06ns0.020.0010.1790.091
CLA trans-11 cis-13 0.020.02ns0.050.05ns0.010.0010.1630.545
ΣCLA cis cis 0.030.03ns0.120.12ns0.030.0010.8710.520
ΣCLA trans trans 0.050.05ns0.110.09ns0.050.0010.8760.051
ΣCLA 0.460.60*1.891.94ns0.140.0010.2700.163
*, **, ***: significantly different inside the breed (p < 0.05, p < 0.01, p < 0.001, respectively), between Lf and Nf groups of each breed; ns = not significant.
Publisher’s Note: MDPI stays neutral with regard to jurisdictional claims in published maps and institutional affiliations.

