1. Introduction
Globally, cities are increasingly realizing many social and ecological benefits from green infrastructure. Recently, a growing literature has noted the cost-savings of green infrastructure that incorporates vacated urban land undergoing revegetation by natural succession, therefore requiring relatively low management costs [
1,
2]. This literature indicates that the social and ecological benefits of such urban spontaneous vegetation are similar to, and can even exceed, the benefits of cultivated and more highly managed urban vegetation [
3].
In addition to lower costs, another motivation for using urban spontaneous vegetation as green infrastructure is the increasing availability of vacated urban land from changing socioeconomic trends. It is estimated that at least one-sixth of the world’s cities have decreasing human populations [
4], with roughly 25% of these cities located in the United States [
5]. As a result, roughly 16.7% of large US city land area is vacant [
6]. Consequently, most of these shrinking cities suffer from decreasing tax revenues which exacerbates the economic burden of maintaining these vacant lands. Therefore, reuse of vacant urban land as green infrastructure has become a significant policy field in urban planning [
1,
7].
An emerging trend for the widespread use of spontaneous vegetation in urban green infrastructure is the growth of “urban wilderness” areas [
2]. Referred to also as “urban wildscapes” [
8], “intended wildness” [
9] and “intended wilderness” [
10], these areas are defined here as relatively large tracts of vacated urban land that are set aside for the specific goal of allowing long-term ecological succession. Kowarik et al. [
11] reviews many opportunities for conservation, recreation and education presented by spontaneously developing urban forests that are emerging in many urban areas. An example is the Knoxville Urban Wilderness (KUW) which has provided many ecological, social and economic benefits for the region and continues to expand because of its success [
12,
13].
Historically, this trend began in the early 2000s, mainly in Europe, especially in Germany. Examples would be the 2005 publication of Kowarik’s and Korner’s now classic book on wild urban woodlands [
14] and Kuhn’s work on the use of spontaneous vegetation in urban landscape architecture [
15]. We also see one of the philosophical underpinnings of this trend with the publication in 2004 of Gilles Clement’s “Tier Paysage Manifesto” which advocates design principles based on the “Third Landscape”, referring to urban spaces unattended by humans. In such cases, urban spaces are designed from nature instead of designed against nature [
16].
Given the increasing interest in establishing and expanding urban wilderness areas, an important question is whether these areas might contribute to the problem of environmental gentrification that is occurring in many cities of the world. Environmental, or green, gentrification occurs when the establishment of urban green space triggers an increase in real estate prices, rent, and property taxes in the surrounding area which can drive out local inhabitants who can no longer afford to live there [
17,
18]. These displaced local inhabitants tend to be relatively poor, often people of color, while the incoming populations tend to be upper income, college educated and White [
19]. Large scale urban greening projects can thus become an environmental justice issue which can unintentionally amplify existing social and economic disparities in a city [
20]. Studies from many nations document the process of environmental gentrification including: China [
21], USA [
22,
23], South Korea [
24], Spain [
18], and Germany [
25].
In this paper, we investigate whether the establishment of the KUW has caused environmental gentrification affecting citizens in the surrounding areas. We suggest this is an important study area for at least three reasons. First, very few, if any, previous gentrification studies have examined the effects of this specific type of rapidly growing green space (large wilderness areas). Second, environmental gentrification is not a universal process as not all studies clearly show increasing real estate prices when urban green spaces are established, depending on several variables and contexts. For example, green space size positively influenced gentrification in a study of 10 US cities [
26]. Similarly, a strong green gentrification effect has been observed in passive, natural and medium-sized green spaces [
27]. Third, as a large, successfully managed and commonly used green space that is regionally recognized and established for over 20 years [
12], the KUW is an excellent case study to examine the effects of an urban wilderness green space on real estate prices. This is especially true considering that Knoxville is a fairly typical medium-sized urbanizing area in the Southeastern US where urban growth is common.
2. Materials and Methods
The KUW is a collection of land parcels owned by city, county, and state government, non-profit foundations, and private landholders [
28]. It is a unique combination of parks, open spaces, and over 50 miles of trails and greenways located near downtown Knoxville’s south waterfront. It covers over 1700 acres and is composed of multiple parks including the Forks of the River Wildlife Management Area, Ijams Nature Center, Marie Myers Park, Baker Creek Preserve, Hastie Natural Area, Anderson School Trails, Fort Dickerson Park, River Bluff Wildlife Area, High Ground Park and private land easements. The KUW contains historic sites, quarries, and natural playgrounds and allows for multiple outdoor activities such as hiking, trail running, mountain biking, climbing, paddle boarding, swimming, wildlife viewing, and zip lining in elevated adventure trails. Construction and development are currently underway for an extension of the KUW, the Urban Wilderness Gateway Park, which will create additional spaces for natural play areas, events, pedestrian and mountain biking trails, a bike park, and parking and access points. The extent, variety, and proximity to downtown make the KUW unmatched in the United States. Few cities outside the Rocky Mountain region have trail systems or bike parks within 10 miles of downtown with as many trail miles as the KUW [
29].
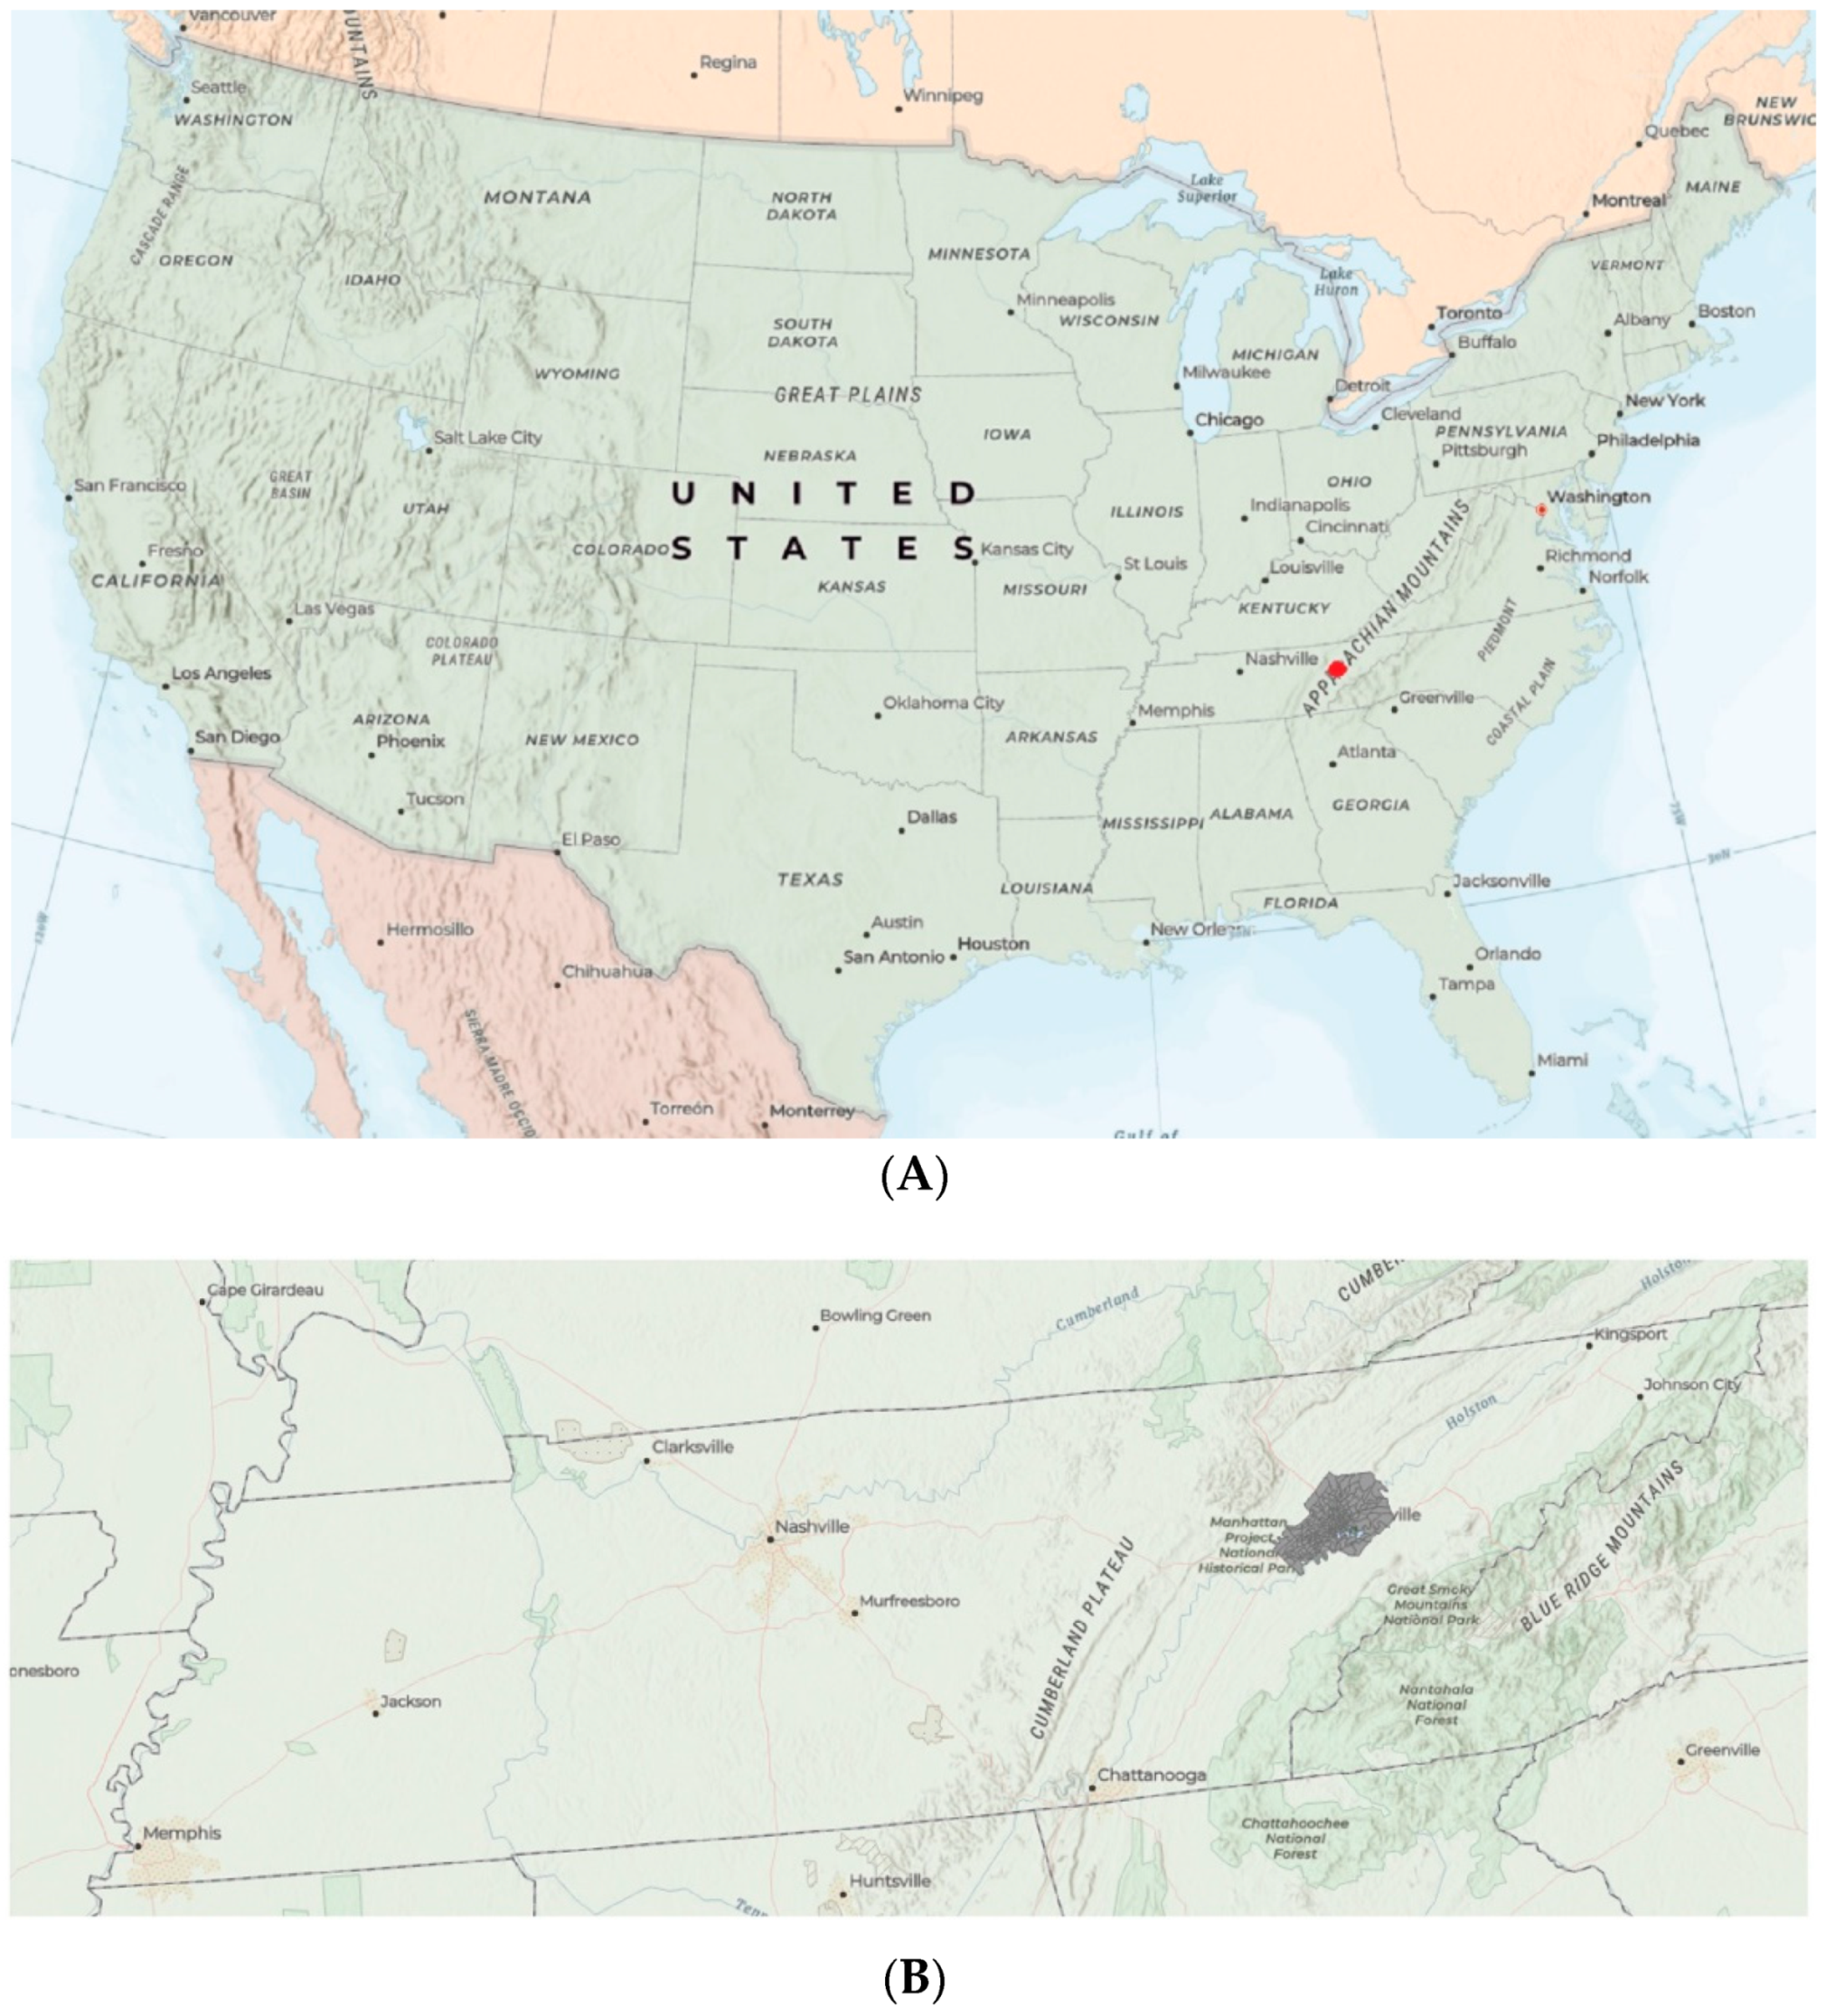
Figure 1 shows the location of Knoxville and the KUW in the U.S. (see Panel A) and in Tennessee (see Panel B).
As seen in
Table 1, historically, these lands have been utilized for farming, homesteading, logging, mining, and quite a few Civil War entrenchments [
30]. However, for most parcels in the KUW, these land uses have been discontinued in the last several decades. It is important to note that South Knoxville, where the KUW is located, has seen much less housing development (urban sprawl) compared to the rest of the city due to the hilly topography and its relative isolation on the opposite side of the Tennessee River from the main part of Knoxville [
30].
Consequently, these land parcels have undergone many decades of ecological recovery (
Table 1) and represent the kinds of vacated lands that are characteristic of the urban wilderness movement [
28]. The major impetus to establish the KUW came from a local non-profit group, Legacy Parks Foundation, which began to set aside these areas in the 1990s and continues this work. It is important to note that we are aware of
no significant changes in area, management, function, or accessibility to any of these parcels during the period between 2000–2017, which is the time span of this study. However, there has been a concerted effort to repackage and combine the parcels into a single entity, the KUW. Rebranding for the area in addition to right-of-way trails, which connect parcels, has led to an increase in trails, use, and awareness of the area.
To examine home prices near the KUW and in Knoxville, property assessor data was obtained from the Knoxville, Knox County, Knoxville Utilities Board Geographic Information System (KGIS). The data include the date of sale, the selling price, multiple housing characteristics, and spatial data that describe the location of homes. Average home prices and number of homes sold is calculated by the 2017 definition of a Census Block Group (CBG), which is a geographical unit used by the U.S. Census Bureau. A CBG generally covers a contiguous area, contains between 600 and 3000 people, and is contained within a county. For perspective, Knox County currently has 246 CBGs. Additional data from the U.S. Census Bureau 2000 Decennial Census and the American Community Survey (ACS, 2013–2017 5-Year Estimates) is used to describe changes in income, race, and educational attainment over time and CBGs.
3. Results
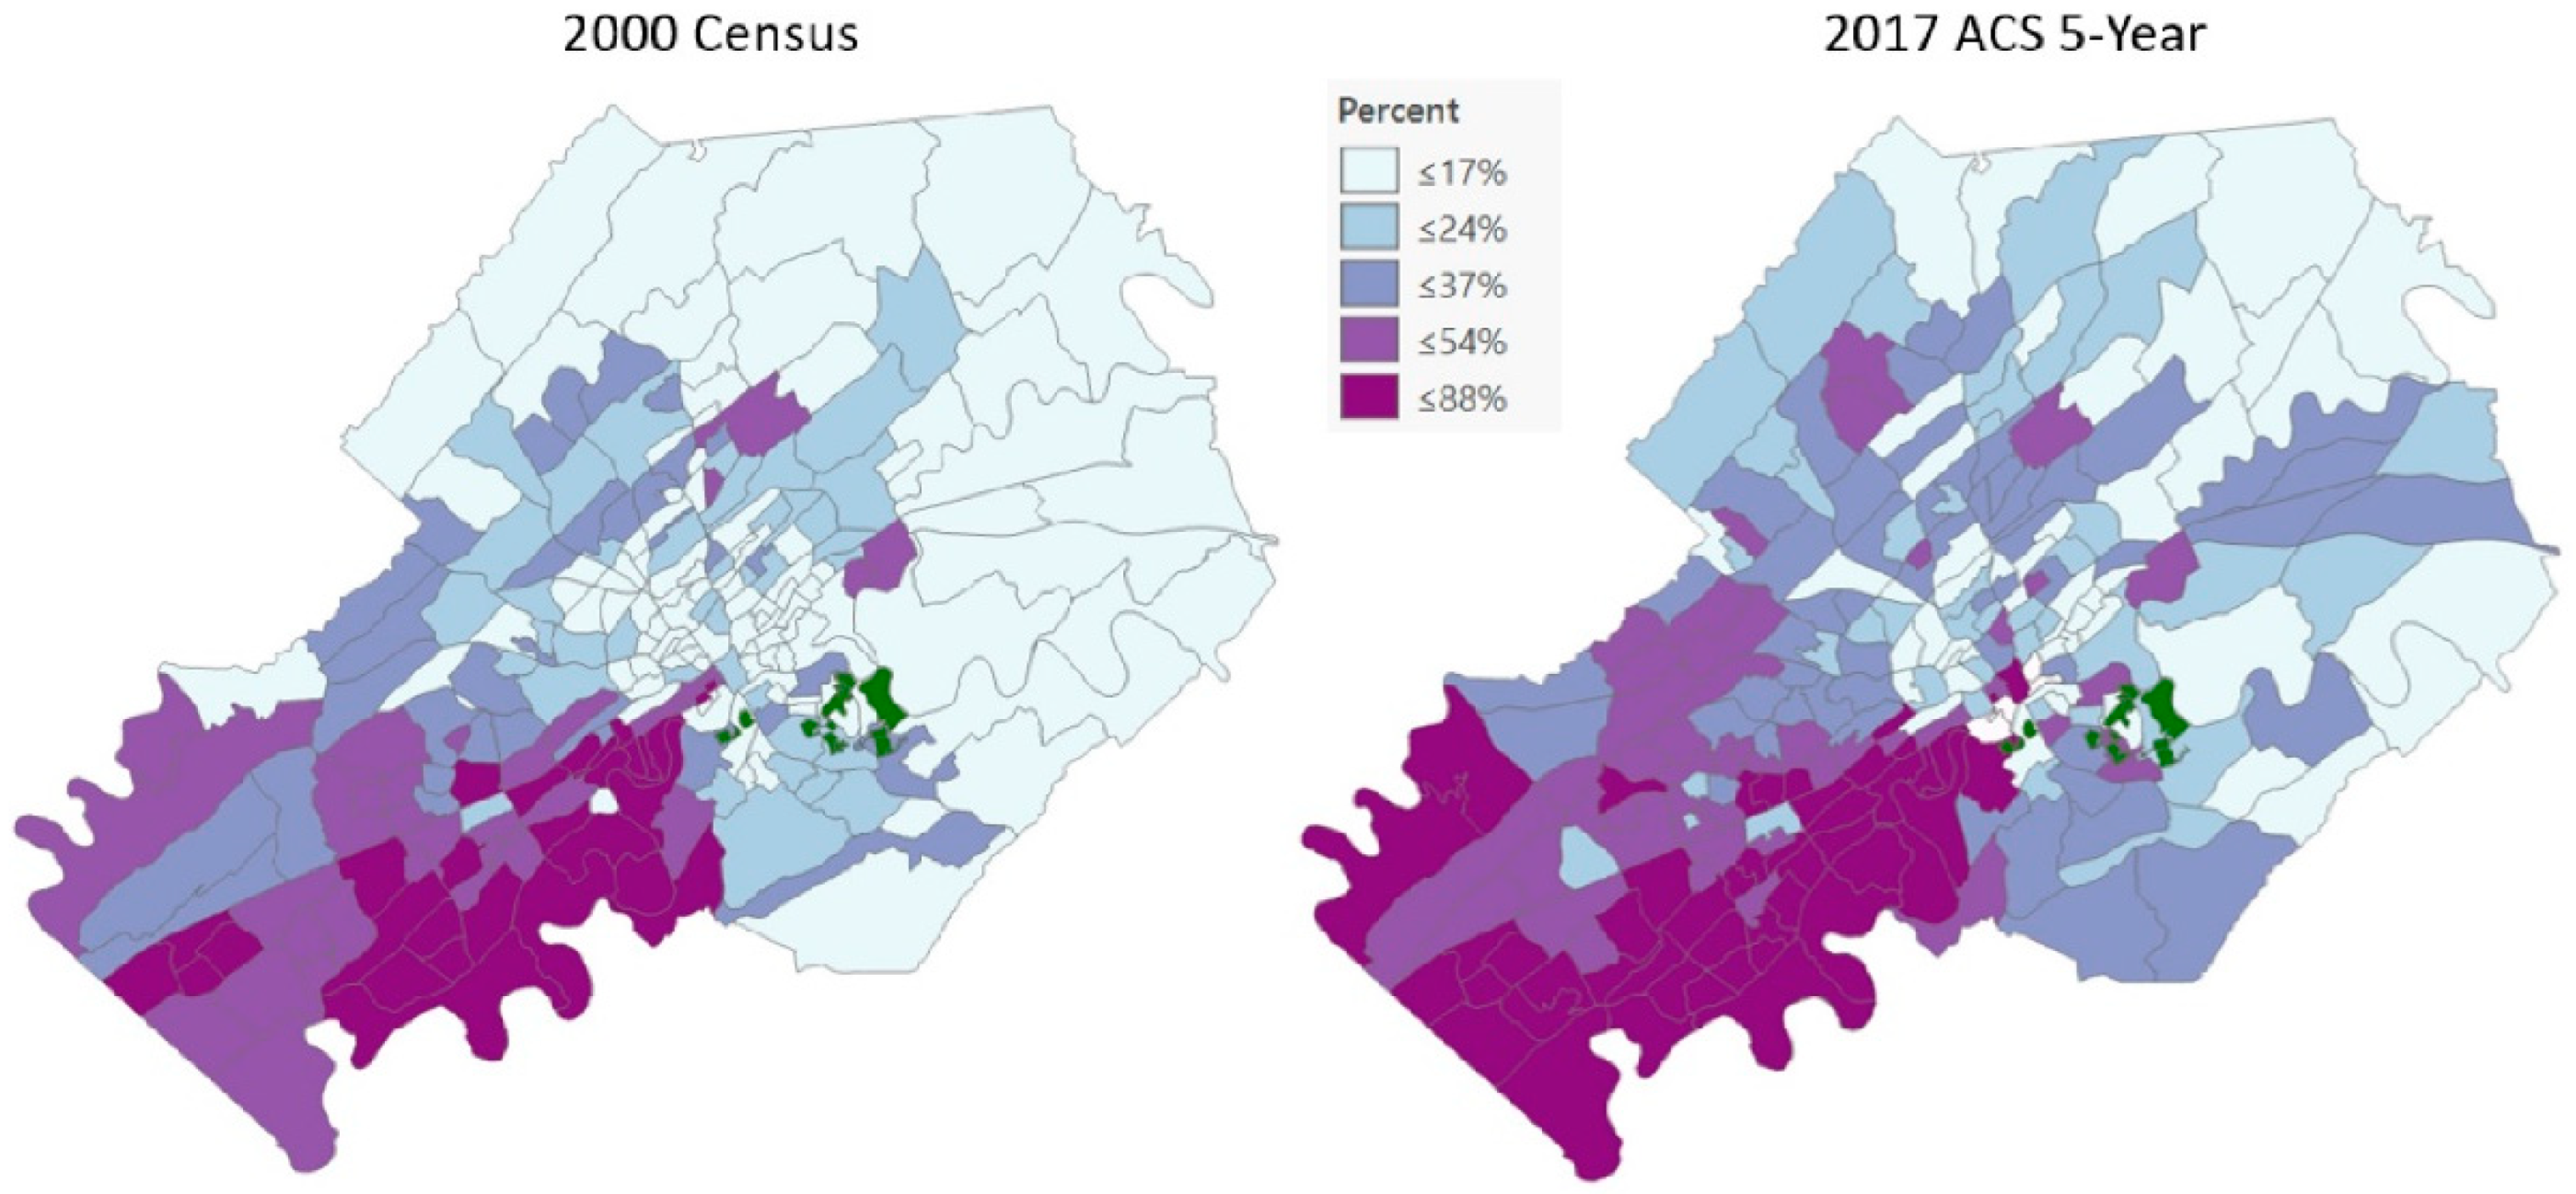
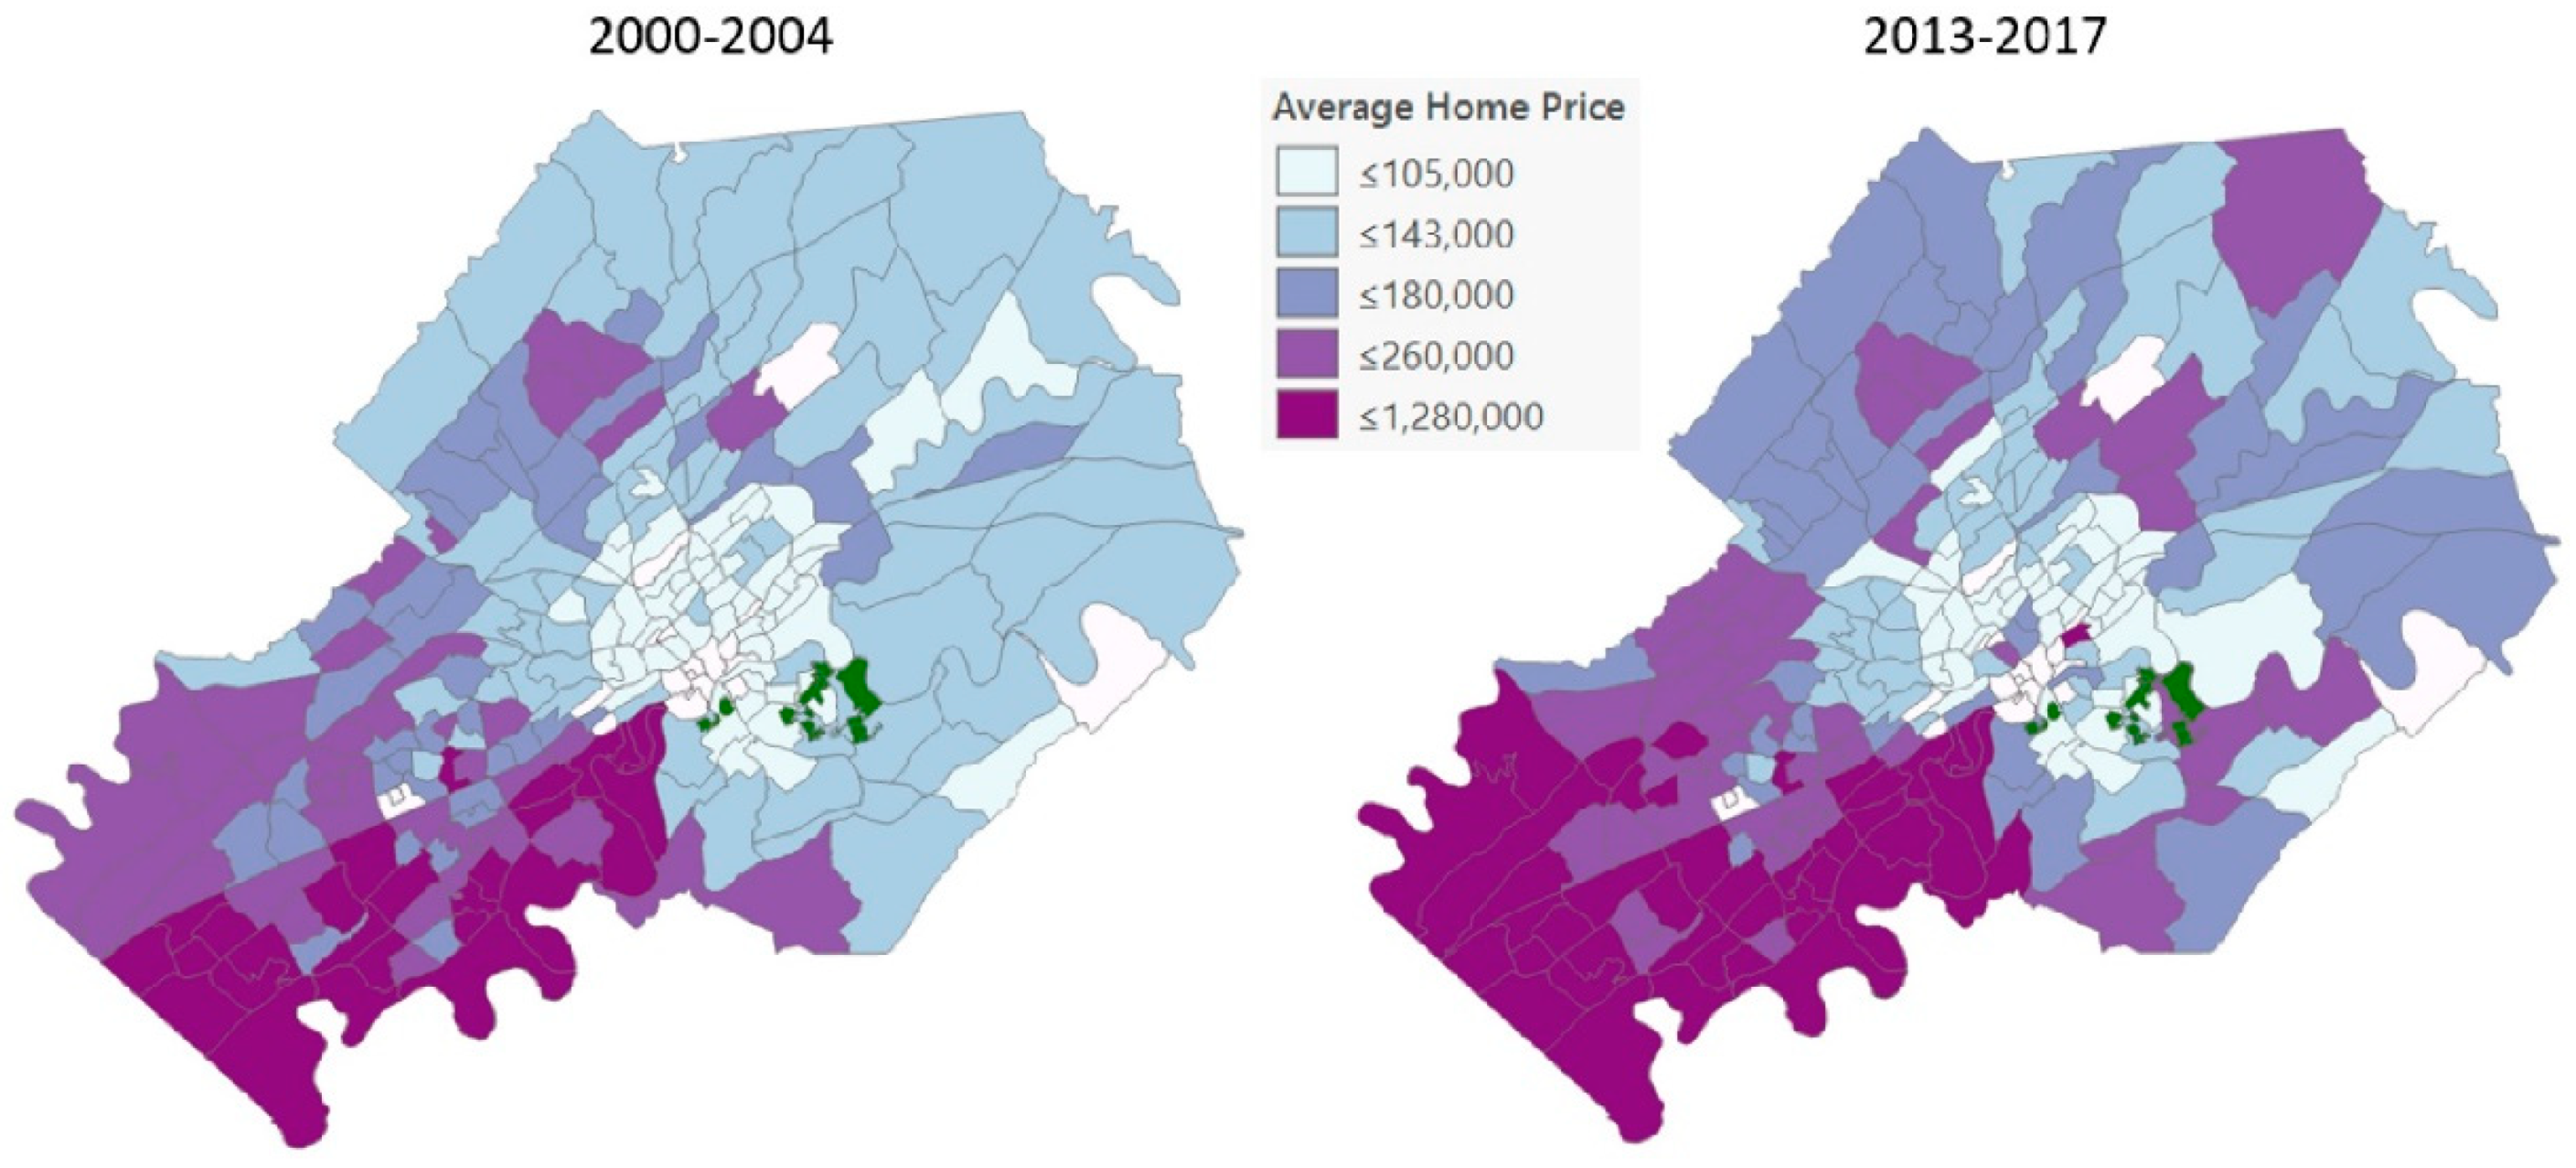
Figure 2,
Figure 3 and
Figure 4, below, present maps of Knox County that demonstrate how the average home price and the number of homes sold by CBG have changed over time. The data for each map is classified into ranges that represent the 20th, 40th, 60th, and 80th percentile in addition to the maximum value for each variable. Home prices have been adjusted for inflation in that all dollars shown are in 2017 dollars. The green area in each map shows the various parks that make up the Urban Wilderness in south Knoxville. CBG boundaries have changed over time, but many of the CBGs near the Urban Wilderness are roughly similar between 2000 and 2017 (See
Appendix A,
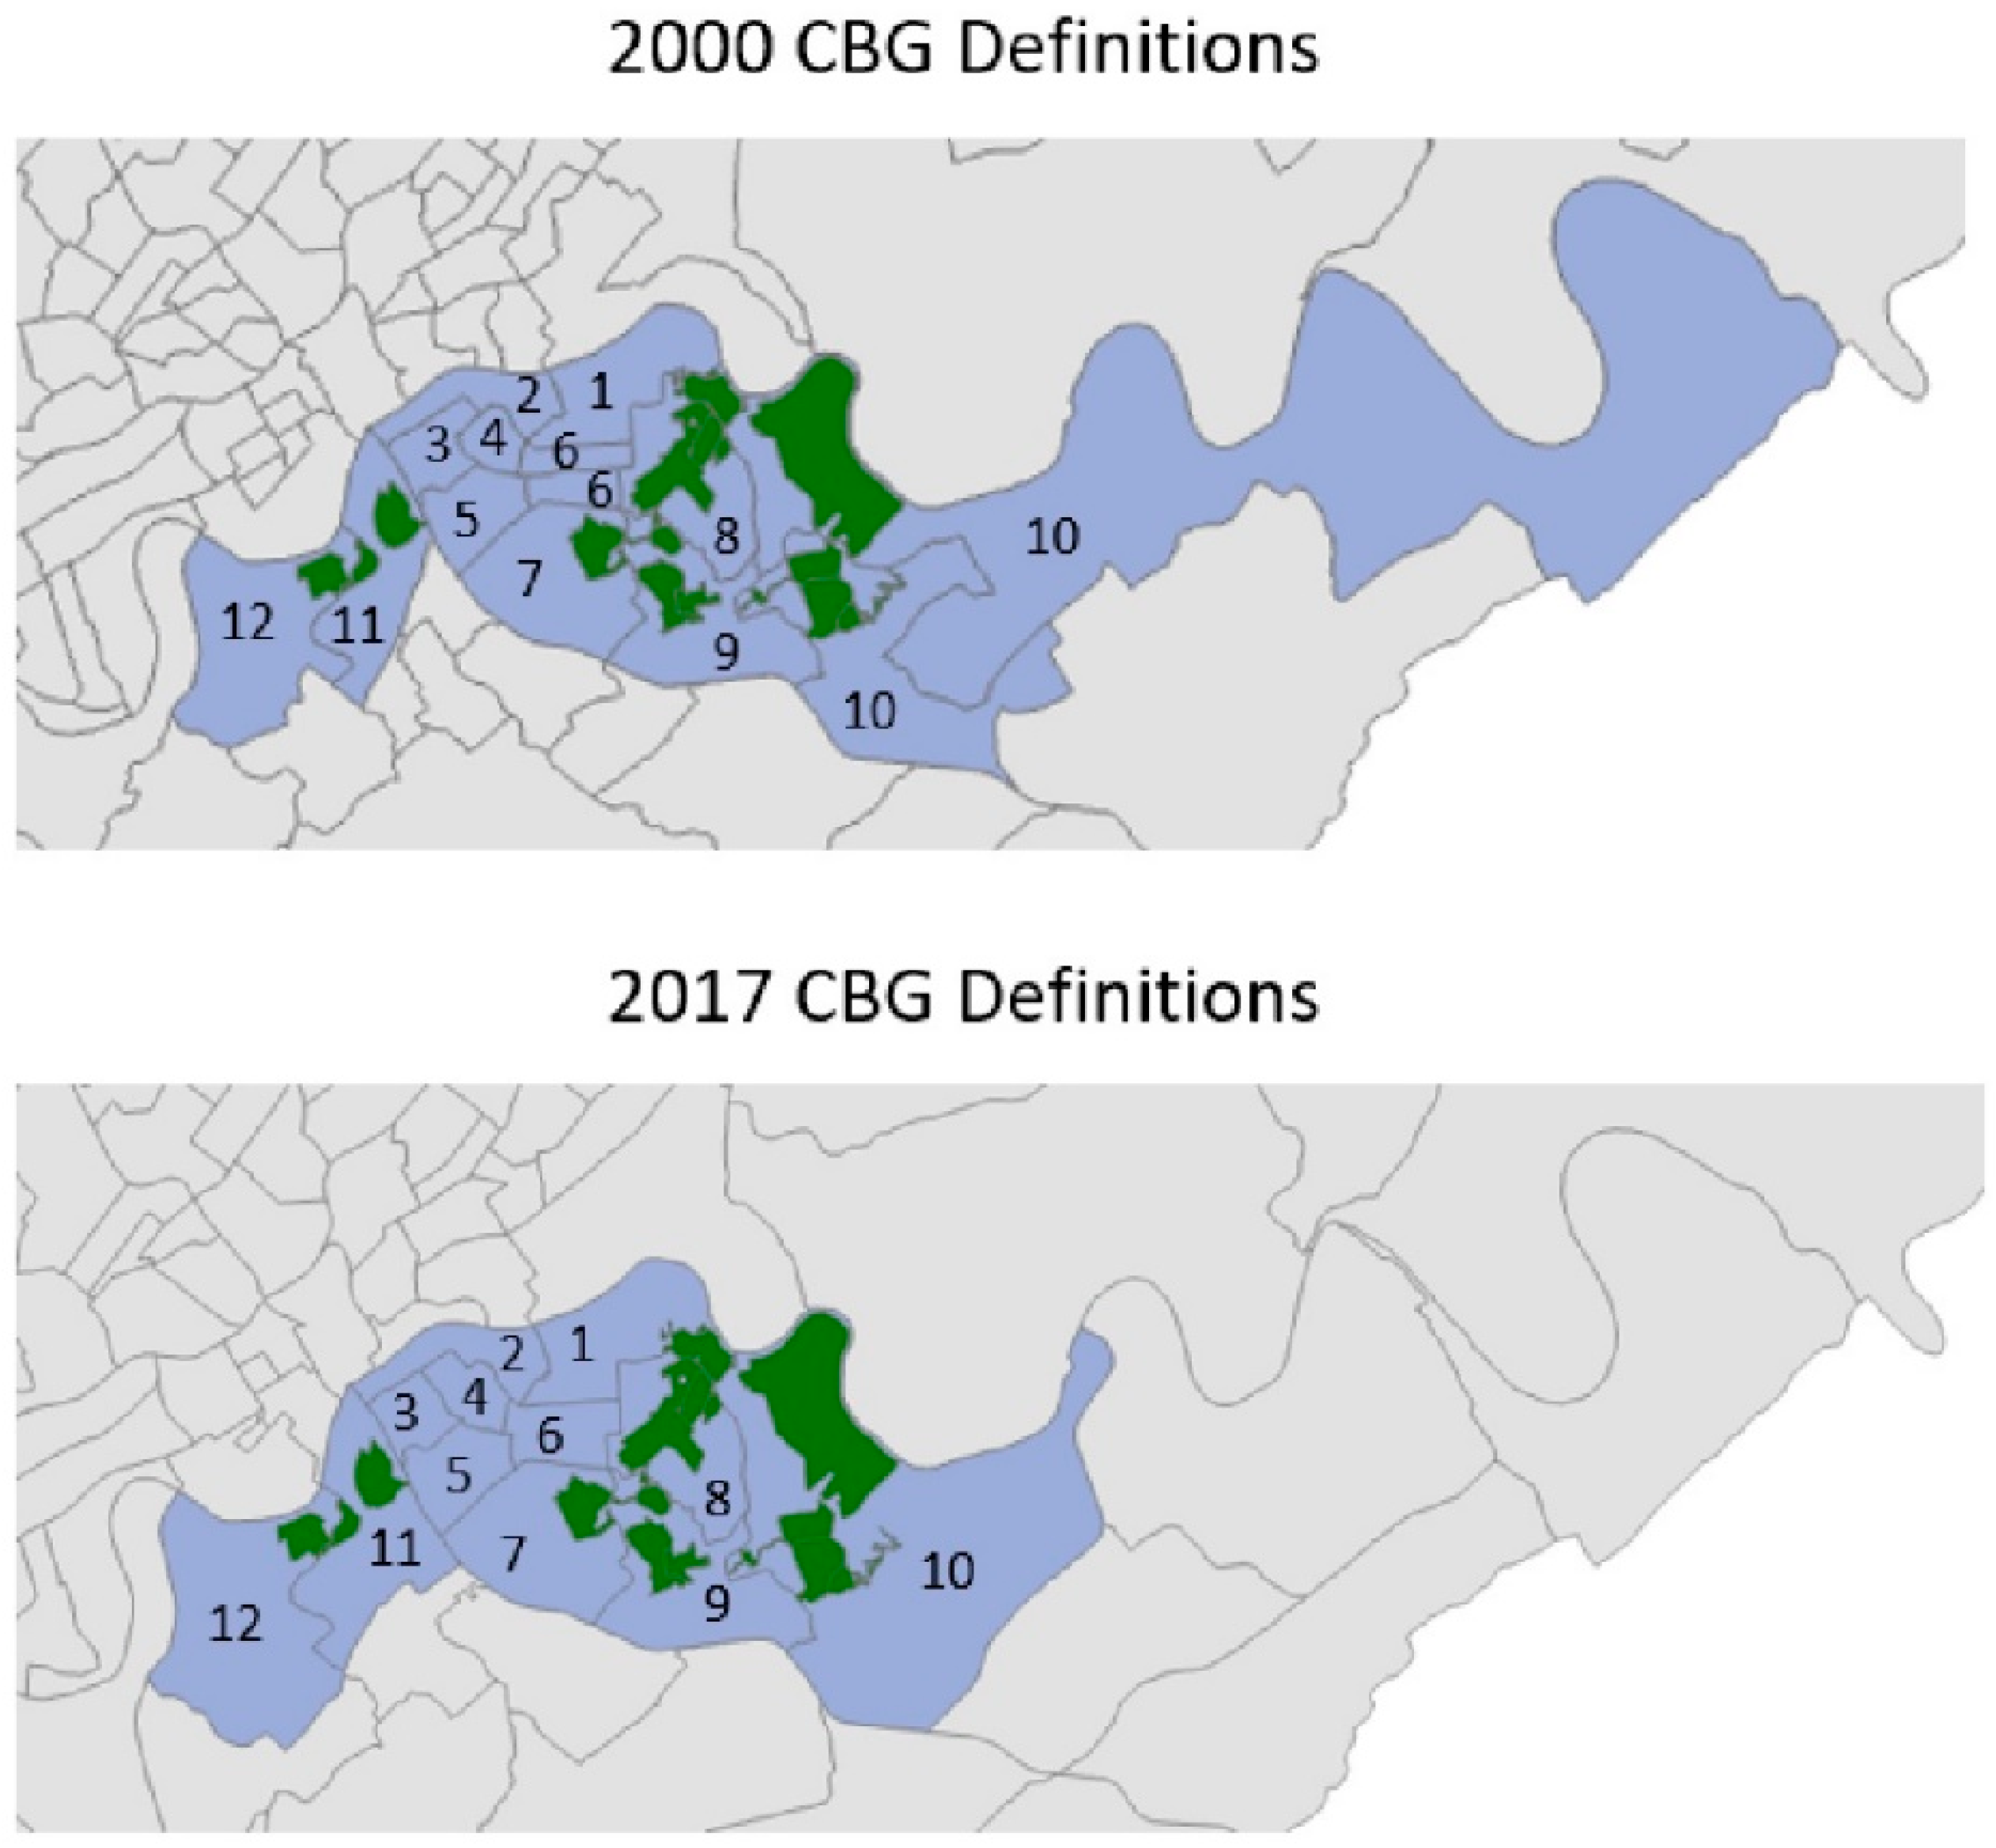
Figure A4, for a comparison of CBG boundaries between 2000 and 2017 for CBGs surrounding the Urban Wilderness). The exception is CBG 6 and 10, which was composed of two CBGs in 2000 and one CBG in 2017. To calculate a single comparison value for these CBGs in the year 2000, an average weighted by population was calculated for each variable of interest.
3.1. Changes in Knox County Home Prices
Figure 2 compares the average home price between 2000 and 2004 to the average home price between 2013 and 2017 by CBG in Knox County. The KUW, which is made up of the green areas in
Figure 2,
Figure 3 and
Figure 4, was more formally established between 2004 and 2013. Knoxville, as a whole, has seen growth in home prices since the early 2000s even when controlling for inflation. Homes in west Knoxville have generally increased to be greater than
$260,000. Census block groups in north, east, and south Knoxville have also experienced increases in home prices. Several CBGs in these regions now have an average home price between
$143,000 and
$180,000 and some CBGs have an average home price between
$180,000 and
$260,000.
When looking more closely at CBGs that either contain one of the Urban Wilderness parks or are adjacent to one of the parks, home prices in the early 2000s were lower compared to the rest of Knoxville as several CBGs had averages below $105,000. Some CBGs near the KUW have experienced growth as recent averages are between $105,000 and $143,000 or between $143,000 and $180,000. The average home price for the CBG that includes the Forks of the River Wildlife Management Area increased to be between $180,000 and $260,000.
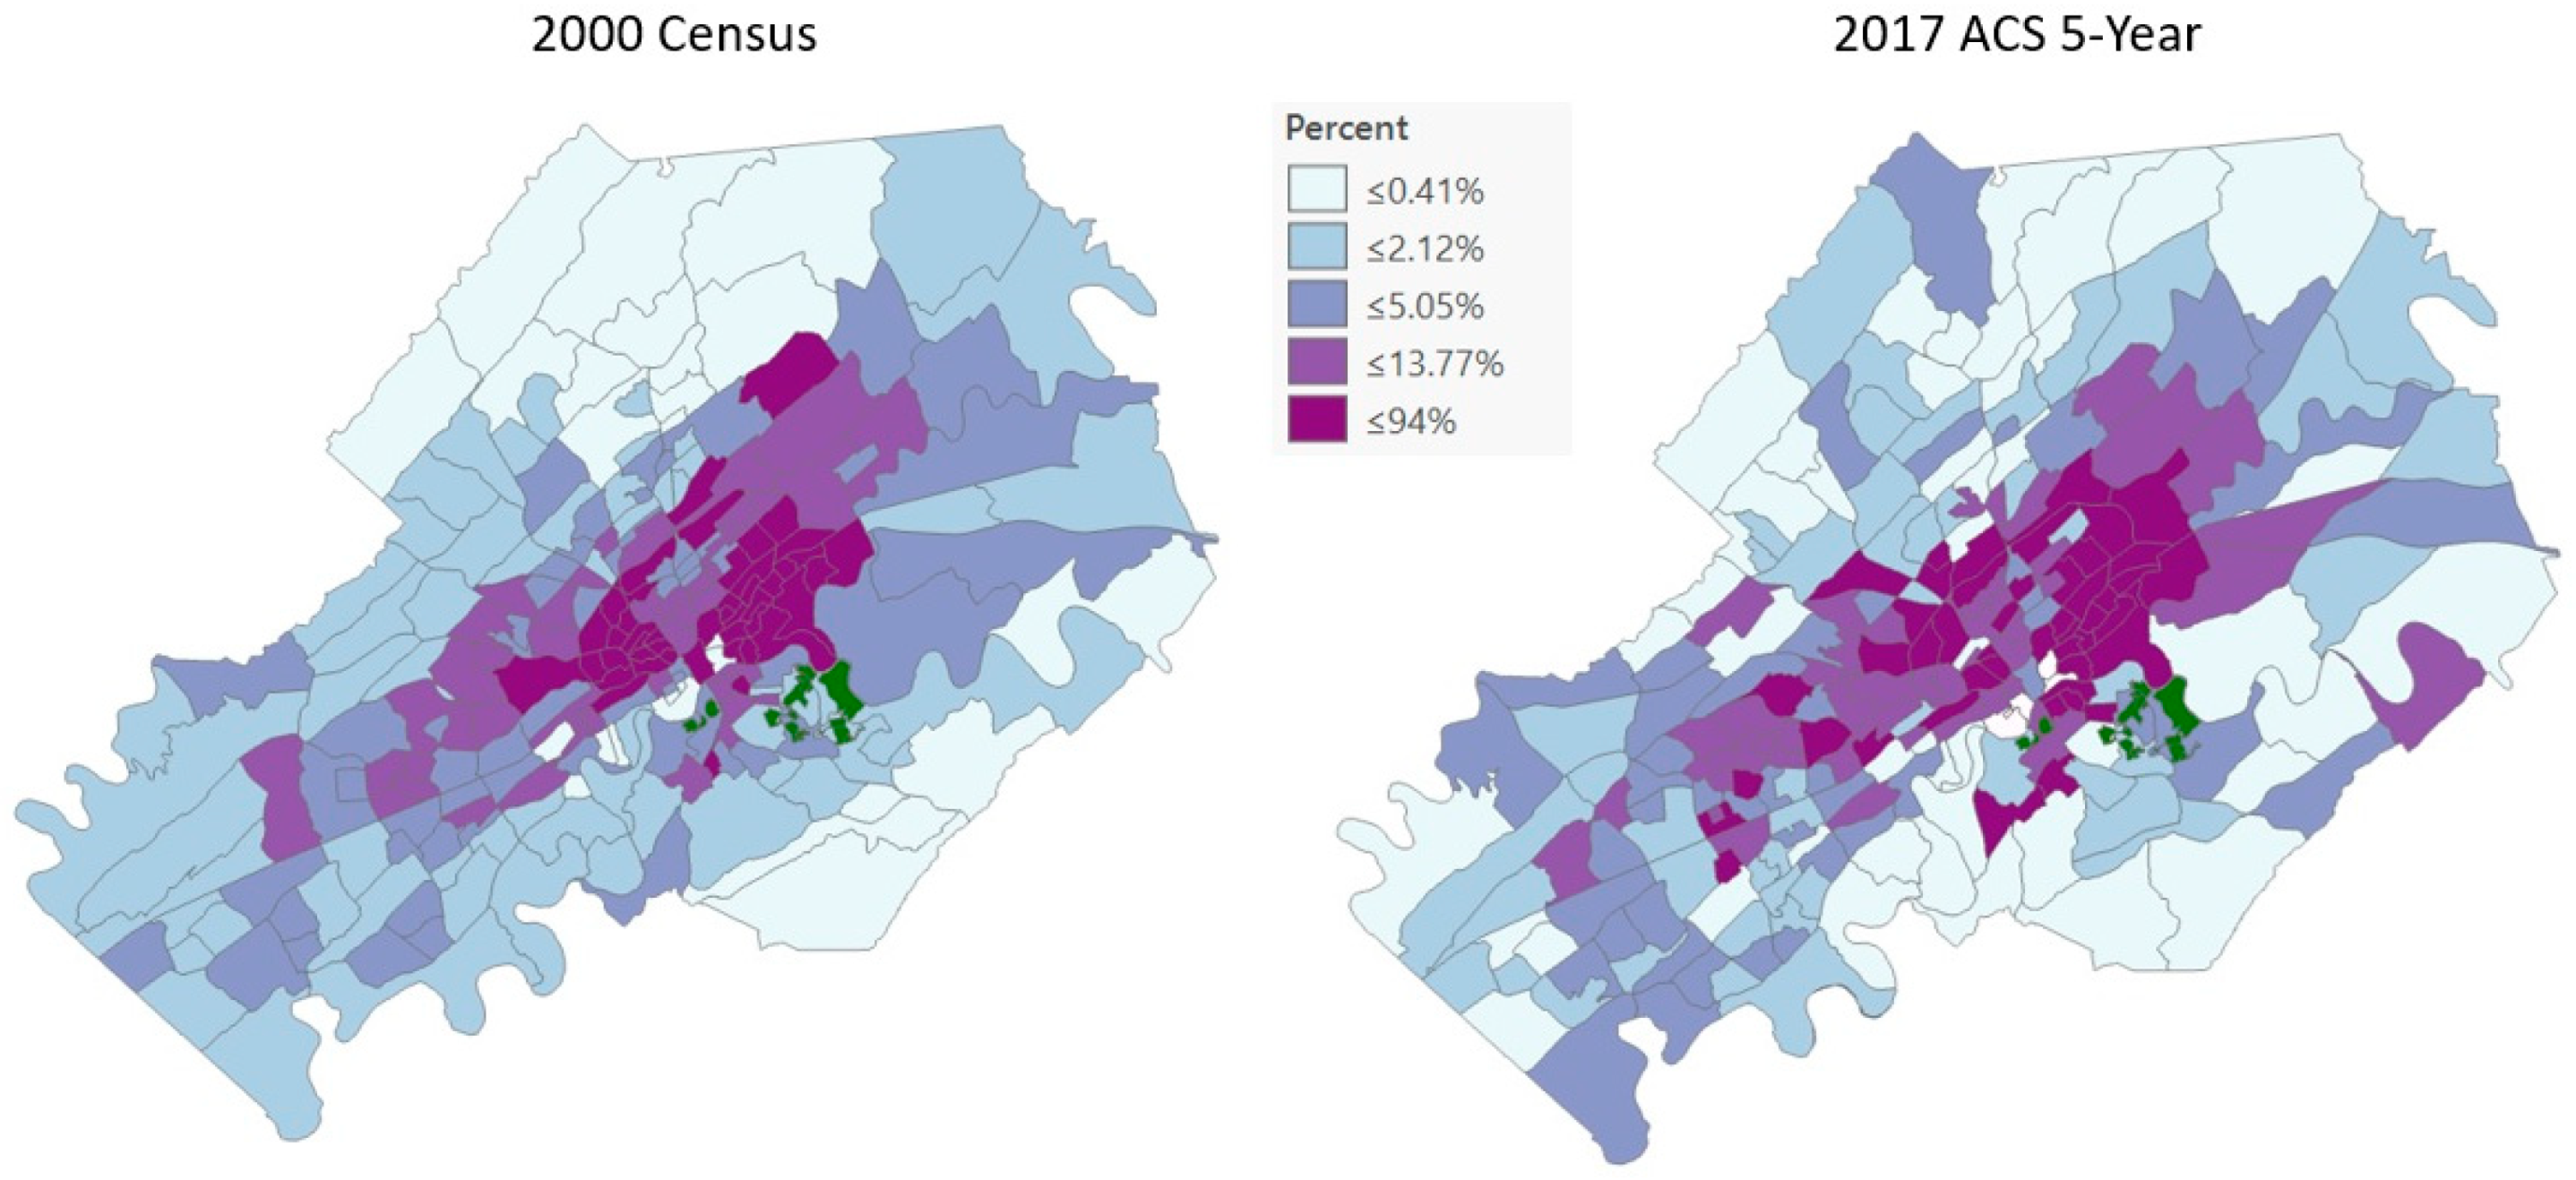
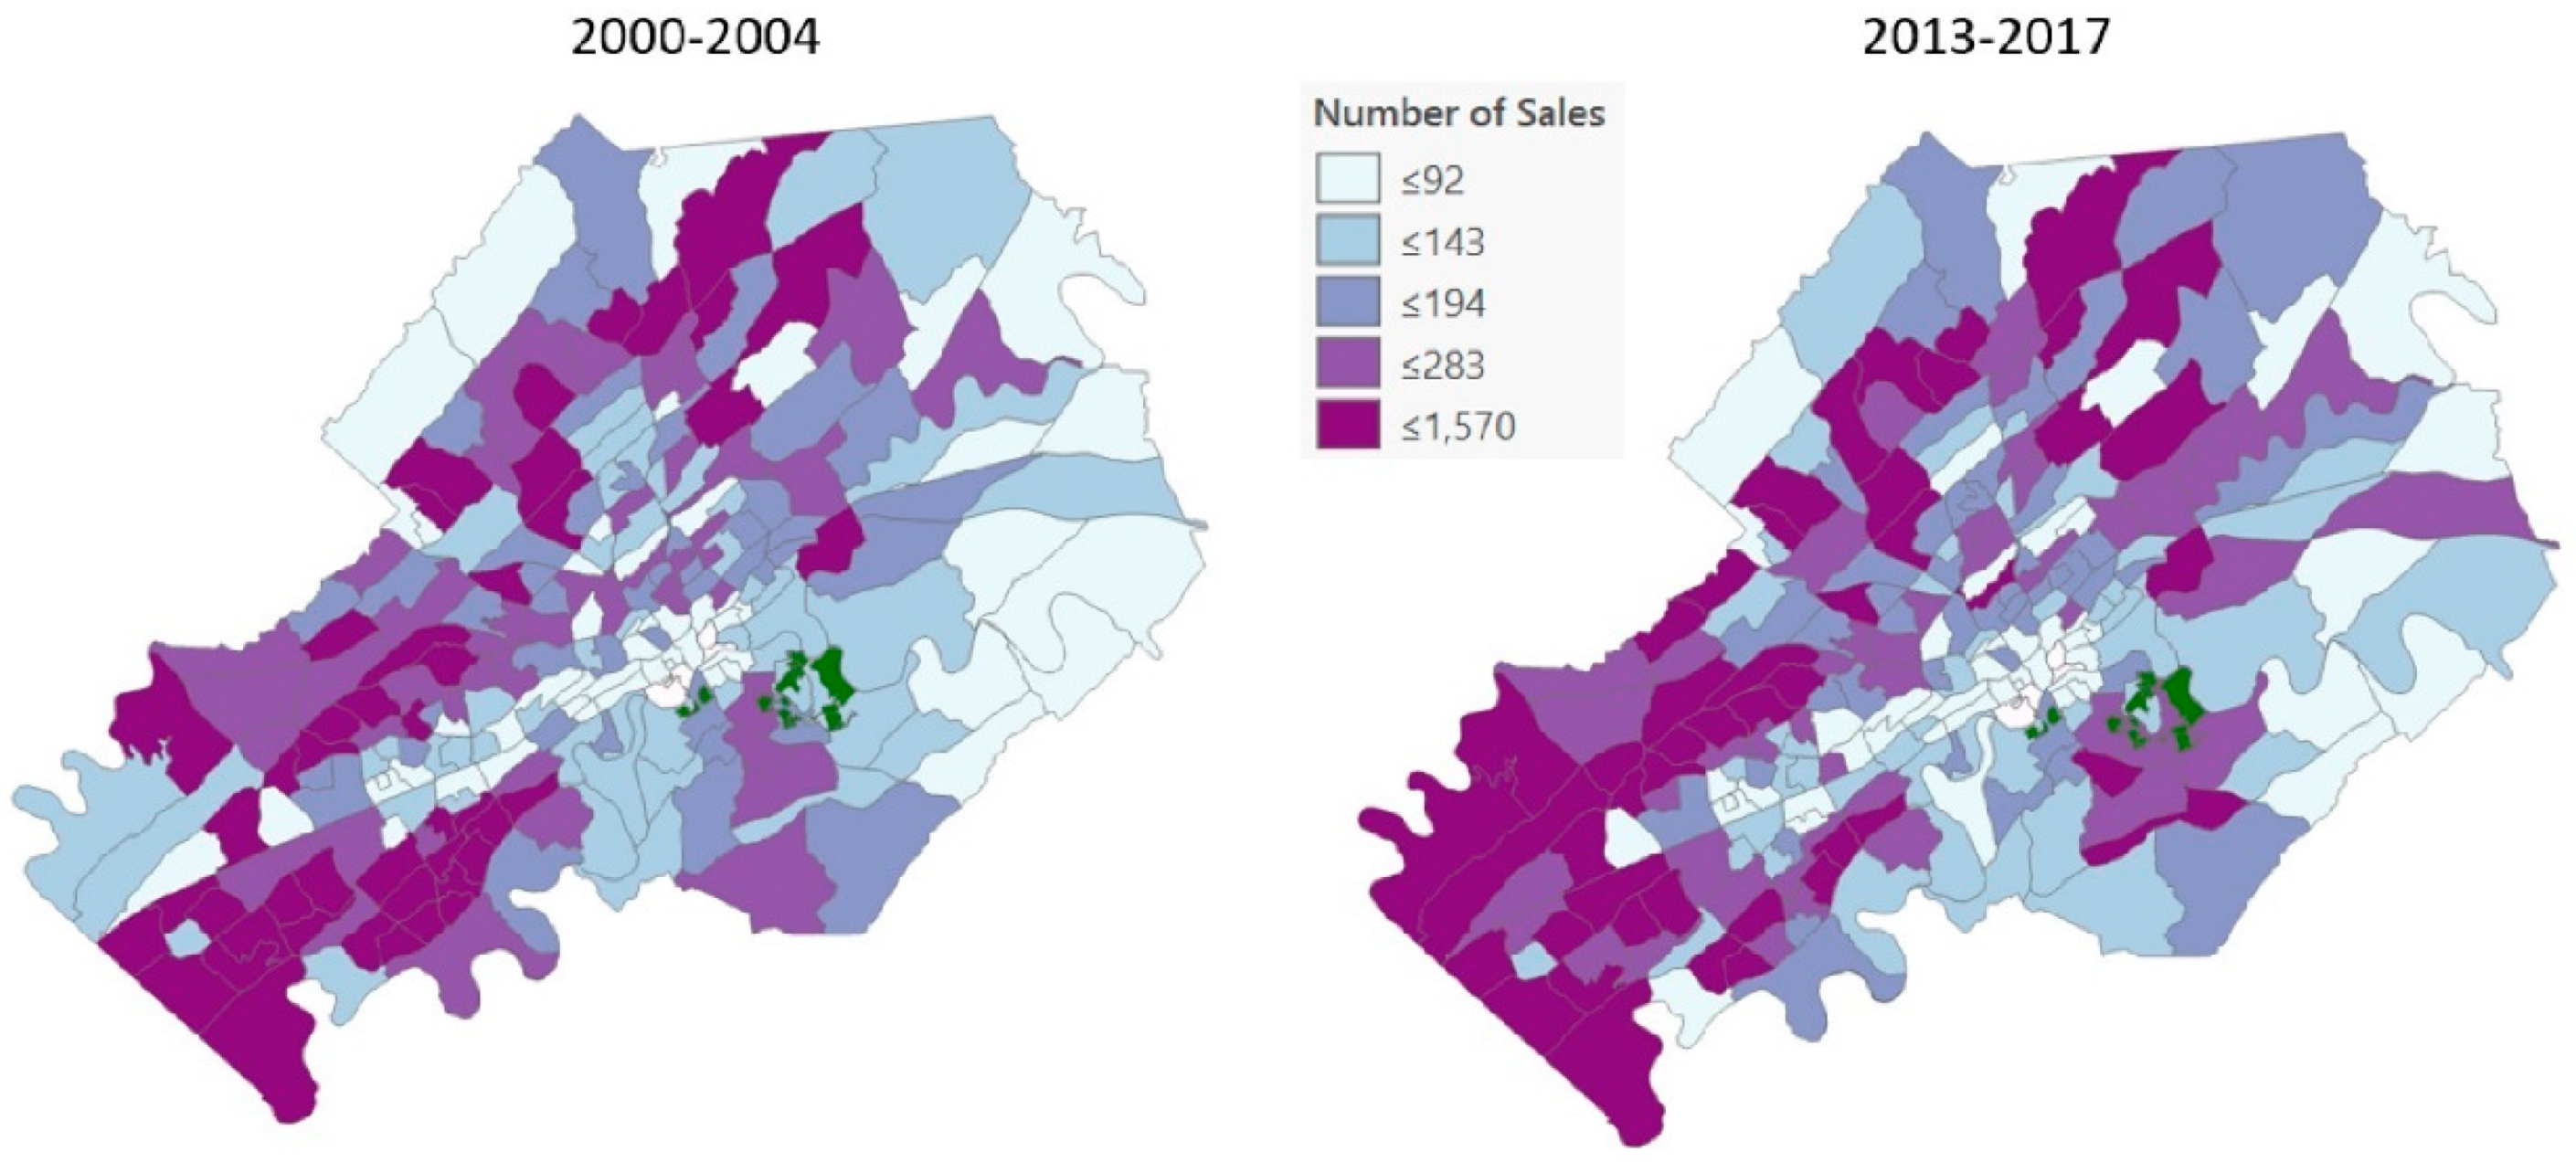
Complementing sale price data,
Figure 3 demonstrates how the number of homes sold has varied across CBGs in Knox County. There is more variation compared to the sales price data in that CBGs that are adjacent to each other fall into different percentiles in terms of the number of homes sold. Some of this variation may be from the construction of new neighborhoods which is different from increases in home owner turnover rates. Trends in the number of homes sold for large groups of CBGs or regions of the county are less visibly evident. For areas near the Urban Wilderness, some CBGs have remained in the same percentile while others have experienced growth in the number of homes sold. However, most areas in south Knoxville that experienced increases in home sales are those CBGs near the Urban Wilderness.
The percent change in average home prices and the number of homes sold between 2000–2004 and 2013–2017 is shown in
Figure 4. Across all CBGs in Knox County, the percent change in average home prices ranges from −21% to 528%, with a mean of 30%. The percent change exceeds 42% for several CBGs in west and south Knoxville. Focusing on CBGs that contain Urban Wilderness parks or are adjacent to an Urban Wilderness park, the growth in average home prices varies by CBG. Some CBGs near the Urban Wilderness experienced a decline in average home prices or modest growth while other CBGs experienced significant growth.
For the number of homes sold in Knox County, the percent change similarly varies by CBG and ranges from −53% to 600%, with a mean of 11%. For homes near the Urban Wilderness, some CBGs experienced similar trends in home prices and the number of homes sold in that both either increased or decreased over time. There are also instances of CBGs near the Urban Wilderness that experienced great increases in average sales price but a decline or modest growth in the number of homes sold, which suggest existing homes are increasing in value.
3.2. Home Prices near the Urban Wilderness
Figure 2,
Figure 3 and
Figure 4 above are helpful in visually examining how trends in home prices and sales have varied over time and across different areas within Knox County. Turning to more detailed data,
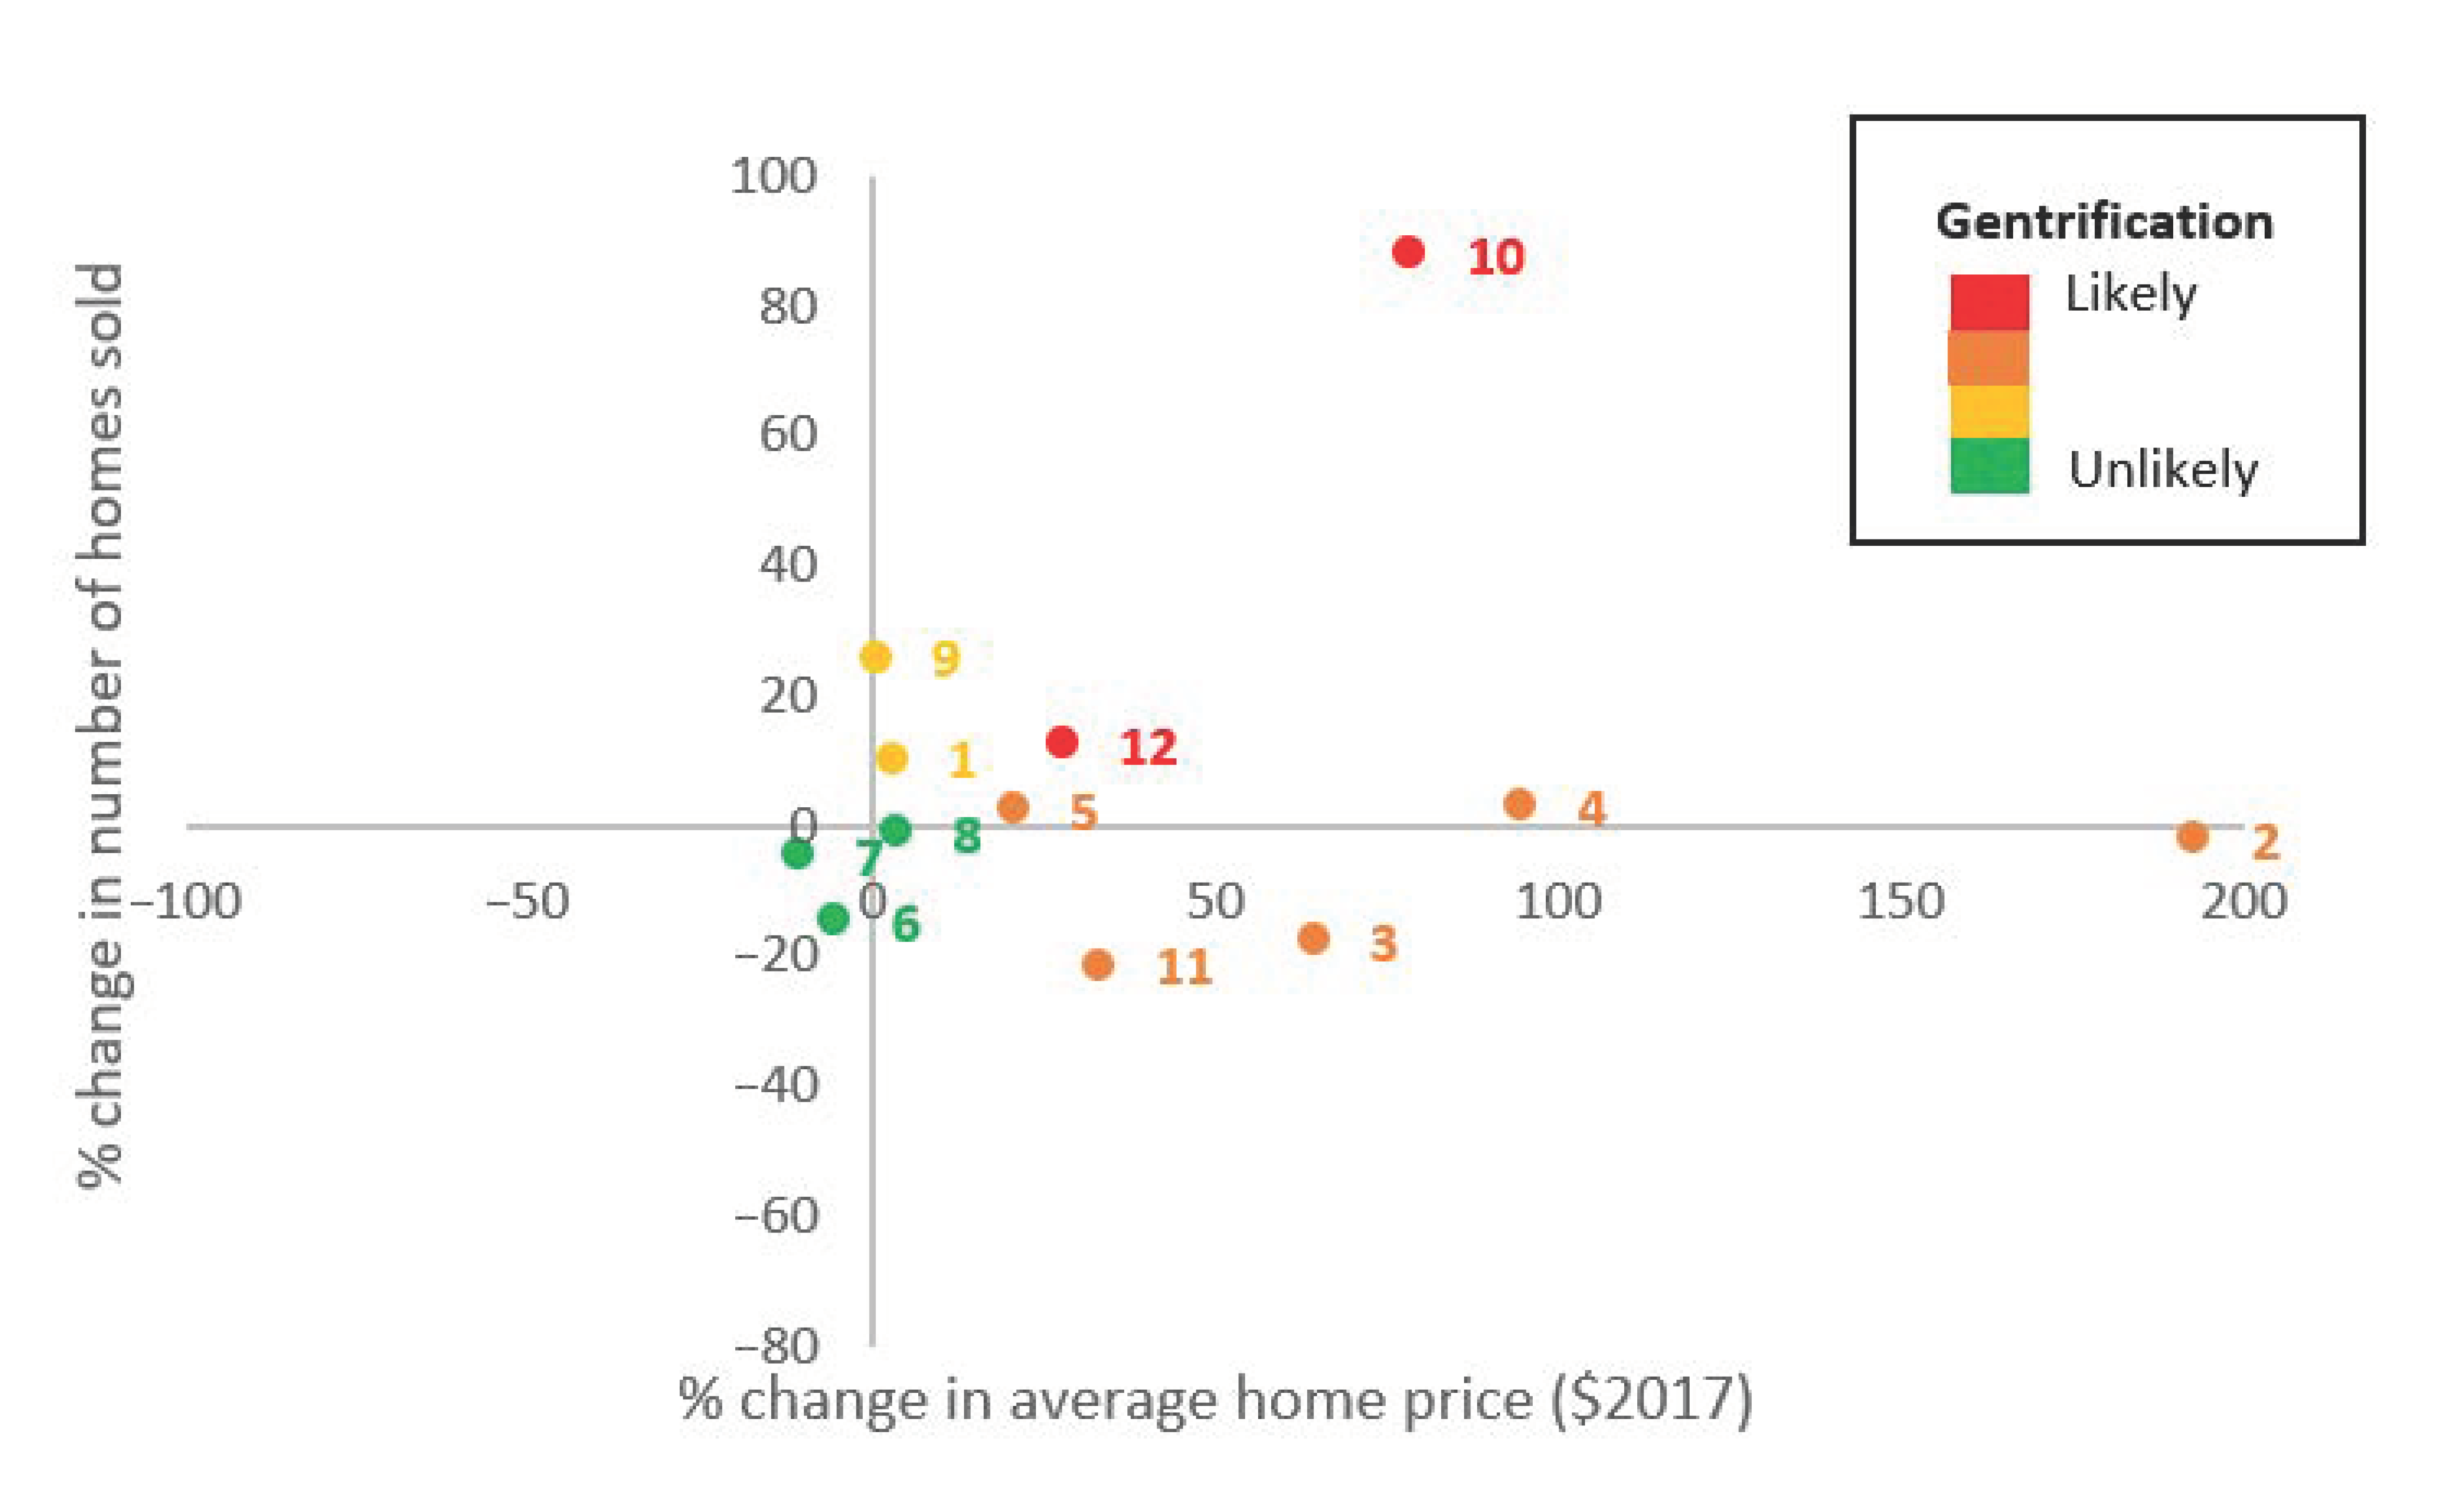
Figure 5 shows a scatterplot of the percent change in number of homes sold and average home price for the 12 CBGs that surround the Urban Wilderness parks and associated greenway system. Using the change in number of homes sold and average home prices, CBGs are categorized by the likelihood of gentrification taking place.
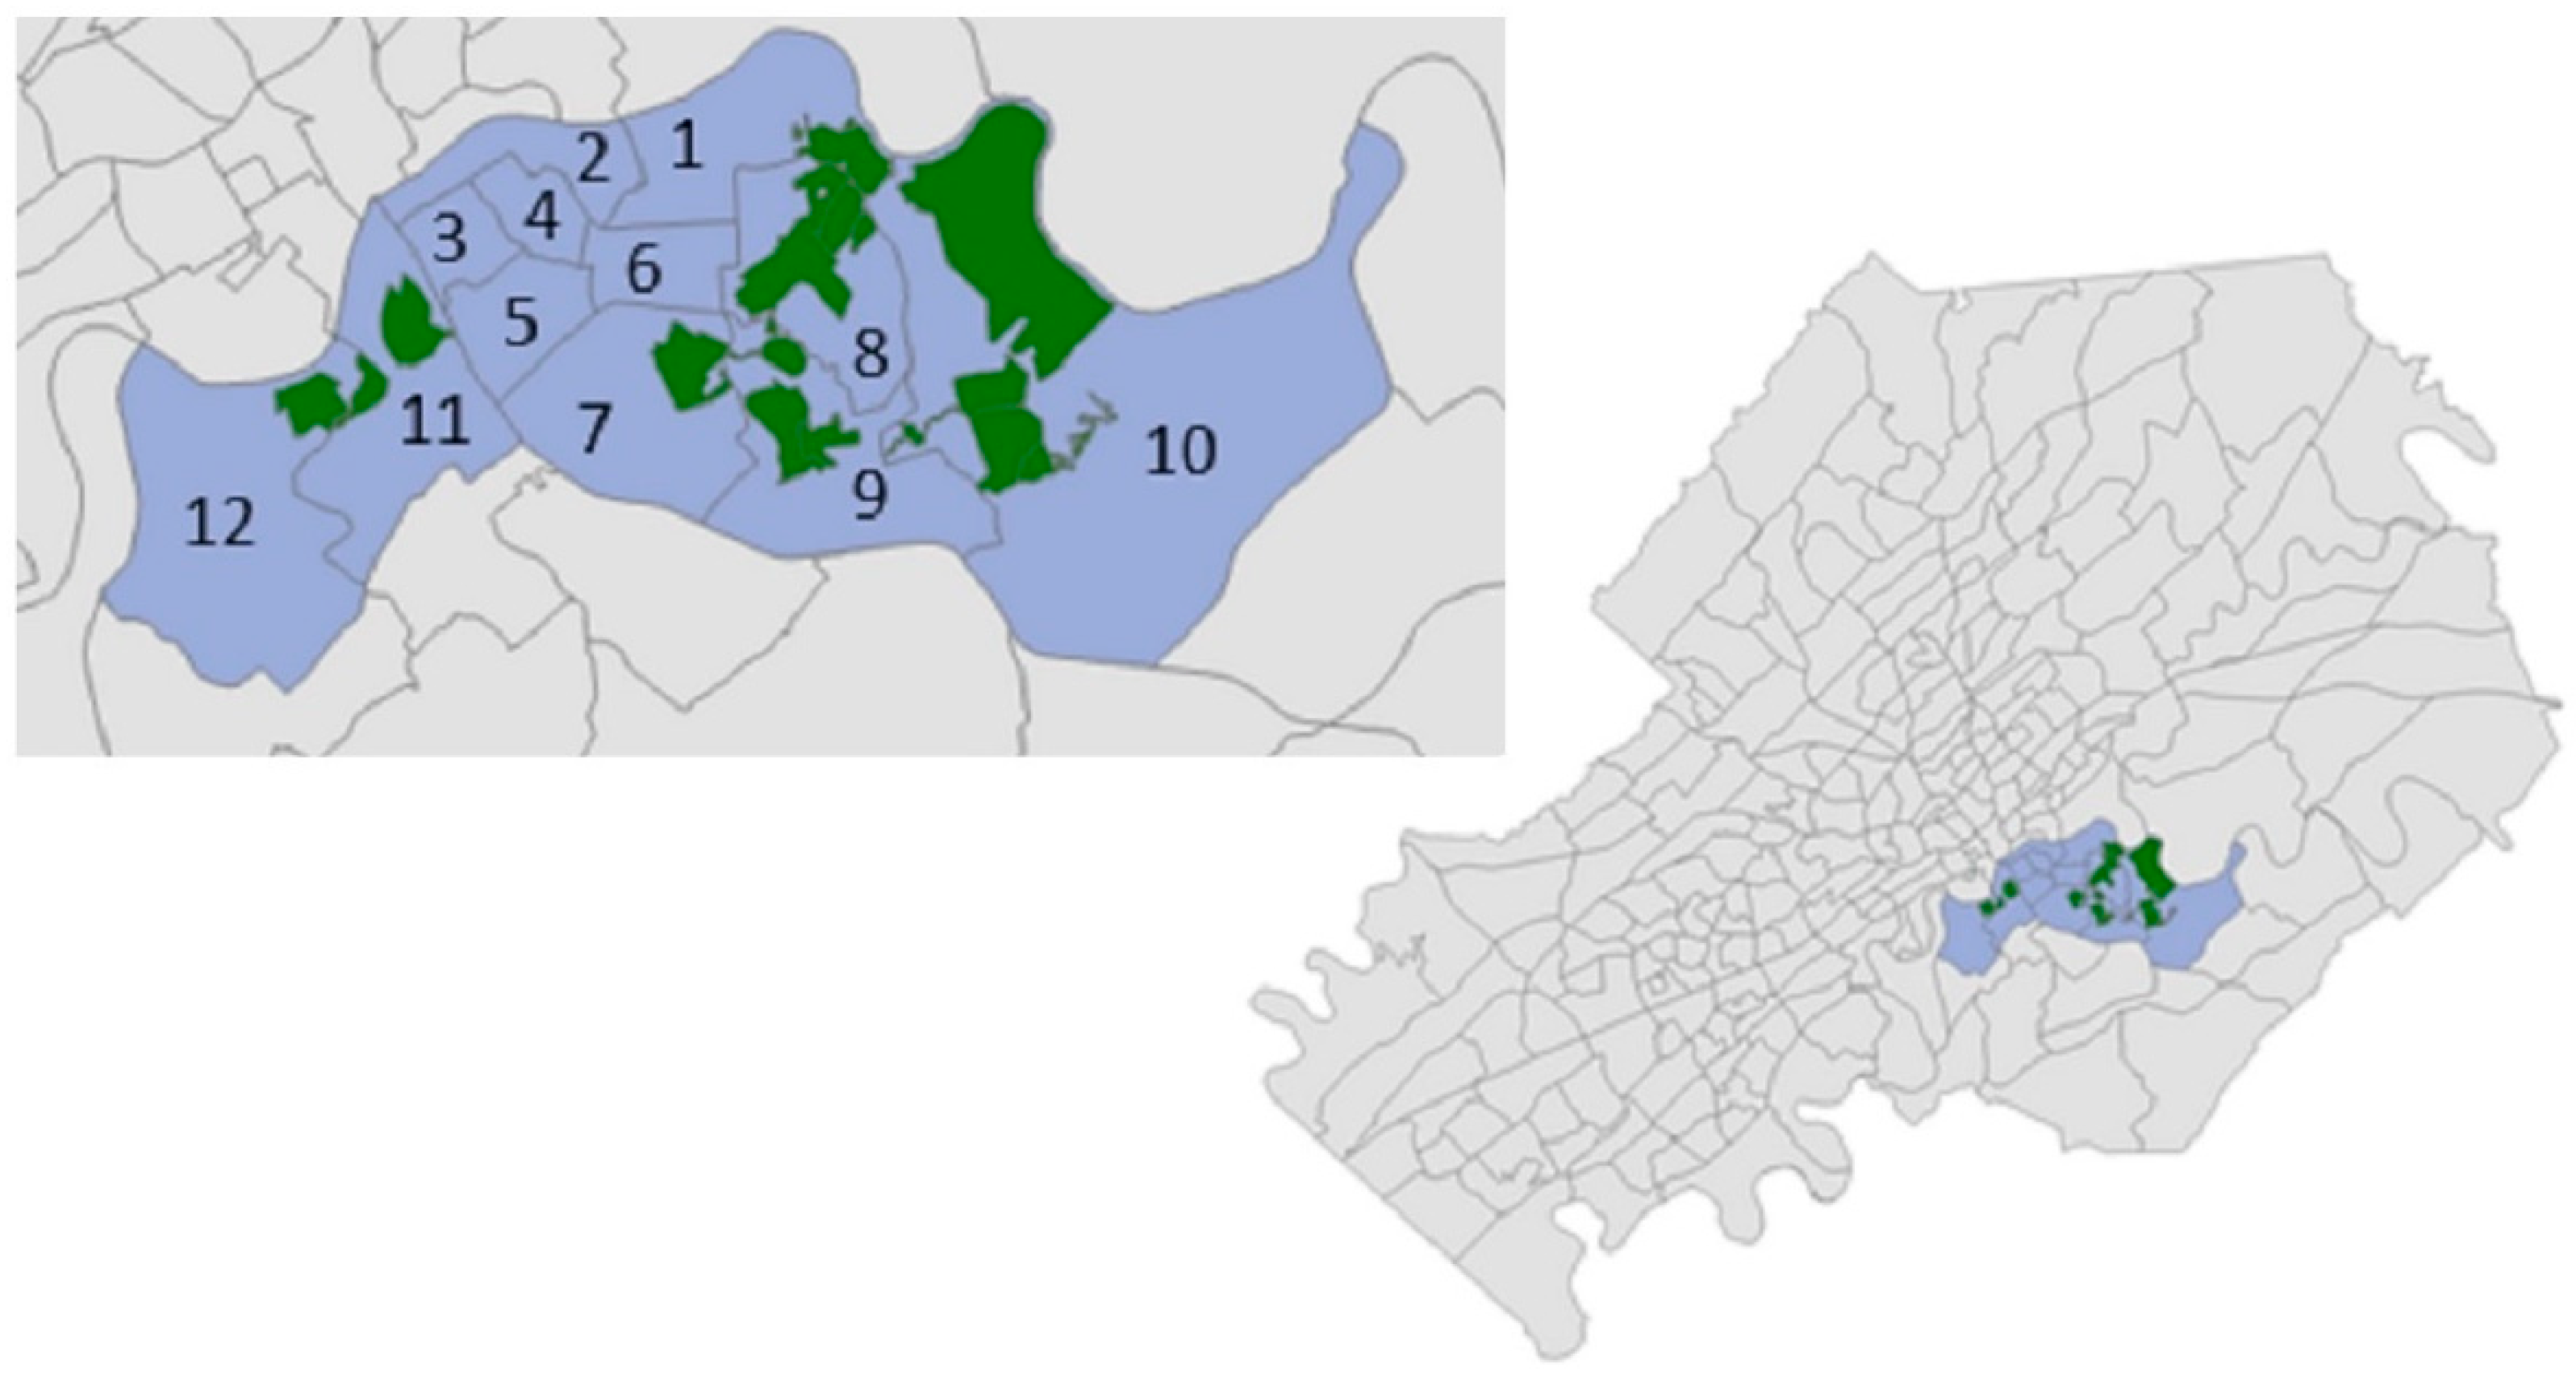
Figure 6 shows the location of each of these CBGs by their associated CBG identification number.
Gentrification is most likely occurring in CBG 10 and 12, which surround Fort Dickerson Park, the River Bluff Wildlife Area, and High Ground Park. These areas experienced both gains in home prices and number of homes sold. CBG 10, in particular, experienced the largest growth in number of homes sold, at 88.0%, and average home prices increased by 78.4% in this area. Housing demand increased in these CBGs since more homes were sold even at higher prices. The combination of rising demand and high turnover means gentrification may be occurring in these CBGs.
CBGs in brown (CBGs 2, 3, 4, 5, and 11) in
Figure 5 indicate areas that experienced a large increase in price and relatively small increase or even decrease in number of homes sold. This combination suggests people were willing to pay higher prices to live in these areas, but these higher prices didn’t entice many property owners to sell their home and may have even caused some property owners to delay selling their home. Property owners in areas where prices are increasing may want to sell their home to receive the increased value of their housing investment. On the contrary, property owners may prefer to maintain their ownership, particularly if they are enjoying the local amenities (which may also be the reason for the increase in demand) or they expect prices to continue to rise in the future. The latter appears to be the case in CBG 2, 3, 4, 5, and 11 as a contraction in supply (i.e., residents requiring higher prices for their homes) following an increase in demand would lead to higher prices but minimal increases (or even decreases) to the quantity of homes sold. Current owners choosing to stay in their homes reject the idea of gentrification in these areas; however, the higher prices suggest these areas may experience gentrification in the future. CBG 2, in particular, experienced the largest increase in home prices as average home prices increased by 192.9%.
Signs of gentrification are less clear in CBGs 1 (which contains Island Home Park and neighborhood and part of Ijams Nature Center) and 9 (which contains Marie Myers Park and Hastie Natural Area). These areas experienced more home sales but the price paid for those homes was similar to historic prices paid in those CBGs. While there was turnover in these areas, it’s unclear if it is the type that would constitute gentrification.
Lastly, CBGs 6, 7, and 8 did not experience significant changes in price or number of homes sold, indicating that gentrification in these areas is unlikely. CBG 6 and 7, in particular, experienced both a decline in home prices and the quantity of houses sold. There was likely a decline in housing demand in these areas since fewer homes were sold even at lower prices. Gentrification is unlikely to have occurred in these areas.
Examining changes in home prices and number of homes sold helps to detect where green gentrification may be occurring near the KUW. Diving deeper might reveal whether specific neighborhoods or the entire CBG encountered these levels of growth in price and whether changes in the number of homes sold is stemming from new neighborhoods or turnover of existing homes. Data limitations prevent us from performing an analysis at the sub-CBG level. However, we next turn to examining how socioeconomic variables have changed in areas surrounding the KUW to further assess whether green gentrification is taking place.
3.3. Income, Educational Attainment, and Race near the Urban Wilderness
Gentrification broadly refers to neighborhoods with lower-priced homes that experience significant growth in home prices, and the notion is often associated with higher-income households displacing lower-income households. Gentrification can be driven by multiple factors such as proximity to urban amenities such as restaurants, museums, and central business districts with job opportunities as well as proximity to environmental amenities such as open spaces, parks, and opportunities for outdoor recreation. Thus, increases in home prices and sales could be a natural response to changes in the supply of urban and environmental amenities with little or no change in the income or racial composition of a neighborhood. To explore gentrification, specifically in CBGs in south Knoxville near the KUW,
Table 2 presents the median household income, percent of the population with a bachelor’s degree, and percent of the population that is black for CBGs surrounding the KUW (To visually compare how median household income, educational attainment, and race various across time and all CBGs in Knoxville, see
Appendix A,
Figure A1,
Figure A2 and
Figure A3).
The median household income for all CBGs surrounding the KUW is below the average median household income for Knox County, which was
$57,733 in 2017. The exception is CBG 10, which had a median household income of
$58,155 in 2017. Some CBGs experienced increases in median household income including CBGs 2, 3, 4, 6, 7, and 10 while other CBGs experienced declines in income such as CBG 1, 5, 8, 9, 11, and 12. Significant increases in income support the idea of gentrification if those areas also concurrently experienced upsurges in house prices and sales. Looking across
Figure 5 and
Table 2, CBGs 2, 3, 4, and 10 are the CBGs that experienced both gains in income and house prices. CBG 4 and 10 are the only areas that experienced an increase in household income, home prices, and home sales.
While home prices and incomes have increased for CBG 2, 3, and 4, there is not strong evidence for gentrification in these areas. Median household income in these three CBGs are still lower than the county average. Bachelor degree attainment rates are lower, and the percent of the population that is black has grown and is higher than average in these areas. Only CBG 4 experienced an increase in number of homes sold. Additionally, CBG 12 was originally flagged as potentially gentrifying due to increases in home prices and sales. However, household income declined by 8.5 percent in this area, which suggests that gentrification has not likely happened in this area thus far. This may change in the future as expansions to the Urban Wilderness are completed and the growth in urban amenities continues, but as of 2017, lower-income households in these areas appear to be benefiting from expansions of the Urban Wilderness and are not being priced out of their neighborhoods.
CBG 10, which includes the Forks of the River Wildlife Management Area, is the area most likely to be gentrifying. Median household income increased by 29.9% to
$58,155, which is above the average for the county. Simultaneously, home prices increased by 78.4% to an average of
$299,613, which is also above the average home price across other CBGs in Knox County (See
Appendix A,
Table A1 for the level of home prices and number of homes sold by CBG in addition to the percent changes as shown in
Figure 5). Bachelor degree attainment rates are lower than average, and the growth rate for the percent of the population that is black is higher than average, which arguably is in contrast to the idea of gentrification. Collectively, the data suggest that gentrification may be taking place in CBG 10, but it doesn’t seem to be an extreme and definitive case of gentrification. As more projects are completed to expand both the urban and environmental amenities, this is an area that should be further examined. In summary, relative to other areas of Knoxville, there is still affordable housing in south Knoxville and lower-income households, particularly near the Urban Wilderness, do not seem to be priced out of neighborhoods on a large scale.
4. Discussion
Our descriptive analysis of housing sales and prices as an indicator of gentrification acknowledges that gentrification is the result of an economic restructuring [
31]. Historically, the hedonic valuation literature in economics, which statistically ties neighborhood amenities to home values, has leveraged this economic restructuring to infer people’s values for improvements in environmental quality [
32]. More recently, researchers have begun to recognize that the economic restructuring that creates a particular flavor of economic value may also be creating inequities in access to these environmental improvements [
33]. This more recent literature highlights several key relationships that could give rise to the correlation between urban parks like the KUW and demographics that is often attributed to gentrification [
34]. However, all of these relationships suggest increases in real estate prices and sales are a potential indicator of gentrification.
There do not appear to be uniform trends in average prices and growth in prices for CBGs surrounding the Urban Wilderness. Some CBGs near the KUW have experienced significant gains in average home prices since the early 2000s. The appreciation of some home values may be attributable to the KUW. These areas are also near the south-side of the Tennessee River and across from downtown Knoxville, which has also grown significantly in recent years. Therefore, some of the growth may be from proximity to urban amenities and job opportunities in downtown Knoxville, the growth and recreational activities available at the KUW or a combination of both. However, in general, descriptive analysis at the CBG level does not provide strong evidence of gentrification taking place in areas near the KUW. Had the descriptive analysis uncovered stronger evidence of gentrification, a hedonic regression analysis would have been useful for isolating the role of the KUW from other potential changes that may have affected house prices and number of homes sold [
35,
36]. However, as shown in
Figure 2,
Figure 3 and
Figure 4, CBGs in other areas of Knoxville experienced significant variation in home prices or number of homes sold, demonstrating there are numerous factors affecting home prices.
What might be causing the lack of apparent general gentrification effects from the KUW? It is possible that gentrification effects might still occur over a longer period of time than the 17-year window analyzed herein. However, our span of observation is about the same range or longer as that used in previous studies showing green gentrification patterns, e.g., 9 years [
27], 10 years [
21], 11 years [
37] and 5 years [
38].
Another possible factor causing this lack of gentrification by the KUW might be related to the attributes of the green space itself. Urban green spaces can vary widely in size (area), ecological traits (e.g., lawn, forest, riparian), and usage (e.g., sports, nature parks, scenic) so we can expect urban green spaces to also vary in their environmental and amenity functions, their impacts on housing prices and other basic factors that affect gentrification outcomes [
35,
36]. It is well documented, for example that smaller green spaces tend to have significantly fewer green space impacts than larger ones [
21,
39]. As the KUW is very large for an urban park, we might therefore expect a relatively significant gentrification impact.
On the other hand, a recent study of New York City parks showed a clear gentrification effect only in medium-sized parks, with no obvious effect in small and large parks [
27]. The same study found that both passive-use and natural parks showed a greater gentrification effect compared to active-use (e.g., sports) green parks. The lack of gentrification from active-use green space has been attributed to the disamenities and negative externalities generated by noise, traffic and crowds that negatively impact residents near active-use green spaces [
40,
41]. Some parts of the KUW are heavily used for active sports (mountain biking) but other areas are used mainly for passive uses and nature-appreciation so it is unclear exactly how these uses may explain our findings.
Whatever their cause(s), our findings that improvements in environmental amenities are continuing to benefit lower-income households, while not pushing them to other areas of the county, are encouraging in the context of environmental justice concerns [
18,
19,
21]. Our findings align with other studies emphasizing that gentrification is not a universal outcome of urban green space establishment but is often contingent on the attributes and spatial and economic contexts of the green space itself. Ideally, these kinds of findings can be used proactively, to establish and design urban green spaces that eliminate or mitigate the process of green gentrification. Specifically, our findings indicate that, in addition to the “just green enough” approach to use small green spaces to mitigate gentrification, the urban movement toward large intentional urban wilderness parks may also be a valuable approach to create green spaces without promoting further social inequalities.

