Article

Food and Feeding Biology of Nile Tilapia (Oreochromis niloticus) in Lake Langeno, Ethiopia

1
Department of Biology, College of Natural and Computational Science, Ambo University, Ambo P.O. Box 19, Ethiopia
2
Department of Zoological Science, Addis Ababa University, Addis Ababa P.O. Box 1176, Ethiopia
3
Department of Veterinary and Biosciences, Faculty of Veterinary Medicine, Ghent University, 9000 Ghent, Belgium
*
Author to whom correspondence should be addressed.
Sustainability 2022, 14(2), 974; https://doi.org/10.3390/su14020974
Submission received: 12 December 2021 / Revised: 13 January 2022 / Accepted: 13 January 2022 / Published: 15 January 2022

Abstract

:
This study aimed to investigate the natural feeding behavior of Nile tilapia in Lake Langeno, Ethiopia, with emphasis on potential spatial, size and seasonal effects on ingested food items. This study of the food and feeding biology of O. niloticus in Lake Langeno, Ethiopia, was conducted from March 2016to February 2017. Fish samples were collected monthly from six different sampling sites using different mesh sizes of gillnets. A total of 610 fish specimens with full stomachs were considered for the assessment of feeding biology. In total, seven food items, namely phytoplankton, zooplankton, insects, detritus, macrophytes, fish parts and nematodes, were identified from the fish stomach contents. Phytoplankton was the most commonly consumed food prey, followed by detritus, zooplankton and macrophytes. The other food items were occasionally and randomly consumed. Phytoplankton and detritus were the dominant food prey in the dry season, with zooplankton and macrophytes the main prey during the wet months. The contribution of phytoplankton, zooplankton and insects were slightly highest in small-sized groups (<10 cm), whereas detritus, macrophytes and fish parts were highest in larger-size groups (>20 cm) (p < 0.05). The present results point to a concurrence of the relative importance of dietary items at the individual level, species level and among the study sites. Phytoplankton was the primary consumed food item, which indicates the specialist feeding strategy of Nile tilapia in the lake. Generally, food items of plant origin, typically associated with less protein content than animal origin food items, dominated the stomach contents of Nile tilapia. The dietary pattern of Nile tilapia in Lake Langeno shifts with size and season, aspects that might warrant further study in view of aquaculture applications as well as climate change.

1. Introduction

Fish require nutrients for growth, reproduction and other normal physiological functions. In a natural aquatic environment, phytoplankton, zooplankton, plant materials, insects, insects’ larvae, worms and smaller fish are the major food types of fish [1]. Fish tend to show a preference for particular food items within their environment. The availability of food in any aquatic environment determines the well-being and reproductive potential of fish [2]. The weight and size of fish are a reflection of food availability in the aquatic ecosystem [3]. Many environmental factors, such as water temperature, food availability, stocking density and environmental conditions, influence the food selection behavior of fish [4]. The size of food itemsand the size and age of fish can also determine their food selection behavior [5]. Mainly, fish feed on items that can fit into their mouth and what their stomach can digest. As fish grow, the stomach becomes longer and their digestive system becomes more developed [1,5]. However, the feeding rate relative to body weight decreases, whereas the absolute rate of food consumed increases [1].
The study of food and feeding habits of freshwater fish species is a subject of continuous research. This is because it makes up a basis for the development of a successful management program on fish capture and culture [6]. Moreover, studies on the natural feeding of fish enable us to identify the trophic relationships present in aquatic ecosystems, identifying feeding composition, structure and stability of food webs [5].
Nile tilapia (Oreochromis niloticus) is the most important fish species in tropical and subtropical freshwater [7]. It is of great importance, often forming the basis of commercial fisheries in many African countries [8]. High tolerance to environmental conditions and its ability to accept formulated and natural feeds make it economically viable [9]. It has a versatile feeding behavior and is characterized by a generalist and opportunistic omnivorous feeding behavior [10]. Its diet composition may vary within a wide range of temporal and spatial conditions of the environment [4]. Therefore, understanding its food and feeding behavior is a key factor to its successful culture in a controlled environment [6].
In Ethiopia, Nile tilapia is one of the most commercially important fish species [11] (Mitike, 2014). It is contributing to, on average, more than 50% of the annual total catch. Commercial fishing is totally dependent on wild catch [11,12]. Some researchers have studied the food and feeding habits of this fish species in a few water bodies of Ethiopia [13,14,15]. In Lake Langeno, one of Ethiopia’s highly alkaline lakes, O. niloticus is the dominant commercially important fish species, contributing about 72.2% of the total catches [16]. Recent studies have, however, indicated that the maximum size of O. niloticus being caught from the lake was showing a decreasing trend, from 35 cm TL [13] to 30.5 cm TL [17]. The maximum size was also distinctly lower than the maximum size of the same species in Lake Zeway (34 cm) [18] and Lake Koka (35.2 cm) [14]. Body condition of the fish (1.77) [17] was also lower than the report made 10 years earlier [19] (1.84) in the same study lake and other rift valley lakes including Lake Zeway (1.82) [18] and Lake Babogaya (2.13) [20]. Fecundity of the fish in the lake (464 ± 114 eggs fish−1) from research by Temesgen [17] also showed a lower potential compared to the same fish species in similar Ethiopian rift valley lakes, for example, in Lake Chamo (1047 to 4590 eggs fish−1) [21]. These reports depict the lower availability or poor quality of food for the fish in the lake, which necessitates conducting a well-organized and updated study in the study area. In other ways, there is a scientific gap on the spatial variation and temporal variation of food composition and ontogenetic dietary shift of O. niloticus. The present study therefore aimed to document the natural feeding behavior of Nile tilapia in Lake Langeno, Ethiopia, with an emphasis on potential spatial, size and seasonal effects of ingested food items.

2. Materials and Methods

2.1. Description of the Study Area

Lake Langeno is one of the Ethiopian rift valley lakes located in Oromia National Regional State, between Western Arsi and East Shoa zonal administration 200 km from the capital city Addis Ababa toward the south. It is enclosed by Arsi Negelle District from the south, west and east, and by Adami Tullu Giddo Kombolcha from the north, between 7°36′ N and 38°43′ E at an altitude of 1585 m above sea level. It covers about 240 km2 of land. The lake is very deep, with a maximum depth of about 48 m and an average depth of 17 m. The eastern part of the lake is surrounded by the Eastern Langeno nature reserve. It is mainly fed by runoff and hot spring waters. Inlet Rivers from the highlands of Arsi Mountains, such as Lepis, Gedemso, Garabula, Metti, Tufa and Sedesedi Rivers, feed the lake, but it is only drained by the Horakelo River to join Lake Abijata [22]. The water chemistry of the lake is similar to the other Ethiopian rift valley lakes where Na+ and CO32− are the dominant cation and anion, respectively. The lake serves as a home to diverse animals and plants. Dense phytoplankton blooms, mainly cyanophytes, characterize the lake [23], whereas Cladocera and copepods dominate the zooplankton assemblage in the lake [24].

2.2. Study Design, Sample Site Selection and Fish Sampling Method

The study was conducted from March 2016 through February 2017. Based on the distance from the shore area, depth of the lake and human activity in the catchment area, six representative sampling sites were selected (one from the middle and five from the shore areas) for the collection of primary data. From the six selected sites, fish samples were collected for two years. Because of the gear-specific selectivity associated with fish size, varied mesh sizes of gillnets (6 cm, 8 cm, 10 cm and 12 cm) with 25 m panel length and 1.5 m depth were used to capture representative fish samples. Nets were set at approximately two hours before sunsetand left to sample overnight, with catches collected the following morning two hours after sunrise [25]. The numbers of fish caught were recorded for each sampling occasion. Total length (mm) and total weight (g) of fish were measured using a measuring board to the nearest 0.1 cm and an OKI sensitive balance with a sensitivity of 0.1 g, respectively.

2.3. Fish Stomach Collection Method

The stomachs of live O. niloticus specimens were removed and classified as distended, full, 3/4 full, 1/2 full or 1/4 full by visual observation. The stomachs extracted from the live fish were preserved immediately in 5% formaldehyde solution for later analysis. All samples were transported to Ghent University in Belgium for further analysis.

2.4. Stomach Content Analysis

In the laboratory, the stomach contents were kept for five minutes to remove excess formalin. The stomachs were dissected and the contents were taken and added to the graduated test tube filled with distilled water. After vigorous shaking, the volumes of the content were computed and the samples were transferred to an agar plate. The larger food items were identified visually, whereas the small-sized food items were identified to the lowest possible taxonomic level using dissecting (LEICA MS5, magnification 40×) and compound microscope (LEICA DME, magnification 400×) following the description, illustrations and keys in the literature [26,27,28,29,30]. Fish diet composition was computed using several simple relative measures of prey quantity (RMPQ) because the use of single indices alone is constrained by the inherent limitations of emphasizing different aspects of fish diet [31]. Due to its greater suitability for diet quantification, especially for herbivorous fishes, volumetric analysis with direct displacement was used to quantify dietary items in the fish’s stomach [32]. The volume (mL) and frequency of occurrences were generated as Relative Measure of Prey Quantity (RMPQ), which was used to compute the Geometric Index of Importance (GIIi) for each consumer fish species. GIIi was used to evaluate the relative importance of food items and species-level dietary variations [33].
The frequency of occurrence was computed as: %Oi = J i p × 100, where Ji, is the number of fish containing food items and p is the number of fish with food in their stomach.
Volumetric method (%Vi) was also computed as:
% V i = Number   of   points   allocated   to   component   i Total   points   allocated   to   subsample × 100
where %Vi is the percentage volume of the prey component i.
An index of preponderance (IP) was also used to evaluate the relative abundance of different organisms in the fish diet based on Natarajan and Jhingran [34] as:
IPi = (%Vi) (%Oi)
where %Vi = percentage volume of a particular diet in the total volume of food items and %Oi = percentage observation of a particular food item in the total number of stomachs examined.
GIIi for a particular prey category ‘i’ was computed as GIIi = (∑RMPQi)/(√n), where RMPQi = percentage of volume and frequency of occurrence (as a percentage of total occurrences), and n = total number of RMPQ. The standardized index of GII ranges from 0–1 (1–100%), with values close to 0 indicating feeding specialization and values close to 1.0 representing generalization [35].

2.5. Statistical Analysis

Cumulative prey curves were generated to determine if sufficient stomach samples were collected for proper diet description [36]. The curves represented a cumulative number of unique prey categories plotted against the cumulative number of fish stomachs examined. Data was randomized for the sequence in which the stomach samples were considered to create cumulative prey curves. The log-ratio principal component analysis (%PCA) was used to test the diet composition variation of the prey’s composition [37]. For prey volumes equal to zero, very small numbers (0.00001) were entered before analysis [38].
A multivariate analysis (MANOVA) test was performed to assess the ontogenetic and seasonal variation of prey items in the food composition with randomization of prey volumes [35]. Randomization was required to counterbalance the non-normal distributional nature of the food composition data. A Wilk’s lambda (Λ) test was considered for the randomization procedure. When the MANOVA test was significant at 0.05 CL, the Mann–Whitney U test was performed to identify specific prey categories that caused seasonal variation in food composition. For size-based food analysis, fish were categorized into five size classes based on the frequency distribution of total length (TL) of specimens. Regression analysis was used to determine the coefficient of determination (r2) to check whether the model fitted the data. Linear correlation analysis (r) was performed to test the relationship between prey composition and total length of fish and/or seasonal variation. In addition, a permutation test was performed to see the statistical significance of the seasonal and length-based variation of prey items. A Bonferroni correction was made to adjust the p-value for the multiple-comparison test of several dependent or independent statistical tests performed simultaneously. The statistical analyses were carried out using CANOCO software version 4.5 (Microcomputer Power, Ithaca, NY 14850, USA) and PAST software version 4.08 (Natural History Museum, University of Oslo, Norway).

3. Results

3.1. The Status of Collected Stomach Samples

A total of 1658 O. niloticus fish (46.9% (n = 778) males and 53.1% (n = 880) females) were collected. The number and relative stomach volume of O. niloticus are indicated in Table 1.
The cumulative prey curves generated for fish species at each site based on the major categories of dietary items are shown in Figure 1. The curves approaching asymptote indicate the collection of sufficient gut samples for all study sites.

3.2. Diet Composition

A total of 512 (30.9%) fish (only fish with distended and full stomachs) were examined for their stomach contents. The size of fish sampled for their stomach content analysis ranged between 9 cm and 30.5 cm TL. Phytoplankton, zooplankton, insects, detritus, macrophytes, fish parts, ostracods and nematodes were the identified food items in the stomachs of O. niloticus. Phytoplankton and detritus were the most dominant food items identified, whereas zooplankton and macrophytes were the intermediately consumed prey types. Fish parts, insects, ostracods and nematodes were the rarely consumed items identified, being observed only in 15.9%, 8.6%, 10.1% and 7.8%, respectively, of the studied stomachs (Table 2).
The log-ratio principal component analysis (%PCA) for the individual level dietary variations is shown in Figure 2. Diets of individual fish varied largely on PC-1 with 58.69% of variance and PC-2 with 19.88% of the variance, which together accounted for 78.57% of the total variance.
The different food items of phytoplankton, zooplankton and insect groups identified in the diet of O. niloticus are presented in Table 3. In total, 43 different taxa of phytoplankton, 6 taxa of zooplankton and 10 insect types were identified in the stomachs of the studied fish. Of the phytoplankton groups, Cyanophyta (blue-green algae, mainly Microcystis spp. and Chroococcus spp.) were most abundant in the food composition of O. niloticus. Microcystis spp. and Chroococcus spp. were observed in 100% and 92% of stomachs with a volumetric contribution of 24.9% and 9.1%, respectively. From the Bacillariophyta (diatom) groups, Cyclotella spp. were the most abundant followed by Surirella spp., Cymbella spp., Navicula spp. and Pinnularia spp. (observed in 99.5%, 98.0%, 92.0%, 90.0% and 76.0% of the studied stomachs, respectively), while Oocystis and Chlorella spp. were the dominant Chlorophyta groups, both in the frequency of occurrence and volumetric contribution (observed in 78.0% and 76.0% of the stomachs, respectively).
The food items of animal origin comprised zooplankton, insects, fish parts (eggs and larvae), nematodes and ostracods. Rotifers were the dominant zooplankton group observed in 76.9% of stomachs, followed by copepods and cladocerans (mainly Daphnia spp.) (observed in 48.3 and 33.6% of stomachs, respectively). In terms of index of preponderance, Microcystis spp. (24.9% IP), detritus (15.9% IP), Chroococcus spp. (9.1% IP), Rotifer spp. (3.4% IP) and Cyclotella spp. (3.6% IP) were the most important food items identified.
The percentage of geometric importance index value (%GII) showed that phytoplankton was the primary consumed food item, whereas detritus, zooplankton and macrophytes were the second most consumed food types by O. niloticus in this study area (Figure 3).

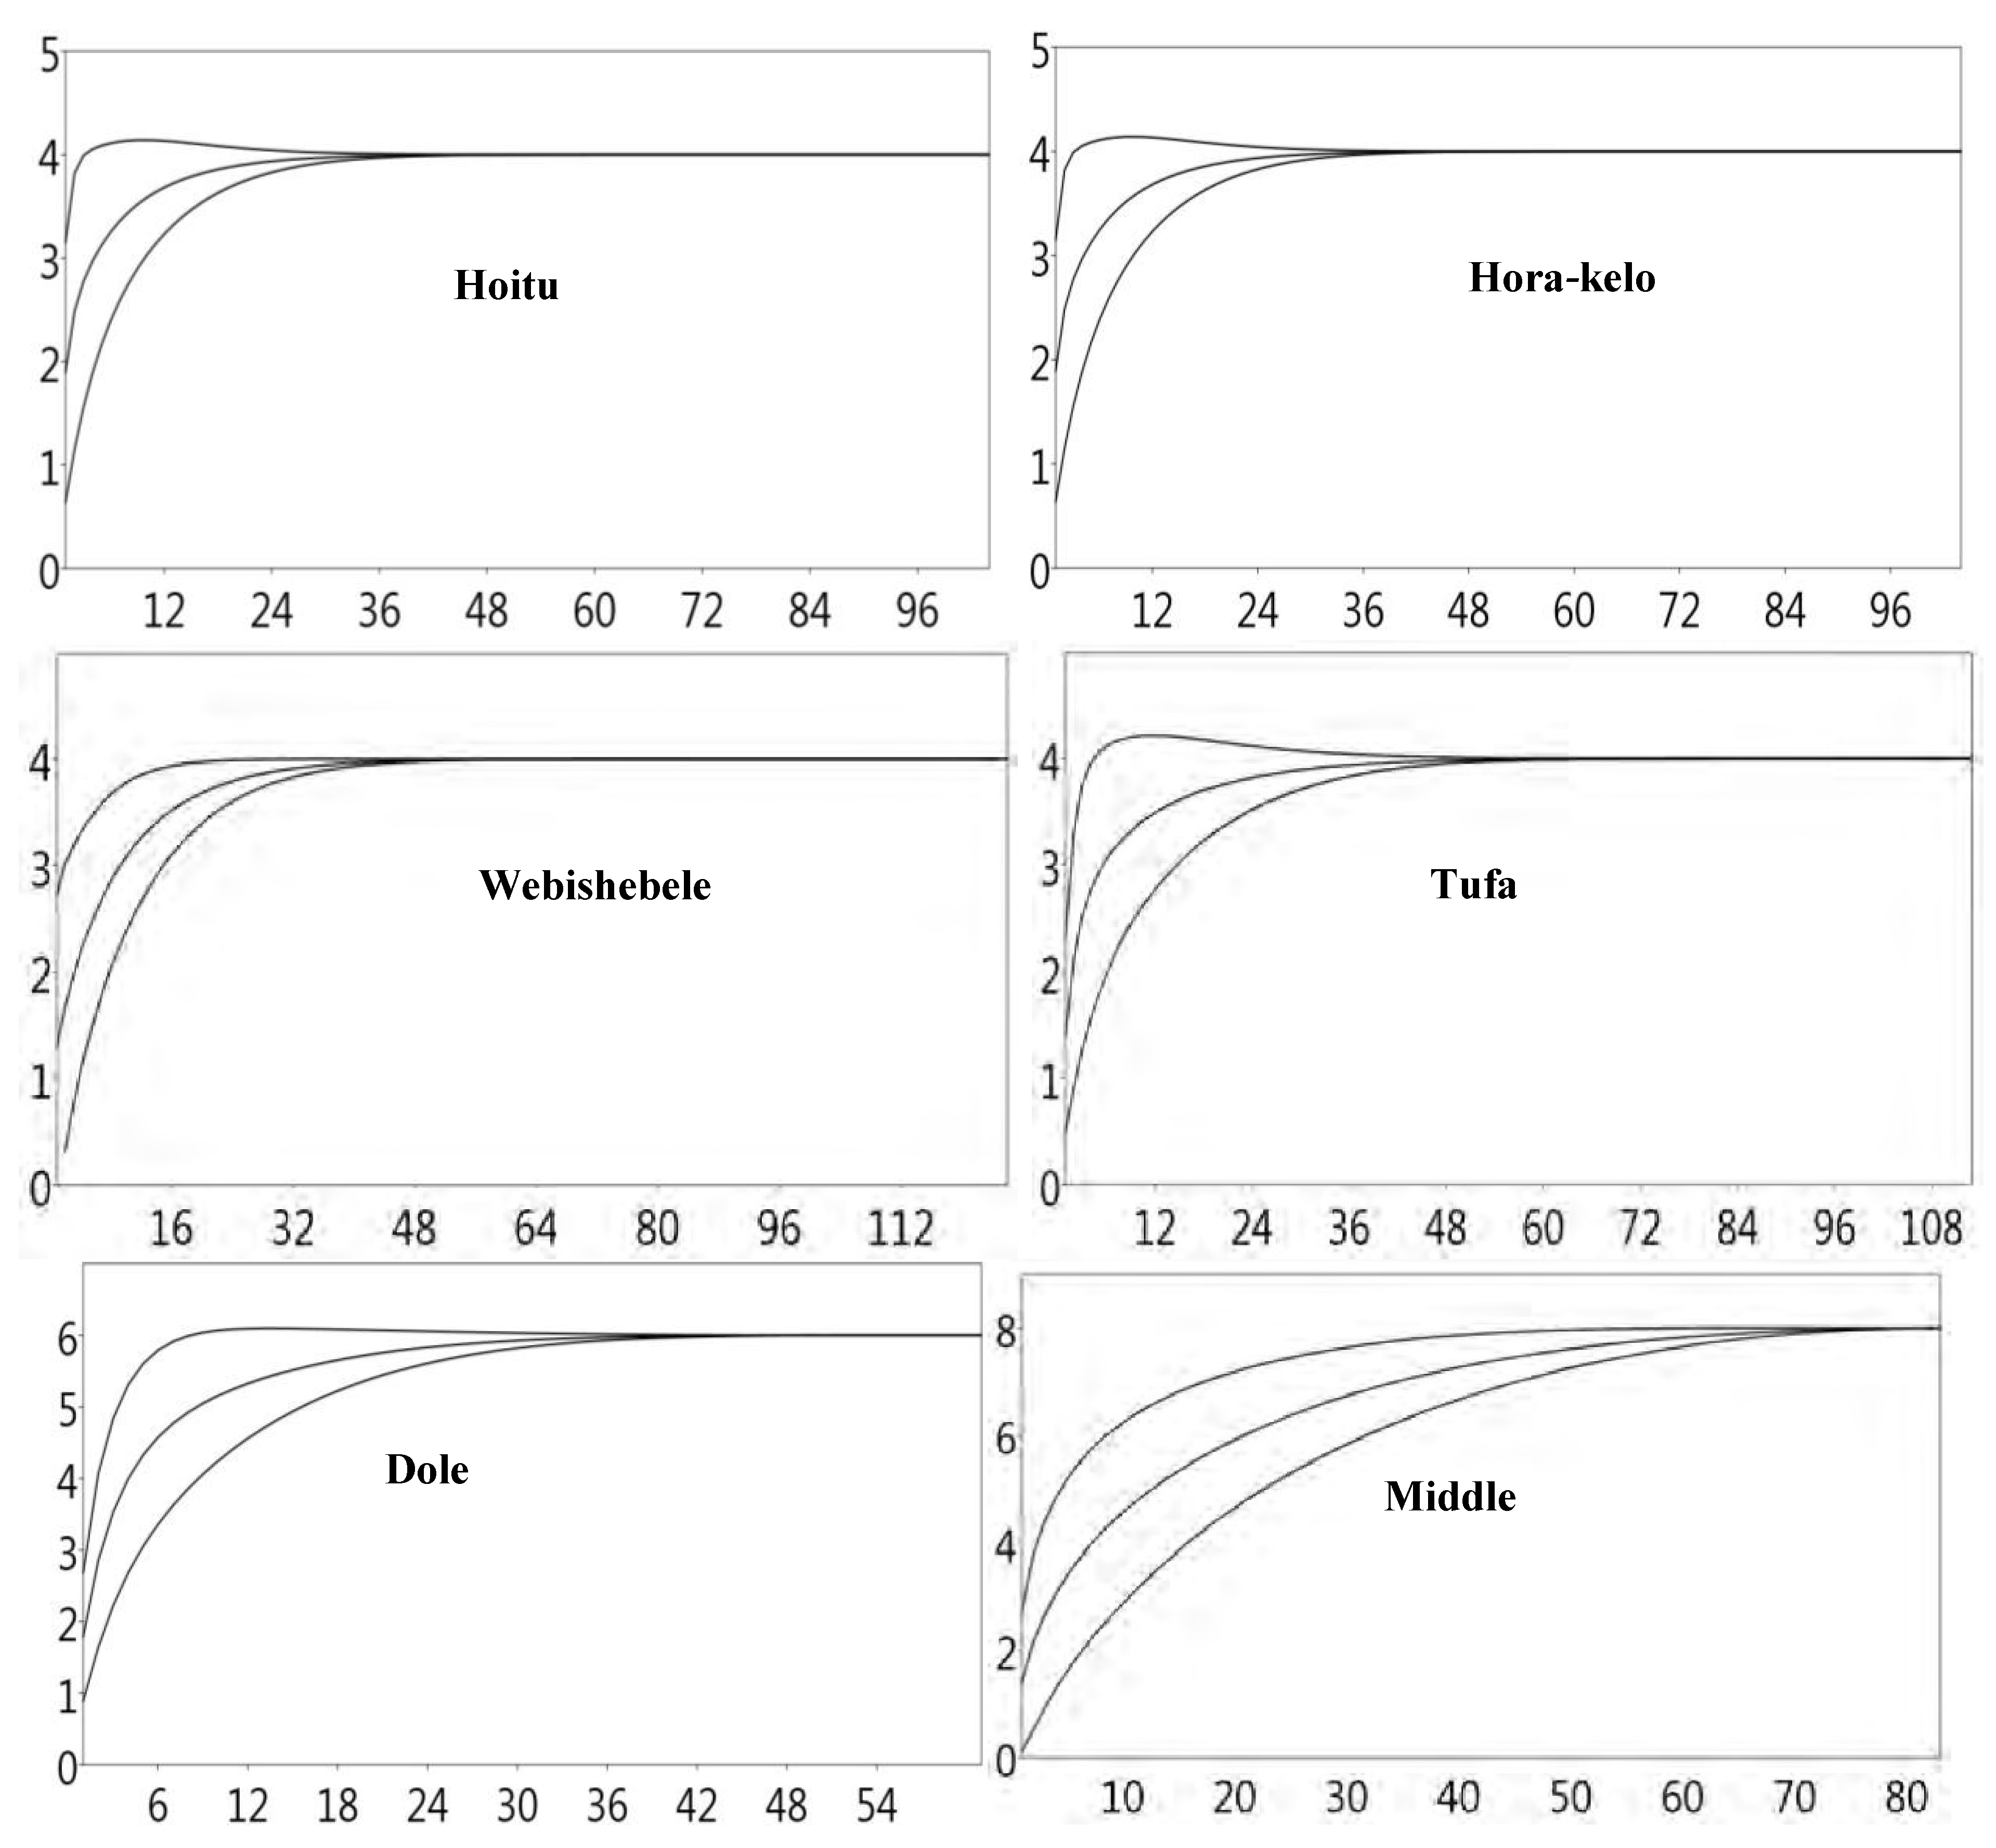
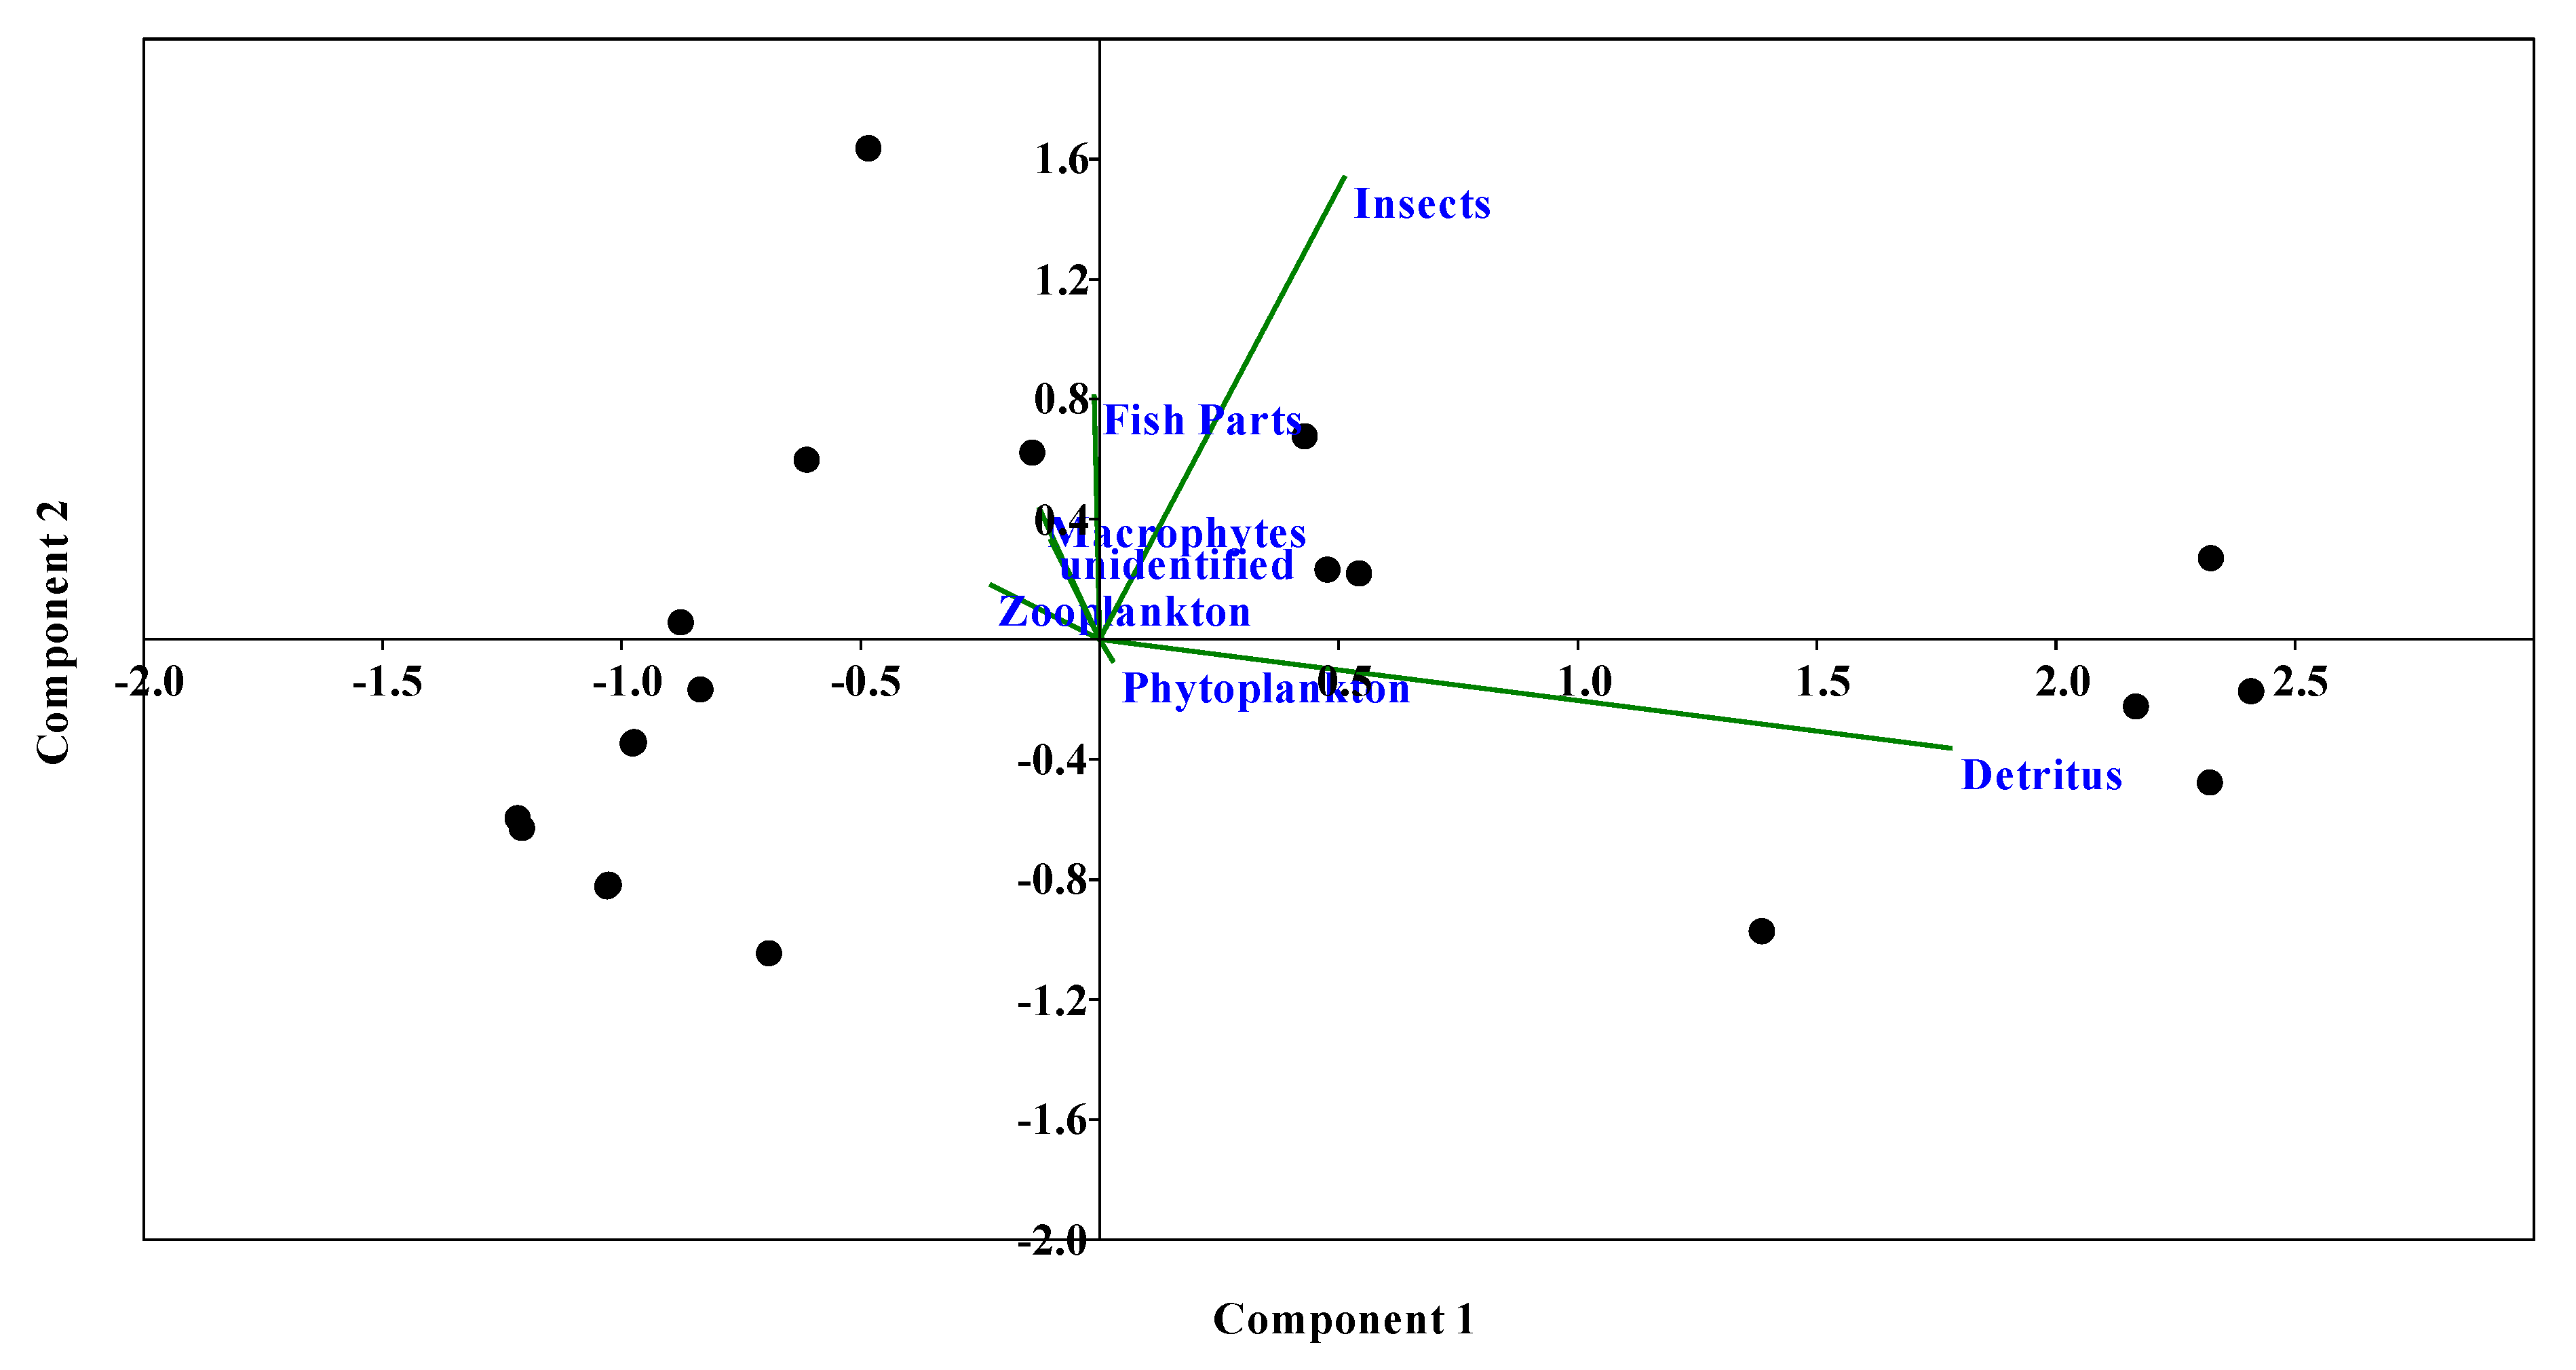
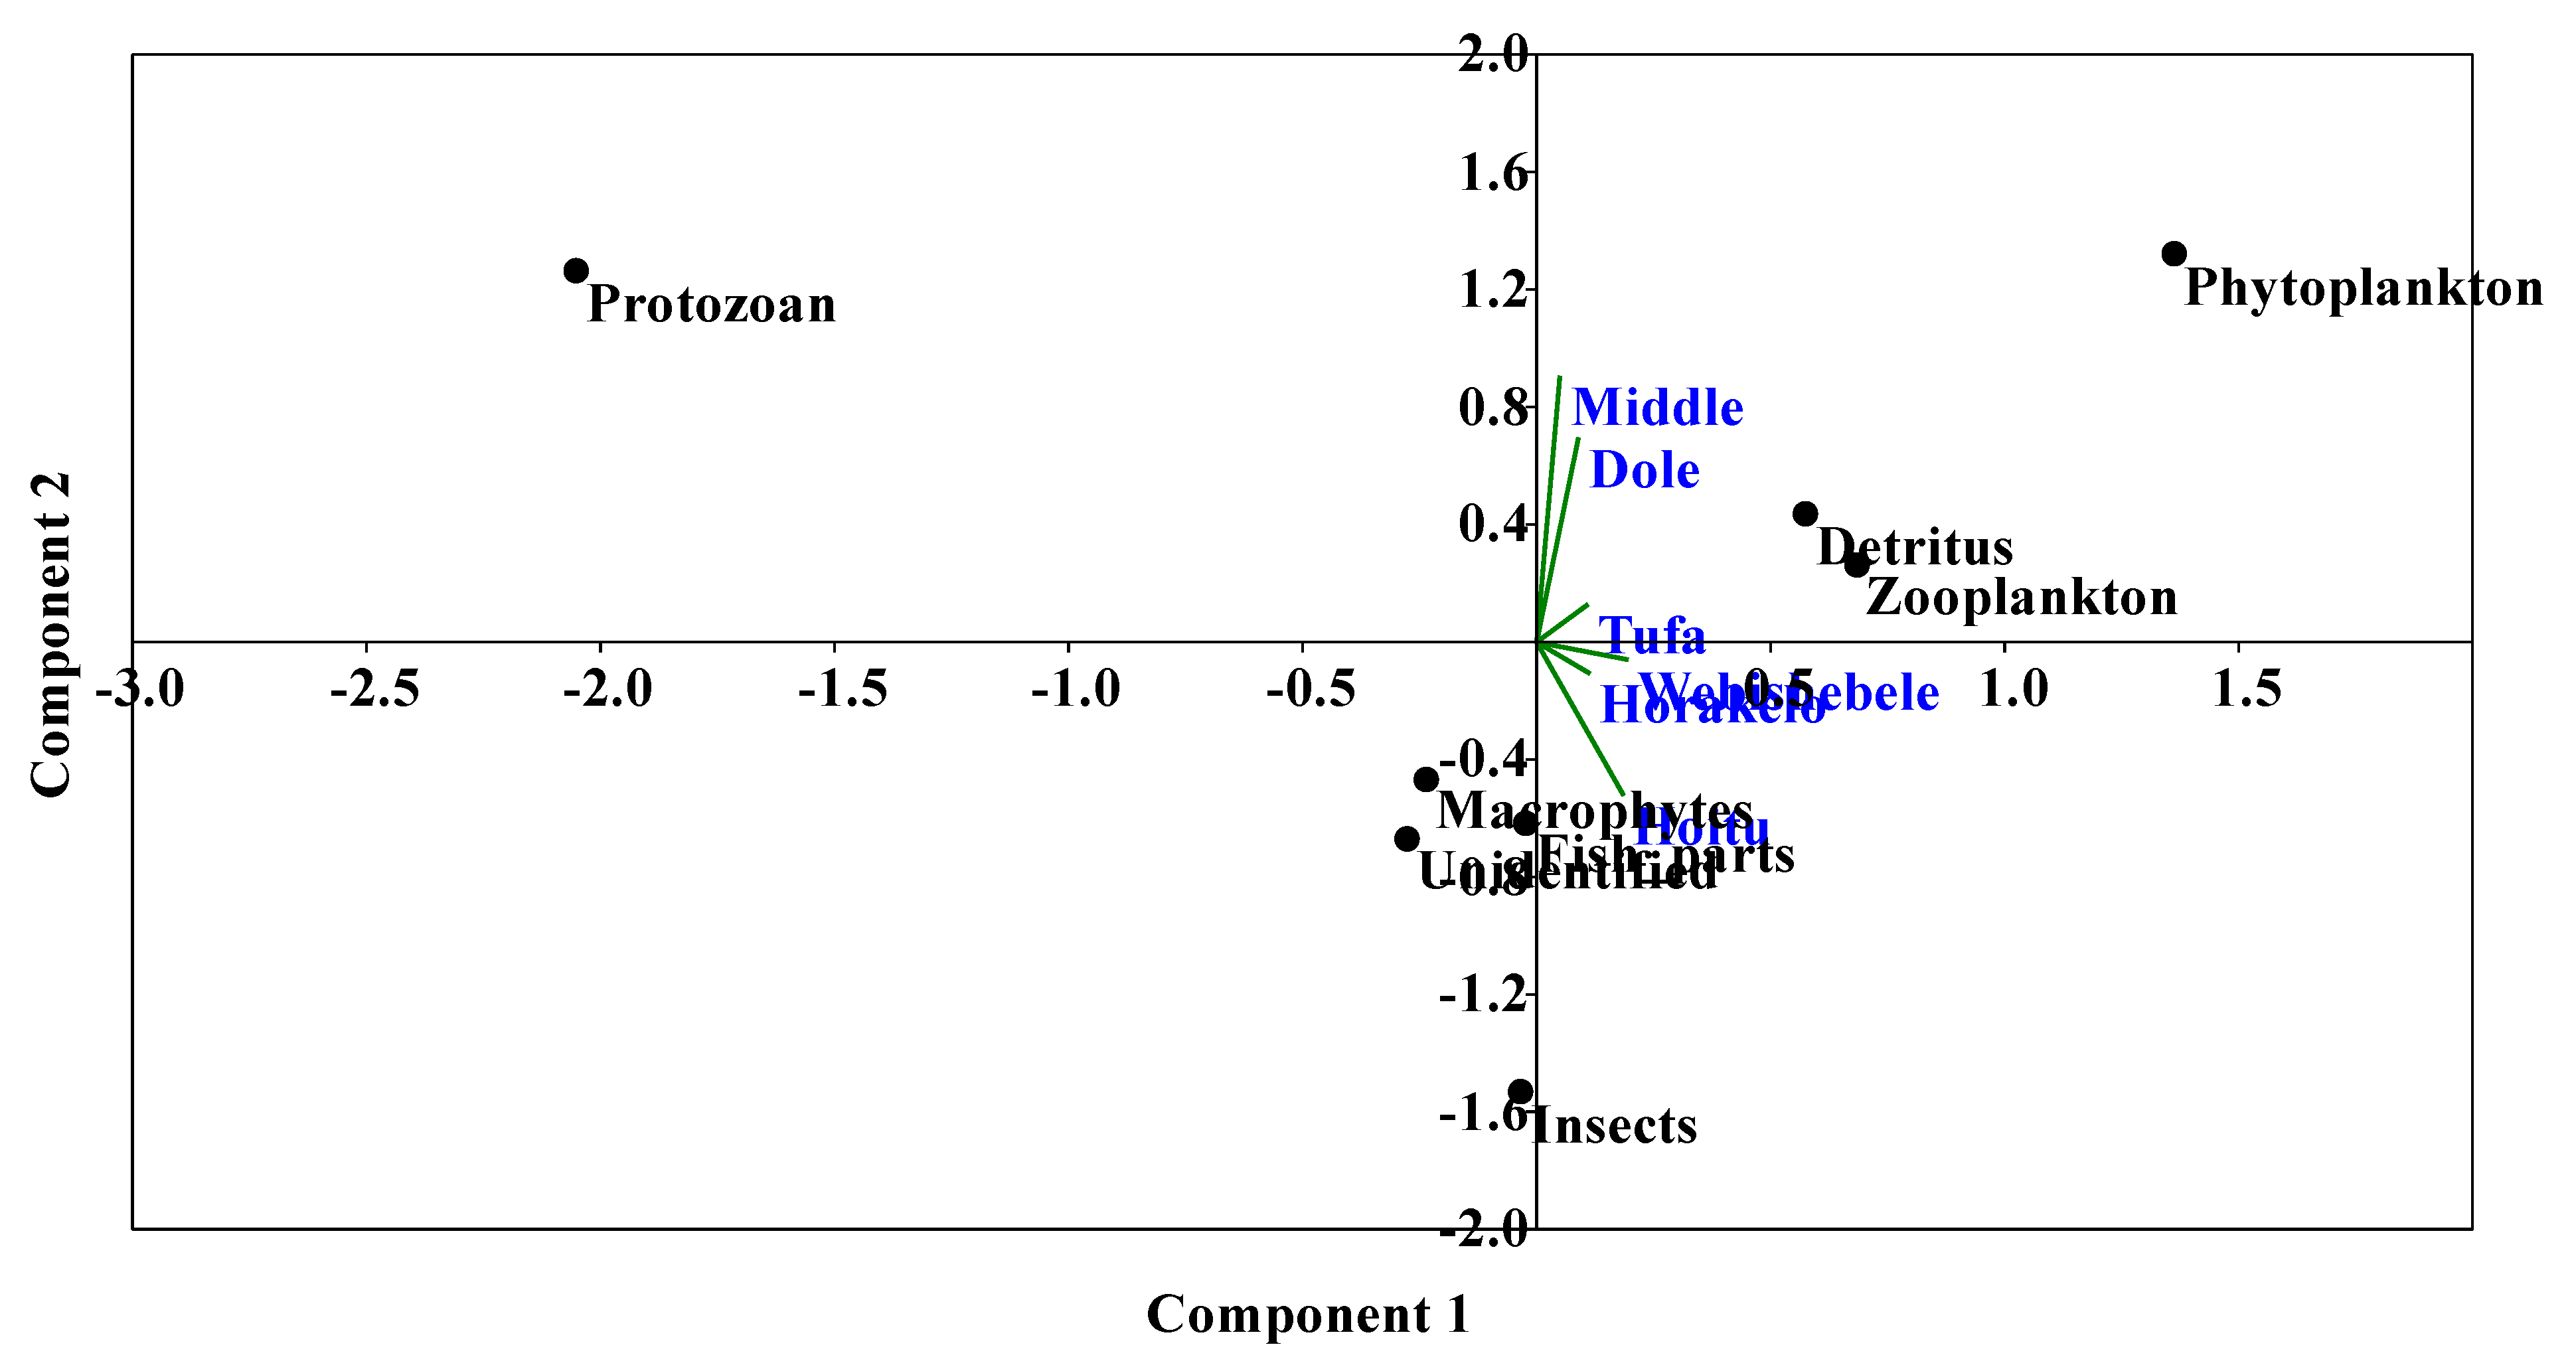
3.3. Variation of Food Composition with the Study Sites

The log-ratio principal component analysis (PCA) for site-based food composition in the diet of O. niloticus is indicated in Figure 4. Prey composition varied highly on Axis 1 and Axis 2, which together accounted for 96.47% of the total variance (Table 4).
All of the prey were positively correlated on the first axis and the correlation of prey items with the study sites was weak (r < 0.50), except for Hoitu and Webishebele sites, and statistically insignificant (permutation test, p = 0.074 at 0.01) (Table 4).

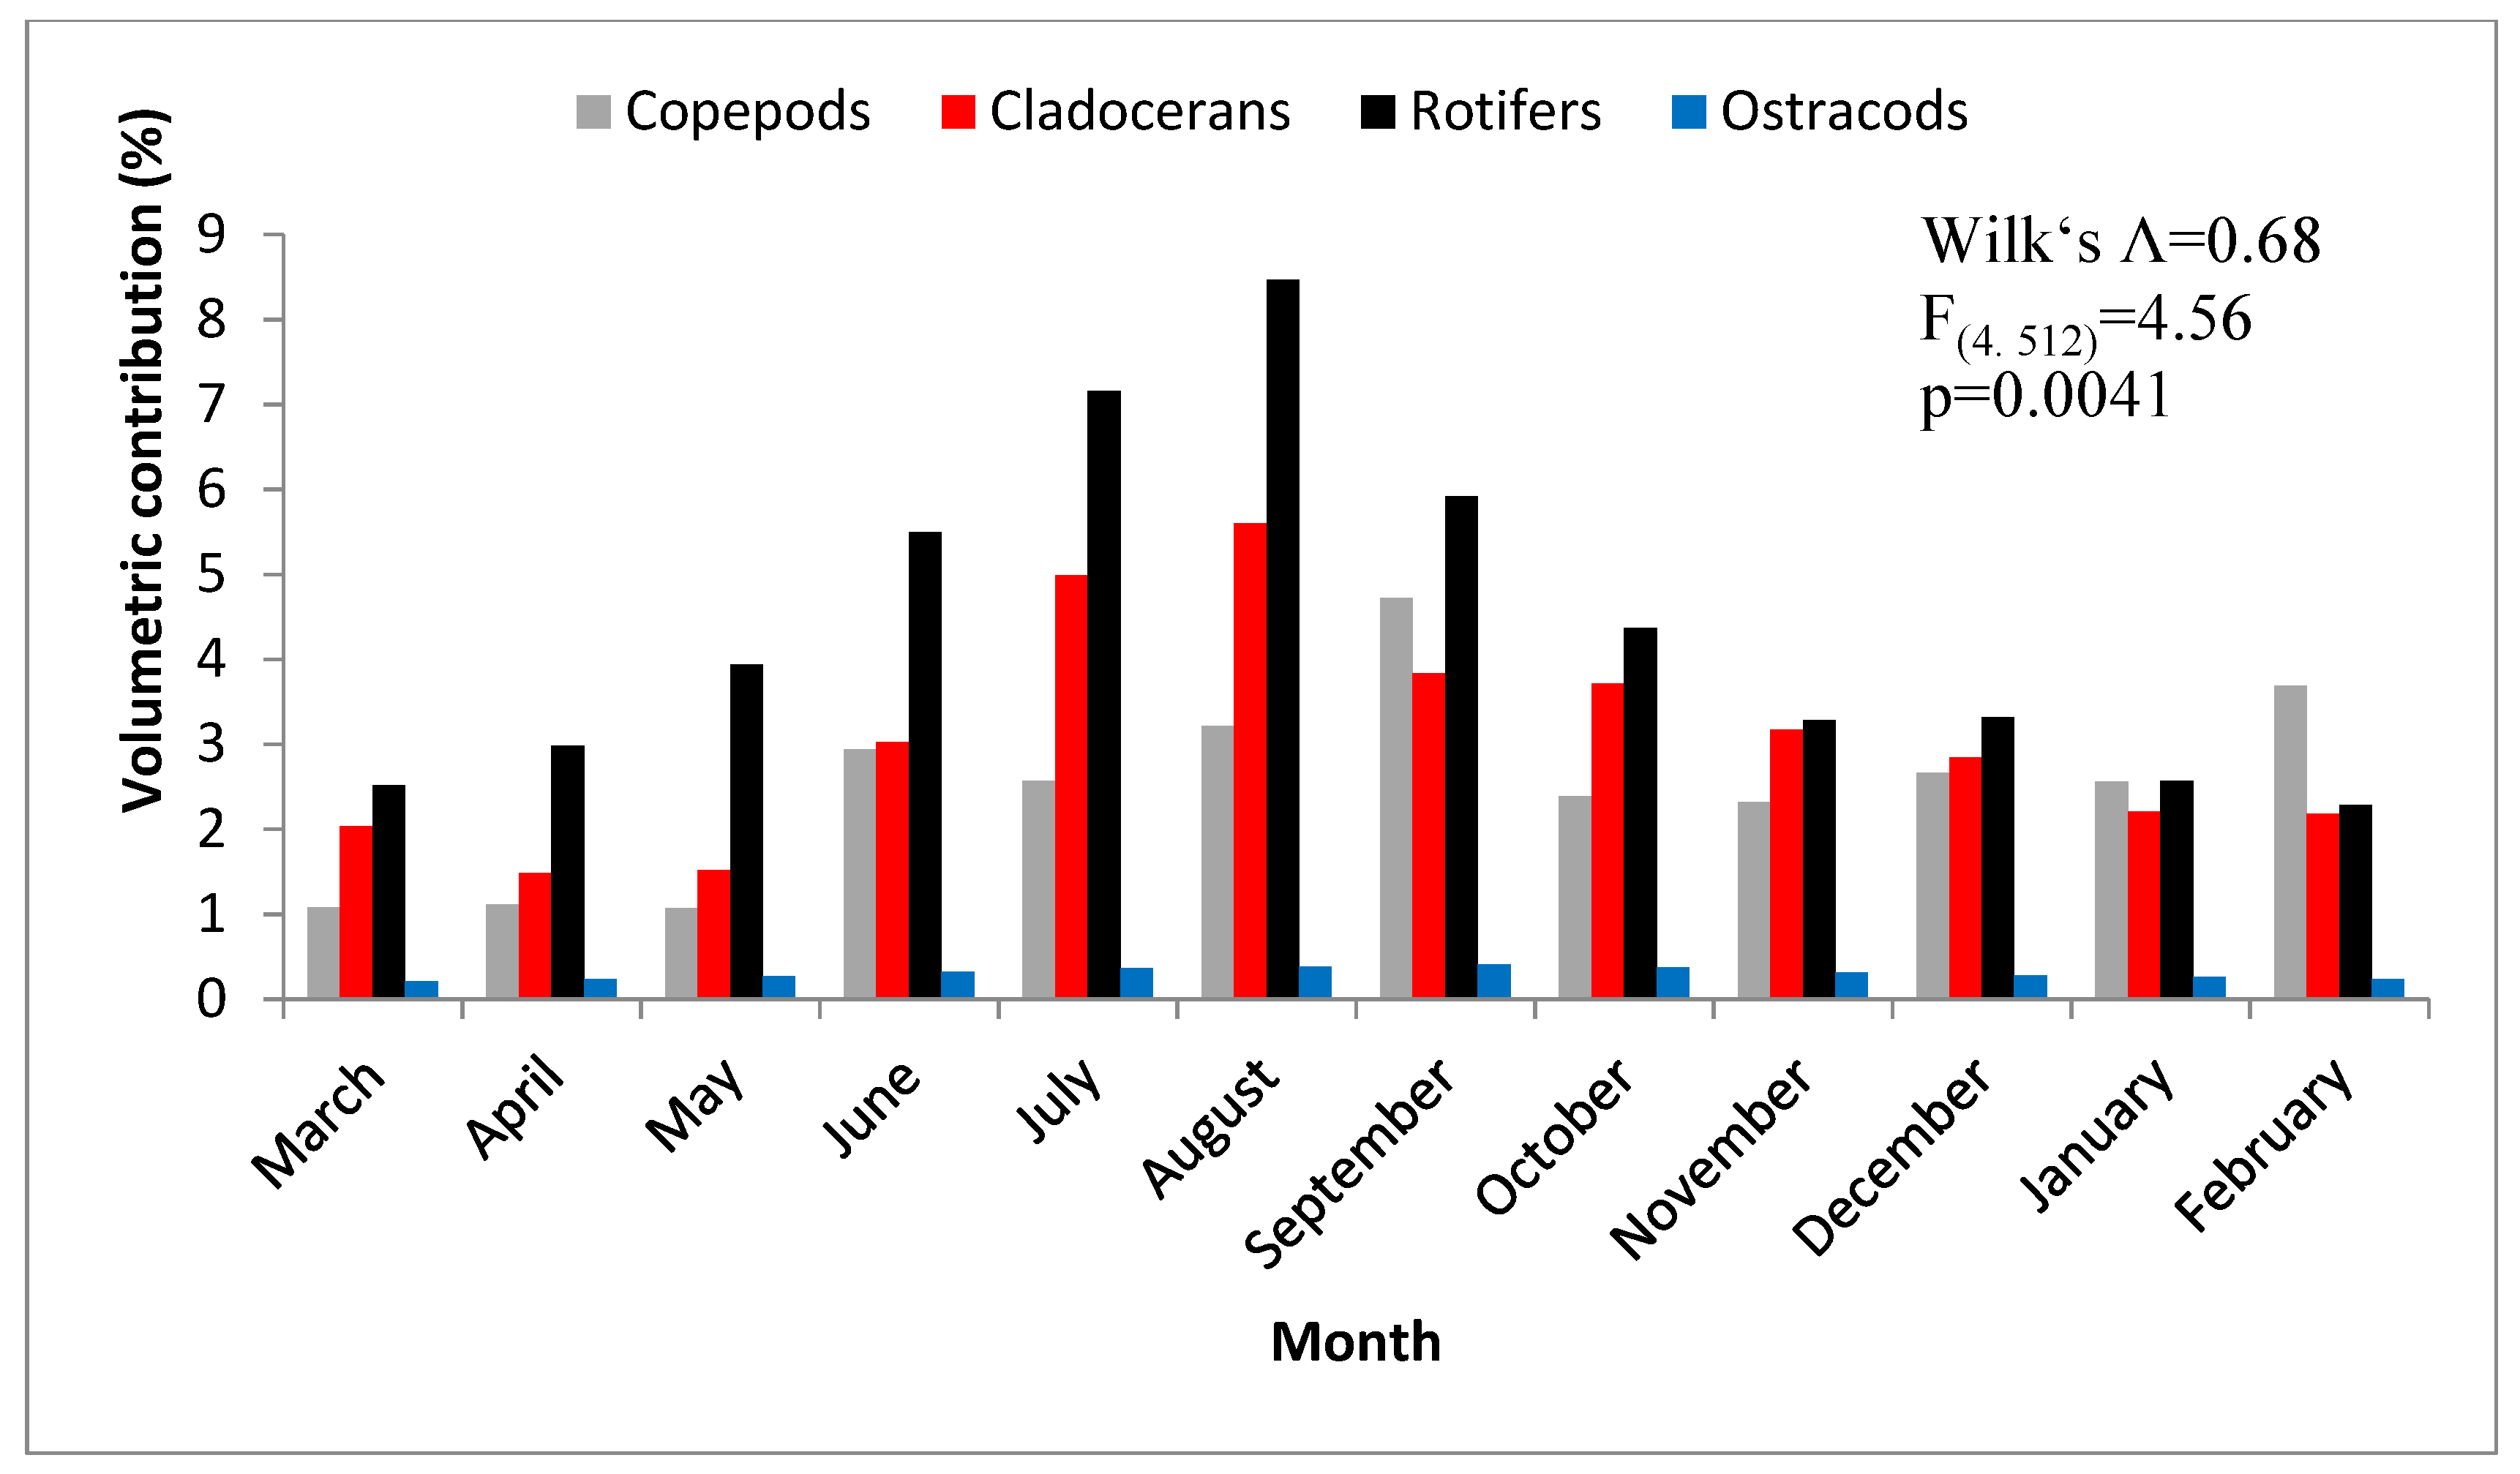
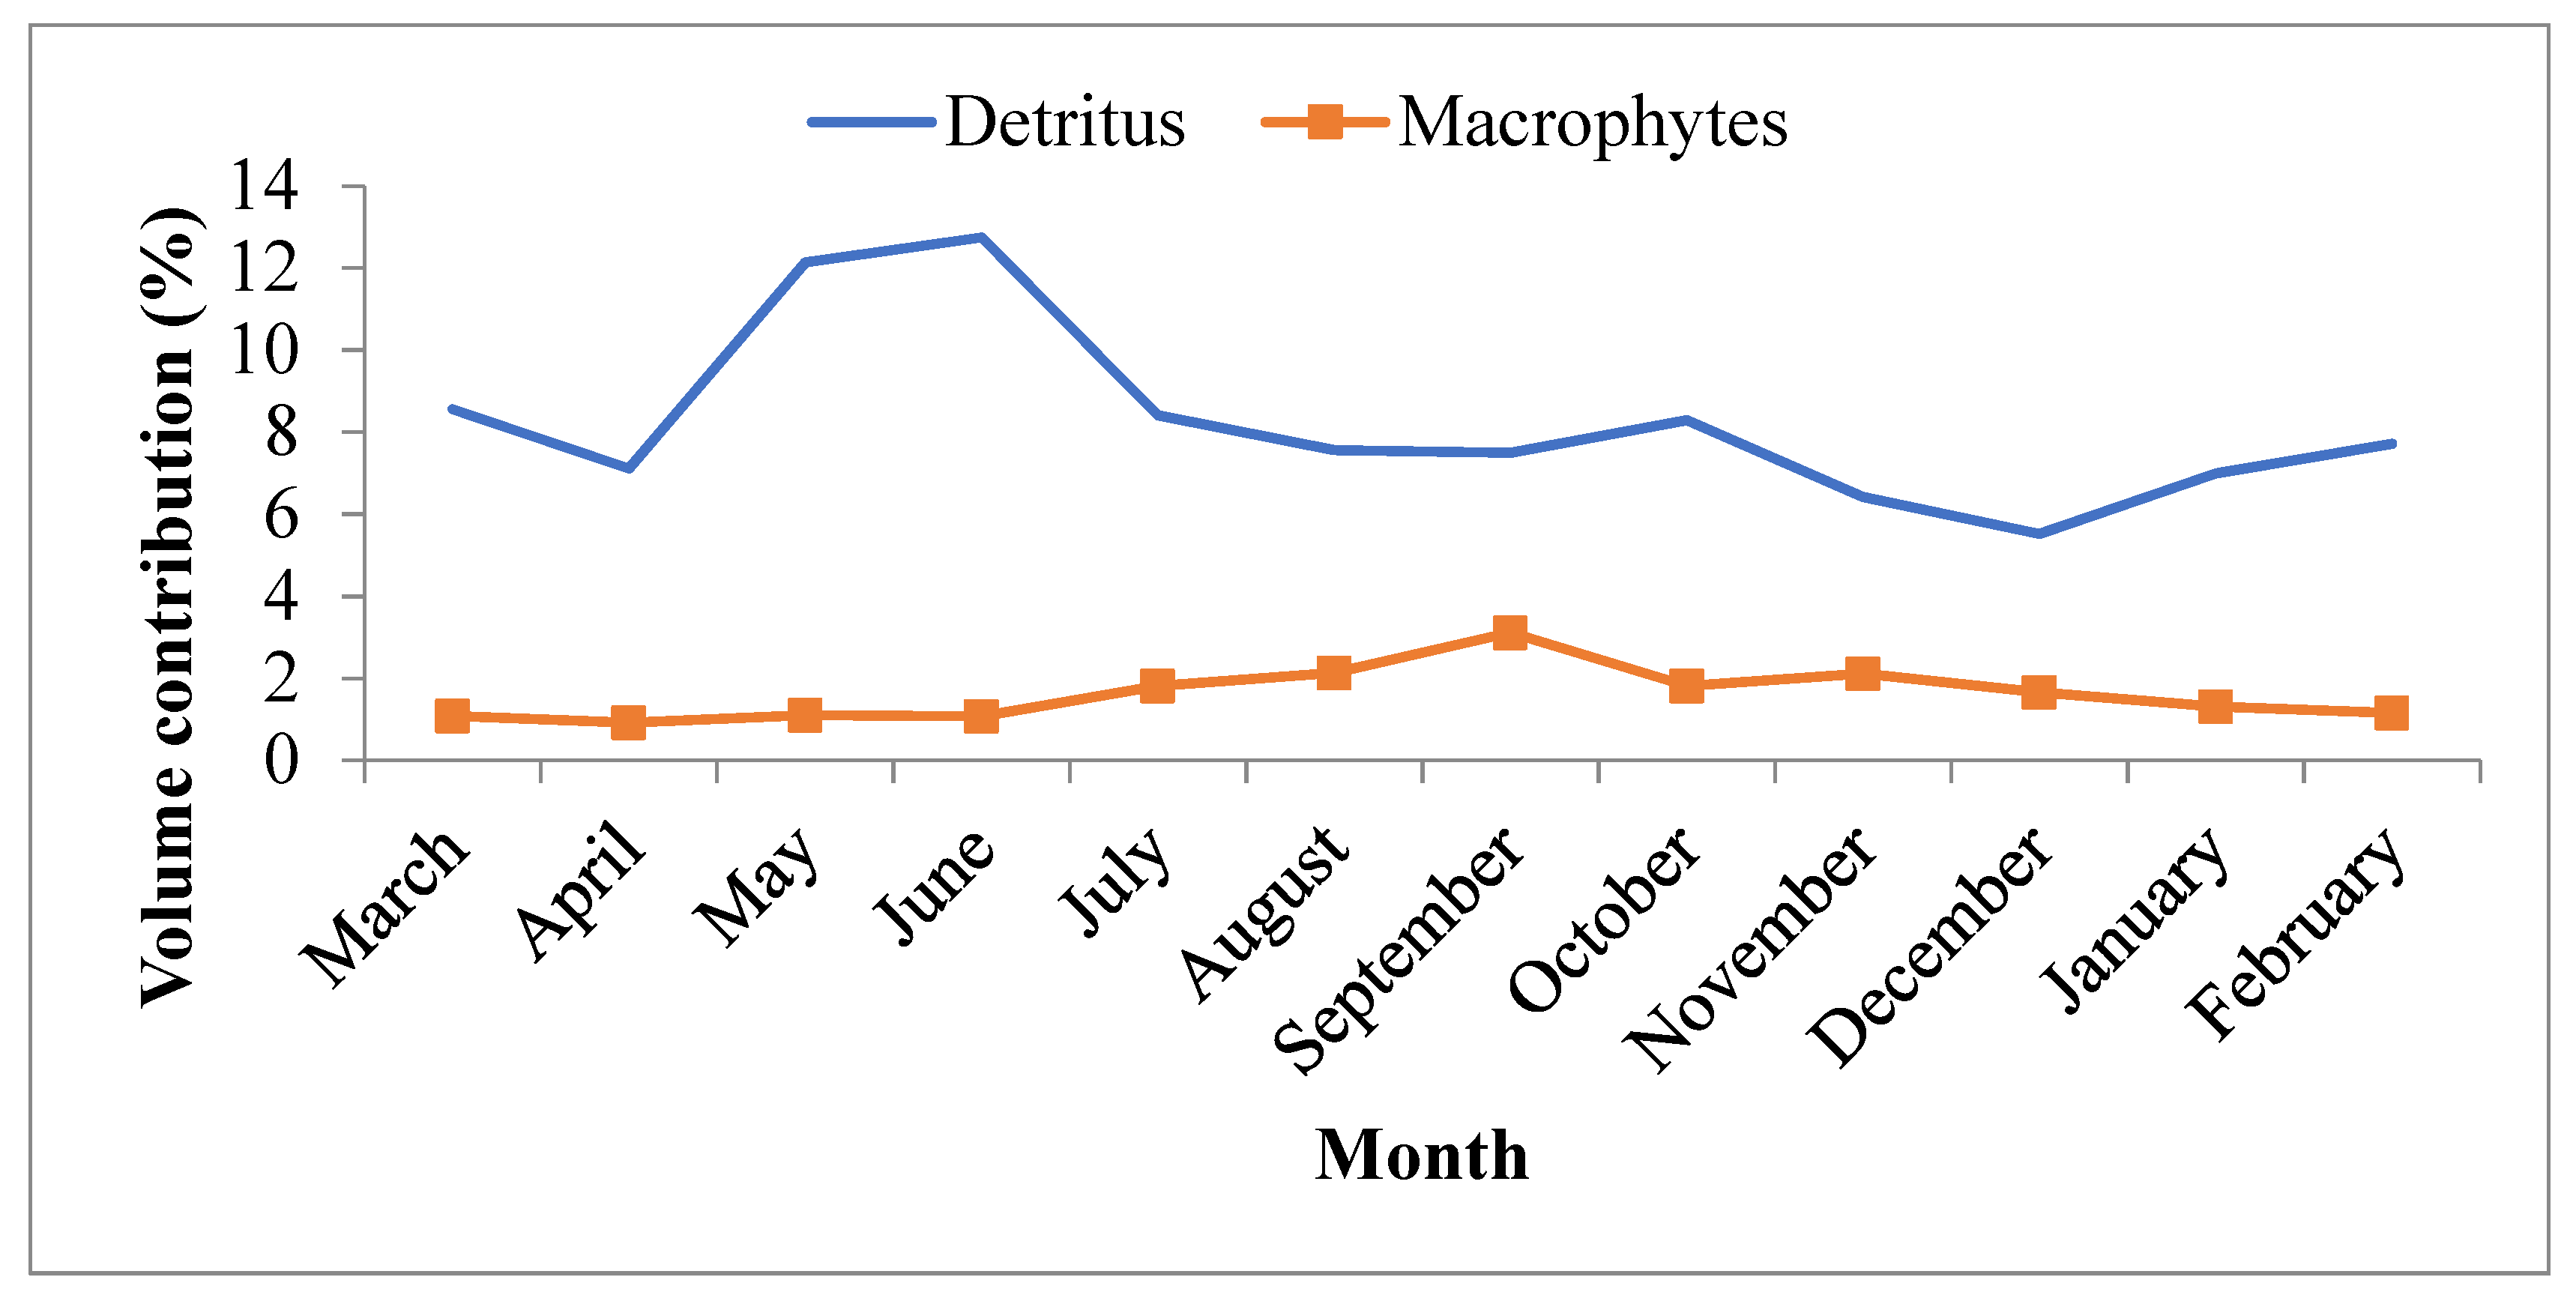
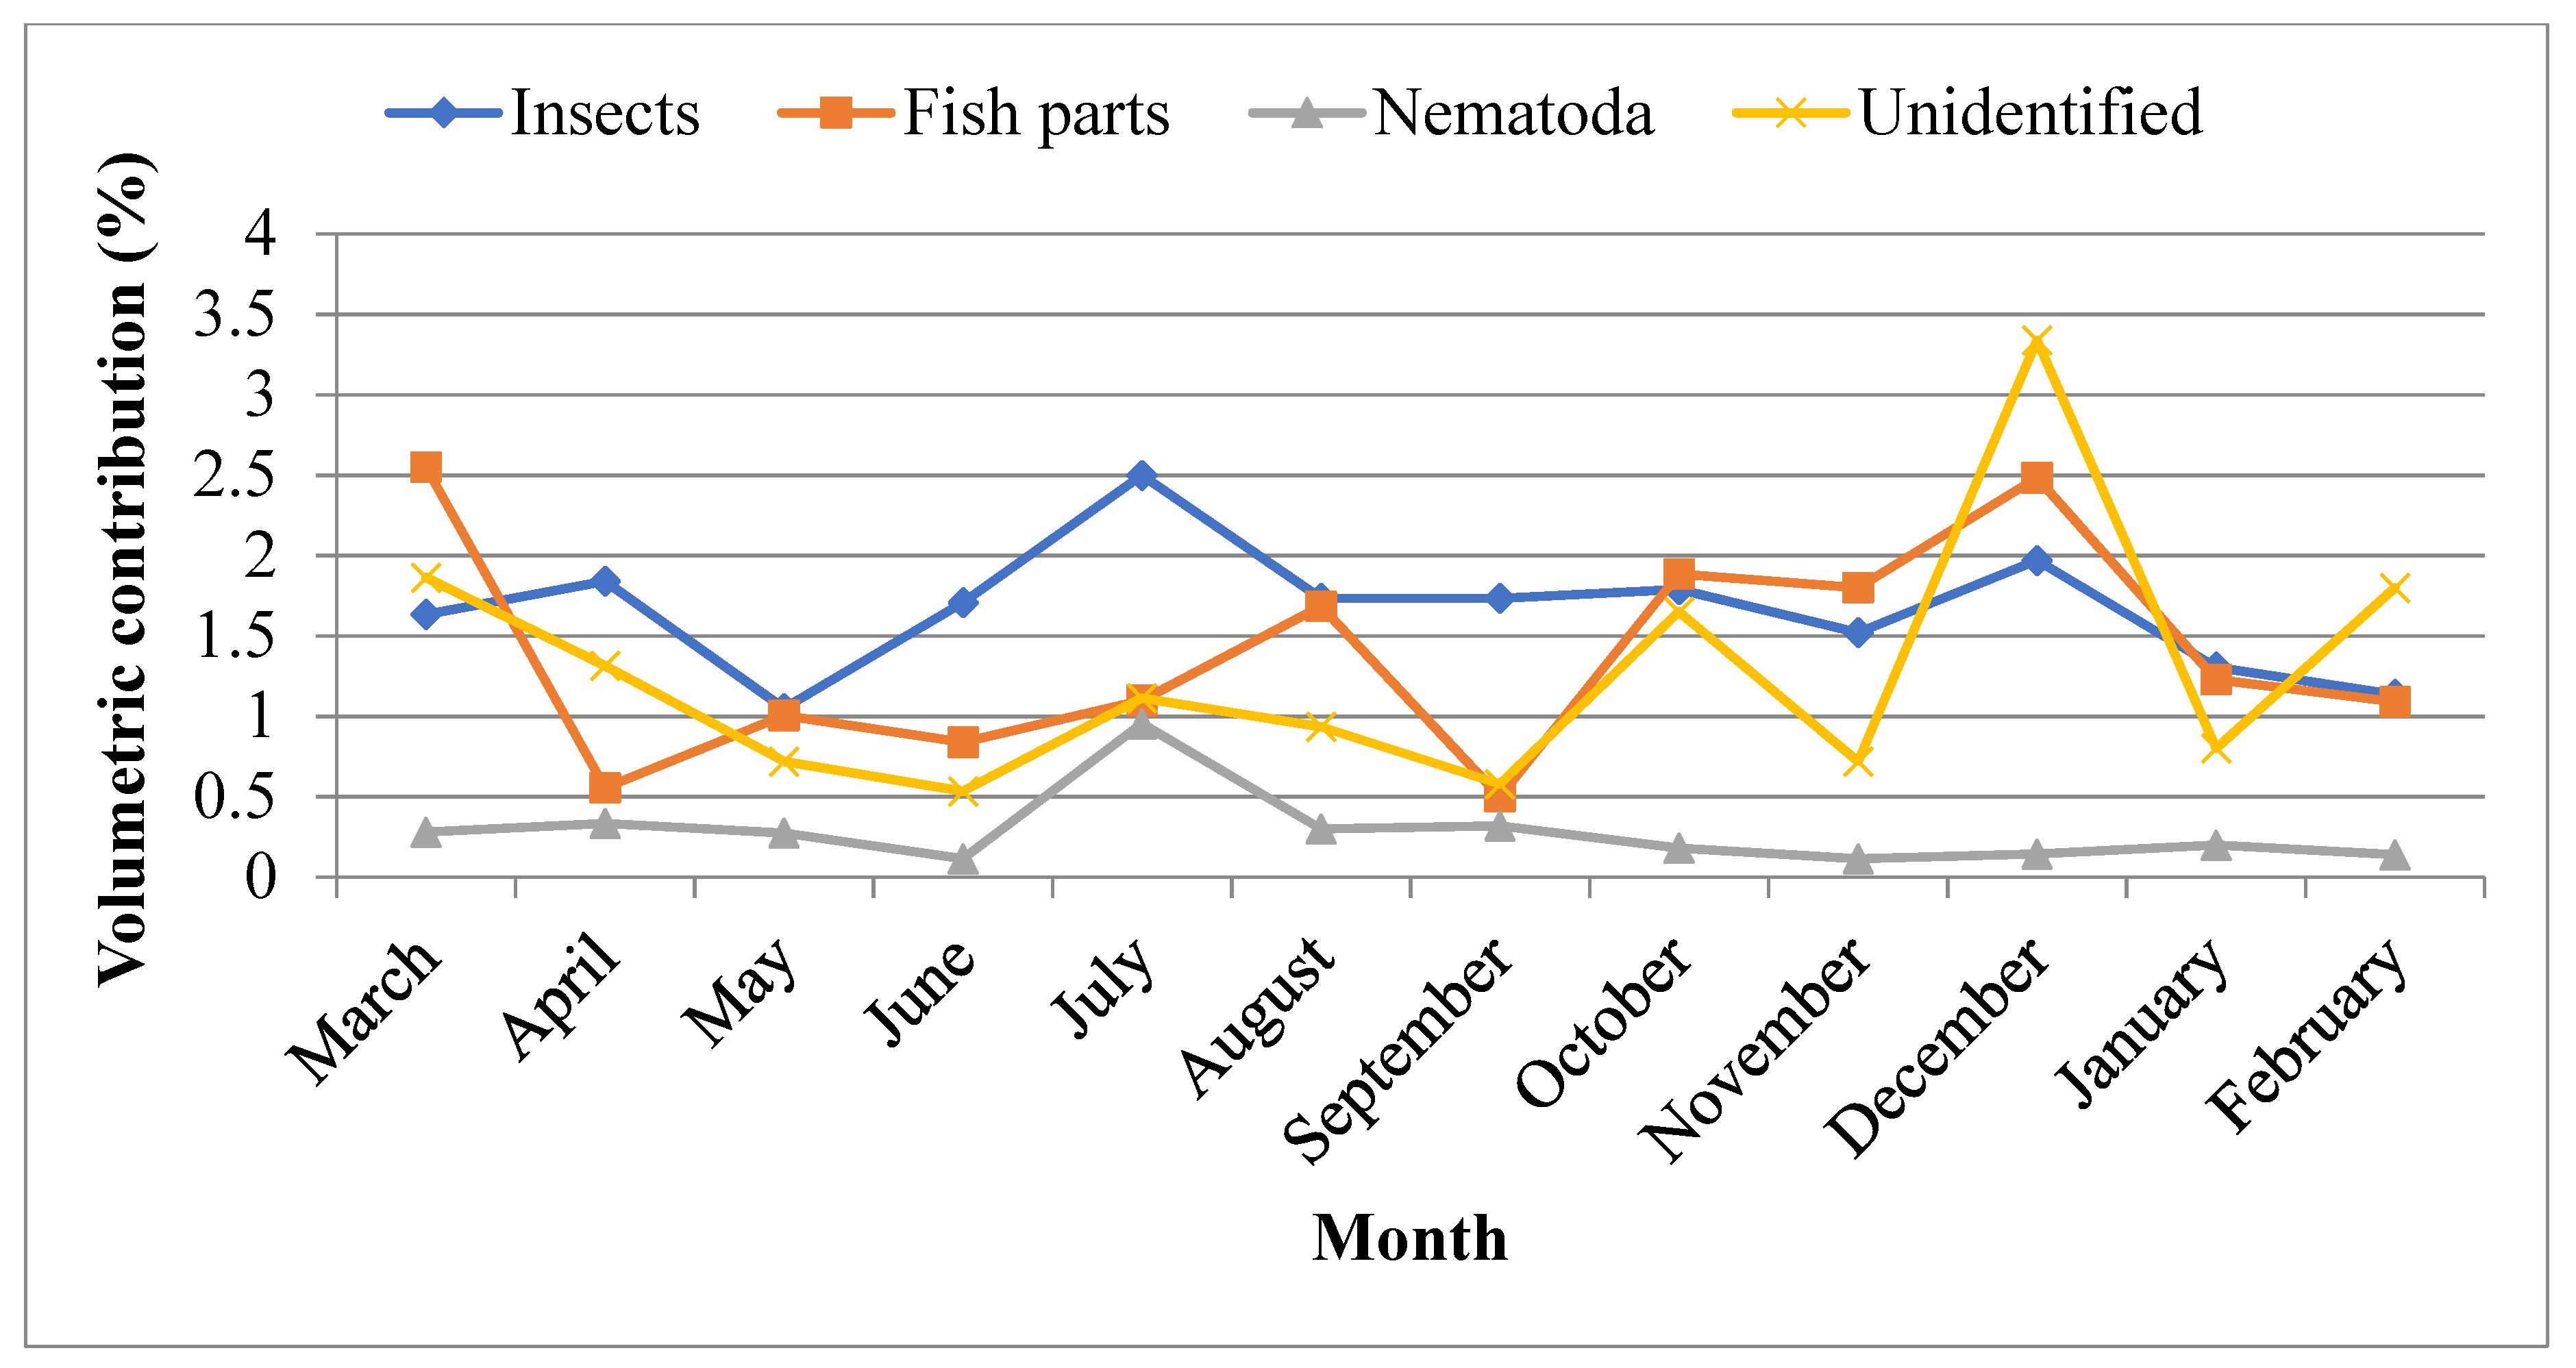
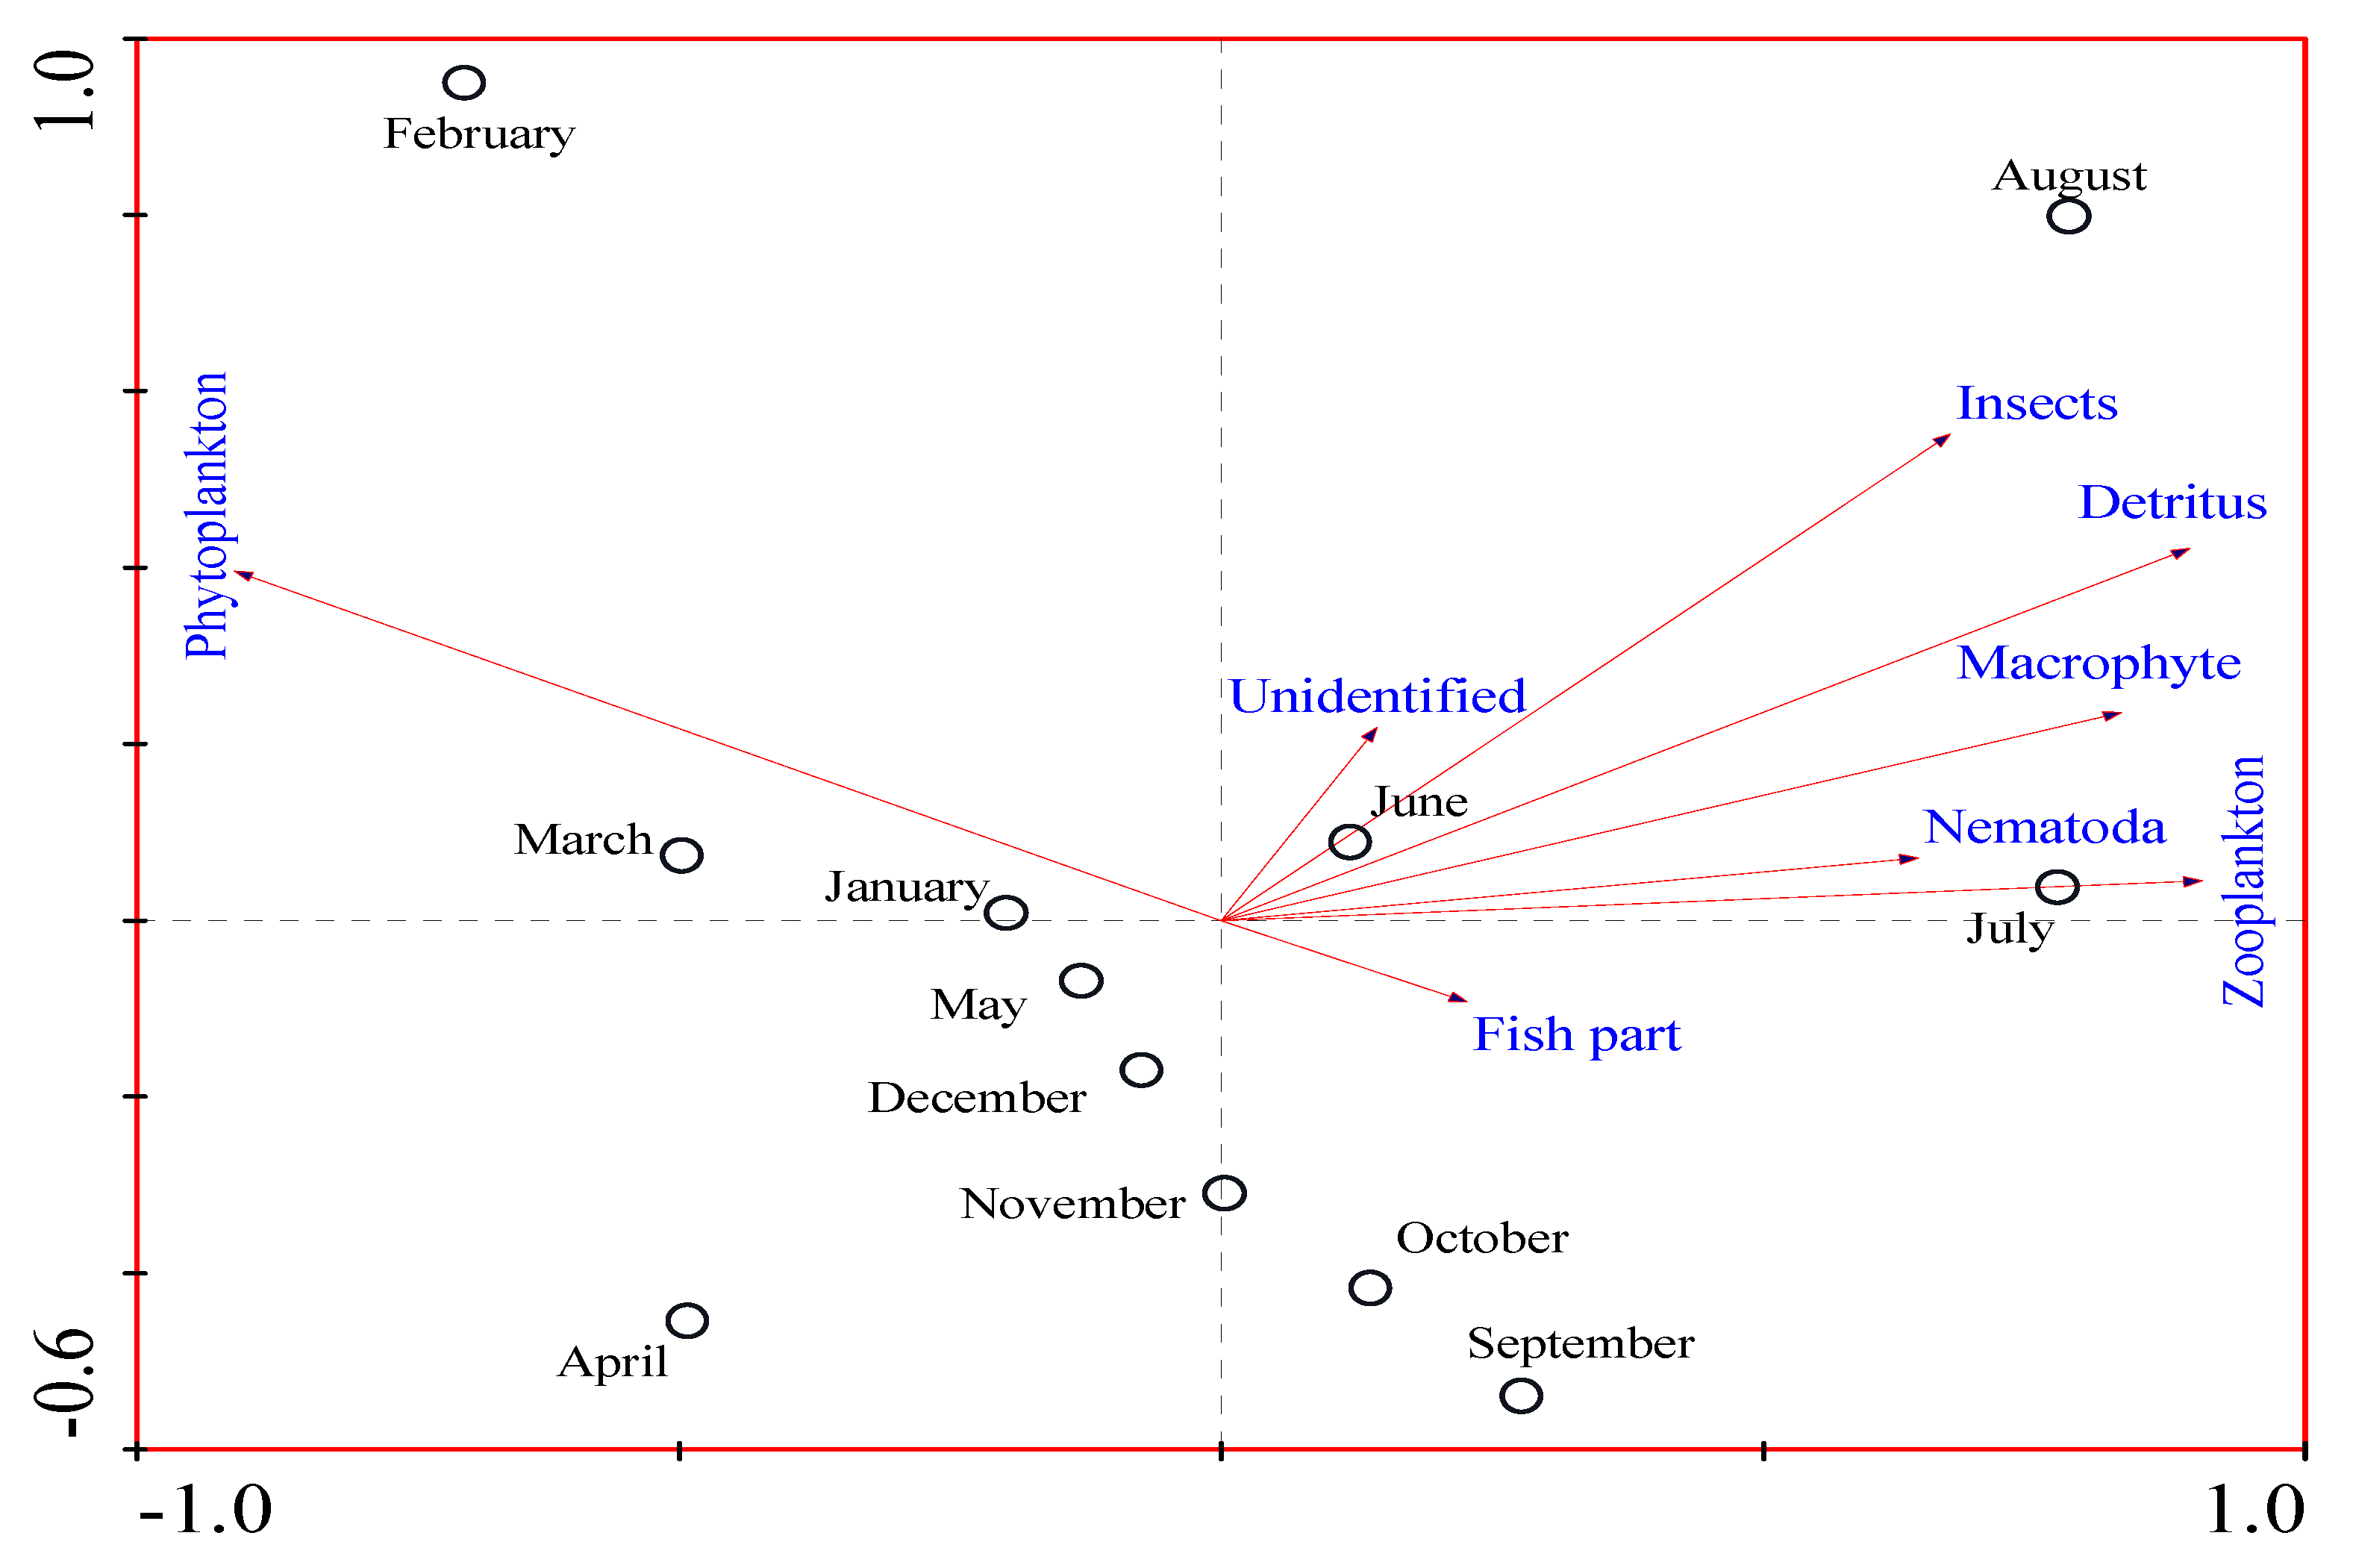
3.4. Seasonal Variation in the Food Composition of O. niloticus in Lake Langeno

The log-ratio principal component analysis (PCA) for the seasonal prey composition in the food of O. niloticus is indicated in Figure 5. Prey composition varied largely on Axis 1 and Axis 2, which together accounted for 88.42% of the total variance (Table 5). Except for phytoplankton, all of the prey items were positively correlated with the first axis, while the correlations of zooplankton, detritus, aquatic insect larvae and macrophytes with the months were very strong (r > 0.80) and statistically significant (permutation test, p = 0.021).
August, June and July were the months highly associated with all prey items on this axis, which contributed 80.45% of the total variance (Table 5). However, phytoplankton was negatively correlated with Axis 1, which also showed a negative correlation with these months (r = −0.90; permutation test, p = 0.001). Similarly, all of the prey items except for fish parts were positively correlated with the second axis, which contributed 7.97% of the total variance on the axis. Months such as February, March and January had a high positive correlation with a heavy load on phytoplankton prey composition on this axis (r = 0.79; permutation test, p = 0.0012). Generally, the log-ratio of PCA depicted high seasonal variation of food composition as most of thefish tended to feed on the highly abundant food items in the lake (permutation test, p = 0.002).
The abundance and volumetric contribution of phytoplankton were highest in the dry season. Blue-green algae (Microcystis spp. and Chroococcus spp.) and diatoms (Bacillariophyta (Cyclotella spp.)) dominated the stomach content of fish in the dry season (November to May), whereas Chlorophyta (green algae, mainly Oocystis spp.) and Euglenophyta (mainly Trachelomonas spp.) had taken the largest stomach volume in the wet season (June to October) (Figure 6A,B). The results indicate a significant seasonal variation of phytoplankton composition in fish stomachs (Wilk’s Λ = 0.4; F(9, 512) = 14.86, p = 0.006).
Similarly, the contribution of zooplankton in the food of O. niloticus was highest in the wet season and lowest in the dry season, which also showed a significant seasonal variation (p = 0.0041) (Figure 7).
Though the contribution of detritus in the food of O. niloticus was year-round, relatively, the highest contribution was observed in months with the highest rainfall (May to July), which was statistically significant (Wilk’s Λ = 0.42; F(12, 512) =10.06, p = 0.013 at 0.01). The composition of macrophytes in fish stomachs was also highest from July to September (Figure 8) and the composition showed a significant seasonal variation (Wilk’s Λ = 0.47; F(12, 512) = 12.26; p < 0.0082 at 0.01).
Insects, nematodes and fish parts were observed only in a few stomachs and their volumetric contribution was also very low. Relatively, their volumetric contribution in the food composition was highest in the wet season (Figure 9). However, the result did not show a significant seasonal variation (Wilk’s Λ = 0.997; F(12, 512) = 0.23, p = 0.028 for insects’ prey; Wilk’s Λ = 0.80; F (12,512) = 2.373, p = 0.025 for nematodes and Wilk’s Λ = 0.81; F (12, 512) = 2.47, p = 0.021 for fish parts’ composition in the studied stomachs at 0.01).

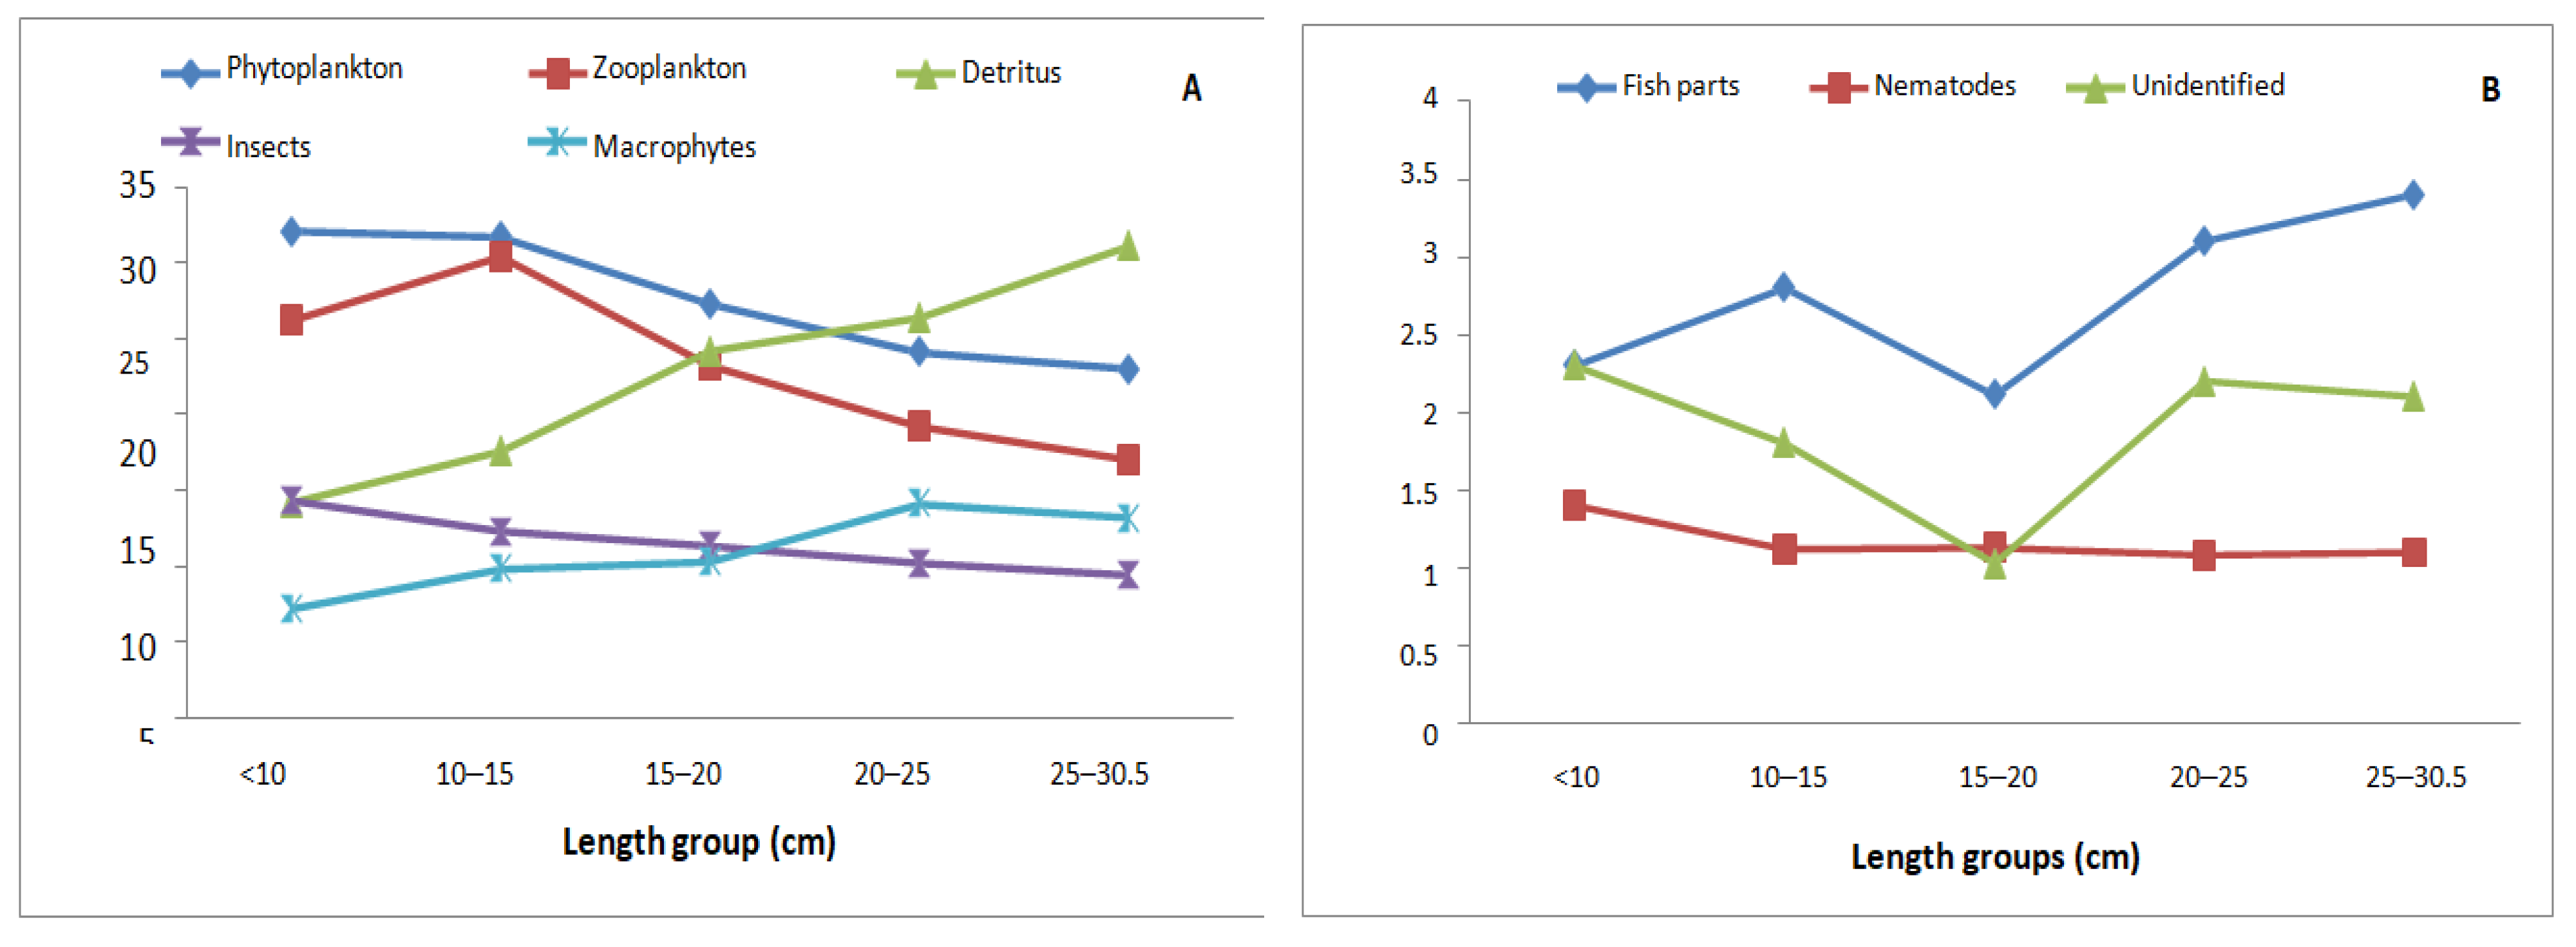
3.5. Variation of Food Composition with Fish Size

Of the 512 assessed fish, about 5.8% (n = 30) had <10 cm TL, 25.7% (n = 131) had 10–15 cm TL, 22.2% (n = 114) had 15–20 cm TL, 30.1% (n = 154) had 20–25 cm TL and 16.1% (n = 82) had >25 cm TL. For the length group < 10 cm, the contribution of phytoplankton (32.1%), zooplankton (26.2%) and insects (14.3%) were highest. However, the contribution of these prey items decreased by 23%, 17% and 9.4% as the total length increased to 30.5 cm. For the length group 20–25 cm TL and above, the composition of detritus (31.1%), macrophytes (13.2%) and fish parts (3.4%) were very high in the studied stomachs (Figure 10A,B).
The relationship between food composition and length variation of fish was linear and the regression model was best fitted for phytoplankton (r2 =0.94), zooplankton (r2 = 0.76), detritus (r2 = 0.98), insect prey (r2 = 0.96) and macrophytes (r2 = 0.86). The result showed a significant correlation of phytoplankton (r = −0.97; t(1,4) = −7.76; p = 0.006), zooplankton (r = −0.87; t(5, 512) = 3.02, p = 0.001), detritus (r = 0.99; t(5, 512) = 12.86, p =0.002), aquatic insect prey (r = −0.98; t(5, 512) = −9.62, p = 0.009) and macrophytes (r = 0.92; t(5, 512) = 4.34, p = 0.004) composition with the different length groups, but the relationship was not significant for fish parts (r = 0.51; t(5, 512) = 1.01, p = 0.046) and nematodes (r = 0.50; t(5, 512) = −1.03, p = 0.429) composition.

4. Discussion

4.1. Diet Composition

The number of stomach samples collected for this study was considered adequate to warrant dietary analysis as the graphs approached an asymptote in cumulative prey curves at all sites [34]. The stomach contents analysis indicated that O. niloticus is feeding on a variety of food categories in Lake Langeno, including food from plant origins, such as phytoplankton, macrophytes and detritus, as well as food from animal origin, such as zooplankton, insects, nematodes, fish parts (eggs and larvae) and ostracods (Table 2). The ingestion of insects, ostracods, nematodes, some fish parts and most genera of the algae groups identified in the present study was not reported by Tadesse [13]. The variation in diet composition is affected by many factors, such as season, spatial variation and ontogenetic dietary shift of fish [39]. Availability, composition and abundance of the prey items also determine the dietary composition of fish [40].
The high abundance of phytoplankton in this study (Table 2 and Table 3) is in agreement with that of Tadesse [13] from the same lake, while similar findings have been reported in Gilgel Gibe I Reservoir [41], Koka Reservoir [14], Lake Hayq [15] and Omo-Turkana Basin [42]. A logical explanation for the high abundance in stomach contents of this fish is the high availability of these food items in tropical lakes [43]. Similarly, several authors have reported the high abundance of detritus in the diet of O. niloticus in different parts of Ethiopia following phytoplankton [14,15]. The variation could, however, emphasize the opportunistic feeding behavior of O. niloticus, which depends on the availability of preyandseasonal and spatial differences of food distribution [10].
The high prevalence of Microcystis spp. in the diet of O. niloticus in our study agrees with findings from Koka Reservoir [14] and Lake Hayq [15]. Yet, the dominance of Botryococcus (green algae) and Oscillatoria (blue-green algae) were reported in the food composition of the same fish in Lake Hawassa [44], Lyngbya (blue-green algae) in Lake Zeway [45] and Melosira (diatoms) in Lake Chamo [46]. The dominance of one food item over the other could be the result of the selective feeding behavior of fish to increase their nutritional benefits [47]. It would also result from differences in the availability of foods between lakes [14].
In addition, rotifers, cladocerans and copepods contributed an appreciable amount to the food composition of O. niloticus in Lake Langeno (Table 3). Tadesse [13] also reported the presence of rotifers and copepods in the food of O. niloticus in the same lake. However, cladocerans were absent in their report. According to Battarbee [48], cladocerans are zooplanktons that show seasonal variation in aquatic environments. Therefore, the emergence of cladocerans in this study could be attributed to the collection of samples in all seasons. Similarly, the studies carried out in some rift valley lakes, such as Lake Chamo [21], Lake Hawassa [44], Lake Zeway [45] and elsewhere [6], confirmed the high proportion of rotifers, cladocerans and copepods in the food of O. niloticus.
Not all prey items are equally important in the diets of the fish both at individual and species levels [42]. The relative importance of prey items at an individual level is indicated by the relative sizes of the arrows in %PCA [37], whereas identification of prey importance at specieslevel is based on discerning large discontinuities in the decreasing sequence of points of GIIi in the graph [33]. The present results indicate that the relative importance of dietary items was reasonably concurrent between the individual (Figure 2) and species-level importance of prey items (Figure 3). Prey items that were of primary importance at an individual-fish level were also of primary importance at a species level, which is very similar to the report of Wakjira [42] from Lower Omo River and the Ethiopian part of Lake Turkana. The %GII showed that phytoplankton is the primary consumed food item (Figure 4) by O. niloticus (about 64.3% of the total volume), which indicates the specialist feeding strategy, in agreement with Wakjira [42] and Engdawetal. [14].
The relative importance of prey items in different sites was also represented by the relative sizes of the arrows in %PCA (Figure 5). The result depicts a concurrence on the relative importance of all prey items at all of the study sites, where phytoplankton, detritus and zooplankton were relatively highly important prey in the diet of O. niloticus at all sites. This could be associated with the ecological homogeneity of the study sites in terms of food availability and food quality [15].

4.2. Seasonal Variation in the Diet of O. niloticus in Lake Langeno

The results of the present study showed a substantial seasonal variation in the food composition of O. niloticus (Table 4, Figure 2). For instance, the contribution of phytoplankton was highest in the stomachs of O. niloticus in the dry season (January to May) (Figure 3). The proportion of phytoplankton in the water was relatively low in the wet season due to high flooding from the catchment area, which can cause fluctuations in the water level and increase turbidity [49]. Turbidity decreases the penetration of sunlight and affects the growth and abundance of phytoplankton [50]. Some authors also confirmed the seasonal variation of phytoplankton in the food composition of O. niloticus in some rift valley lakes [14,20].
The proportion of zooplankton in the diet of O. niloticus was highest in the wet season (June to July) (Figure 4), which might have been due to the low water temperature of the season. According to Mergeay et al. [51], low water temperature is a prerequisite condition to the hatching of zooplankton. The seasonal flooding could also contribute to the high abundance of the zooplankton population in the wet season. The influent water is likely to bring in nutrients from the river and drain agricultural land and help in the mixing of autochthonous nutrients among the different strata of the lake, which triggers phytoplankton production and consequently zooplankton productivity [52]. This corroborates with the reports from Lake Hayq [15] and Koka Reservoir [14].
The high dietary proportion of detritus in the wet season (April to July) might have emerged from plant materials flooding during the rainy season [15]. The dominance of detritus in the diet during the rainy season agrees with observations made in Lake Zeway [42]. Similarly, the increase of ingested macrophytes in the wet season (July to October) could be explained by fish movements to shallow parts of the lake for reproduction. They stay there for a long period and feed on macrophytes and vegetation in the wet season [46]. Spatial and seasonal changes in the lake induce variation in the food composition of O. niloticus [53]. This seems logical, but it shows that Nile tilapia is capable of switching to a food that is more abundant or diverse in its feeding habit and can utilize a wide spectrum of food items in the environment [15].

4.3. Variation of Food Compositions with Fish Sizes

The proportions of phytoplankton, zooplankton and insect larvae were very high in the stomach of fish with <10 cm sizes (Figure 7). The study indicates that juveniles of O. niloticus are generally omnivorous but mainly feed on zooplankton and insect larvae and phytoplankton, of which diatoms are the major food component [14,54]. This is because juvenile fish need high protein intake to support a high growth rate and metabolism. Additionally, the variation in habitat preference between different size groups of fish can result in a difference in their food composition [54].
Larger fish (>15 cm) instead relied on food from plant origins, such as macrophytes and detritus. Fish change their feeding behavior from primarily omnivorous to herbivorous with the high-energy demands as they grow [14,15,54]. The growing energy demand of the fish cannot be met by feeding only on zooplankton and benthic invertebrates. This enables them to shift their feeding behavior from eating only zooplankton and benthic invertebrates to generalist behavior. In addition, the bigger fish are more capable of digesting cell wall material, and therefore can be less selective in their feeding pattern [55]. The shift in feeding behavior shows a low degree of intraspecific competition for particular food among different length groups [53]. Many investigators also reported similar feeding variations in different size groups of O. niloticus in different water bodies [15,20,49]. By extension, older fish show greater spatial distribution in less crowded schools in search of a wide diversity of food types and composition. This also justifies the diversity of the foods recorded in the guts of the larger fish which happened to lean towards macrophytes dominance [56].

5. Conclusions

The O. niloticus in Lake Langeno are characterized by omnivorous feeding habits that showed a seasonal and length-based variation of food composition. The size-related shifts in food item preferences of O. niloticus in the lake seem to depend upon physiological requirements, whereas the seasonal changes in dietary pattern might instead reflect the opportunistic feeding behavior of the species. The similarity in spatial-based food preference also indicates the ecological homogeneity of the study sites. It is unclear at this stage what these changes mean for the fish’s physiology, but they warrant further investigation in view of their meaning for aquaculture applications, as well as for consequences of climate change.

Author Contributions

Conceptualization, M.T., A.G. and B.L.; methodology, M.T., A.G. and B.L.; software, M.T. and G.P.J.J.; validation, M.T., A.G., B.L. and G.P.J.J.; formal analysis, M.T. and G.P.J.J.; investigation, M.T. and G.P.J.J.; resources, M.T., A.G., B.L. and G.P.J.J.; data curation, M.T., A.G., B.L. and G.P.J.J.; writing—original draft preparation, M.T.; writing—review and editing, M.T., A.G., B.L. and G.P.J.J.; funding acquisition, A.G. and B.L. All authors have read and agreed to the published version of the manuscript.

Funding

This research did not receive any specific grant from funding agencies in the public, commercial or not-for-profit sectors.

Institutional Review Board Statement

The study was conducted in accordance with the policy of Declaration of Helsinki, and approved by the Research Ethical Board Committee of College of Natural and Computational Sciences, Ambo University, Ethiopia. The research ethics and protection of personal information were also in accordance with the “Guidelines for the Protection of Personal Information” of Ambo University. Date of approval, 16 February, 2015.

Informed Consent Statement

Not applicable.

Data Availability Statement

Not applicable.

Acknowledgments

The authors acknowledge Addis Ababa University and the Ministry of Education for their financial support. We would also like to thank the staff of Zeway Fishery Research Center and the Laboratory of Animal Nutrition, Ghent University, for their human, laboratory and material support. In addition, we want to thank all individuals who helped us during data collection.

Conflicts of Interest

The authors declare no conflict of interest.

References

  1. Wakil, U.; Haruna, A.; Mohammed, G.; Ndirmbita, W.; Yachilla, B.; Kumai, M. Examinations of the stomach contents of two fish species (C. gariepinus and O. niloticus) in Lake Alau, North-Eastern Nigeria. Agric. For. Fish. 2014, 3, 405–409. [Google Scholar]
  2. Keyombe, J.L.; Waithaka, E.; Obegi, B. Length–weight relationship and condition factor of Clarias gariepinus in Lake Naivasha, Kenya. Int. J. Fish. Aquat. Stud. 2015, 2, 382–385. [Google Scholar]
  3. Bolarinwa, J.; Popoola, B. Length-Weight Relationships of Some Economic Fishes of Ibeshe Waterside, Lagos Lagoon, Nigeria. Aquat. Res. Dev. 2015, 5, 1–10. [Google Scholar] [CrossRef] [Green Version]
  4. Houlihan, D.; Boujard, T.; Jobling, M. Food Intake in Fish; Blackwell Science: Oxford, UK, 2001. [Google Scholar]
  5. Otieno, O.N.; Kitaka, N.; Njiru, J.M. Length-weight relationship, condition factor, length at first maturity and sex ratio of Nile tilapia, O. niloticus in Lake Naivasha, Kenya. Int. J. Fish. Aquat. Stud. 2014, 2, 67–72. [Google Scholar]
  6. Shalloof, K.A.S.; Khalifa, N. Stomach Contents and Feeding Habits of Oreochromis niloticus (L.) From Abu-Zabal Lakes, Egypt. World Appl. Sci. J. 2009, 6, 1–5. [Google Scholar]
  7. Amal, M.N.A.; Zamri-Saad, M. Streptococcosis in Tilapia (Oreochromis niloticus): A Review. Pertanika J. Trop. Agric. Sci. 2011, 34, 195–206. [Google Scholar]
  8. Mohammed, E.Y.; Uraguchi, Z.B. Impacts of climate change on fisheries: Implications for food security in Sub-Saharan Africa. In Global Food Security; Hanjra, M.A., Ed.; Nova Science Publishers Inc.: Hauppauge, NY, USA, 2013; pp. 114–135. [Google Scholar]
  9. Adeyemi, S.O.; Bankole, N.O.; Adikwu, I.A.; Akombu, P.M. Food and feeding habit Habits of some commercially important fish species in Gbedikere Lake, BassaKogi State, Nigeria. Int. J. Lakes Rivers 2009, 2, 31–36. [Google Scholar]
  10. Canonico, G.C.; Arthington, A.; Thieme, M.L. The effects of introduced tilapias on native biodiversity. Aquat. Conserv. Mar. Freshw. Ecol. 2005, 15, 463–483. [Google Scholar] [CrossRef]
  11. Mitike, A. Fish Production, Consumption and Management in Ethiopia. Res. J. Agric. Environ. Manag. 2014, 3, 460–466. [Google Scholar]
  12. Tesfaye, G.; Wolff, M. The state of inland fisheries in Ethiopia: A synopsis with updated estimates of potential yield. Ecohydrol. Hydrobiol. 2014, 14, 200–219. [Google Scholar] [CrossRef]
  13. Tadesse, Z. The nutritional status and digestibility of Oreochromis niloticus L. diet in Lake Langeno, Ethiopia. Hydrobiologia 1999, 416, 97–106. [Google Scholar] [CrossRef]
  14. Engdaw, F.; Dadebo, E.; Nagappan, R. Morphometric relationships and feeding habits of Nile Tilapia Oreochromis niloticus (L.) (Pisces: Cichlidae) from Lake Koka, Ethiopia. Int. J. Fish. Aquat. Sci. 2013, 2, 65–71. [Google Scholar]
  15. Worie, W.; Getahun, A. The food and feeding ecology of Nile tilapia, O. niloticus, in Lake Hayq, Ethiopia. J. Fish. Aquat. Stud. 2015, 2, 176–185. [Google Scholar]
  16. Temesgen, M.; Getahun, A.; Lemma, B. Diversity, distribution and abundance of fish species in Lake Langeno, Ethiopia. Ethiop. J. Biol. Sci. 2016, 15, 1009–1140. [Google Scholar]
  17. Temesgen, M. Fish Biology and Fishery Management of Commercial Stocks in a Tropical Rift Valley Lake, Lake Langeno, Ethiopia. Ph.D. Thesis, Addis Ababa University, Addis Ababa, Ethiopia, 2018. [Google Scholar]
  18. Abera, L. Current Status and Trends of Fishes and Fishery of a Shallow Rift Valley Lake, Lake Zeway, Ethiopia. Ph.D. Thesis, Addis Ababa University, Addis Ababa, Ethiopia, 2016. [Google Scholar]
  19. Tesfaye, G.; Tadesse, Z. Length-weight relationship, Fulton’s condition factor and size at first maturity of Tilapia, Oreochromis niloticus in Lakes Koka, Zeway and Langeno (Ethiopian rift valley). Ethiop. J. Biol. Sci. 2008, 2, 139–157. [Google Scholar]
  20. Abera, L. Breeding season and condition factor of Oreochromis niloticus (Pisces: Cichlidae) in Lake Babogaya, Ethiopia. Int. J. Agric. Sci. 2012, 7, 116–120. [Google Scholar]
  21. Teferi, Y.; Admasu, D.; Mengistou, S. The food and feeding habit of O. niloticus L. in Lake Chamo, Ethiopia. SENIT Ethiop. J. Sci. 2000, 23, 1–12. [Google Scholar]
  22. Ayenew, T. Environmental implications of changes in the levels of lakes in the Ethiopian Rift since 1970. Reg. Environ. Chang. 2004, 4, 192–204. [Google Scholar] [CrossRef]
  23. Kebede, E. Phytoplankton in a Salinity-Alkalinity Series of Lakes in the Ethiopian Rift Valley. Ph.D. Thesis, Uppsala University, Uppsala, Sweden, 1996. [Google Scholar]
  24. Wodajo, K.; Belay, A. Species composition and seasonal abundance of zooplankton in two Ethiopian Rift Valley Lakes-Lake Abijata and Langeno. Hydrobiology 1984, 113, 129–136. [Google Scholar] [CrossRef]
  25. Imam, T.S.; Bala, U.; Balarabe, M.L.; Oyeyi, T.I. Length-weight relationship and condition factor of four fish species from Wasai Reservoir in Kano, Nigeria. Afr. J. General Agric. 2010, 6, 125–130. [Google Scholar]
  26. Gill, K. Identification Guide to Freshwater Macro-Invertebrates; Stroud Water Research Center Macro-Invertebrate Images Prepared for Stroud Water Research Center: Avondale, PA, USA, 1998. [Google Scholar]
  27. Harding, J.P.; Smith, W.A. A Key to the British Freshwater Cyclopid and Calanoid Copepods; Freshwater Biological Association Scientific Publication No. 18; Titus Wilson and Son Ltd.: London, UK, 1974. [Google Scholar]
  28. Baker, P.D.; Fabbro, L.D. A Guide to the Identification of Common Blue-Green Algae in Australian Freshwaters. Cooperative Research Center for Freshwater Ecology Identification Guide, 2nd ed.; National Library of Australia Cataloguing in Publication: Perth, Australia, 2002. [Google Scholar]
  29. Carling, K.J.; Ater, I.M.; Pellam, M.R.; Bouchard, A.M.; Mihuc, T.B. A Guide to the Zooplankton of Lake Champlain. Plattsburgh State Univ. N. Y. 2004, 1, 33–66. [Google Scholar]
  30. Vuuren, S.J.; Taylor, J.; Ginkel, C.; Gerber, A. Easy Identification of the Most Common FRESHWATER ALGAE; A Guide for the Identification of Microscopic Algae in South African Freshwaters; Department of Water and Forestry, North-West University: Pretoria, South Africa, 2006. [Google Scholar]
  31. Hyslop, E.J. Stomach contents analysis—A review of methods and their application. J. Fish Biol. 1980, 17, 411–429. [Google Scholar] [CrossRef] [Green Version]
  32. Windell, J.T.; Bowen, S.H. Methods for study of fish diets based on analysis of stomach contents. In Methods for the Assessment of Fish Production in Freshwaters; Bagenal, T., Ed.; Blackwell: London, UK, 1978; pp. 219–226. [Google Scholar]
  33. Assis, C.A. A generalized index for stomach contents analysis in fish. Sci. Mar. 1996, 60, 385–389. [Google Scholar]
  34. Natarajan, A.V.; Jhingran, A.C. Index of preponderance-a method of grading the food elements in the stomach analysis of fishes. Indian J. Fish. 1961, 8, 54–59. [Google Scholar]
  35. Hurlbert, S.H. The measurement of niche overlap and some relatives. Ecology 1978, 59, 67–77. [Google Scholar] [CrossRef]
  36. Cortés, E. A critical review of methods of studying fish feeding based on analysis of stomach contents: Application to e1asmobranch fishes. Can. J. Fish. Aquat. Sci. 1997, 54, 726–738. [Google Scholar] [CrossRef]
  37. Chipps, S.R.; Garvey, J.E. Assessment of diets and feeding patterns. In Analysis and Interpretation of Freshwater Fisheries Data; Guy, C.S., Brown, M.L., Eds.; American Fisheries Society: Bethesda, MD, USA, 2007; pp. 473–514. [Google Scholar]
  38. Aitchison, J. Principal Component analysis of compositional data. Biometrika 1983, 70, 57–65. [Google Scholar] [CrossRef]
  39. Bozza, A.N.; Hahn, N.S. Uso de recursosalimentares por peixesimaturos e adultos de species piscívorasemumaplanície de in undação neotropical. Biota Neotrop. 2010, 10, 217–226. [Google Scholar] [CrossRef] [Green Version]
  40. Meurer, S.; Zaniboni-Filho, E. Reproductive and feeding biology of Acestrorhynchus pantaneiro Menezes, 1992 (Osteichthyes: Acestrorhynchidae) in areas under the influence of dams in the upper Uruguay River, Brazil. Neotrop. Ichth. 2012, 10, 159–166. [Google Scholar] [CrossRef]
  41. Wakjira, M. Feeding Habits and Some Biological Aspects of Fish Species in Gilgel Gibe Reservoir, Ethiopia. Int. J. Curr. Res. 2013, 5, 4124–4132. [Google Scholar]
  42. Wakjira, M. Fish Diversity, Community Structure, Feeding Ecology, and Fisheries of Lower Omo River and the Ethiopian Part of Lake Turkana, East Africa. Ph.D. Thesis, Addis Ababa University, Addis Ababa, Ethiopia, 2016. [Google Scholar]
  43. Bwanika, G.; Murie, D.; Chapman, L. Comparative Age and Growth of Nile tilapia (Oreochromis niloticus L.) in Lakes Wamala, Uganda. Hydrobiology 2007, 589, 287–301. [Google Scholar] [CrossRef]
  44. Tudorancea, C.; Fernando, F.; Paggi, J. Food and feeding of O. niloticus (Linnaeus, 1758) juveniles in Lake Hawassa, Ethiopia. Arch. Hydrobiol. Suppl. 1988, 79, 267–289. [Google Scholar]
  45. Tadesse, Z. Food and Feeding Ecology of Tilapia, Oreochromis niloticus L. and Effects of Diet on the Lipid Quality of Fish in Some Lakes in Ethiopia. Ph.D. Thesis, Addis Ababa University, Addis Ababa, Ethiopia, 1998. [Google Scholar]
  46. Tefera, G. The Composition and Nutritional Status of the Diet of O. niloticus L. (Pisces: Cichlidae) in Lake Chamo, Ethiopia. J. Fish Biol. 1993, 42, 865–874. [Google Scholar]
  47. Kohl, K.D.; Coogan, S.C.P.; Raubenheimer, D. Do wild carnivores forage for prey or for nutrients? Evidence for nutrient-specific foraging. BioEssays 2015, 37, 701–709. [Google Scholar] [CrossRef]
  48. Battarbee, R.W. Palaeolimnological approaches to climate change, with special regard to the biological record. Quat. Sci. Rev. 2000, 19, 107–124. [Google Scholar] [CrossRef]
  49. Njiru, M.; Okeyo-Owuor, J.B.; Muchiri, M.; Cowx, I.G. Shifts in the food of Nile tilapia, O. niloticus (L.) in Lake Victoria, Kenya. Afr. J. Ecol. 2004, 42, 163–170. [Google Scholar] [CrossRef]
  50. Paaijmans, K.P.; Takken, W.; Githeko, A.K.; Jacobs, A.F.G. The effect of water turbidity on the near-surface water temperature of larval habitats of the malaria mosquito Anopheles gambiae. Int. J. Biometeorol. 2008, 52, 747–753. [Google Scholar] [CrossRef] [PubMed] [Green Version]
  51. Mergeay, J.; Verschuren, D.; Meester, L.D. Invasion of an asexual American water flea clone throughout Africa and rapid displacement of a native sibling species. Proc. Biol. Sci. 2006, 273, 2839–2844. [Google Scholar] [CrossRef] [PubMed] [Green Version]
  52. Okogwu, O.I. Seasonal variations of species composition and abundance of zooplankton in Ehoma Lake, a floodplain lake in Nigeria. Int. J. Trop. Biol. 2010, 58, 171–182. [Google Scholar] [CrossRef] [Green Version]
  53. Ayoade, A.; Fagade, S.; Adebisi, A. Diet and dietary habits of the fish Schilbemystus (Siluriformes: Schilbeidae) in two artificial lakes in Southwestern Nigeria. Int. J. Trop. Biol. 2008, 56, 1847–1855. [Google Scholar]
  54. Benavides, A.; Cancino, J.; Ojeda, F. Ontogenetic change in stomach dimensions and microalgal digestibility in marine herbivore fish A. punctatus. Funct. Ecol. 1994, 8, 46–55. [Google Scholar] [CrossRef]
  55. German, D.P. Inside the guts of wood-eating catWshes: Can they digest wood? J. Comput. Phys. Biol. 2009, 179, 1011–1023. [Google Scholar]
  56. Miranda, L.E.; Killgore, K.J.; Slack, W.T. Spatial organization of fish diversity in a species-rich basin. River Res. Appl. 2018, 35, 188–196. [Google Scholar] [CrossRef]
Figure 1. Cumulative prey curves for O. niloticus collected from different sites of Lake Langeno, Ethiopia.
Sustainability 14 00974 g001
Figure 2. The log-ratio principal component analysis (%PCA) of food composition for individual-level dietary variations of O. niloticus in Lake Langeno, Ethiopia.
Sustainability 14 00974 g002
Figure 3. The percentage of geometric importance index value (% GII) of different food items in the diet of O. niloticus in Lake Langeno, Ethiopia. Vertical lines separate the different degrees of preference of the food items.
Sustainability 14 00974 g003
Figure 4. The log-ratio principal component analysis (%PCA) of food composition for site-based dietary variations of O. niloticus in Lake Langeno, Ethiopia.
Sustainability 14 00974 g004
Figure 5. Preys-months PCA biplot of stomach content analysis for O. niloticus collected from Lake Langeno, Ethiopia.
Sustainability 14 00974 g005
Figure 6. The monthly variation in the volumetric contribution of phytoplankton composition (%) (A = Cyanophyta, Bacillariophyta and Chlorophyta, B = Euglenophyta, Dinophyta, Rhodophyta, Cryptophyta, Chrysophyta and Heterokonotophyta) in the food composition of O. niloticus in Lake Langeno, Ethiopia.
Sustainability 14 00974 g006
Figure 7. The monthly variation in the volumetric contribution of zooplankton prey (%) in the food composition of O. niloticus, in Lake Langeno, Ethiopia.
Sustainability 14 00974 g007
Figure 8. The monthly variation in the volumetric contribution of zooplankton prey (%) in the food composition of O. niloticus, in Lake Langeno, Ethiopia, from March 2016 to February 2017.
Sustainability 14 00974 g008
Figure 9. The monthly variation in the volumetric contribution of detritus, macrophytes, aquatic insects, fish parts and nematode prey (%) in the food composition of O. niloticus in Lake Langeno, Ethiopia, from March 2016 to February 2017.
Sustainability 14 00974 g009
Figure 10. Volumetric contributions of different food items (%) (A = Phytoplankton, Zooplankton, Detritus, Insects and Macrophytes, B = Fish parts, Nematodes and unidentified food items) in the stomachs of different length groups of O. niloticus in Lake Langeno, Ethiopia.
Sustainability 14 00974 g010
Table 1. Proportion of stomach contents of O. niloticus (%) in Lake Langeno, Ethiopia.
Stomach VolumeNo. of FishPercent (%)
Distended1499.0
Full36321.9
3/4 full34520.8
1/2 full24714.9
1/4 full29818.0
Empty25615.4
Total1658100
Table 2. Frequency of occurrence and volumetric contribution of different food prey (%) in the stomachs of O. niloticus (n = 512) in Lake Langeno, Ethiopia.
Food Type%Oi%ViIP%IP
Phytoplankton100.064.36825.074.5
Detritus99.514.61462.015.9
Zooplankton87.112.8576.76.3
Macrophytes65.84.7222.72.4
Insects8.61.613.80.2
Fish parts15.91.422.50.3
Nematodes7.80.32.20.02
Ostracods10.10.66.50.1
Unidentified6.041.335.40.4
%Oi: frequency of occurrence; %Vi: percentage volume; IP: index of preponderance.
Table 3. Frequency of occurrence (%Oi), volumetric contribution (%Vi) and index of the preponderance (IP) of different food items in the food composition of O. niloticus (n = 512) in Lake Langeno, Ethiopia.
Food TypeSpecific Items%Oi%ViIP%IP
PhytoplanktonCyanophyta (Blue Green algae)100.04.8477.010.1
Bacillariophyta (Diatom)99.516.91684.535.6
Chlorophyta (Green algae)78.09.9778.416.5
Chrysophyta32.42.684.61.8
Cryptophyta47.66.9330.87.0
Dinophyta72.66.1440.79.3
Rhodophyta16.83.051.11.1
Euglenophyta74.811.3843.717.9
Heterokontophyta14.42.637.30.8
ZooplanktonAnomopoda6.00.42.60.5
Cladocera33.63.7123.521.4
Ctenopoda12.31.012.52.2
Copepoda48.33.8183.131.8
Rotifera76.93.2247.943.0
Ostracoda10.10.66.51.1
Aquatic insectsDiptera4.710.349.510.4
Plecoptera4.212.752.911.1
Trichoptera3.711.843.39.1
Chilopoda4.814.570.114.7
Coleoptera3.86.9626.15.5
Odonata8.413.7114.323.9
Hemiptera5.08.241.08.6
Ephemeroptera4.611.552.811.1
Hymenoptera2.710.427.85.8
Table 4. Summary of the percentage variance (%) and correlation matrices (r) accounted for by the first two principal components (PCA) of fish food composition and study sitesin Lake Langeno, Ethiopia.
Correlation CoefficientsCanonical Coefficient
Axis 1Axis 2
Eigenvalue9.190.62
% of variance90.376.10
Horakelo0.3474−0.0846
Hoitu0.5645−0.4115
Dole0.27090.5482
Webishebele0.5937−0.04752
Middle0.15050.7145
Tufa0.33480.1011
Table 5. Summary of the percentage variance (%) and correlation matrices (r) accounted for by the first two principal components (PCA) of fish food composition and study months in Lake Langeno, Ethiopia.
Correlation CoefficientsCanonical Coefficient
Axis 1Axis 2
Eigenvalue18.361.82
% of variance80.457.97
Phytoplankton−0.900.79
Zooplankton0.890.35
Detritus0.950.30
Insects0.870.21
Macrophytes0.830.08
Fish parts0.11−0.37
Nematode0.640.18
Unidentified0.280.02
Publisher’s Note: MDPI stays neutral with regard to jurisdictional claims in published maps and institutional affiliations.

