Article

Exploring the Energy Saving Potential in Private, Public and Non-Motorized Transport for Ten Swedish Cities

by
Jeffrey R. Kenworthy
1,2,* and
Helena Svensson
3,4,*
1
Fachbereich 1, Architektur, Bauingenieurwesen and Geomatik, Frankfurt University of Applied Sciences, Nibelungenplatz 1, 60318 Frankfurt am Main, Germany
2
Curtin University Sustainability Policy Institute, Curtin University, Kent Street, Bentley, WA 6102, Australia
3
Department of Technology and Society, Lund University, 221 00 Lund, Sweden
4
K2—The Swedish Knowledge Centre for Public Transport, Bruksgatan 8, 222 36 Lund, Sweden
*
Authors to whom correspondence should be addressed.
Sustainability 2022, 14(2), 954; https://doi.org/10.3390/su14020954
Submission received: 30 November 2021 / Revised: 31 December 2021 / Accepted: 4 January 2022 / Published: 14 January 2022
(This article belongs to the Special Issue Transition towards Sustainable Urban Settlements)

Abstract

:
Transport energy conservation research in urban transport systems dates back principally to the Organization of the Petroleum Exporting Countries’ (OPEC) “Arab Oil Embargo” (1973–1974) and the Iranian revolution (1979), when global oil supplies became threatened and costs rose steeply. Two subsequent Gulf Wars (1991 and 2003) highlighted the dangerous geo-political dimensions of Middle-Eastern oil. In latter times, the urgency to reduce global CO2 output to avoid catastrophic climate change has achieved great prominence. How to reduce passenger transport energy use therefore remains an important goal, which this paper pursues in ten Swedish cities, based on five scenarios: (1) increasing the relatively low public transport (PT) seat occupancy in each Swedish city to average European levels (buses 35%, light rail 48%, metro 60% and suburban rail 35%); (2) doubling existing PT seat occupancy in each Swedish city; (3) increasing existing car occupancy in each Swedish city by 10%; (4) decreasing existing energy use per car vehicle kilometer by 15%; (5) increasing existing modal split for daily trips by non-motorized modes to 50% in each city. A sixth “best-case scenario” is also explored by simultaneously combining scenarios 2 to 5. The data used in the paper come from systematic empirical research on each of the ten Swedish cities. When applied individually, scenario 2 is the most successful for reducing passenger transport energy use, scenarios 1 and 4 are next in magnitude and produce approximately equal energy savings, followed by scenario 5, with scenario 3 being the least successful. The best-case, combined scenario could save 1183 million liters of gasoline equivalent in the ten cities, representing almost a 60% saving over their existing 2015 total private passenger transport energy use and equivalent to the combined 2015 total annual private transport energy use of Stockholm, Malmö and Jönköping. Such findings also have important positive implications for the de-carbonization of cities. The policy implications of these findings and the strategies for increasing public transport, walking and cycling, boosting car occupancy and decreasing vehicular fuel consumption in Swedish cities are discussed.

1. Introduction

Ever since OPEC enacted what has been called the “Arab Oil Embargo” of 1973–1974, followed then by the ousting of the Shah of Iran and the subsequent Iranian revolution of 1979, many countries have become increasingly concerned about how to reduce their consumption of fossil fuels and lower their dependence on, and vulnerability to, imports of oil from the Middle East [1,2]. These concerns were exacerbated following the two Gulf Wars in 1991 (Iraq’s invasion of Kuwait) and in 2003 (a coalition of countries’ war with Iraq to oust Saddam Hussein, ostensibly because of weapons of mass destruction). These events showed volatility of the geo-politics of oil and the lengths to which some nations will go to ensure their security of access to oil reserves. This need to reduce consumption of fossil fuels is further highlighted by current global concerns about limiting carbon dioxide (CO2) emissions to prevent catastrophic climate change [3,4].
These early events began to impact cities and highlighted the need to conserve energy use in transport, especially in countries such as the USA, which were included in the 1973–1974 oil embargo due to their support of Israel in the 1973 war with Egypt [1,5,6,7]. The impact was especially profound in highly automobile-dependent cities such as in the United States, which suffered large-scale social upheaval as motorists clambered to fill their very large cars with gasoline [8]. Conversely, cities in The Netherlands, a country also subject to the embargo, were not heavily affected and many large roads were simply closed for cyclists, pedestrians and roller-skaters [9]. Dutch cities had much smaller, less energy-consuming cars, and were very much more compact with shorter travel distances, resulting in strong use of non-motorized modes and public transport, particularly urban rail systems using electric propulsion.
Diverse approaches to the problem of conserving energy in urban passenger transport followed the energy crises of the 1970s. These included improving automotive technology through smaller cars and other changes, reducing congestion and lowering speed limits to achieve better fuel economy, while other changes stressed modal shifts to walking, cycling and public transport, as well as changes in urban development towards higher densities and more mixed land use to reduce the need to travel, especially by car. An interest also emerged in comparing the per capita use of energy in passenger transport in cities worldwide and exploring a wide range of city-level factors which might help explain these differences and provide policy insights into how to reduce transport energy use [10,11].
This paper continues this research on international comparisons of cities and how to achieve energy conservation in urban passenger transport systems. It attempts this not through detailed modelling or theoretical means, but by using a wide range of empirical data developed for ten Swedish cities. These data, including their per capita and modal passenger transport energy use, and many other factors are compared between themselves and other cities worldwide. Some plausible changes are then explored in the mobility patterns of Swedish cities towards less car use and more public transport and non-motorized mode use, as well as changes in vehicular fuel use in each city.
This paper attempts to answer two research questions:
What is the potential to save transport energy in Swedish cities through different strategies in private, public and non-motorized modes?
What policy implications can be drawn from this for urban and transport planning in Swedish cities?
To answer these questions, this paper first provides a brief literature review of the history of some key approaches to transport energy conservation and their evolution into the method used in this paper of comparing cities for this purpose. This is followed by an overview of the methodological approach used in gathering the data for this study. The paper then provides a summarized comparative overview of the ten Swedish cities to show the detailed data developed for this study and its relevance in answering the research questions. After this, it uses these data to calculate the transport energy conservation potential in the ten Swedish cities through five scenarios. It explains the methodology used for each scenario and the magnitude of energy savings that are possible, and by implication, benefits for the de-carbonization of cities. A discussion of the results and their policy implications in Sweden forms the following section. The conclusions provide summary answers to the research questions.

2. Literature Review

Beginning in the mid-1970s in response to oil crises, a very wide range of approaches to saving energy in transport have been produced. Some focus primarily on technologies such as improving vehicular energy efficiency, new non-fossil fuel propulsion systems for vehicles and alternative fuels [12,13,14]. Another heavily researched area is traffic engineering designed to improve traffic flow by reducing congestion [15,16,17,18,19,20]. This research has tended to be reductionist, neglecting the feedback or rebound effects of trying to improve traffic flow through increasing the capacity and speed of the road system alone (e.g., urban sprawl which creates longer travel distances and more car use).
Such problems have been tackled by placing the traffic engineering results into a more holistic framework, considering fuel-efficient traffic versus fuel-efficient cities [21,22,23,24,25]. Other authors have added to this much broader, holistic approach to transport energy conservation by examining a wide range of multi-criteria land use and transportation systems policies [26,27,28,29].
Clearly, diverse research has been done over decades to explore transport energy conservation policies and strategies in cities. However, it is uncommon to find research that systematically assembles empirical data on transport energy use in private and public transport in whole cities around the world, and reliable corollary data to better understand the observed patterns and magnitudes of differences between cities. Such research was pioneered in Australian cities in the 1980s and offered a range of transport energy conservation possibilities focused not on vehicular technologies or manipulating traffic systems, but on increasing densities and mixed land use and changing modal split in favor of public transport and non-motorized modes [30,31,32,33].
This approach of comparing cities to better understand how to reduce transport energy use then extended globally. Newman and Kenworthy [10] provided the first substantial international perspective, comparing transport indicators for 32 cities around the world to understand how much car use and thus energy use is needed to run the passenger transport systems in cities worldwide and what can be done to reduce it. Newman and Kenworthy [34] showed the enormous appetite of US cities for energy to run cars and again offered solutions which revolved around developing more compact land use, enhancing public transit systems and focusing on walking and cycling. The paper generated a heated international debate about the role of the car in cities and the best ways to reduce private passenger transport energy use [35,36]. Following this debate, the energy and other implications of automobile dependence, sprawl, compact, mixed-use planning and modal choice became very important in academic and urban policy discussions and has remained so, especially in light of the more general shift in focus from mobility to accessibility in transport research [37,38].
In the present Scandinavian context, the early work of Petter Naess from Norway followed this comparative approach, specifically investigating the issue of urban form and its influence on energy use in transport in Nordic urban environments [39]. Naess investigated energy use in transport in 22 Nordic towns and regions and found that the influence of urban form variables, especially denser central and inner core areas of cities, was more significant than that of car ownership, income and fuel prices [40]. Transportation energy use in Swedish towns and regions was also investigated [41]. He summarized this work thus:
“An investigation of 97 towns and 15 commuting regions in Sweden shows that the developmental pattern has a significant influence on the energy consumption for transportation. The main source for the energy data is the official Swedish statistics on fuel sales quantities in the municipalities in 1989, adjusted for fuel consumption in the agricultural sector. For the individual town, a dense pattern of development clearly gives the lowest per capita energy consumption for transportation. At the regional level, however, a decentralized pattern of residence seems to be favorable with respect to energy conservation, provided that each individual town and village has sufficiently high population density” (p. 187).
Sweden has a history of attempts at reducing fossil fuel dependence in the urban passenger transport sector. Selected policies regarding a transition to non-fossil fuels have been introduced in Sweden over the years, including a Government Bill from 2008/2009 which set a long-term priority that Sweden should have a vehicle fleet that is independent of fossil fuel by 2030. In 2013, an official report of the Swedish Government identified possible actions and measures to reduce the transport sector’s dependence on fossil fuels [42]. It was stressed that planning and future development must be towards attractive and accessible cities with reduced demand for transport and increased transport efficiency. It was also stressed that a change in modal split is needed and that there is a possibility to steer the increased demand in travel towards public transport, biking and walking so car traffic can decrease. Furthermore, it recommended more fuel-efficient vehicles and more energy-efficient driving of vehicles. The year 2030 is not far away and the changeover needs to be accelerated to achieve the government’s priorities. The policies pursued in this paper to reduce transport energy use directly follow the priorities set in this 2013 Swedish government report and attempt to show how much energy might be saved in ten Swedish cities.
In 2015, the national government also introduced the Urban Environment Agreement, which is a policy through which municipalities and regions can apply for financial support for up to fifty percent of investment costs for improving infrastructure for public transport and bicycling [43]. The main purpose of this policy is to create a modal shift from the private car to more sustainable transport modes. As a service in return for the support, the municipalities must implement more measures targeting sustainable transport such as improving and constructing new pedestrian facilities, developing more restrictive private car parking strategies, improving the service in public transport, working with mobility management or constructing new residential and office buildings close to public transport stations and stops. The policy was introduced as a pilot policy for four years, but has since become permanent for at least another ten years.
Apart from the urban environment agreements, there are other local and national policy instruments in Sweden for a more transport-efficient society and a reduction in the vehicle-kilometers travelled (VKT) by private cars. The main target of the policies are shifts in modal share, reduction in emissions and reduced congestion, which will inevitably reduce car VKT. On a local level, there are instruments such as adjusting speed limits, adjusting parking requirements and introducing park-n-ride facilities. On a national level, instruments like parking at workplaces as a taxable privilege, adjustment of tax rebate for work trips and support for developments linked to high-speed rail for example [44], will also tend to reduce car VKT and energy use.

3. Methodology of Data Collection

The data for this study come from a four-year research effort from 2016 to 2019 collecting data from ten Swedish municipalities and regions. Kenworthy [45,46,47] contain detailed accounts of the research methodologies used to collect all the data contained in the tables in this paper, the definitions and meaning of each variable, as well the geographies that define each city. Table 1 provides a summary of the American, Australian, Canadian, European and Asian cities used to calculate the averages for these groups of cities shown in this paper, as well as the ten Swedish cities in the study, plus Freiburg im Breisgau, Germany, which was used as a benchmark for smaller Swedish cities due to its credentials as an internationally well-known sustainable city, especially for transport and energy matters [48]. Table 1 presents each city’s population and the year of that population plus their metropolitan GDP per capita at that year (in constant US$1995).
The unique value of this research is that it uses empirical energy data from cities for private and public transport, as opposed to theoretically modelled data for different vehicular technologies. All data are collected directly for each city from their primary sources, mostly government departments in each city or through national data sets defining the metropolitan areas in this study. For example, public transport energy use is obtained from every public transport operator for each mode in every city. Published on-line sources are consulted in the first instance and then emails and phone calls are made between many people in a host of transport, planning, energy, environmental and other departments in every city. Most data require this in-depth work and are not routinely published. Only primary data are collected, never the standardized indicators shown in the tables. These are calculated by the authors by combining the relevant primary data (e.g., population and urbanized land area for urban density). All Swedish city data and Freiburg are for 2015, while the American, Australian, Canadian, European and Asian city data are for 2005–2006 from an earlier study of these other cities (e.g., see [50,51,52]).
While it would be ideal to have all the comparative data for the same year, the collection of these comparative cities data, which is much more than shown in this paper, takes many years to complete (the 2005–2006 data commenced in 2007 and was not complete until 2014). Providing 2015 data for the other cities could not have even been commenced until 2017, due to delays in data release. The comparisons, however, are still valid in relative terms and experience and publication over 40 years of such data collection has shown at each point that the relative differences between the major groups of cities remain. Where some variables can change quite rapidly (e.g., GDP), the discussion in this paper provides notes to qualify the results. The detailed methodology for development and execution of the six scenarios for energy conservation explored below are described and justified when each scenario is presented.

4. Comparative Overview of the Ten Swedish Cities: Summary

Table 2 and Table 3 present key data on land use, transport and private and public transport energy use for the ten Swedish cities in this study and Freiburg, together with the averages for American, Australian, Canadian, European and Asian cities (for 2005–2006). The first five Swedish cities in the tables are classed as the “large” Swedish cities and the next five as the “small” cities.
The data in these tables are relevant to the energy conservation policies pursued in this paper. Some key conclusions concerning these data are as follows (for more details, see Kenworthy, [49]).
Swedish cities are typical European cities in both their average private and public transport energy use per capita (15,601 MJ and 1426 MJ/person, respectively), with the smaller Swedish cities being a little less than the larger cities in both. However, there is considerable variation from 11,622 to 21,678 MJ/person in Umeå and Jönköping, respectively. On average, Swedish cities have approximately one-half the per capita private transport energy use of Australian and Canadian cities and less than one-third that of US cities. Their public transport energy use per capita is like the other European cities, approximately half that consumed by the two large cities in Asia that are very transit-oriented, but significantly more than that consumed in US, Australian and Canadian cities. This European level of per capita public transport energy use reflects similar levels of public transport service to other European cities, despite having urban densities that are significantly below those of other European cities and much greater commitment to public transport than in the auto-oriented cities with similar density.
Private transport energy use per vehicle km in Swedish cities is on average similar in the smaller and larger cities (2.9 and 3.1 MJ/km, respectively, with an average of 3.0) and very like Freiburg (3.1), as well as the other European cities in 2005 (3.1 MJ/km). This factor is, however, much less than in all the other groups of cities, which ranged in 2005 from 4.1 to 4.9 MJ/km.
Public transport energy use per kilometer (17.3 MJ/km all modes) is lower than in the global sample (18.6 MJ/km). Swedish buses consume less energy per kilometer than all groups of cities, apart from the European cities and Freiburg, with which they are very alike. LRT energy use per wagon km is also very like European cities, but lower than the other groups of cities. Metro energy use per wagon km (Stockholm’s tunnelbana) is again akin to European cities, but very much lower than metros everywhere else. Suburban rail energy use varies a lot and is higher than in European, Australian and Asian cities, but very much lower than in American and Canadian cities (which have numerous less energy-efficient diesel operations).
Private transport energy use per passenger km travelled (PKT) follows the same patterns as outlined above, with Swedish cities on average being almost identical to European cities, but significantly below all the other cities. On the other hand, the lower use of public transport services sees Swedish cities consuming more energy per passenger kilometer (1.10 MJ/PKT) than all groups of cities, except those in the US and Canada. This includes Freiburg and the European cities which consume 0.79 and 0.76 MJ/PKT, respectively. This pattern is mainly due to the buses, because for the rail modes (LRT, metro and suburban rail), Swedish cities are much more like, or sometimes better than, the other groups of cities.
An examination of a wide range of other transport indicators provided in Table 2, has revealed insights into why Swedish cities differ between one another in passenger transport energy use and between other cities in the world. The key point to note here is that Swedish cities have similar levels of car use to other European cities and therefore similar per capita private transport energy use. This is despite Swedish cities being significantly lower in density than other European cities. However, unlike cities of similar density in North America and Australia, Swedish cities are still more centralized in work than their more auto-oriented cousins, which favors walking, cycling and public transport, they have significantly lower car ownership and they provide very good levels of public transport infrastructure and service, including competitive speeds with the car. They also have respectable levels of public transport use and very healthy levels of walking and cycling, especially considering their moderate density and cold climate for parts of the year.
Unlike most lower-density cities in North America and Australia, Swedish cities, being much older, do retain more significant areas of “walking city” and “transit city” fabric and are therefore not uniformly low in density, but rather have substantial higher density, mixed land use areas which are very supportive of public transport, walking and cycling [53]. This is particularly evident in Stockholm, which has many high density, mixed-use sub-centers around stations on the tunnelbana (metro) system [54,55] and a significant mediaeval core and extensive dense inner area. For a more detailed explanation of how Swedish cities distinguish themselves from other cities in these matter, readers can refer to Kenworthy [47], which also contains photographic evidence of this urban fabrics argument.
The lower per capita private transport energy use between Swedish cities (2015) and most other non-European cities (2005–2006) in this sample can generally be explained by Swedish cities having a combination of (a) more energy-efficient cars; (b) moderate density, particularly through more extensive areas of walking and transit city fabric; (c) more centralized jobs in the CBD which supports public transport access for work and other trips; (d) less parking in their CBDs, which again discourages car use and supports access by sustainable modes; (e) lower car ownership; (f) lower car use; (g) lower car speed (which makes cars somewhat less attractive); (h) higher public transport service levels; (i) better public transport use. Relatively high public transport energy use per capita in Swedish cities generally relates to a combination of comparatively high service levels and how much of that service is provided by buses compared to rail (buses in the ten Swedish cities consumed 1.76 MJ/PKT versus 0.39 to 0.60 MJ/PKT for the rail modes—Table 3).
Table 2. Land use and transport data for the ten Swedish cities, Freiburg and world cities. Reprinted from [49].
VariableUnitsStockholmMalmöGöteborgLinköpingHelsingborgSWE LARGEUppsalaVästeråsÖrebroJönköping
Urban densitypersons/ha23.520.019.713.821.919.815.317.113.712.6
Proportion of jobs in CBD%28.2%7.8%7.0%18.9%19.7%16.3%19.2%23.3%14.6%20.6%
Metropolitan gross domestic product per capitaUSD 1995$49,271$32,709$40,808$30,260$28,917$36,393$31,998$29,594$29,045$29,952
Length of freeway per personm/ person0.1380.2320.2250.2690.2870.2300.1800.2240.3660.496
Parking spaces per 1000 CBD jobsspaces/1000 jobs125237160225483246169501461287
Passenger cars per 1000 personsunits/1000 persons398442405432435423387461435481
Average speed of the road network (24/7)km/h37.141.039.030.539.137.351.348.547.445.0
Total length of public transport lines per 1000 personsm/1000 persons48673109363411,0553031513911,176689498769024
Total length of reserved public transport routes
per 1000 persons
m/1000 persons23422216937843228758412754221457
Total public transport seat kilometers of service per capitaseat km/person8294583755874647632161377115267736424330
Overall average speed of public transportkm/h33.646.830.938.631.536.364.438.433.440.7
Average speed of buseskm/h24.827.828.031.323.627.146.028.030.531.5
Average speed of suburban railkm/h56.375.666.093.865.871.5102.093.989.072.5
Total public transport boardings per capitaboardings/person35911117064158172108533960
Total public transport passenger kilometers per capitap.km/person257914511468877159015931765884367809
Overall public transport vehicle occupancypersons/unit22.622.016.314.416.118.315.216.27.29.9
Overall public transport seat occupancy%31%25%26%19%25%25%25%33%10%19%
Passenger car passenger kilometers per capitap.km/person6630683966896734686267516131704873617902
Percentage of total daily trip by non motorised modes%22.1%31.2%26.3%33.0%23.0%27.1%46.8%32.7%34.0%21.2%
Percentage of total daily trip by motorised public modes%31.6%17.6%20.0%9.7%18.0%19.4%14.1%6.7%9.0%9.6%
Proportion of total motorised passenger kilometers on
public transport
%27.8%17.4%17.8%11.4%18.7%18.6%22.2%11.1%4.7%9.2%
Ratio of public versus private transport speedsratio0.911.140.791.270.810.981.250.790.710.90
Ratio of segregated public transport infrastructure versus
expressways
ratio1.690.960.751.411.511.265.4810.342.327.67
VariableUnitsUmeåFreiburgSWE SMALLSWE ALLUSAAUSCANEURASIAALL
Urban densitypersons/ha11.546.014.016.915.414.025.847.9217.342.2
Proportion of jobs in CBD%13.7%16.3%18.3%17.3%8.2%12.7%15.0%18.3%9.1%14.5%
Metropolitan gross domestic product per capitaUSD 1995$29,415$25,782$30,001$33,197$44,455$32,194$31,263$38,683$21,201$37,700
Length of freeway per personm/ person0.0000.0630.2530.2420.1560.0830.1570.0940.0260.112
Parking spaces per 1000 CBD jobsspaces/1000 jobs240271332289487298319248121314
Passenger cars per 1000 personsunits/1000 persons43539344043164064752246378512
Average speed of the road network (24/7)km/h46.729.947.842.650.442.845.434.330.640.2
Total length of public transport lines per 1000 personsm/1000 persons18,969513111,1888163138226092496318326142576
Total length of reserved public transport routes per
1000 persons
m/1000 persons18784111123705721606729834188
Total public transport seat kilometers of service per capitaseat km/person4963395745465341187440772368612672674486
Overall average speed of public transportkm/h34.032.142.239.227.333.025.729.826.328.8
Average speed of buseskm/h31.226.133.430.319.923.422.421.919.421.5
Average speed of suburban railkm/h90.450.689.680.557.347.644.752.150.851.7
Total public transport boardings per capitaboardings/person45192611176796151386450254
Total public transport passenger kilometers per capitap.km/person11171375988129157110751031223437861644
Overall public transport vehicle occupancypersons/unit12.322.612.115.213.118.119.821.028.119.0
Overall public transport seat occupancy%23%35%22%24%29%27%44%39%52%37%
Passenger car passenger kilometers per capitap.km/person668068997024688818,70312,44784956817197510,234
Percentage of total daily trip by non motorised modes%29.3%63.0%32.8%30.0%9.5%14.2%11.6%34.5%26.1%23.2%
Percentage of total daily trip by motorised public modes%6.9%16.0%9.3%14.3%5.5%7.5%13.1%22.4%46.0%16.8%
Proportion of total motorised passenger kilometers on
public transport
%14.2%16.4%12.3%15.5%3.2%8.0%11.3%24.5%62.9%18.0%
Ratio of public versus private transport speedsratio0.731.070.880.930.550.780.570.880.860.75
Ratio of segregated public transport infrastructure versus
expressways
ratio-19.106.453.210.561.980.565.511.423.16
Table 3. Energy consumption data for the ten Swedish cities, Freiburg and world cities. Reprinted from [49].
VariableUnitsStockholmMalmöGöteborgLinköpingHelsingborgSWE LARGEUppsalaVästeråsÖrebroJönköping
Private passenger transport energy use per capitaMJ/person12,05115,67015,90518,12417,68115,88612,15714,03017,09521,678
Public transport energy use per capitaMJ/person19491310159711791819157114239398622050
Total passenger transport energy use per capita
(private plus public)
MJ/person14,00016,98017,50219,30419,50017,45713,58014,96917,95723,728
Energy use per private passenger vehicle kilometerMJ/km2.42.93.13.53.33.12.52.63.33.6
Energy use per public transport vehicle kilometerMJ/km17.119.917.819.318.418.212.217.216.825.0
* Energy use per bus vehicle kilometerMJ/km20.017.215.417.517.217.413.317.017.932.1
* Energy use per minibus vehicle kilometerMJ/km----------
* Energy use per tram wagon kilometerMJ/km----------
* Energy use per light rail wagon kilometerMJ/km10.5-14.011.1-11.9----
* Energy use per metro wagon kilometerMJ/km7.8----7.8----
* Energy use per suburban rail wagon kilometerMJ/km38.328.733.230.128.731.89.318.05.012.7
* Energy use per ferry vessel kilometerMJ/km230.4-243.4--236.9----
Energy use per private passenger kilometerMJ/p.km1.822.292.382.692.582.351.981.992.322.74
Energy use per public transport passenger kilometerMJ/p.km0.760.901.091.341.141.000.811.062.352.53
* Energy use per bus passenger kilometerMJ/p.km1.371.671.451.651.571.541.331.402.643.43
* Energy use per minibus passenger kilometerMJ/p.km----------
* Energy use per tram passenger kilometerMJ/p.km----------
* Energy use per light rail passenger kilometerMJ/p.km0.52-0.470.80-0.60----
* Energy use per metro passenger kilometerMJ/p.km0.39----0.39----
* Energy use per suburban rail passenger kilometerMJ/p.km0.390.470.660.740.480.550.320.520.461.18
* Energy use per ferry passenger kilometerMJ/p.km6.88-8.66--7.77----
VariableUnitsUmeåFreiburgSWE SMALLSWE ALLUSAAUSCANEURASIAALL
Private passenger transport energy use per capitaMJ/person11,62216,48815,31715,60153,44135,97230,80415,795607628,301
Public transport energy use per capitaMJ/person113210811281142696310361190153226911360
Total passenger transport energy use per capita
(private plus public)
MJ/person12,75417,56916,59817,02754,40337,00831,99417,326876829,661
Energy use per private passenger vehicle kilometerMJ/km2.33.12.93.04.14.14.93.14.83.8
Energy use per public transport vehicle kilometerMJ/km12.517.816.217.324.617.323.014.719.618.6
* Energy use per bus vehicle kilometerMJ/km12.017.918.518.031.321.924.918.823.523.1
* Energy use per minibus vehicle kilometerMJ/km----13.2---9.512.9
* Energy use per tram wagon kilometerMJ/km----19.911.214.214.95.414.4
* Energy use per light rail wagon kilometerMJ/km-13.0-11.915.310.518.211.714.313.3
* Energy use per metro wagon kilometerMJ/km---7.816.122.613.59.318.712.7
* Energy use per suburban rail wagon kilometerMJ/km22.419.013.522.650.411.943.015.614.823.9
* Energy use per ferry vessel kilometerMJ/km---236.91073.3140.7283.5141.0641.4358.8
Energy use per private passenger kilometerMJ/p.km1.742.392.182.272.852.873.792.303.312.72
Energy use per public transport passenger kilometerMJ/p.km1.010.791.301.102.090.971.180.760.701.16
* Energy use per bus passenger kilometerMJ/p.km1.061.661.971.762.971.871.571.310.951.78
* Energy use per minibus passenger kilometerMJ/p.km----7.68---1.967.16
* Energy use per tram passenger kilometerMJ/p.km----1.020.480.270.730.240.65
* Energy use per light rail passenger kilometerMJ/p.km-0.33-0.600.640.581.070.530.550.63
* Energy use per metro passenger kilometerMJ/p.km---0.390.690.750.640.420.340.52
* Energy use per suburban rail passenger kilometerMJ/p.km0.680.650.640.591.290.491.170.600.270.76
* Energy use per ferry passenger kilometerMJ/p.km---7.776.802.531.234.884.264.60

5. Transport Energy Conservation Potential in Swedish Cities

This section explores how much transport energy might be saved through increasing the occupancy of public transport and boosting the use of non-motorized modes, compared to increasing the occupancy of cars or improving their technological fuel-efficiency. Both public transport and cars in Swedish cities have significant underutilized capacity due to low occupancies, which, if better utilized, would be able to reduce the amount of energy expended in urban transport. Public transport vehicles particularly have a lot of underutilized capacity, with buses in the ten Swedish cities averaging annually only 22% of seats occupied, light rail with 31%, metro 42%, suburban rail 25% and ferries 16%. Of course, this seat occupancy varies with some peak period problems, at least in the bigger cities. Cars have an average occupancy in Swedish cities of only 1.31. To explore the effects of different changes, five simple scenarios were tested to compare the results. These were:
(1)
Increase the seat occupancy for each public transport mode in each Swedish city up to the average for 20 European metropolitan areas in 2005 (the same metropolitan areas used to create the European averages in Table 2 and Table 3). This of course yields a different number of passenger kilometers travelled in public transport in each city.
(2)
Double the present seat occupancy for each public transport mode in each Swedish city.
(3)
Increase car occupancy by 10% (which brings car occupancies in Swedish cities up to average typical levels found in other cities worldwide, i.e., generally approximately 1.40 to 1.45 on a 24 h/7-day basis).
(4)
Decrease the present fuel consumption per kilometer by petrol and diesel cars in each city by 15%.
(5)
Increase the modal split for walking and cycling to 50% of all daily trips in each city.
Each scenario is explained in more detail below.

5.1. Scenario 1: Increase the Seat Occupancy of Each Public Transport Mode to Average European Levels

In European cities, the average seat occupancy for each mode in 2005 was buses 35%, light rail 48%, metro 60% and suburban rail 35%. Ferries were not considered in this analysis because they hardly feature in the Swedish cities. In the one case in one city, where the resulting seat occupancy was less than the existing one, no change was made (Västerås suburban rail was already 51%). The new seat occupancy was applied to the per capita seat kilometers for that mode to derive a new per capita passenger kilometer figure. The extra passenger km for each mode was then calculated and a new total public transport passenger kilometers per capita was established. Dividing this by the overall average distance travelled per boarding by public transport in each Swedish city, the number of new public transport boardings was calculated.
It was assumed that this extra travel on public transport would come from trips no longer driven in cars. Whilst this might be considered too optimistic and other possibilities could exist (e.g., taking trips from walk or cycle modes or simply new generated trips on public transport), the aim here was to test theoretically what changes could occur in per capita energy use in private passenger transport if there was simply less car use and more public transport use, which was shown previously to be a major aim in Sweden. Such a scenario could occur, for example, with strong restrictions being placed on car ownership and use, a policy which makes sense for many reasons (lower congestion, less noise and emissions, lower impacts on urban public space, fewer accidents and deaths, etc.). Cities such as Singapore, Shanghai and Beijing already have such schemes, which work effectively to reduce car ownership and use [45]. This and other efforts to increase use of public transport in Sweden are discussed further in Section 6.
Additionally, it is assumed that there is no increase in energy use by public transport from an increase in passenger loadings (e.g., from marginally higher weight of public transport vehicles due to higher occupancy). In any case, such an effect would be very minor due to the small amount of public transport energy use per capita compared to private transport energy use per capita (Table 3).
The methodology here was then to calculate the reduction in per capita car passenger kilometers by multiplying the number of new public transport boardings by the average car trip length in each Swedish city (this assumes that each new boarding on public transport would replace one average car trip). A new per capita car passenger kilometer figure for each city was then derived and by multiplying these figures by the energy consumption per car passenger kilometer in each city in 2015, a new total private transport energy use per capita was calculated for each Swedish city.

5.2. Scenario 2: Double the Current Seat Occupancy of Each Public Transport Mode in Each Swedish City

The next scenario was undertaken in the same way as scenario 1 except with a stronger increase in the seat occupancy of public transport vehicles. Even though this represents a significant change in the seat occupancy of public transport in Swedish cities, the results do not exceed seat occupancies of the different public transport modes that can be found in various cities around the world.
In 2008, a national goal to double the number of trips in public transport (between 2006 and 2020) was agreed upon among Swedish public transport operators and public transport authorities. The goal was later changed to double the share of public transport trips and in 2015 the Swedish parliament endorsed this goal [56].
Furthermore, both scenarios 1 and 2 are conservative because they overlook the very significant transit leverage effect which effectively means that one extra passenger kilometer by public transport replaces multiple passenger kilometers by car due to the trip chaining effect when people use public transport (e.g., a work trip might also involve dropping off or picking up children at school on the way to a public transport stop, doing some grocery shopping, having a coffee with a friend, and visiting a doctor). It is not a simple one-to-one substitution because these other trips are often achieved by individual car trips. However, to make the scenario more conservative, only a simple one-to-one substitution is assumed [11,57].

5.3. Scenario 3: Increase Car Occupancy by 10%

It has frequently been said that simply increasing car occupancy can help to save energy and this has been attempted in many cities over decades in the form of, for example, high-occupancy vehicle lanes (HOV) on freeways in American cities, van-pooling and car-pooling initiatives [58]. In practice, it is quite difficult for people to organize their lives around the travel demands and times of other people, such that these “car-pooling” initiatives have met with only limited success and the single-occupant vehicle is all too frequently the norm, especially in peak hours. At least in Western cities, 24 h/7-day car occupancies generally do not exceed 1.5 and are much lower for the journey to work (1.1–1.2 at best).
In 2005, the data showed that the average car occupancy in American, Australian, Canadian, European and Asian cities for all trips, covering the entire week, 24 h per day, was 1.43, 1.43, 1.30, 1.38 and 1.48, respectively, with a global average of 1.39. In 2015, average Swedish car occupancy in these ten cities was 1.31. Therefore, a 10% increase in car occupancy in each city would raise average Swedish car occupancy to 1.44, or approximately 4% more than the average of 1.39 from cities around the world in 2005. It would be very like car occupancies found in American and Australian cities in 2005–2006. As such, the scenario seems entirely reasonable and possibly achievable. Further discussion is provided in Section 6.
Using this scenario of increasing car occupancy by 10%, the average energy consumption per passenger km in cars in each city was therefore reduced by 10% and a new per capita transport energy use figure was derived for each Swedish city.

5.4. Scenario 4: Decrease the Fuel Consumption per Vehicle Kilometer Travelled by 15%

For decades, new vehicle technologies and car designs have aimed to reduce the liters per 100 km of petrol, diesel or gaseous fuels consumed by vehicles. A main approach has been to reduce vehicle size and weight. These approaches have been successful to a degree, but over the same period, power consuming extras in all vehicles have also become the norm (e.g., air-conditioning and power steering). There have also been significant returns in many countries to heavier, more fuel-consuming vehicles, especially the now ubiquitous Sports Utility Vehicle (SUV). Ford USA is now only producing SUV passenger cars [59]. Saving energy through technological means is thus an admirable and important endeavor, but the ultimate effect in terms of how much fuel gets saved overall, may be not as high as might be expected (e.g., rebound effects from greater fuel-efficiency leading to more driving [60]).
American cities from 1995 to 2005 grew by 2% in car vehicle kilometers per capita but declined by 11% in per capita private passenger transport energy use per capita. American cars have historically been the biggest and most wasteful of fuel so that there was a lot to be gained over that ten-year period by downsizing of vehicles and making them more fuel efficient [52,61].
On the other hand, Australian cities increased their per capita private passenger transport energy use from 1995 to 2005 by 16%, while car VKT per capita increased by 14%. Not only did car use increases explain an increase in energy use per person, but the cars themselves, for whatever reason, became more energy-hungry, not less. This could have been related to the fleet mix or perhaps increasing congestion.
Furthermore, Komiyana and Kraines [62] show the potential of different changes to vehicle technology to save energy, demonstrating that a 15% saving in fuel use per kilometer in regular cars is entirely feasible. For example, Gasoline Direct fuel injection saves 25% on fuel use compared to ordinary gasoline engines, hybrid cars using regenerative braking can cut fuel use per kilometer by more than 15% and vehicle weight reductions provide dramatic fuel savings. Vehicles weighing approximately 750 kg consume approximately 4 liters per 100 km, while vehicles weighing approximately 2500 kg consume approximately 17 liters per 100 km and the regression between weight of the vehicle and fuel use per 100 km is a very strong linear relationship [62] (Figure 4.2, p. 67). Finally, these authors conclude, looking at possibilities for advances in automotive technologies, that a passenger car by 2050 may consume only one-quarter of the energy needed per km than the same vehicle in 1995 (or a 75% saving). The feasibility of this scenario for Sweden is discussed in Section 6.
Of course, since 2008 when the above paper was published and today, the discussion has shifted very significantly to electric vehicles (EVs) and how these might gain greater market share and thus replace petrol and diesel-driven cars altogether. The question is how fast can electric cars be expected to phase out the internal combustion engine? In China, which is the world’s largest car market, Mobility Foresights [63] shows that 2020 saw the sale of 1.4 million EVs out of total car sales of 25.3 million (5.5% of China’s car sales and below the government-stipulated quota of 8% for EVs). There appears therefore globally to be still a lot of momentum in the sale of traditional cars, hence scenario 4 seems to be still an entirely reasonable prospect.
In Sweden, data from Statistics Sweden [64] provided in Table 4, shows that between January 2006 and the end of October 2021 there was a cumulative total of 5,152,423 new cars registered in Sweden, of which 2.1% were wholly electric cars, 3.4% were electric hybrids, and 4.2% were plug-in electric hybrid cars, for a total percentage of electric vehicles of 9.7% over a period of 15 years and 10 months. Of the total new cars registered in that period 84.6% were petrol and diesel. It shows that of the three types of electric propulsion, the hybrid electrics are the most popular, indicating still a significant commitment to fossil fuels for part of the required energy to run cars. Only 2.1% of new registered cars over that almost 16-year period ran solely on electric power.
Notwithstanding this relatively nominal overall penetration rate of electric vehicles so far, their contribution to new car sales in Sweden has been accelerating due mainly to some significant government financial incentives such as the Bonus Malus scheme which provides a grant of 60,000 SEK (approximately 6000€) for up to 25% of the new car’s purchase price for low CO2 emissions vehicles [65].
Figure 1 shows the significant growth in the electric vehicle contribution to the total of new registered vehicles between January 2006 and October 2021. In 2006 only 0.9% of total new registered cars were electric, while in the first 10 months of 2021 it was 48.7%, with the growth having really accelerated from 2017 onwards. This 48.7% share is distributed as over 32% combined hybrid electrics and plug-in hybrid electrics and only 16% wholly electric. This again demonstrates that there is a further transition period in electro-mobility in which cars will still use some fossil fuels and will need to try to minimize this consumption.
Table 4. Total new car registrations in Sweden by fuel type from January 2006 until October 2021.
Fuel Type of New Registered Cars in SwedenTotal New Cars Registered in 15 Years and 10 Months from January 2006 to October 2021Percentage of Total New Car Registrations
Petrol2,119,25441.1%
Diesel2,240,42143.5%
Electricity105,7692.1%
Electric hybrid174,0333.4%
Plug-in electric hybrid215,5824.2%
Ethanol/ethanol flexifuel230,0024.5%
Gas/gas flex66,8861.3%
Other fuels4760.0%
TOTAL5,152,423100.0%
Source: Table by authors from data in [64] Table TK1001AA, Transport Analysis section, Statistics Sweden accessed 22 November 2021.
Figure 1. The percentage of total new registered cars in Sweden from January 2006 to October 2021 that were electric (hybrid electric, plug-in hybrid electric or wholly electric). Source: Graph by authors from data in [64] Table TK1001AA, Transport Analysis section, Statistics Sweden, accessed on 22 November 2021.
Sustainability 14 00954 g001
However, the most important outcome in this discussion of electric cars in Sweden is the fact that in the 10 years from 2011 to 2020 the total percentage of the car fleet in Sweden that is electric has only grown from 0.5% to 6.2% (i.e., 308,485 electric cars out of a total in-use car fleet of 4,944,067 in 2020—electric hybrids, plug-in electric hybrids and wholly electric cars combined—data from Statistics Sweden Trafikanalys [66].
The importance of minimizing fossil fuel use in Sweden’s conventional car fleet will continue for a significant number of years to come, even with a high percentage of annual new car sales being electric of some description.

5.5. Scenario 5: Increase the Modal Split for Walking and Cycling to 50% of Daily Trips in Each City

This scenario increases the percentage of total daily trips by non-motorized modes in each of the ten cities to 50%. This scenario is not unfeasible considering that Freiburg in Germany in 2015 had 63.0% of trips by walking and cycling and Uppsala in the same year already had 46.8%. In 2015, each of the ten cities has its own unique percentage of daily trips by walking and by cycling, therefore walking and cycling are dealt with separately in this scenario. To achieve this, the extra percentage of non-motorized trips in each city, above what it was in 2015, was apportioned to walking and cycling in the same proportions as was evident in 2015. This in some way reflects the relative likelihood of new non-motorized trips in each city being by walking or by cycling.
From these percentages, the extra total number of walking trips and cycling trips in each city was calculated. The Swedish national travel survey shows that in Sweden, the average walking trip is 2.3 km in length and the average cycling trip length is 4.6 km. It should be noted that the average walk trip length includes walking the dog and for leisure and training and is therefore longer than for typical practical trips such as shopping. The next step was to posit that each new walking and cycling trip would be derived from existing car trips, since it is well known that many car trips are very short. The Swedish national travel survey also shows that from 2015 to 2016, the percentage of car trips in Sweden that were less than 2.4 km was 19% and a further 16% were 2.4 km to 4.6 km in length. It means that 35% of daily car trips have a length that is within average walking and cycling trip distances in Sweden, i.e., 4.03 million out of 11.52 million car trips [67].
The question then became: How many person-kilometers of car travel would be eliminated by these increases in walking and cycling trips? Generally, if a walking or cycling trip replaces an existing car trip for any purpose, the replaced car trip is likely to be of greater length than the walking or cycling trip that replaces it. The logic here is that for any trip purpose achieved by car, a person can choose more distant places due to the ease and rapidity of travel in a car. If the same trip purpose is to be achieved on foot or by bike, people will of necessity generally choose destinations that involve less travel distance, due to the slower speeds of walking and cycling, the greater physical effort required and the much lower weather protection than in a car. However, for the purposes of this scenario, it has been assumed, conservatively, that a car trip now achieved by walking would only have been 2.3 km in length and a car trip that is now by bike, would only have been 4.6 km. In other words, the scenario assumes the minimum amount of replaced car travel by not varying upwards, the car trip lengths of the car trips replaced by walking and cycling. From the amount of replaced car passenger kilometers travelled (PKT), a new annual car passenger kilometers for each city was derived.
After the new annual car PKT was determined, this figure was multiplied by the 2015 energy consumption per PKT for private passenger vehicles in each city (see Table 3) to arrive at a new total private passenger transport energy use for each city in megajoules. From this, a new annual per capita figure was derived for each city and the reduced MJ/person was converted to liters/person of gasoline equivalent. This procedure was used in the other scenarios as well. The final step in this scenario was to calculate the total liters of gasoline that could be saved per year in each city by increasing non-motorized trips to 50% of total trips. This was also the last step in the other four scenarios.
The feasibility of this scenario for walking and cycling in Swedish cities is discussed in detail in Section 6.

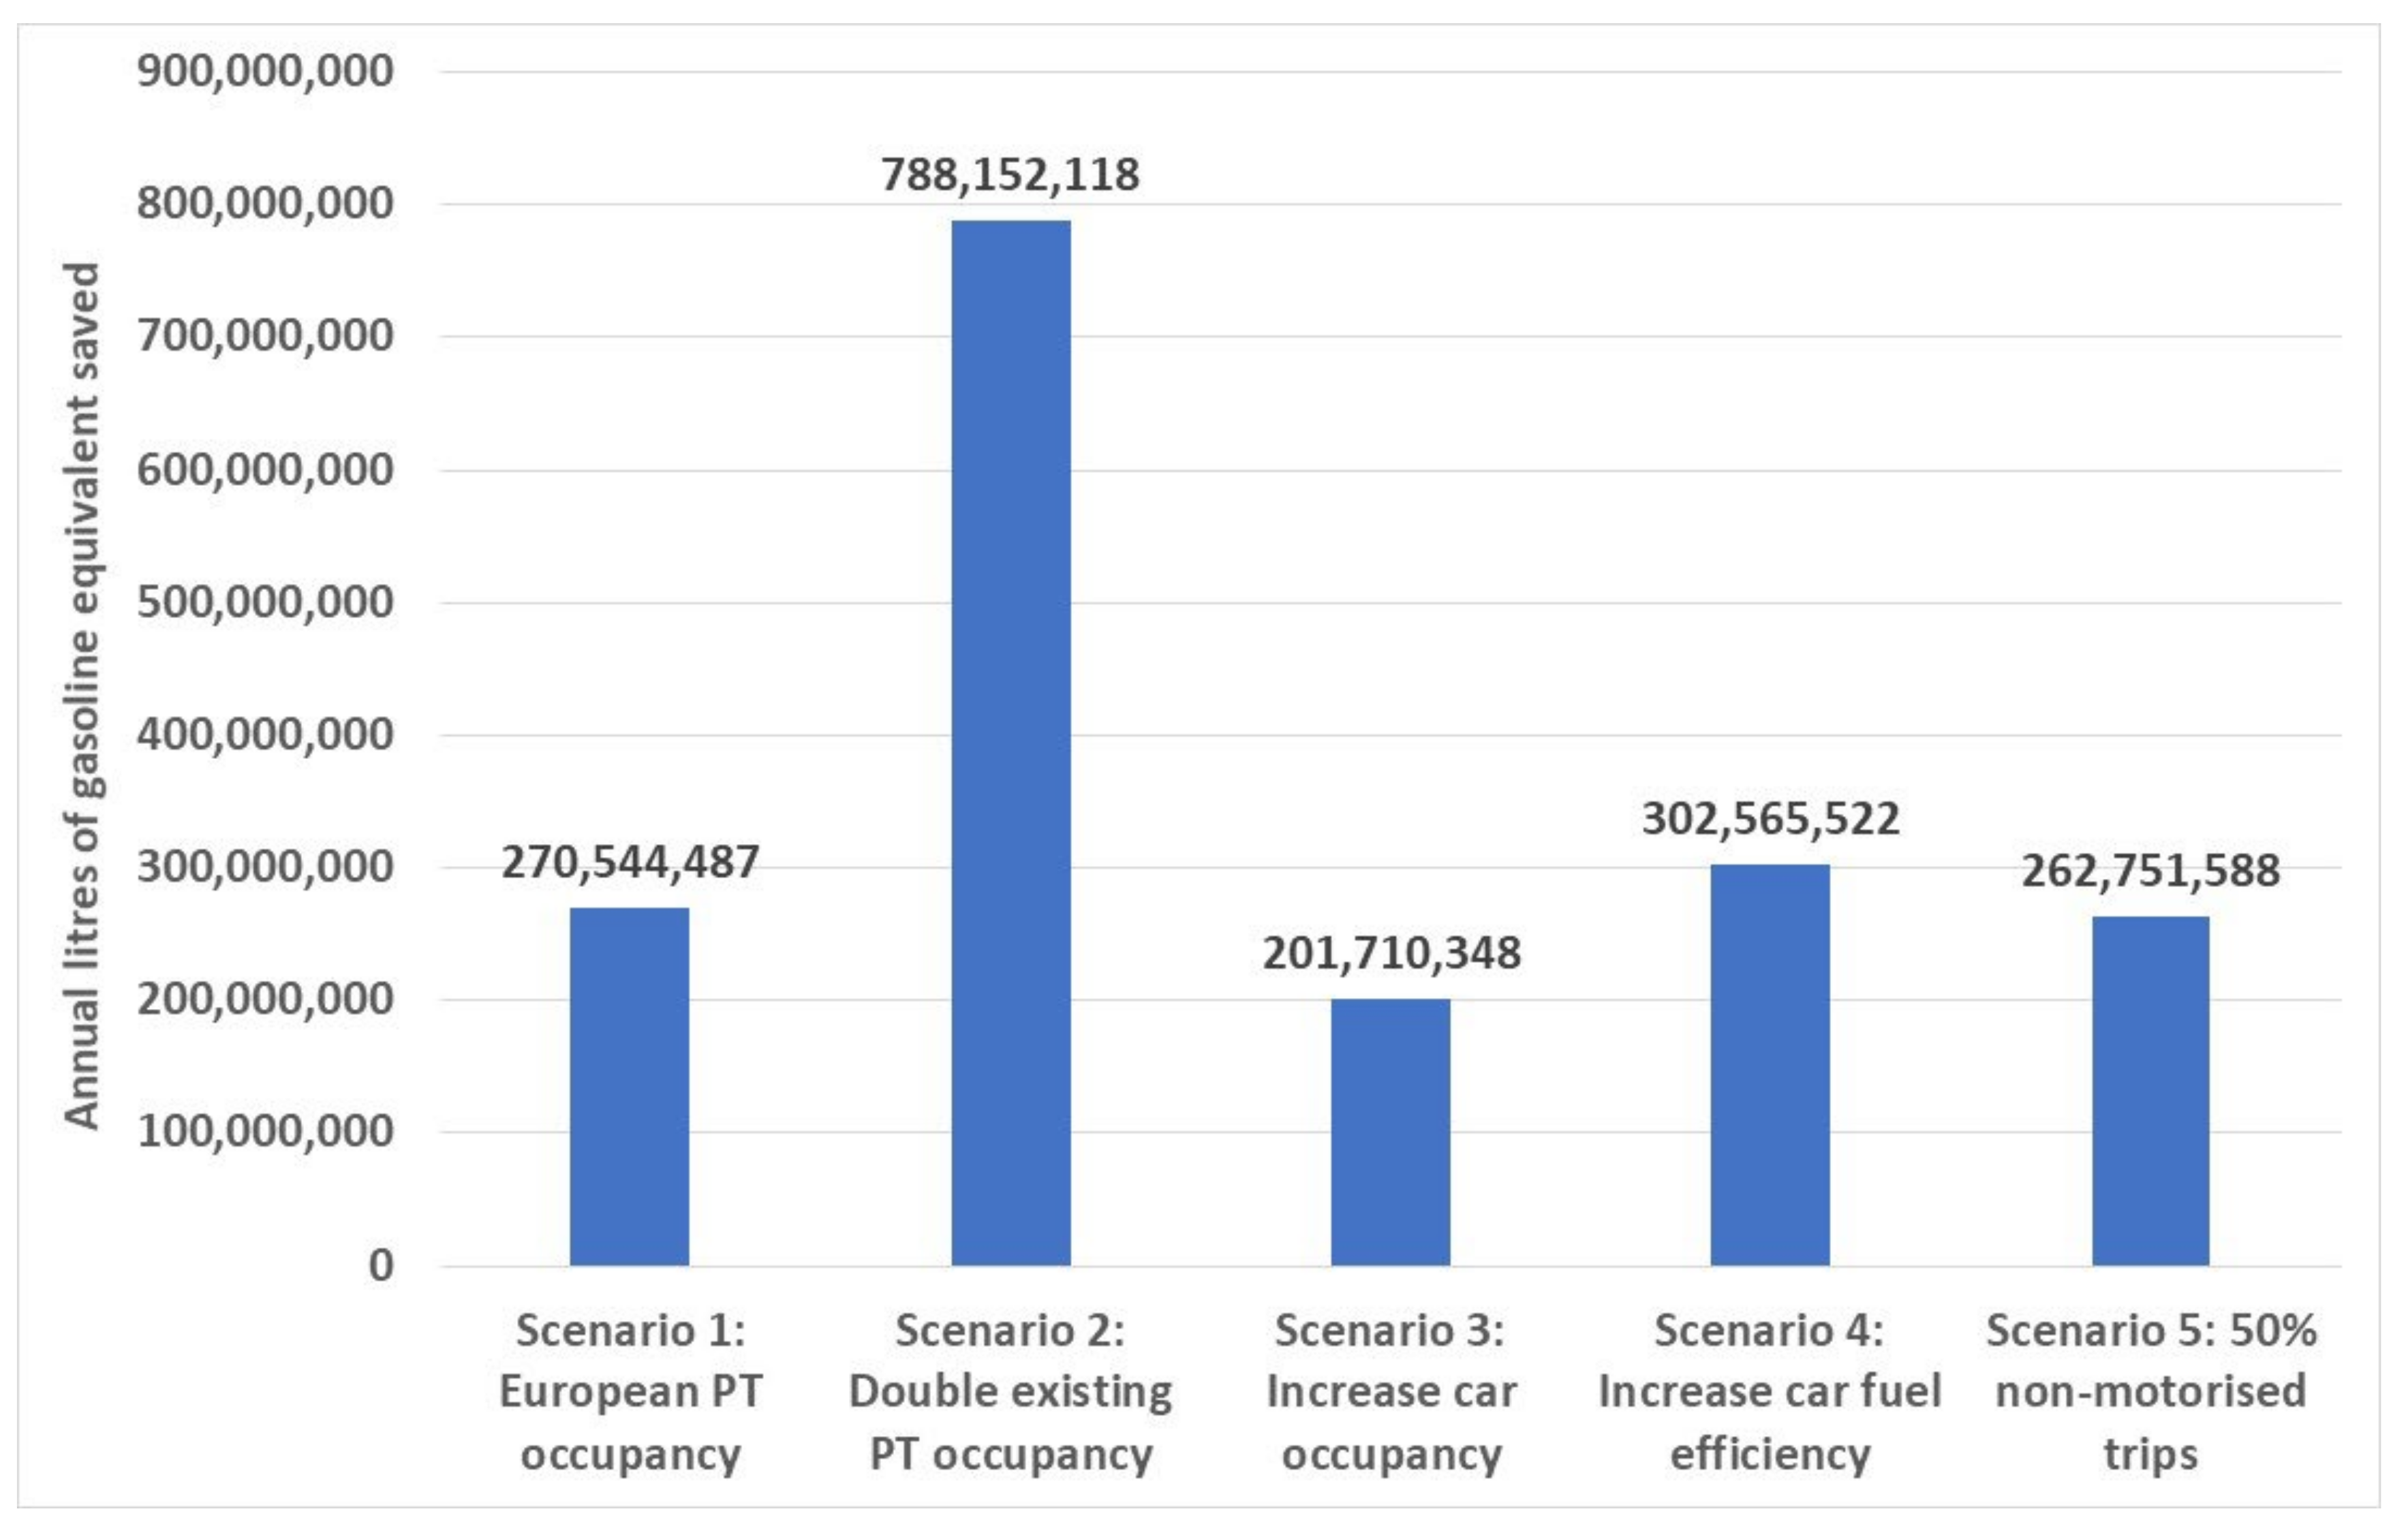
5.6. Results of The Scenarios: How Much Energy Can Be Saved through Different Approaches

This section provides the results of each scenario, including in each table, the relevant steps following the logic outlined in the previous section. A discussion of these results is provided.

5.6.1. Scenario 1

As explained in Section 5.1, this scenario increases the annual average public transport seat occupancy in each Swedish city to annual average European levels for each mode. Table 5 provides the results of this scenario. The table shows the annual reduction in car passenger kilometers per person and the new resulting figure. It also shows the additional annual public transport boardings and passenger kilometers per person and the new total figures for each, which are the result of applying the scenario. The table repeats the private passenger transport energy use per person in 2015 for each city from Table 3, provides the amount that this would be reduced by in each city and the new per capita figure. Finally, these energy values are converted to liters of gasoline using a 34.69 MJ/liter conversion factor and the per capita energy saving in liters is shown for each city, as well as the total annual liters of gasoline equivalent that would be saved. The final column provides an overall result for all ten cities.
Table 5 shows that these Swedish cities would reduce their per capita car PKT by an average of 612 km, their annual per capita public transport boardings would increase by an average of 56, their public transport PKT per capita would increase by 637 km and their per capita energy use would decline by an average of 1371 MJ, approximately a 9% saving. Collectively across all ten cities some 270.5 million liters of gasoline would be saved in one year, with Stockholm constituting 62% of this total (due mainly to its large population size compared to other Swedish cities). Stockholm would also experience the biggest percentage energy saving (21.5%) over its 2015 figure. Västerås on the other hand would have only a 189 MJ/person energy saving, or 1.4%.

5.6.2. Scenario 2

This scenario doubles the annual average seat occupancy in each public transport mode in each city, as explained in Section 5.2. The results are presented below in Table 6 in an identical way to Table 5.
The results from this scenario are very significantly better than scenario 1. The ten cities have on average reduced their per capita car PKT by 1664 km, their annual per capita boardings would increase by an average of 152, their public transport PKT per capita would increase by 1731 km and their per capita energy use would decline by an average of 3690 MJ or 24%. The total annual savings in gasoline equivalent for the ten cities would be 788.1 million liters, or nearly three times more than scenario 1. Again, Stockholm would be the main contributor to the total savings (494.4 million liters) and would have the biggest per capita energy saving (64%), while Göteborg, would save some 29% of its private passenger transport energy use per person. Västerås would again be the least successful (5%).
It needs to be said, however, that especially in Stockholm, during the height of the peaks, a doubling of usage would be uncomfortable or even impossible, even though there can still be standing places. The accepted number of people per square meter of standing space is not a universal constant but varies culturally. In Japan, 9 persons per square meter in the subway is “acceptable” or forced, while anecdotally, Chinese colleagues have mentioned figures as high as 12 persons standing per square meter in some Chinese urban buses. This would not be acceptable in Sweden. However, there is plenty of unused capacity in Swedish public transport in the reverse peak direction and in the off-peak, but to optimally utilize this implies some changes to urban land use to generate more off-peak and reverse peak travel demand.

5.6.3. Scenario 3

Scenario 3 called for an across-the-board increase in car occupancy in each city of 10%, bringing Swedish cities more in line with typical car occupancies found in other wealthy cities worldwide (see Section 5.3). This scenario, shown in Table 7 below, reduces the average energy use per car PKT for the ten cities from 2.27 to 2.04 MJ/PKT. It results in a reduction in the average per capita private transport energy use per person for the ten cities from 15,601 MJ/person to 14,041 MJ/person, or 1560 MJ/person less.
This scenario would save a total of 201.7 million liters of gasoline equivalent across the ten Swedish cities, which is significantly less than in scenarios 1 and 2. It should be noted that although on average the reduction in per capita energy use in scenario 3 is more than in scenario 1 (1560 cf. 1371 MJ/person), the fact that the reductions per capita between the scenarios differ greatly in each city, along with the respective populations to which that reduction applies, there is overall 68 million liters less total energy saved in scenario 3 than in scenario 1. Scenario 2 saves almost four times more total energy than scenario 3.
Table 5. Transport and energy results from application of scenario 1. Source: Authors.
VariableUnitsStockholmMalmöGöteborgLinköpingHelsingborgUppsalaVästeråsÖrebroJönköpingUmeåALL Cities
Reduction in car PKT per capitap.km/person1427481670547585564951040488219612
New car PKT per capitap.km/person52046358601961876277556769526321741464616276
Additional boardings per capitaboardings/
person
11843645560431096512556
New total boardings per capitaboardings/
person
4771542331192181506313511070173
Additional public transport PKT per capitap.km/person849556552756599698161895687614637
New total public transport passenger km per capitap.km/person34282007202016332188246210441263149617311927
Existing private passenger transport energy/person/annumMJ/person12,05115,67015,90518,12417,68112,15714,03017,09521,67811,62215,601
Reduction in private passenger transport energy/
person/annum
MJ/person259311021593147215081118189241513383811371
New private passenger transport energy use/
person/annum
MJ/person945814,56714,31216,65216,17311,03913,84014,68120,34111,24114,230
Percentage reduction in private transport energy use
per capita
%21.5%7.0%10.0%8.1%8.5%9.2%1.4%14.1%6.2%3.3%8.8%
Conversion of per capita energy saving to liters
(gasoline equivalent)
liters/person753246424332570391140
Total liters saved in one year
(gasoline equivalent)
million liters166.822.145.16.56.06.80.810.05.11.3270.5
Table 6. Transport and energy results from application of scenario 2. Source: Authors.
VariableUnitsStockholmMalmöGöteborgLinköpingHelsingborgUppsalaVästeråsÖrebroJönköpingUmeåALL Cities
Reduction in car PKT per capitap.km/person42291489197012351889177437319411256151664
New car PKT per capitap.km/person24025351472055004973435766755418677760645224
Additional boardings per capitaboardings/
person
3501321881251931343817811770152
New total boardings per capitaboardings/
person
70924335718935124291218176115269
Additional public transport PKT per capitap.km/person2518172016231707193221946291673158517231731
New total public transport passenger km per capitap.km/person50973172309025843522395915132040239428403021
Existing private passenger transport energy/
person/annum
MJ/person12,05115,67015,90518,12417,68112,15714,03017,09521,67811,62215,60
Reduction in private passenger transport energy/
person/annum
MJ/person7686341146833323486735187424511308610703690
New private passenger transport energy use/
person/annum
MJ/person436512,25911,22214,80112,8148,63913,28812,58418,59210,55211,912
Percentage reduction in private transport energy use per capita%63.8%21.8%29.4%18.3%27.5%28.9%5.3%26.4%14.2%9.2%24.5%
Conversion of per capita energy saving to liters
(gasoline equivalent)
liters/person2229813596140101211308931106
Total liters saved in one year
(gasoline equivalent)
million liters494.468.4132.614.619.321.33.118.711.93.788.1
Table 7. Transport and energy results from application of scenario 3. Source: Authors.
VariableUnitsStockholmMalmöGöteborgLinköpingHelsingborgUppsalaVästeråsÖrebroJönköpingUmeåALL Cities
Existing energy use per private passenger kilometerMJ/p.km1.822.292.382.692.581.981.992.322.741.742.27
New energy use per private passenger kilometerMJ/p.km1.642.062.142.422.321.781.792.092.471.572.04
New private passenger transport energy use/
person/annum
MJ/person10,84614,10314,31416,31215,91310,94212,62715,38619,51010,46014,041
Reduction in private passenger transport energy/
person/annum
MJ/person12051567159018121768121614031710216811621560
Percentage reduction in private transport energy use
per capita
%10.0%10.0%10.0%10.0%10.0%10.0%10.0%10.0%10.0%10.0%10.0%
Conversion of per capita energy saving to liters
(gasoline equivalent)
liters/
person
3545465251354049623445
Total liters saved in one year
(gasoline equivalent)
million
liters
77.531.445.08.07.07.45.97.18.34.0201.7

5.6.4. Scenario 4

In this scenario, the fleet average fuel consumption per vehicle km of cars would be improved by 15%. Table 8 contains these results and shows that the average per capita use of private transport energy in the ten cities would reduce to 13,261 MJ/person, down by 2340 MJ/person. Overall, in the ten cities some 302.6 million liters of gasoline equivalent would be saved, which is 11.8% more than in scenario 1.
However, scenario 2, involving a doubling of present public transport seat occupancy in each city, is still the best, with 788.1 million liters saved, or 2.6-fold more than scenario 4.
Table 8. Transport and energy results from application of scenario 4. Source: Authors.
VariableUnitsStockholmMalmöGöteborgLinköpingHelsingborgUppsalaVästeråsÖrebroJönköpingUmeåALL Cities
Existing energy use per private
passenger kilometer
MJ/
p.km
2.42.93.13.53.32.52.63.33.62.33.0
New energy use per private
passenger kilometer
MJ/
p.km
2.02.52.73.02.82.22.22.83.12.02.5
New private passenger transport
energy use/person/annum
MJ/
person
10,24313,31913,51915,40615,02910,33411,92514,53118,426987913,261
Reduction in private passenger transport energy/person/annumMJ/
person
18082350238627192652182421042564325217432340
Percentage reduction in private transport energy use per capita%15.0%15.0%15.0%15.0%15.0%15.0%15.0%15.0%15.0%15.0%15.0%
Conversion of per capita energy
saving to liters
(gasoline equivalent)
liters/
person
5268697876536174945067
Total liters saved in one year
(gasoline equivalent)
million
liters
116.347.167.612.010.511.08.810.712.56.1302.6

5.6.5. Scenario 5

The results for scenario 5, which increased the percentage of daily trips by non-motorized modes to 50% in each Swedish city, are displayed in Table 9, including some of the key data for the intermediate steps.
The overall result here is that the average annual private transport energy use per capita would reduce from 15,601 MJ to 13,763 MJ or a 12% saving. This saving varies from a low of 2% in Uppsala (due to the already very high use of non-motorized modes) up to 15% in Stockholm and 16% in Helsingborg. The total gasoline equivalent that could be saved using the most conservative assumptions, is estimated at 262.7 million liters.

6. Discussion and Implications of the Scenarios

6.1. Results of the Five Scenarios and a Combined “Best-Case” Sixth Scenario

This paper has provided five simple scenarios to assess the theoretical energy conserving potential of increasing the use of public transport and non-motorized modes and improving the occupancy of cars as well as their fuel efficiency, based on empirical data from ten Swedish cities in 2015. In this section, the results of a sixth, best-case scenario are also presented by combining scenarios 2 to 5 in a sequential way.
Figure 2 provides a summary of the total liters of gasoline equivalent fuel savings of each scenario. Each of these scenarios has been considered separately and with each change made in the five scenarios, other factors have been held constant in each city. So, for example, the fuel consumption rate of cars per passenger kilometer has remained the same while public transport seat occupancy has been increased in scenarios 1 and 2. Increasing the occupancy of cars has been tested as a singular change with no changes in the existing patterns of public transport or non-motorized mode use and changes in public transport seat occupancy have been considered independent of any changes in non-motorized mode use.
It is, however, possible to consider different combinations of each scenario or in a best case, combine four of the scenarios (making a choice between the more modest increase in public transport seat occupancy in scenario 1 and the doubling of the existing seat occupancy factor in each city in scenario 2). If for example, public transport seat occupancy in Swedish cities could be increased to average European levels (scenario 1) and non-motorized mode use could be increased to 50% (scenario 5) in each Swedish city (with different levels of the walking and cycling component in each city depending on existing patterns), while holding the car occupancy and car energy use/VKT factors to existing 2015 levels, theoretically 533.3 million liters of fuel could be saved. This is still well below, the more ambitious single target of doubling public transport seat occupancy, which would save 788.1 million liters.
The least fuel saving scenario is that of increasing car occupancy by 10% in each Swedish city to bring them in line with typical figures of approximately 1.40 to 1.45 found in other cities, while reducing the fuel consumption of cars by 15% through improving their technology would save approximately 32 million more liters than increasing public transport seat occupancy to the average European level. Of course, there are simplifying assumptions here, in for example, expecting that less fuel consumed per kilometer in cars will not encourage longer travel distances/greater car use due to lower fuel costs for individual motorists, thereby potentially wiping out some of those savings. As described in more detail in Section 6.2.4, Andersson et al. [68] demonstrate, based on a national Swedish sample of empirical data, that there is in fact an overall rebound effect of extra kilometers driven of 24%. However, no such effect is observed in the cohort of people who bought high fuel-efficiency, “green label” cars. In simple terms then, one might expect the fuel savings shown in Figure 2 for scenario 4 to possibly be approximately 24% lower. It is also assumed that higher seat occupancy of public transport can be maintained in the face of changing demographics, economic circumstances and health factors, such as in the COVID-19 pandemic which saw a steep trend away from public transport to bicycles, albeit maybe temporarily and which is yet to be fully reversed in many public transport systems [69].
A recent Swedish study shows that travel in public transport has decreased due to the coronavirus pandemic. For 2020, market share, as defined in the study, decreased from 32 percent in 2019 to 21 percent. The study also showed that among those who sometimes travel in public transport, over 60 percent say they are worried or somewhat worried about being infected with COVID-19 when travelling by public transport. This percentage increased slightly during the pandemic, leading some public transport users to turn to bikes and cars. Those who are still travelling are, however, as pleased with the service in 2020 as the year before [70]. Figures from Stockholm show that travel in public transport decreased by 50–60 percent during the period March to August 2020 [71].
Another simplifying assumption that was adopted to test the full extent of energy saving possibilities, was that all the new public transport and non-motorized mode use would come from reduced car use. In practice, such mode shifts are never that simple. Increases in public transport use can sometimes be drawn from walking and cycling and vice versa. Nevertheless, we can also envisage a combined scenario where scenarios 2 and 5 are applied in each city, which reduce the car passenger kilometers because the increased use of these modes is taken from car travel. We then can apply the 10% increase in car occupancy (scenario 3) and the 15% improvement in fuel use/VKT (scenario 4) to the remaining car travel to see how much further energy could be saved from these two strategies. Table 10 shows these results by selecting the relevant data from Table 6, Table 7, Table 8 and Table 9 and calculating some further data.
Firstly, the fuel savings from application of scenario 2 and 5 are recorded. Then, the reduction in total car PKT from both these scenarios is brought into the equation, yielding a new total car PKT for each city. The corresponding car VKT is then calculated for each city using the 2015 car occupancy. Applying the new car occupancy, which in scenario 3 has been increased by 10% in each city, yields a new reduced car annual VKT for each city. We then first apply the 2015 energy use in MJ/VKT to calculate the total energy use without the 15% improvement in car fuel consumption and the same calculation using the new, lower fuel consumption/VKT after the 15% improvement. From this a total energy saving in megajoules is calculated by subtracting one from the other and converting the result to liters of gasoline equivalent. In this way, the effects of scenarios 3 and 4 have been sequentially added to the effects from scenarios 2 and 5. The grand total is simply the sum of the results from the four scenarios.
The results in Table 10 show that across the ten cities some 1182.6 million liters of fuel could be saved. Compared to the actual total liters of fuel consumed in 2015 in private passenger transport in the ten cities of 2017.1 million liters, this represents almost a 60% saving in energy. To put this in more concrete terms, 1182.6 million liters is almost identical to the combined total private transport energy use of Stockholm, Malmö and Jönköping in 2015 (1172.6 million liters, gasoline equivalent). This best-case scenario, utilizing scenarios 2 to 5 together, thus represents a very significant saving in private passenger transport energy use in Sweden.
Such energy savings have important implications for CO2 generation. Using data from the United States Energy Information Administration [72], which shows 8.89 kg of CO2 per US gallon (3.785 liters or 2.35 kg per liter), 1,182,654,512 liters of gasoline equivalent translates to 2,779,238,103 kg of avoided CO2 (2.779 million metric tons) in the ten Swedish cities. This is equivalent to almost the same annual combined CO2 output from cars, light trucks and motorcycles in Stockholm and Göteborg in 2015 (2.852 million metric tons) and again would represent an important contribution in Sweden to reducing carbon emissions.

6.2. Policy Implications and Strategies to Achieve the Scenarios

The five scenarios depend upon increasing public transport and non-motorized mode use, reducing single-occupant car use and reducing the fuel consumption of cars per kilometer. Under the best-case scenario provided in Table 10 and the data in Figure 2, the doubling of public transport seat occupancy would produce 66.6% of the total energy savings, the increase in non-motorized trips would provide a further 22.2% of the total savings. The combined effects on the remaining car VKT of increased auto-occupancy of 10% and reduced vehicular energy use per VKT of 15% would contribute the remaining 11.2% of total energy savings.
For these changes to happen in Swedish cities, an overview is provided of some key principles that would need to be implemented simultaneously, together with their applicability and practicality in Swedish cities. Such changes are possible, given enough government commitment (national, regional and local municipalities) to the serious threat of climate change posed by present patterns of mobility. The ability to change quickly when human life is threatened has been proven in the COVID-19 pandemic and global climate change arguably represents a bigger threat.
Table 10. Transport and energy results from application of a combined best-case scenario (scenarios 2 to 5). Source: Authors.
VariableUnitsStockholmMalmöGöteborgLinköpingHelsingborgUppsalaVästeråsÖrebroJönköpingUmeåALL Cities
Scenario 2 total annual fuel savings (gasoline equivalent)million
litres
494.468.4132.614.619.421.33.118.811.93.7788.2
Scenario 5 total annual fuel savings (gasoline equivalent)million
litres
118.537.655.38.511.31.85.86.811.75.4262.7
Reduction in total car PKT from Scenario 2million
PKT
9436.41035.31935.2188.9260.5372.854.1280.1149.974.313.8
Reduction in total car PKT from Scenario 5million
PKT
2262.0568.6806.8109.6152.331.0101.1101.8148.5108.54390.2
New annual car PKTmillion
PKT
3096.83152.43829.3731.6533.6884.5868.2679.5755.0624.015,154.9
Car occupancy in 2015persons/
car
1.301.281.321.301.301.281.301.401.321.331.31
Car VKT that would have been driven in 2015million
VKT
2382.12462.82901.0562.8410.4691.0667.9485.4571.9469.111,604.4
New car occupancy after 10% increase (Scenario 3)persons/
car
1.431.411.451.431.431.411.431.541.451.461.44
New lower annual car VKT due to 10% increase in occupancymillion
VKT
2165.62239.02637.2511.6373.1628.2607.1441.2519.9426.510,549.4
Energy use per car VKT in 2015MJ/VKT2.42.93.13.53.32.52.63.33.62.33.0
Car energy use that would occur without 15% reduction in MJ/VKTmillion
MJ
5116.86565.98276.91789.91249.81594.51571.31434.71882.9986.930,469.6
Energy use per VKT after application of 15% reduction
(Scenario 4)
MJ/
VKT
2.02.52.73.02.82.22.22.83.12.02.5
Car energy use after 15% reduction in MJ/VKTmillion
MJ
4349.25581.07035.41521.51062.31355.31335.61219.51600.5838.925,899.1
Total energy saving on remaining car VKTmillion
MJ
767.5984.91241.5268.5187.5239.2235.7215.2282.4148.04570.4
Total energy saving on remaining car VKT after conversion to
gasoline equivalent
million
litres
22.128.435.87.75.46.96.86.28.14.3131.7
Grand total annual fuel savings (gasoline equivalent) from
Scenarios 2 to 5 combined
million
litres
635.0134.3223.730.936.130.015.731.831.713.41182.6

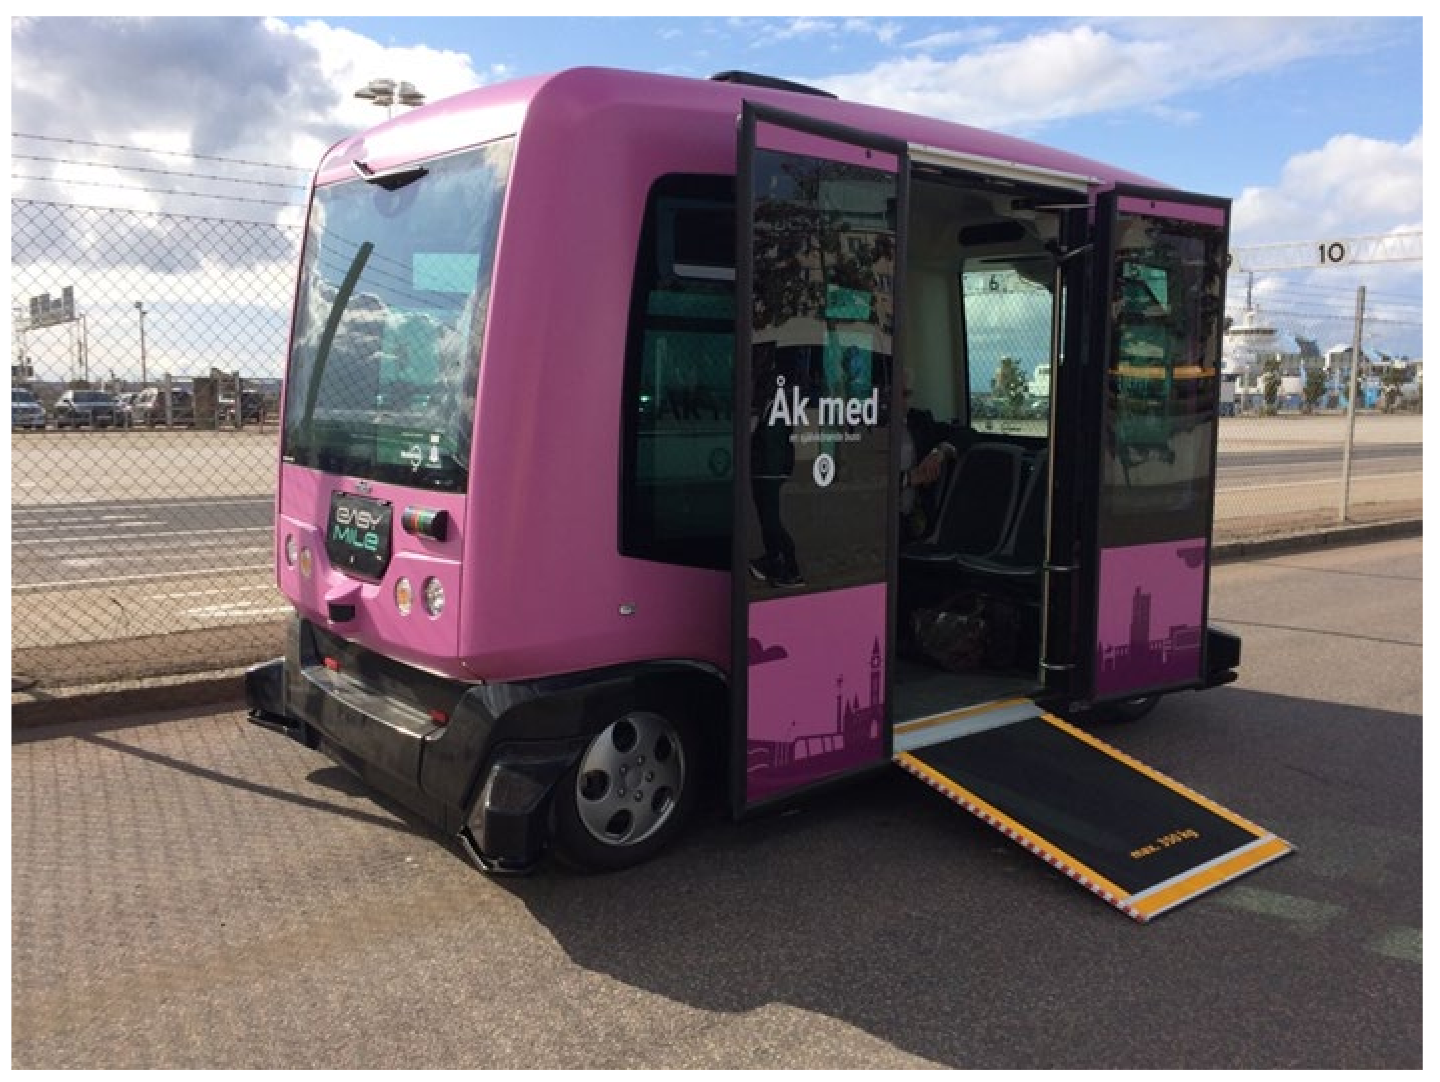
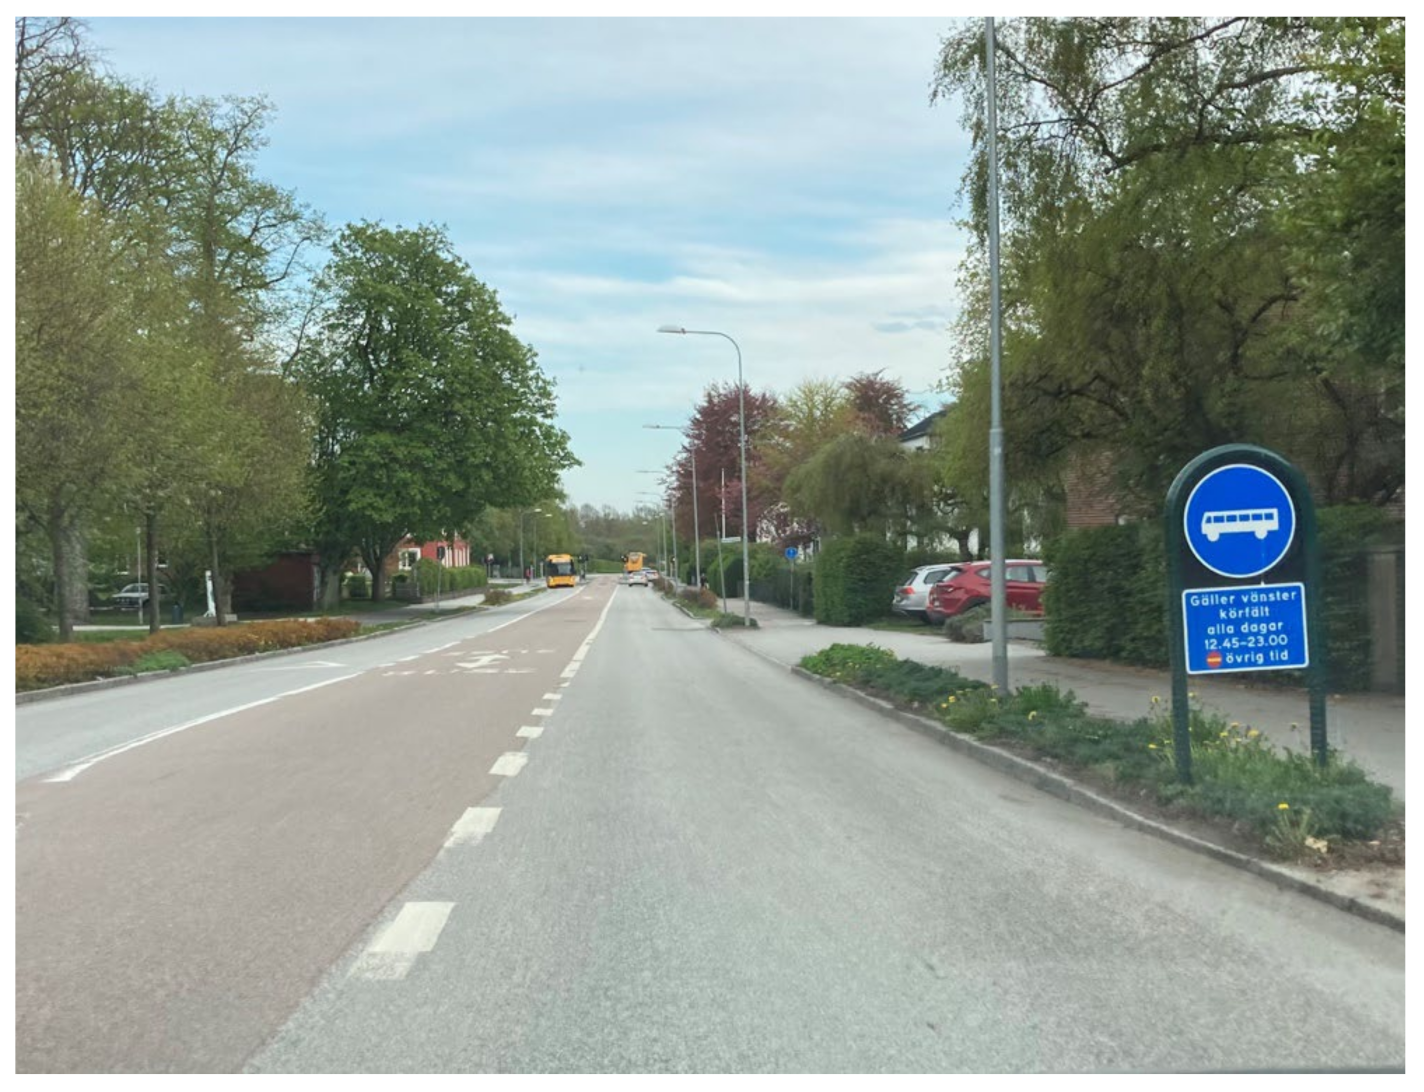
6.2.1. Getting More People to Use Public Transport

Achieving an increase in public transport use depends upon achieving excellence in all aspects of the public transport system, both “hardware” and “software” (carrots), which is mostly (but not completely) under the direct control of public transport agencies, but it will also depend upon disincentives towards car use (sticks). Cities generally are better at addressing the carrots than they are the sticks, with relatively few cities around the world with serious disincentives to car ownership and use (congestion pricing), Singapore, London, Stockholm, Milan, Oslo, Shanghai and Beijing being the more well-known exceptions. The advantages of some form of penalty for car use during congested times and a reward system for those choosing space-saving, road-based public transport (principally buses) is explained in detail by Bradley and Kenworthy [73]. There is a recognition that this lack of control on cars must change if public transport is to achieve higher modal share, with revenues derived from congestion charging to be spent on improving public transport [74].
In Sweden, there are no car limitation strategies such as in Singapore, but the national government is trying to get municipalities to prioritize sustainable transport modes instead of car use through the so-called Urban Environment Agreement which includes a contract between the municipality and the national government [43]. As well, Sweden has shown some willingness to limit cars in favor of public transport through congestion charging, initially as a trial in Stockholm in 2006, and made permanent in 2007. Studies showed that this led to traffic reductions which also increased slightly over the coming years, meaning that it was not only an instant change. Till the end of 2008 there was an exemption from the charge for vehicles using alternative fuel, which increased the sale of these types of vehicles [75]. The charges were also shown to be accepted both by politicians and the public [76]. Congestion charges were also introduced in Göteborg in 2013 and it was extended in Stockholm in 2016 with the peak charges increased in both cities over the years. A later study showed that the effects were larger during the first years, but acceptance among the public decreased and price elasticity was lowered at the end of a ten year follow up study [77].
The key “hardware” elements of public transport are the access ways to stations and stops, the stops themselves, the vehicles, the rights-of-way through which they operate and more broadly, the built environment they service [52]. To improve public transport, people must find it convenient and comfortable to get to public transport. For example, footpaths must be in good condition and preferably with dropped curbs leading to the stops to help ensure universal access. This is mostly the responsibility of city authorities. First and last-mile solutions for public transport are also important, with better bicycle integration being one key policy [78] and today, probably also other shared modes like e-scooters. Autonomous vehicles are increasingly being touted as possibilities for first and last-mile functions [79]. Figure 3 provides an example of the growth in e-scooters in Swedish cities, while Figure 4 shows an example of experimentation with autonomous vehicles for public transport use.
Once there, public transport stops and stations need to provide all the information and comfort needed to allow dignified and convenient use of the system (proper shelter, seating, maps, ticket access, direction of travel information, waste disposal, clear signage, paper or electronic timetables, ease of access into vehicles for all and in many cases attractive other elements such as greening initiatives, etc.). In very hot environments such as Dubai, bus stops are now sealed, air conditioned units which are pleasant to wait in. Similar passenger comfort initiatives at stops are probably warranted in colder climates and there are discussions about heated bus/train shelters in some places in Sweden.
All public transport vehicles should be of a high standard, clean, comfortable, modern, secure, air-conditioned/heated, adequate size for the service and time of day and the personnel operating them need to be professional and courteous. When in operation, public transport vehicles should be allowed the greatest degree of unimpeded, speedy movement as possible, which can only be achieved through fully reserved routes (bus and tram-only lanes for on-street operations, and the use of traditional rail modes such as metros). Where feasible, green-wave traffic signals for on-road public transport should also be used. For ten years, there has been a Swedish guideline for Bus Rapid Transit routes in Sweden [80], which is used by municipalities and Public Transport Authorities. van Lierop, Badami and El-Geneidy [81] provide a literature review of what determines users’ satisfaction and loyalty concerning public transport, which includes all the above factors. Figure 5 shows Malmö’s efforts to introduce higher capacity, more attractive buses to its network, Figure 6 depicts Stockholm’s efforts to create an extensive tram network and Figure 7 shows bus-only lanes in Lund.
Best practice in public transport is also dependent upon some “software” aspects, namely appropriate structuring of routes, timetables and fares, as well as effective overall marketing and management. These matters are discussed in detail in Schiller and Kenworthy [52]. For route structure, a time-pulsed transfer system based upon a polycentric network of public transport has been shown to be very effective in ensuring good cross-city travel as well as radial movement and minimal waiting time for connections. It is especially useful in smaller cities like those in Sweden [82]. Time-pulse transfer systems allow passengers to conveniently change directions at many points in the city and to travel around the city without the need to travel to the center and then out again.
Timetables work best for users when they have pulsed and regular departures such as a ten-minute rhythm throughout the day rather than reduced frequencies when demand is not high. Passengers need only learn the rhythm of the timetable at their stops, which is the same every hour so they do not need to consult timetables. Such systems also have no variations for the same line. Demand variation between peak and off-peak is handled by varying vehicle sizes such as fewer wagons on trains or smaller buses. Fare structures are superior when they provide large fare discounts to users who pre-purchase tickets (e.g., monthly or yearly tickets) and thus become committed users. Transferability of such weekly, monthly or yearly cards within households is also advantageous in encouraging their purchase and people’s commitment to public transport.
In some Swedish regions, it is possible to share monthly tickets within the family or between friends and during the coronavirus pandemic more types of tickets, like a 7-day ticket or a ticket for ten optional days within a month, have been introduced in some regions. A Government Inquiry about a national ticketing system covering all public transport in Sweden was finalized in 2020 [83]. The task was to propose how a system could be built up, regulated, financed and administered and the suggested way forward was a cloud-based digital system which should make it as easy to travel with public transport in Sweden as it is to use mobile phones.
Marketing and management of public transport is critical. One proven management way of achieving quantum jumps in all aspects of public transport, including building more extensive systems, gaining significant investment in public transport, better selling public transport and garnering continually higher usage is the Verkehrsverbund (transport community) prevalent in Germany, Austria and Switzerland [84].
Finally, it is critically important, especially in Sweden where densities are generally lower than in other European cities, to ensure more higher density, mixed-use development around as many stops and stations as possible. This can assist in raising off-peak usage of public transport, where most spare seat capacity exists, by having a greater diversity of uses that people need during the day, accessible by public transport. Additionally, having strong centers built around public transport can improve peak-period usage of public transport in the reverse direction, where spare capacity also exists, by generating better back-loading [11,47,51,54,55].
The issue here, as in many lower-density cities, is how best to achieve this while maintaining perceived living standards, comfort and a sense of community and belonging. Jordan Sand, a professor of Japanese history, provides an interesting insight into this question based on his experience living in Tokyo [85]. He promotes the idea of dense, low-rise urbanism in contrast to high-rise construction. Regardless of which approach is taken, any attempt at increasing density, must consider building typologies, green and urban open spaces, urban design, the relationship of residences to streets and the availability of good public transport to ensure mobility needs with less car ownership. Tokyo’s dense, low-rise urbanism is linked to a superb rail network, the proximity to which is the biggest determinant of land value [85].
Given the evidence in this paper and in [49] regarding the same ten Swedish cities, which has shown a combination of the need to address low densities in Swedish cities, the existing opportunities around rail stations to achieve such density increases, and the need to expand the availability and diversity of urban rail in Swedish cities, the above perspective is very useful. It offers the land use planning and urban design insights needed to build less car-dependent communities, increase public transport use (and non-motorized modes) while maintaining the possibility of a good quality of life.

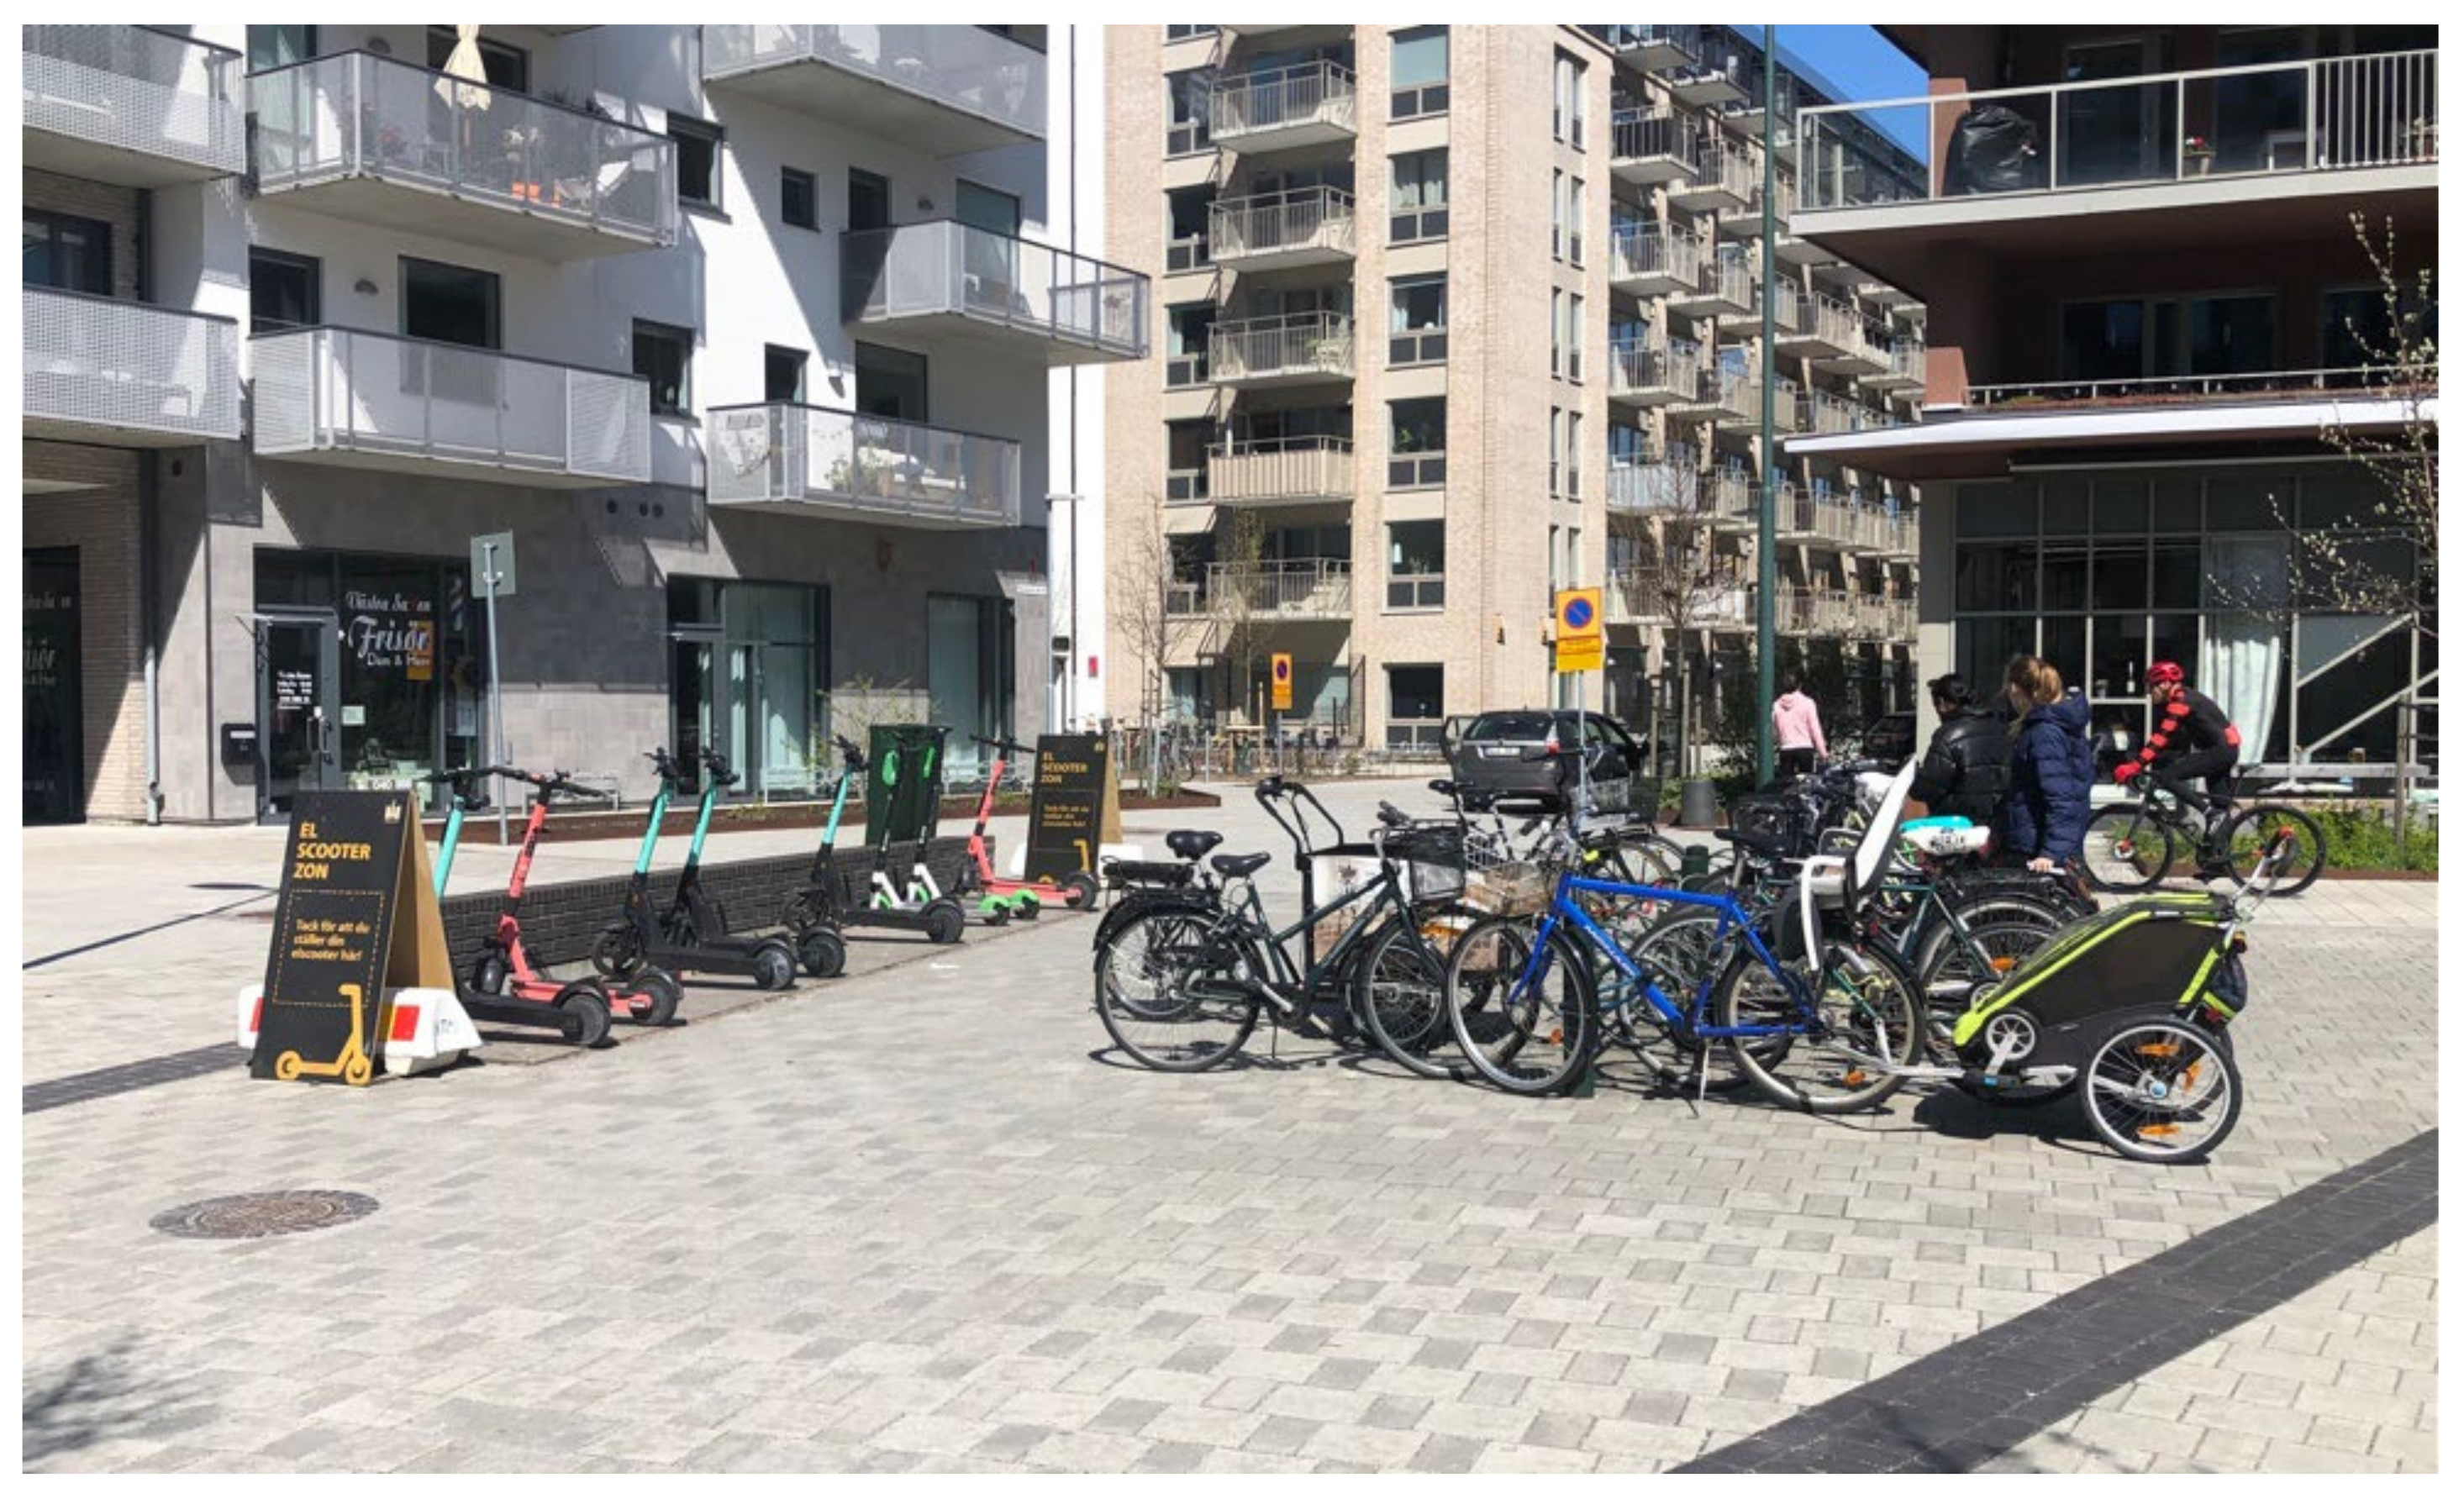
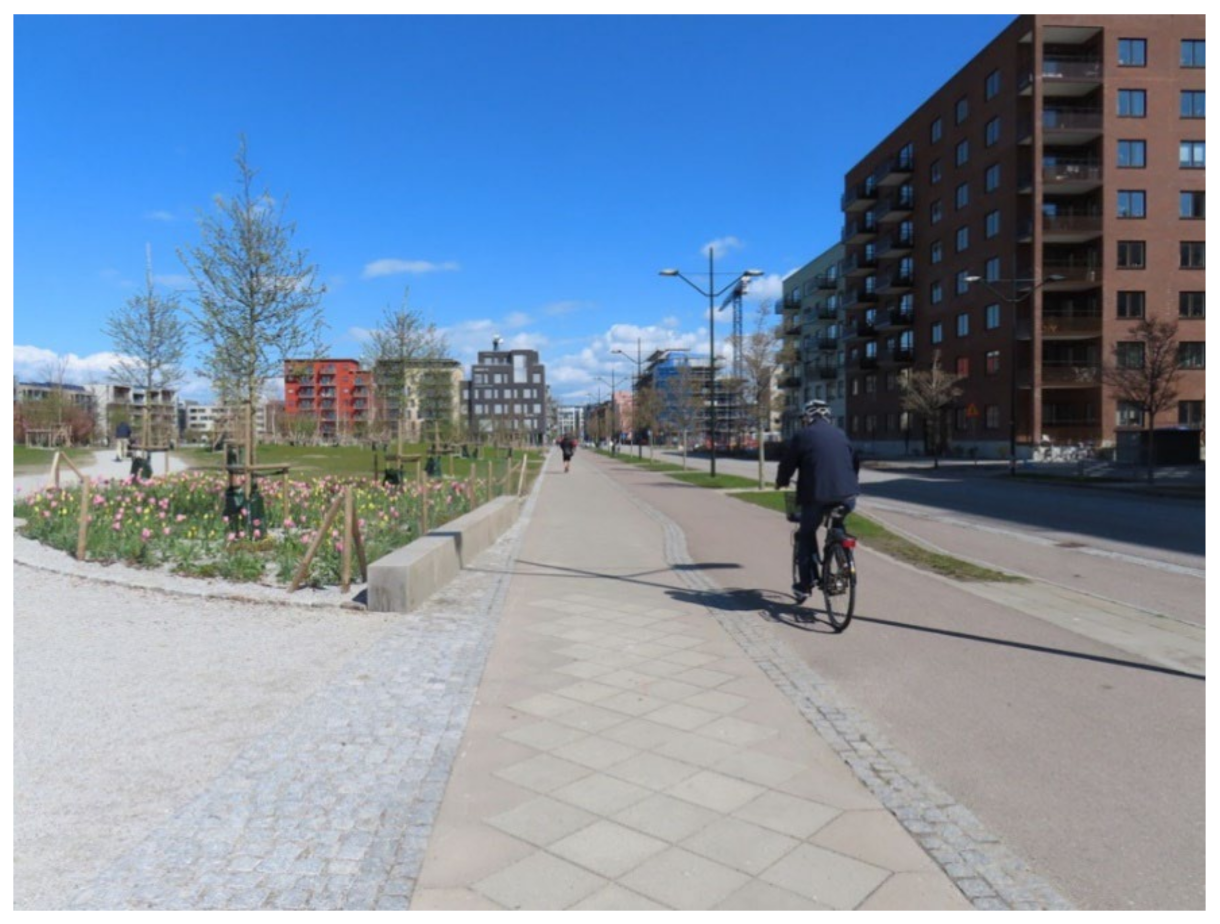
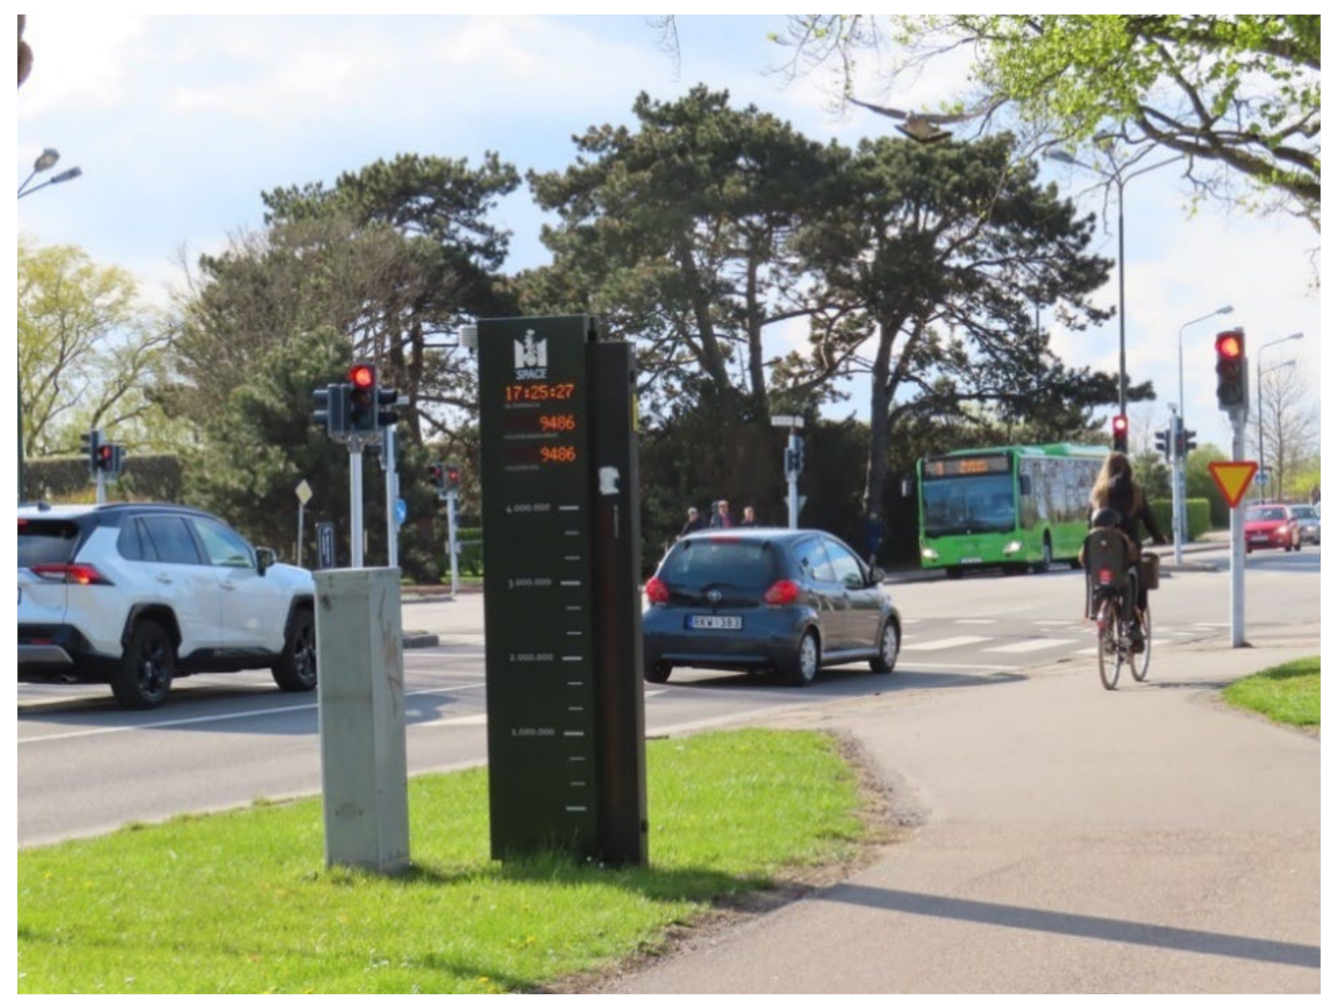
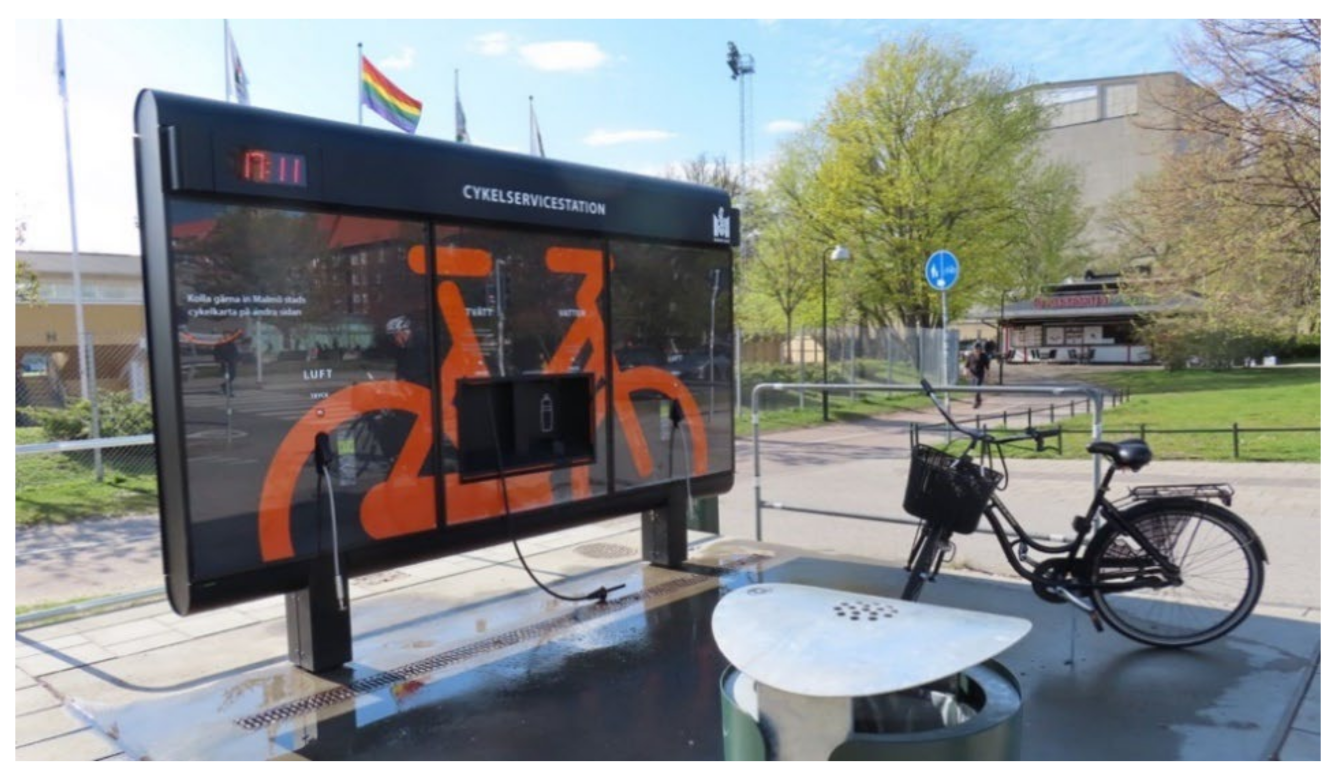
6.2.2. Increasing the Use of Walking and Cycling

For Swedish cities to increase their use of non-motorized modes to 50% of daily trips from their present 30% will require a more concerted focus on providing better, safer and more convenient conditions for pedestrians and cyclists, as well as disincentives for people using cars for short trips (up to approximately 5 km). Parking management has been shown to be a key means to discourage car use [86,87,88].

Walking

For pedestrians, systematic improvements are needed in all Swedish cities. A valuable framework for explaining such changes has been developed by Moura et al. [89] expressed as seven key concerns or “7Cs” specified by seventeen variables. These are:
C1: Connectivity—1. Pedestrian infrastructure continuity; 2. Path directness; 3. Accessible pedestrian network.
C2: Convenience—4. Land use diversity; 5. Sidewalk effective width; 6. Daily commerce and services.
C3: Comfort—7. Vigilance effect or perception by pedestrians; 8. Pavement quality.
C4: Conviviality—9. Meeting places; 10. Anchor places (e.g., shopping malls, public facilities, transport interfaces); 11. Service hours.
C5: Conspicuousness—12. Existence or visibility of landmarks (e.g., monuments, distinctive buildings, and squares) 13. Street toponomy (street names, signposting, wayfinding, etc.).
C6: Coexistence—14. Traffic safety (at pedestrian crossings); 15. Pedestrian crossing location (“desire lines”).
C7: Commitment—16. Enforcement of pedestrian regulations (law enforcement); 17. Existence of design standards and planned public space design interventions.
Buehler et al. [86] have shown the significant success in Berlin, Hamburg, Munich, Vienna and Zurich in increasing modal split for walking and cycling. The specific strategies that they found worked in these cities were pedestrianization, the success of which depended on the number of zones and the length and area of streets made car-free. All cities also employed traffic calming to reduce speed to a maximum of 30 km/h or even 20 km/h (shared streets) to 10 km/h (play streets) and gradually increased the percentage of their traffic-calmed road networks to between 50% (Hamburg and Zurich) and 85% (Munich). They also stressed the importance of strict training of motorists to obey and respect the rights of pedestrians and high standards to even obtain a driver’s license.
The critical importance of urban design in creating beautiful, attractive and safe urban environments for walking has been stressed by multiple authors [52] (Chapter 6), [90,91,92].
Sweden has a long history in traffic safety work and already in 1997, the government decided upon its Vision Zero for traffic safety saying that no one should be killed or seriously injured within the road traffic system. Although this goal was more focused on car drivers and passengers in the beginning, it has become more and more focused on vulnerable road users [93].
Sweden has also worked with accessibility for all and an inclusive walking environment for a long time [94]. In 2003, Sweden adopted two regulations (second legislation) saying that the public outdoor environment (including sidewalks, walkways, open areas, bus stops and stations) should be accessible for all people regardless of ability, not only when new infrastructure is built, but also existing infrastructure should be rebuilt and all barriers removed.
In 2004, the first version of the document Traffic for an Attractive City was launched by the Swedish Transport Administration and the Swedish Association of Local Authorities and Regions (SALAR). This is a handbook for transport planners on all levels, but mainly for the local level, where the focus is to put transport planning in a wider perspective and how to develop a more integrated and sustainable transport system in Swedish cities [95]. In 2008, the report Right Speed Limits in Cities [96] was launched and municipalities have since then considered and changed speed limits in cities. The focus was both to increase safety and to prioritize other modes than the car and the main message was to change the basic speed limit from 50 to 40 km/h and use 30 km/h at more places. Figure 8 shows the high-quality walking and cycling infrastructure provided for in Malmö’s redevelopment of its West Harbor area.

Cycling

Cycling requires a similar level of commitment and attention to detail in the provision of good infrastructure, both public and at places of business and work, as well as excellence in driver training of both cyclists and motorists to ensure safe cycling outcomes. Most Swedish cities have some significant cycling infrastructure but more can always be done. Comparisons between planning for cycling in Copenhagen and Stockholm, for example, show that Copenhagen has been much more consistent and long-term in their work with developing the bicycle infrastructure than Stockholm [97].
Specifically, if excellence is to be achieved, then the following factors all need to be attended to [86].
  • Bike route networks: These can extend to thousands of kilometers and require upgrading and good intersection treatments.
  • On-road bike lanes: These are very important to ensure cyclist safety and are best when painted a bright colour such as red or blue.
  • Traffic calming, bicycle-priority streets and shared-use paths, e.g., bi-directional travel for cyclists on one-way streets or streets with cyclist right-of-way over the entire street.
  • Signage and branding of bike routes: This greatly enhances the visibility of bike infrastructure and the cyclists themselves.
  • Route planning: On-line tools for use on smartphones that enable cyclists to choose the best route for themselves depending on their needs (directness, speed, safety, parking facilities, bike sharing, etc.).
  • Bike sharing: Docked and floating bike sharing systems (and today, e-scooters) encourage greater use of bikes and the increasing use of pedelecs (e-bikes) will enhance this.
  • Bike parking: This is a critical feature and successful bike cities provide abundant bicycle parking to ensure users have a place to safely and securely store their bikes. This includes all major destinations and land uses as well as at apartment buildings and at all public transport stations and stops.
  • Promotional events and education: This includes compulsory bike training in schools, voluntary training courses, mass bike rides, bike tours, bike fashion shows, and bike flea-markets.
  • Staffing and funding: Any successful bike mode share increase program needs enough dedicated, trained staff and enough funding to ensure proper expansion of infrastructure, planning and innovation (e.g., Berlin increased annual bike funding from 1 million Euros in 1995 to 15 million in 2015).
In the largest cities in Sweden there are now shared bike systems, both free floating and station-based. The way the systems have been implemented, they are mainly seen as a part of public transport rather than as a free-standing bicycle mode. The location of the stations seems to have been motivated by facilitating the flow of commuters and workers to public transport and to promote attractiveness and tourism [98]. With other business models, these systems could probably be useful also at other places.
On a broader scale in 2017, the Swedish parliament decided on a climate goal for the transport sector saying that greenhouse gas emissions from domestic transport (excluding domestic flights) should be reduced by at least 70 percent by 2030 compared to 2010. Even though Swedish municipalities already had started to increase focus on walking and cycling modes, this national target is also something the municipalities must now consider. One way to facilitate more focus on walking and biking was the afore-mentioned Urban Environment Agreement [43] which gave the municipalities the possibility to apply for financial support for infrastructure measures for bicycling and as a service in return, municipalities can work with improvements of the walking environment, mobility management, etc. The aim of this regulation was to increase the modal share of public transport and other sustainable modes and that the measures should lead to energy-efficient solutions with low greenhouse gas emissions. A total of 16 billion SEK has been set aside for this. Through detailed development plans, which are the responsibility of municipalities, there are now possibilities to plan for less or no parking spaces in residential buildings, which in the longer run should shift trips from cars to sustainable modes.
In one of the included municipalities the city council decided upon a Sustainable Urban Mobility Plan in 2016 with a goal of 30 percent of all trips by bicycle in 2030 and an additional 15 percent as walking trips, so very close to the goal in this paper of 50% [99]. To reach the goal for bicycling, measures like improved infrastructure (e.g., bike service stations, parking spaces and bike lanes) and a shared bike system have been implemented. In Lund municipality, the goal is that in 2030, 75 percent of all trips should be by public transport, walking and cycling. This municipality launched their third version of their strategy for a sustainable transport system in 2014 and has a history of working with improvements for sustainable transport and how walking and cycling should develop to reach the goal [100]. Similar goals are found in other municipalities. Figure 9 shows the electronic bicycle counting systems that are common in Malmö and Figure 10 provides an example of a bicycle service station in Malmö.
It is therefore both possible and plausible for government to regulate the mobility sector in a more rigorous and determined way than it presently does, if it musters a will to do so [101]. Whilst the present economic and physical imposts on car ownership and use in cities around the world are, however, very minimal, the benefits of reductions in cars and motorcycles have been dramatically demonstrated in cities worldwide in reduced air pollution, less congestion and safer conditions for walking and cycling.
The COVID-19 crisis has shown that without any immediate improvements in transport infrastructure, modal shift to bikes has been swift and decisive [102] and numerous cities are already determined to permanently change their street networks so that they are more walk and cycle-friendly [103,104]. The global climate change problem is a further reason to de-carbonize urban transport and facilitate in every way possible a switch to walking and cycling [105].

6.2.3. Increasing Car Occupancy

Achieving increases in car occupancy is very difficult and has been an important subject of attention in saving transport energy since the first global oil crisis in 1973–1974 [106]. A key problem with this approach, is that it reduces the inherit advantages for individuals who want to go anywhere, anytime without thinking about other passengers and so undermines one of the major motivations for having a car in the first place.
There are, however, two ways of trying to achieve it, which work best in combination—(1) making car use more restrictive and expensive and (2) facilitating ease of car or van-pooling through community-based approaches [107] and modern IT and smart technologies, which better match up drivers and extra passengers [108,109]). Research suggests that for car-pooling to become a reality, there needs to be increases in both the operating cost of cars and very importantly, the cost of parking [106]. An even more effective way than cost alone, at least for work trips, is to limit parking availability at workplaces [87,88], while facilitating and rewarding in some way employees who travel together in the same car. Employer-sponsored van-pools also work in certain circumstances for journey-to-work travel.
It is also possible to legislate for a minimum number of people in a car when entering congested areas or to qualify for using high-occupancy vehicle (HOV) lanes on freeways [110]. Today, a possible more attractive way of increasing car occupancy may be through community-based initiatives and peer-pressure designed to increase local resilience and sustainability [111].
So far there are no infrastructure measures like dedicated HOV lanes, for promoting higher vehicle occupancy in Sweden (although bus lanes are becoming more and more common). Swedish municipalities are, however, more aware of the importance of not providing cheap or free parking spaces, which affects also the number of employers who can provide cheap parking for their employees. This can in the long run, at least on a small scale, increase car sharing to workplaces. Car sharing (car-pooling) systems are increasing in Sweden, especially the business-to-consumer model (rather than the peer-to-peer model).

6.2.4. Reducing Vehicular Fuel Consumption

The final area that was tested was decreasing vehicular fuel consumption per kilometer by 15%. The best approach to this is simply to legislate for more rigorous energy efficiency standards for new cars and ideally follow-up testing for in-service vehicles to ensure standards are kept (in the same way vehicles are tested in some countries for maintenance of emissions standards). Since Swedish cities in 2015 were significantly better in this factor than all other cities in 2005 (3.0 MJ/km—Table 3), reducing it even further will require some effort.
Nevertheless, a relatively modest 15% improvement in average fuel consumption per kilometer of a whole vehicle fleet in each Swedish city, seems like a reasonable scenario. The assumption is supported by Andersson et al. [68] who investigated the economically motivated extra driving rebound effects of buying more fuel-efficient cars in Sweden.
While they found no significant change in annual distance travelled with changes in fuel efficiency of cars using a simple bivariate analysis, a multivariate analysis incorporating changes in income, number of cars per household, car weight and car power resulted in a 24% rebound effect of extra travel distance. But those households who specifically bought cars that were labelled “green” exhibited no such rebound effects. Furthermore, their analysis incorporated households in Sweden that bought cars that had rather high fuel efficiency of 14.0 km per liter (or 2.48 MJ/km), which is 17.3% less energy per kilometer than the average for the car fleets in the ten Swedish cities in this study in 2015. Clearly, cars are available in Sweden today that meet this target of a 15% reduction in energy use per vehicle kilometer.
In addition, as previously explained, the number of electric vehicles has increased in Sweden over the years and especially recently due to a bonus malus system with an increase in financial support if buying a full electric vehicle. At the same time, there is a somewhat subdued development of hybrid cars. In April 2021, 41% of the newly registered cars were chargeable compare to 23% in April 2020 [112]. Given the size of the current fleet of petrol and diesel cars in Sweden and only 6.2% of Sweden’s entire car fleet being electric, it will take many years for a complete transition to electric cars. In the meantime, reducing the fuel consumption of conventional cars will remain important in minimizing energy use.

7. Conclusions

This paper has provided a detailed insight into the transport energy conservation potential of six scenarios applied to ten Swedish cites using 2015 data. The paper posed two research questions, the answers to which can be summarized as follows.

7.1. What Is the Potential to Save Transport Energy through Different Strategies in Private, Public and Non-Motorized Modes?

To quantify transport energy conservation potential in the ten cities, six scenarios were created:
(1)
Increasing the public transport seat occupancy in each Swedish city to average European levels;
(2)
Doubling existing seat occupancy in each Swedish city;
(3)
Increasing existing car occupancy in each city by 10%;
(4)
Decreasing existing energy use per car vehicle kilometer by 15%;
(5)
Increasing existing modal split for non-motorized modes to 50% in each city;
(6)
A sixth best-case scenario was also constructed by simultaneously combining scenarios 2 to 5.
When applied individually, scenario 2 is the most successful (788.1 million liters saved), scenarios 1 and 4 are next and produce energy savings of (270.5 million and 302.6 million liters, respectively), followed by scenario 5 (262.7 million liters), with scenario 3 being the least successful (201.7 million liters). The best-case, combined scenario could save 1182.6 million liters of gasoline equivalent in the ten cities, representing an almost 60% saving over their existing 2015 total private transport energy use and almost the same as the total private transport energy use of Stockholm, Malmö and Jönköping combined. Doubling seat occupancy in public transport would contribute 66.6% of this saved energy, doubling non-motorized mode use would contribute 22.2%, while a combination of an increase in car occupancy of 10% and a 15% improvement in fuel consumption per vehicle kilometer of cars, applied together to the remaining car use after the public transport, walking and cycling increases, would contribute 11.2% of the energy savings. CO2 output would also be reduced by 2.779 million tonnes, about the same amount as all the CO2 emitted by cars, motorcycles and light trucks in Stockholm and Göteborg in 2015.
Table 11 provides a complete summary of the liters of gasoline equivalent saved and the avoided CO2 which are associated with each scenario in each of the ten Swedish cities.

7.2. What Policy Implications Can Be Drawn from This for Urban and Transport Planning in Sweden?

A wide range of literature was reviewed to answer this question and to show the best strategies to make each component work and to explore their likelihood and feasibility in Sweden. For the above scenarios to be implemented will require best practice approaches to public transport in both the “hardware” of public transport (vehicles, stations and stops, rights-of-way and the built environment around stops) and the “software” of public transport, including fare and route structures, marketing, management and funding. In Sweden, there has been a long-term priority to promote public transport and to improve the service, which has resulted in an increase in number of boardings, but at a high cost per new passenger. More must and can be done to shift car trips to public transport trips. This paper has shown the significant transport energy savings (and CO2) that are possible through this approach and detailed the many ways that the existing public transport service offer can increase its utilization. Of course, this has been made, temporarily at least, more difficult due to the COVID-19 pandemic, which has reduced public transport use and turned people to both cars and bikes. Demand responsive systems in Sweden are now slowly being implemented, attempting to offer good public transport, especially where the demand is limited. But the kind of public transport increases posed here will require a return to and growth in use of existing systems.
Non-motorized modes will need to achieve best practice through better infrastructure for walking and cycling, dense, mixed-use planning, more extensive pedestrianization and traffic calming, more staffing and funding for pedestrian and cycling functions in city authorities and perhaps most importantly, superb urban design to create the best environments through which people will want to walk and cycle. Sweden has shown in different types of strategic planning documents as well as in national financial funding, the importance of walking and cycling, but more needs to be done on the ground and more disincentives against car traffic are needed.
Increasing car occupancy will require both positive incentives and punitive measures such as increases in car operating costs and parking fees and restrictions on parking availability. Advanced IT and social media can now be used for route planning and to better match people up and legislation can ensure minimum numbers of people in cars entering critical areas or using HOV lanes on roads. Trends in many cities towards community-based initiatives for sustainability may also be important in creating the right social environments in which car-pooling can be effectively fostered. For this to happen in Sweden there probably needs to be a change in people’s attitudes towards owning their own car. New developments are built where parking spaces are negotiated and instead good bike facilities or shared car systems are offered. So far, these developments are exceptions and much more needs to be done.
Reducing car energy use per vehicle kilometer is difficult to achieve as evidenced by real data from cities around the world, but can be more rigorously pursued through much more stringent energy efficiency standards, requiring better technologies for cars and downsizing. Other planning rules such as reduced permitted sizes for garages at home and smaller parking spaces generally in the cities, might also be considered. In Sweden, more can be done through legislation and taxes to encourage those who are buying cars, to buy smaller rather than larger vehicles.

Author Contributions

Conceptualization, J.R.K.; formal analysis, J.R.K.; funding acquisition, J.R.K. and H.S.; investigation, J.R.K. and H.S.; methodology, J.R.K.; project administration, J.R.K.; resources, J.R.K. and H.S.; visualization, J.R.K. and H.S.; writing—original draft, J.R.K. and H.S.; writing—review and editing, J.R.K. and H.S. All authors have read and agreed to the published version of the manuscript.

Funding

The research reported in this paper was funded by two small research grants from K2—The Swedish Knowledge Centre for Public Transport.

Institutional Review Board Statement

Not applicable.

Informed Consent Statement

Not applicable.

Data Availability Statement

Data stored and backed-up by authors.

Acknowledgments

The authors are very grateful to K2 for providing the funding to support this research and the countless individuals in each of the cities, regions, other organizations and authorities who provided the requested data. We are especially grateful to Monika Brunetti for her research assistance in the Swedish data collection and management.

Conflicts of Interest

The authors declare no conflict of interest.

References

  1. Hirst, E. Transportation Energy Conservation Policies. Science 1976, 192, 15–20. [Google Scholar] [CrossRef] [PubMed]
  2. Amadeo, K. OPEC Oil Embargo, Its Causes, and the Effects of the Crisis: The Truth about the 1973 Arab Oil Crisis. The Balance. 2020. Available online: https://www.thebalance.com/opec-oil-embargo-causes-and-effects-of-the-crisis-3305806 (accessed on 8 May 2020).
  3. Kirby, A. Climate in Peril: A Popular Guide to the Latest IPCC Reports; UNEP: Nairobi, Kenya, 2009. [Google Scholar]
  4. Tollefson, J. IPCC says limiting global warming to 1.5 C will require drastic action. Nature 2018, 562, 172–173. [Google Scholar] [CrossRef] [PubMed] [Green Version]
  5. United States Office of International Energy Affairs. U.S. Oil Companies and the Arab Oil Embargo; University of Michigan Library: Ann Arbor, MI, USA, 1975. [Google Scholar]
  6. Vernon, R. Oil Crisis; US Department of Energy, Office of Scientific and Technical Information: Washington, DC, USA, 1976. Available online: https://www.osti.gov/biblio/7186106 (accessed on 12 May 2020).
  7. Pisarski, A.; de Terra, N. American and European transportation responses to the 1973–1974 oil embargo. Transportation 1975, 4, 291–312. [Google Scholar] [CrossRef]
  8. Hamilton, J.D. Historical Oil Shocks; Working Paper 16790; National Bureau of Economic Research: Cambridge, MA, USA, 2011. [Google Scholar]
  9. Hellema, D.; Wiebes, C.; Witte, T. The Netherlands and the Oil Crisis: Business as Usual; Amsterdam University Press: Amsterdam, The Netherlands, 2004. [Google Scholar]
  10. Newman, P.W.G.; Kenworthy, J.R. Cities and Automobile Dependence: An International Sourcebook; Gower: Aldershot, UK, 1989. [Google Scholar]
  11. Newman, P.W.G.; Kenworthy, J.R. Sustainability and Cities: Overcoming Automobile Dependence; Island Press: Washington DC, USA, 1999. [Google Scholar]
  12. Kobayashi, S.; Plotkin, S.; Ribeiro, S.K. Energy efficient technologies for road vehicles. Energy Effic. 2009, 2, 125–137. [Google Scholar] [CrossRef]
  13. Kenworthy, J.R.; Newman, P.W.G. The potential of ethanol as a transport fuel: A review based on technological, economic and environmental criteria. In Issues in Energy Policy in Western Australia; Discussion Paper No. 6/86; School of Environmental and Life Sciences, Murdoch University: Murdoch, WA, Australia, 1986. [Google Scholar]
  14. Kenworthy, J.R.; Newman, P.W.G. From hype to mothballs: An assessment of synthetic crude oils from oil shale, coal and oil sands. In Issues in Energy Policy in Western Australia; Discussion Paper No. 7/86; School of Environmental and Life Sciences, Murdoch University: Murdoch, WA, USA, 1986. [Google Scholar]
  15. Chang, M.F.; Evans, L.; Herman, R.; Wasielewski, P. Gasoline consumption in urban traffic. Transp. Res. Rec. 1976, 599, 25–30. [Google Scholar]
  16. Chang, M.F.; Herman, R. An attempt to characterize traffic in metropolitan areas. Transp. Sci. 1978, 12, 58–79. [Google Scholar] [CrossRef]
  17. Chang, M.F.; Horowitz, A.J. Estimates of fuel savings through improved traffic flow in seven US cities. Traffic Eng. Control 1979, 20, 62–65. [Google Scholar]
  18. Lyons, T.J.; Rainford, H.; Kenworthy, J.R.; Newman, P.W.G. Fuel and time implications of merging traffic at freeway entrances. Appl. Math. Model. 1988, 12, 226–237. [Google Scholar] [CrossRef]
  19. Rainford, H.; Lyons, T.J.; Kenworthy, J.R.; Newman, P.W.G. Fuel consumption and road type. Traffic Eng. Control 1987, 28, 183–186. [Google Scholar]
  20. Pitt, D.R.; Lyons, T.J.; Newman, P.W.G.; Kenworthy, J.R. Fuel consumption models: An evaluation based on a study of Perth’s traffic patterns. Traffic Eng. Control 1987, 28, 60–69. [Google Scholar]
  21. Lyons, T.J.; Kenworthy, J.R.; Austin, P.I.; Newman, P.W.G. The development of a driving cycle for fuel consumption and emissions evaluation. Transp. Res.-A 1986, 20A, 447–462. [Google Scholar] [CrossRef]
  22. Kenworthy, J.R.; Rainford, H.; Newman, P.W.G.; Lyons, T.J. Fuel consumption, time saving and freeway speed limits. Traffic Eng. Control 1986, 27, 455–459. [Google Scholar]
  23. Newman, P.W.G.; Kenworthy, J.R. The use and abuse of driving cycle research: Clarifying the relationship between traffic congestion, energy and emissions. Transp. Q. 1984, 38, 615–635. [Google Scholar]
  24. Newman, P.W.G.; Kenworthy, J.R. The transport energy trade-off: Fuel-efficient traffic versus fuel-efficient cities. Transp. Res. 1988, 22A, 163–174. [Google Scholar] [CrossRef]
  25. Newman, P.W.G.; Kenworthy, J.R.; Lyons, T.J. Does free flowing traffic save energy and lower emissions in cities? Search 1988, 19, 267–272. [Google Scholar]
  26. Litman, T. Efficient vehicles versus efficient transportation. Comparing transportation energy conservation strategies. Transp. Policy 2005, 12, 121–129. [Google Scholar] [CrossRef] [Green Version]
  27. Litman, T. Comprehensive evaluation of energy conservation and emission reduction policies. Transp. Res. Part A Policy Pract. 2013, 47, 153–166. [Google Scholar] [CrossRef]
  28. Tzeng, G.H.; Shiau, T.A. Energy conservation strategies in urban transportation: Application of multiple criteria decision-making. Energy Syst. Policy 1987, 11, 1–19. [Google Scholar]
  29. White, P. Energy conservation in urban public transport. Transp. Plan. Technol. 1982, 7, 143–152. [Google Scholar] [CrossRef]
  30. Newman, P.; Kenworthy, J. Public and private transport in Australian cities: II An analysis of existing patterns and their energy implications. Transp. Policy Decis. Mak. 1980, 1, 133–148. [Google Scholar]
  31. Newman, P.; Kenworthy, J. Public and private transport in Australian cities: II. The potential for energy conservation through land use change. Transp. Policy Decis. Mak. 1980, 1, 149–167. [Google Scholar]
  32. Newman, P.W.G.; Kenworthy, J.R.; Lyons, T.J. Transport energy use in the Perth Metropolitan Region: Some urban policy implications. Urban Policy Res. 1985, 3, 4–15. [Google Scholar] [CrossRef]
  33. Newman, P.W.G.; Kenworthy, J.R.; Lyons, T.J. Transport Energy Conservation Policies for Australian Cities: Strategies for Reducing Automobile Dependence; Institute for Science and Technology Policy, Murdoch University: Perth, Australia, 1990. [Google Scholar]
  34. Newman, P.W.G.; Kenworthy, J.R. Gasoline consumption and cities: A comparison of US cities with a global survey and its implications. J. Am. Plan. Assoc. 1989, 55, 24–37. [Google Scholar] [CrossRef]
  35. Gordon, P.; Richardson, H.W. Gasoline consumption and cities: A reply. J. Am. Plan. Assoc. 1989, 55, 342–346. [Google Scholar] [CrossRef]
  36. Newman, P.W.G.; Kenworthy, J.R. Is there a role for physical planning? J. Am. Plan. Assoc. 1992, 58, 353–362. [Google Scholar] [CrossRef]
  37. Levine, J.; Grengs, J.; Merlin, L.A. From Mobility to Accessibility: Transforming Urban Transportation and Land-Use Planning; University of Michigan: Ann Arbor, MI, USA, 2019. [Google Scholar]
  38. Papa, E.; Ferreira, A. Moving to Access in Transport Planning: Identifying Barriers, Designing Strategies. In Proceedings of the AESOP Congress, Lisbon, Portugal, 14–17 July 2017; Available online: https://westminsterresearch.westminster.ac.uk/download/11c760b55a04e2edb58a30a252866ee1116ad59037535702374b7a8185560999/172068/AESOP%20Enrica%20Papa%20Antonio%20Ferreira.pdf (accessed on 30 October 2021).
  39. Naess, P. Urban Form and Energy Use for Transport. A Nordic Experience. Ph.D. Thesis, Norwegian Institute of Technology, Oslo, Norway, 1995. [Google Scholar]
  40. Naess, P.; Sandberg, S.L.; Roe, P.G. Energy use for transportation in 22 Nordic towns. Scand. Hous. Plan. Res. 1996, 13, 79–97. [Google Scholar] [CrossRef]
  41. Naess, P. Transportation energy in Swedish towns and regions. Scand. Hous. Plan. Res. 1993, 10, 187–206. [Google Scholar] [CrossRef]
  42. Swedish Government Inquiry. Fossilfrihet på väg (SOU, 2013: 84) [Fossil Freedom on Roads]; Swedish Government Official Reports: Stockholm, Sweden, 2013.
  43. SFS 2015:579; Förordning om Stöd för att Främja Hållbara Stadsmiljöer [The Swedish Code of Statutes on Support for Promoting Sustainable Urban Environments]. Swedish Constitution Government Offices: Stockholm, Sweden, 2015.
  44. Zhao, C.; Ryan, J.; Wretstrand, A. Policy Instruments for a More Transport Efficient Society: A Pre-Study Comparing the Cases of California and Sweden; K2 Working paper 2021:2; K2—The Swedish Knowledge Centre for Public Transport: Lund, Sweden, 2021. [Google Scholar]
  45. Kenworthy, J.R. Is Automobile Dependence in Emerging Cities an Irresistible Force? Perspectives from São Paulo, Taipei, Prague, Mumbai, Shanghai, Beijing and Guangzhou. Sustainability 2017, 9, 1953. [Google Scholar] [CrossRef] [Green Version]
  46. Kenworthy, J.R. Reducing Passenger Transport Energy Use in Cities: A Comparative Perspective on Private and Public Transport Energy Use in American, Canadian, Australian, European and Asian Cities. In Urban Energy Transition: Renewable Strategies for Cities and Regions, 2nd ed.; Droege, P., Ed.; Elsevier: Amsterdam, The Netherlands, 2018; Chapter 2.1; pp. 169–204. [Google Scholar]
  47. Kenworthy, J.R. Urban Transport and Eco-Urbanism: A Global Comparative Study of Cities with a Special Focus on Five Larger Swedish Urban Regions. Urban Sci. 2019, 3, 25. [Google Scholar] [CrossRef] [Green Version]
  48. Buehler, R.; Pucher, J. Sustainable transport in Freiburg: Lessons from Germany’s environmental capital. Int. J. Sustain. Transp. 2011, 5, 43–70. [Google Scholar] [CrossRef] [Green Version]
  49. Kenworthy, J.R. Passenger transport energy use in ten Swedish cities: Understanding the differences through a comparative review. Energies 2020, 13, 3719. [Google Scholar] [CrossRef]
  50. Kenworthy, J. Total daily mobility patterns and their implications for forty-three global cities in 1995 and 2005. World Transp. Policy Pract. 2014, 20, 41–55. [Google Scholar]
  51. Newman, P.; Kenworthy, J. The End of Automobile Dependence: How Cities are Moving Away from Car-Based Planning; Island Press: Washington, DC, USA, 2015; 273p. [Google Scholar]
  52. Schiller, P.; Kenworthy, J.R. An Introduction to Sustainable Transportation: Policy, Planning and Implementation, 2nd ed.; Earthscan: London, UK, 2018. [Google Scholar]
  53. Newman, P.; Kosonen, L.; Kenworthy, J. Theory of urban fabrics: Planning the walking, transit/public transport and automobile/motor car cities for reduced car dependency. Town Plan. Rev. 2016, 87, 429–458. [Google Scholar] [CrossRef]
  54. Cervero, R. Sustainable new towns: Stockholm’s rail served satellites. Cities 1995, 12, 41–51. [Google Scholar] [CrossRef]
  55. Cervero, R. The Transit Metropolis: A Global Inquiry; Island Press: Washington DC, USA, 1998. [Google Scholar]
  56. Swedish Parliament. Trafikutskottets Betänkande (2014/15: TU13); Elanders: Vällingby, Sweden, 2015. [Google Scholar]
  57. Neff, J.W. Substitution rates between transit and automobile travel. In Proceedings of the 92nd Association of American Geographers’ Annual Meeting, Charlotte, NC, USA, 9–13 April 1996. [Google Scholar]
  58. Shaheen, S.; Cohen, A. Shared ride services in North America: Definitions, impacts, and the future of pooling. Transp. Rev. 2018, 39, 427–442. [Google Scholar] [CrossRef]
  59. Wattles, J. Ford Dropping All but 2 Cars from Its North American Dealerships. CNN, 25 April 2018. Available online: https://money.cnn.com/2018/04/25/autos/ford-cars-north-america/index.html (accessed on 6 January 2021).
  60. O’Connor, P. What is the Rebound Effect?—Energy Efficiency, Part 2; Union of Concerned Scientists: Cambridge, MA, USA, 5 November 2015; Available online: https://blog.ucsusa.org/peter-oconnor/energy-efficiency-what-is-the-rebound-effect-946 (accessed on 6 January 2021).
  61. Newman, P.; Kenworthy, J. Urban passenger transport energy consumption and carbon dioxide emissions: A global review and assessment of some reduction strategies. In Handbook on Transport and Development; Hickman, R., Givoni, M., Bonilla, D., Banister, D., Eds.; Edward Elgar Publishing: Cheltenham, UK, 2015; Chapter 3; pp. 36–58. [Google Scholar]
  62. Komiyama, H.; Kraines, S. Vision 2050: Roadmap for a Sustainable Earth; Springer: Tokyo, Japan, 2008. [Google Scholar]
  63. Mobility Foresights. China Electric Vehicle Market 2021–2026: Size, Forecasts, Risk, Trends, Opportunities Till 2026; Mobility Foresights: Bengaluru, India, 2021; Available online: https://mobilityforesights.com/product/china-electric-vehicle-market/ (accessed on 4 November 2021).
  64. Statistics Sweden. Table TK1001AA, Total New Car Registrations in Sweden by Fuel Type from January 2006 until October 2021—Transport Analysis Section, Statistics Sweden. Available online: http://www.statistikdatabasen.scb.se/pxweb/en/ssd/START__TK__TK1001__TK1001A/PersBilarDrivMedel/?rxid=91a20c71-46c1-4334-a5d6-d38fedf7536c (accessed on 22 November 2021).
  65. Wallbox. The Essential Guide to EV and EV Charger Incentives in Sweden. 2021. Available online: https://blog.wallbox.com/sweden-ev-incentives/ (accessed on 26 November 2021).
  66. Statistics Sweden Trafikanalys (2021) Fordon 2020 (Vehicles 2020) Published 3 April 2021. Available online: https://scb.se/hitta-statistik/statistik-efter-amne/transporter-och-kommunikationer/vagtrafik/fordonsstatistik/pong/tabell-och-diagram/fordonsbestand-2020/ (accessed on 30 October 2021).
  67. Trafikanalys. RVU Sverige—den Nationella Resvaneundersökningen 2015–2016 [The Swedish National Travel Survey 2015–2016]; Trafikanalys: Stockholm, Sweden, 2017. [Google Scholar]
  68. Andersson, D.; Linscott, R.; Nässén, J. Estimating car use rebound effects from Swedish microdata. Energy Effic. 2019, 12, 2215–2225. [Google Scholar] [CrossRef] [Green Version]
  69. Harikumar, A. Effects of COVID-19 on Transportation Demand; The Energy and Resources Institute: New Delhi, India, 8 April 2020; Available online: https://www.teriin.org/article/effects-covid-19-transportation-demand (accessed on 3 June 2020).
  70. Swedish Public Transport Association. Kollektivtrafikbarometern Tema 2020—Coronapandemin [The Public Transport Survey Theme 2020—The Corona Pandemic]; Svensk kollektivtrafik: Stockholm, Sweden, 2020. [Google Scholar]
  71. Region Stockholm. Trafiknämnden/trafikförvaltningen DELÅRSRAPPORT August 2020; Diarienummer TN 2020-0044; Region Stockholm: Stockholm, Sweden, 2020. [Google Scholar]
  72. United States Energy Information Administration. Carbon Dioxide Emissions Coefficients; USEIA: Washington, DC, USA, 2016. Available online: https://www.eia.gov/environment/emissions/co2_vol_mass.php (accessed on 3 June 2020).
  73. Bradley, M.; Kenworthy, J. Congestion offsets: Transforming cities by letting buses compete. World Transp. Policy Pract. 2012, 18, 46–69. [Google Scholar]
  74. Reid, C. Most Cities Will Have to Introduce Congestion Charging, Say Experts at Global Transit Conference. Forbes, 10 June 2019. Available online: https://www.forbes.com/sites/carltonreid/2019/06/10/most-cities-will-have-to-introduce-congestion-charging-say-experts-at-global-transit-conference/#46078f62536f (accessed on 5 June 2020).
  75. Börjesson, M.; Eliasson, J.; Hugosson, M.B.; Brundell-Freij, K. The Stockholm congestion charges—5 years on. Effects, acceptability and lessons learnt. Transport Policy 2012, 20, 1–12. [Google Scholar] [CrossRef]
  76. Eliasson, J.; Jonsson, L. The unexpected “yes”: Explanatory factors behind the positive attitudes to congestion charges in Stockholm. Transport Policy 2011, 18, 636–647. [Google Scholar] [CrossRef]
  77. Börjesson, M.; Kristoffersson, I. The Swedish congestion charges: Ten years on. Transp. Res. Part A Policy Pract. 2018, 107, 35–51. [Google Scholar] [CrossRef]
  78. APTA. Bicycle and Transit Integration: A Practical Transit Agency Guide to Bicycle Integration and Equitable Mobility; APTA SUDS-UD-RP-009-18; American Public Transit Association: Washington, DC, USA, 20 September 2018; Urban Design Working Group; Available online: https://www.apta.com/wp-content/uploads/Standards_Documents/APTA-SUDS-UD-RP-009-18.pdf (accessed on 5 June 2020).
  79. Zaleski, A. The Future is Coming—At 11 Miles Per Hour: Autonomous Shuttle Companies Want to Fill the First-Mile, Last-Mile Gaps in Public Transportation. Curbed, 17 April 2019. Available online: https://www.curbed.com/2019/4/17/18410988/autonomous-vehicle-local-motors-navya-may-mobility (accessed on 5 June 2020).
  80. X2AB. Guidelines för Attraktiv Kollektivtrafik Med Fokus på BRT [Guidelines for Attractive Public Transport with Focus on BRT], a Joint Report by X2AB, the Swedish Transport Administration; Swedish Energy Agency and The Swedish Bus and Coach Federation: Stockholm, Sweden, 2015. [Google Scholar]
  81. van Lierop, D.; Badami, M.G.; El-Geneidy, A.M. What influences satisfaction and loyalty in public transport? A review of the literature. Transp. Rev. 2018, 38, 52–72. [Google Scholar] [CrossRef]
  82. Walker, J. Basics: Finding Your Pulse. Human Transit. 30 November 2010. Available online: https://humantransit.org/2010/11/basics-finding-your-pulse.html (accessed on 5 June 2020).
  83. Swedish Government Inquiry. Ett Nationellt Biljettsystem för All Kollektivtrafik (SOU 2020:25) [A National Ticket System for All Public Transport]; Swedish Government Official Reports; Swedish Government: Stockholm, Sweden, 2020.
  84. Buehler, R.; Pucher, J.; Dümmler, O. Verkehrsverbund: The evolution and spread of fully integrated regional public transport in Germany, Austria, and Switzerland. Int. J. Sustain. Transp. 2019, 13, 36–50. [Google Scholar] [CrossRef]
  85. Sand, J. A different kind of density: Lessons from Asian Megacities. Planetizen, 24 June 2020. Available online: https://www.planetizen.com/node/109691?utm_source=newswire&utm_medium=email&utm_campaign=news-06252020&mc_cid=3c1ccfb18a&mc_eid=b7628ea8fd (accessed on 26 June 2020).
  86. Buehler, R.; Pucher, J.; Gerike, R.; Götschi, T. Reducing car dependence in the heart of Europe: Lessons from Germany, Austria and Switzerland. Transp. Rev. 2017, 37, 4–28. [Google Scholar] [CrossRef]
  87. Shoup, D. The High Cost of Free Parking; Routledge: New York, NY, USA, 2011. [Google Scholar]
  88. Shoup, D. Parking and the City; Routledge: New York, NY, USA, 2018. [Google Scholar]
  89. Moura, F.; Cambra, P.; Gonçalves, A.B. Measuring walkability for distinct pedestrian groups with a participatory assessment method: A case study in Lisbon. Landsc. Urban Plan. 2017, 157, 282–296. [Google Scholar] [CrossRef]
  90. Gehl, J. Cities for People; Island Press: Washington, DC, USA, 2010. [Google Scholar]
  91. Gehl, J.; Gemzøe, L. New City Spaces; The Danish Architectural Press: Copenhagen, Denmark, 2000. [Google Scholar]
  92. Gehl, J.; Gemzøe, L. Public Spaces, Public Life; Danish Architectural Press: Copenhagen, Denmark, 2004. [Google Scholar]
  93. Government Offices of Sweden. Renewed Commitment to Vision Zero, Intensified Efforts for Transport Safety in Sweden. Production: Ministry of Enterprise and Innovation, Item no: N2016.34. 2016. Available online: https://www.government.se/4a800b/contentassets/b38a99b2571e4116b81d6a5eb2aea71e/trafiksakerhet_160927_webny.pdf (accessed on 9 May 2021).
  94. Svensson, H. Universal Design—universal access: Sweden as leaders in the built environment and transport. In Handbook of Sustainable Transport; Curtis, C., Ed.; Edward Elgar Publishing: London, UK, 2020. [Google Scholar]
  95. Swedish National Board of Housing, Building and Planning, Swedish Transport Administration and Swedish Association of Local Authorities and Regions. In Trafik för en attraktiv stad. Handbok. Utgåva 3 [Traffic for an Attractive City. Handbook], 3rd ed.; LTAB: Linköping, Sweden, 2015.
  96. SALAR (Swedish Association of Local Authorities and Regions) and Swedish Transport Administration. Rätt Fart i Staden [Right Speed Limits in Cities]; Vägverket Publikation 54, SKL Kommentus AB: Stockholm, Sweden, 2008; ISBN 978-91-7345-203-8. [Google Scholar]
  97. Koglin, T. Vélomobility and the politics of transport planning. GeoJournal 2015, 80, 569–586. [Google Scholar] [CrossRef]
  98. Koglin, T.; Mukhtar-Landgren, D. Contested values in bike-sharing mobilities—A case study from Sweden. J. Transp. Geogr. 2021, 92, 1–11. [Google Scholar] [CrossRef]
  99. Malmö Municipality. Sustainable Urban Mobility Plan (SUMP), Politically Adopted in City Council 3/3 2016. 2016. Available online: file:///C:/Users/Standard/Documents/K2%20fr%20o%20m%20sep%202015/Jeff/Gemensam%20artikel/MALM%C3%96_TROMP_210x297mm_ENG.pdf (accessed on 30 October 2021).
  100. Lund Municipality. LundaMaTs III Strategi för ett Hållbart Transportsystem i Lunds Kommun; Lund Municipality: Lund, Sweden, 2014. [Google Scholar]
  101. Goetsch, H.; Quiros, T.P. COVID-19 Creates New Momentum for Cycling and Walking: We Can’t Let It Go to Waste! World Bank: Washington, DC, USA, 7 August 2020; Available online: https://blogs.worldbank.org/transport/covid-19-creates-new-momentum-cycling-and-walking-we-cant-let-it-go-waste (accessed on 6 January 2021).
  102. Buehler, R.; Pucher, J. COVID-19 impacts on cycling, 2019–2020. Transp. Rev. 2021. [Google Scholar] [CrossRef]
  103. Baruchman, M. Seattle will permanently close 20 miles of residential streets to most vehicle traffic. The Seattle Times, 7 May 2020. Available online: https://www.seattletimes.com/seattle-news/transportation/seattle-will-permanently-close-20-miles-of-residential-streets-to-most-vehicle-traffic/ (accessed on 20 May 2020).
  104. Laker, L. Milan announces ambitious scheme to reduce car use after lockdown. The Guardian, 21 April 2020. Available online: https://www.theguardian.com/world/2020/apr/21/milan-seeks-to-prevent-post-crisis-return-of-traffic-pollution?utm_term=Autofeed&CMP=twt_gu&utm_medium&utm_source=Twitter#Echobox=1587456548 (accessed on 20 May 2020).
  105. Campion, P. COVID-19: What we have learnt. TRL Newsbite: COVID-19 Lessons. 13 May 2020 TRL (Transport Research Laboratory), Crowthorne House, Nine Mile Ride, Wokingham, Berkshire RG40 3GA, United Kingdom, 2020. Available online: https://trl.co.uk/news/covid-19--what-have-we-learnt- (accessed on 30 October 2021).
  106. Eash, R.W.; Swanson, A.; Kaplan, M. An analysis and evaluation of alternate schemes to increase auto-occupancy. Transp. Res. 1974, 8, 335–341. [Google Scholar] [CrossRef]
  107. Chen, Y.-T.; Hsu, C.-H. Improve the Carpooling Applications with Using a Social Community Based Travel Cost Reduction Mechanism. Int. J. Soc. Sci. Humanit. 2013, 3, 87–91. [Google Scholar] [CrossRef] [Green Version]
  108. Calvo, R.W.; de Luigi, F.; Haastrup, P.; Mainezzo, V. A distributed geographic information system for the daily carpooling problem. Comput. Oper. Res. 2004, 31, 2263–2278. [Google Scholar] [CrossRef]
  109. Xia, J.; Curtin, K.M.; Huang, J.; Wu, D.; Xiu, W.; Huang, Z. A carpool matching model with both social and route networks. Comput. Environ. Urban Syst. 2019, 75, 90–102. [Google Scholar] [CrossRef]
  110. Zhong, L.; Zhang, K.; Nie, Y.; Xu, J. Dynamic carpool in morning commute: Role of high-occupancy-vehicle (HOV) and high-occupancy-toll (HOT) lanes. Transp. Res. Part B Methodol. 2020, 135, 98–119. [Google Scholar] [CrossRef]
  111. Gheorghiu, A.; Delhomme, P. For which types of trips do French drivers carpool? Motivations underlying carpooling for different types of trips. Transp. Res. Part A Policy Pract. 2018, 113, 460–475. [Google Scholar] [CrossRef]
  112. Bilsweden. Pressmeddelanden Nyregistreringar. Available online: https://www.bilsweden.se/statistik/Nyregistreringar_per_manad_1 (accessed on 9 May 2021).
Figure 2. Annual total liters of gasoline equivalent saved in the ten Swedish cities based on five scenarios. Source: Authors.
Sustainability 14 00954 g002
Figure 3. E-scooters are becoming more prevalent in Swedish cities (docked system, Malmö, West Harbor). Source: Helena Svensson.
Sustainability 14 00954 g003
Figure 4. An experimental autonomous bus in Helsingborg, Sweden. Source: Helena Svensson.
Sustainability 14 00954 g004
Figure 5. Bi-articulated new buses operating in Malmö. Source: Jeffrey Kenworthy.
Sustainability 14 00954 g005
Figure 6. Stockholm is expanding its tram network to provide higher quality public transport. Source: Jeffrey Kenworthy.
Sustainability 14 00954 g006
Figure 7. Bi-directional bus-only lane in Lund. Source: Helena Svensson.
Sustainability 14 00954 g007
Figure 8. Generous provision for pedestrians and cyclists in Malmö’s high-density West Harbor. Source: Helena Svensson.
Sustainability 14 00954 g008
Figure 9. Example of an electronic bicycle counting network in Malmö. Source: Helena Svensson.
Sustainability 14 00954 g009
Figure 10. Community bicycle service station, Malmö. Source: Helena Svensson.
Sustainability 14 00954 g010
Table 1. List of cities used for the international comparisons plus the ten Swedish cities, together with their population and GDP per capita in respective years. Adapted from [49].
CityPopulationMetropolitan GDP
per Capita
(US$1995)
American Cities
Atlanta 20053,826,866$41,641
Chicago 20058,217,201$40,666
Denver 20052,256,442$45,762
Houston 20054,853,225$44,124
Los Angeles 20059,758,886$40,899
New York 200520,580,795$47,206
Phoenix 20053,590,804$32,589
San Diego 20052,824,259$42,324
San Francisco 20054,071,751$54,266
Washington 20054,273,361$55,070
Australian Cities
Brisbane 20061,819,800$29,365
Melbourne 20063,743,000$30,411
Perth 20061,518,700$37,416
Sydney 20064,282,000$31,583
Canadian Cities
Calgary 2005988,193$36,713
Montreal 20053,487,520$26,815
Ottawa 20051,130,761$29,956
Toronto 20055,555,912$33,103
Vancouver 20052,116,581$29,726
European Cities
Graz 2005247,248$33,889
Copenhagen 20051,827,239$43,108
Helsinki 2005988,347$47,548
Düsseldorf 2005577,416$40,270
Oslo 20051,039,536$53,941
Madrid 20055,964,143$26,964
Stockholm 20051,889,945$43,527
Bern 2005303,202$54,145
Geneva 2005440,982$50,918
London 20057,512,000$33,368
Vienna 20051,651,437$36,131
Manchester 20052,543,800$26,611
Stuttgart 2005592,028$33,294
Brussels 20051,006,749$39,758
Prague 20051,181,610$20,179
Berlin 20053,395,189$21,027
Frankfurt 2005651,583$38,356
Hamburg 20051,743,627$36,733
Munich 20051,288,307$45,133
Zurich 2005832,159$48,756
Asian Cities
Hong Kong 20066,857,100$18,823
Singapore 20054,341,800$23,578
Swedish Cities
Stockholm 20152,231,439$49,271
Malmö 2015695,430$32,709
Goteborg 2015982,360$40,808
Linköping 2015152,966$30,260
Helsingborg 2015137,909$28,917
Uppsala 2015210,126$31,998
Västerås 2015145,218$29,594
Örebro 2015144,200$29,045
Jönköping 2015133,310$29,952
Umeå 2015120,777$29,415
Freiburg (benchmark small city)
Freiburg 2015222,082$25,782
Table 9. Transport and energy results from application of scenario 5. Source: Authors.
VariableUnitsStockholmMalmöGöteborgLinköpingHelsingborgUppsalaVästeråsÖrebroJönköpingUmeåALL Cities
Percentage of total daily trips by walking % 14.8%12.6%19.2%15.0%11.5%13.3%17.1%13.0%12.3%12.1%14.1%
Percentage of total daily trips by cycling % 7.4%18.6%7.1%18.0%11.5%33.5%15.6%21.0%8.9%17.2%15.9%
New percentage of total daily trips by walking using
existing walk/cycle ratio
% 33.3%20.2%36.5%22.7%25.0%14.2%26.2%19.1%29.1%20.7%24.7%
New percentage of total daily trips by cycling using
existing walk/cycle ratio
% 16.7%29.8%13.5%27.3%25.0%35.8%23.8%30.9%20.9%29.3%25.3%
Extra daily percentage of walk trips cf. 2015 % 18.6%7.6%17.3%7.7%13.5%0.9%9.0%6.1%16.8%8.6%10.6%
Extra daily percentage of cycle trips cf. 2015 % 9.3%11.2%6.4%9.3%13.5%2.3%8.2%9.9%12.0%12.2%9.4%
Average walking trip length in Swedenkm2.32.32.32.32.32.32.32.32.32.32.3
Average cycling trip length in Swedenkm4.64.64.64.64.64.64.64.64.64.64.6
Estimated extra annual walking trips compared to 2015million
trips
491.562.6201.914.022.12.215.610.526.512.3859.2
Estimated extra annual cycling trips compared to 2015million
trips
246.092.374.516.822.05.614.216.919.017.4524.8
Reduced car PKT (assume each new walking trip replaces 1 person car trip of 2.3 km)million km1130.5143.9464.332.250.95.135.824.161.028.21976.1
Reduced car PKT (assume each new cycling trip replaces 1 person car trip of 4.6 km)million km1131.5424.6342.577.4101.425.865.377.887.580.22414.0
Total reduced car PKT from more walking and cycling tripsmillion km2262.0568.6806.8109.6152.231.0101.1101.8148.5108.54390.2
Existing 2015 Total Car PKTmillion km14,795.24756.36571.31030.1946.41288.21023.41061.41053.4806.733,332.5
New Total Car PKTmillion km12,533.24187.75764.5920.5794.11257.2922.3959.6904.9698.328,942.4
New total energy use in private passenger transport
(using 2015 MJ/PKT)
million MJ22,779.29594.513,705.92477.32046.02493.01836.22228.72482.61214.960,858.5
New private passenger transport energy use/
person/annum
MJ/
person
10,20813,79713,95216,19514,83611,86512,64415,45518,62310,05913,763
Reduction in private passenger transport energy/
person/annum
MJ/
person
1842187319531929284529213861640305515631838
Percentage reduction in private transport energy use per capita%15%12%12%11%16%2%10%10%14%13%12%
Conversion of per capita energy saving to liters
(gasoline equivalent)
liters/
person
535456568284047884553
Total liters saved in one year (gasoline equivalent)million liters118.537.555.38.511.31.85.86.811.75.4262.7
Table 11. Summary of energy savings and avoided CO2 for each scenario in each of the ten Swedish cities. Source: Authors.
Scenarios StockholmMalmöGöteborgLinköpingHelsingborgUppsalaVästeråsÖrebroJönköpingUmeåAll Cities
Million Liters of Gasoline Equivalent Saved CO2 Avoided (Mill. Metric Tonnes)Million Liters of Gasoline Equivalent Saved CO2 Avoided (Mill. Metric Tonnes)Million Liters of Gasoline Equivalent Saved CO2 Avoided (Mill. Metric Tonnes)Million Liters of Gasoline Equivalent Saved CO2 Avoided (Mill. Metric Tonnes)Million Liters of Gasoline Equivalent Saved CO2 Avoided (Mill. Metric Tonnes)Million Liters of Gasoline Equivalent Saved CO2 Avoided (Mill. Metric Tonnes)Million Liters of Gasoline Equivalent Saved CO2 Avoided (Mill. Metric Tonnes) Million Liters of Gasoline Equivalent Saved CO2 Avoided (Mill. Metric Tonnes)Million Liters of Gasoline Equivalent Saved CO2 Avoided (Mill. Metric Tonnes)Million Liters of Gasoline Equivalent Saved CO2 Avoided (Mill. Metric Tonnes)Million Liters of Gasoline Equivalent Saved CO2 Avoided (Mill. Metric Tonnes)
1Increase of seat occupancy of each public transport mode to average European levels (in 2005).166.80.39222.10.05245.10.1066.50.0156.00.0146.80.0160.80.00210.00.0245.10.0121.30.003270.50.636
2Double the current seat occupancy of each public transport mode in each Swedish city.494.41.16268.40.161132.60.31214.60.03419.30.04521.30.0503.10.00718.70.04411.90.0283.70.009788.11.852
3Increase of car occupancy by 10%, from 1.31 to 1.44.77.50.18231.40.07445.00.1068.00.0197.00.0177.40.0175.90.0147.10.0178.30.0204.00.010201.70.474
4Decrease the fuel consumption per vehicle kilometer travelled by 15%.116.30.27347.10.11167.60.15912.00.02810.50.02511.00.0268.80.02110.70.02512.50.0296.10.014302.60.711
5Increase the modal split for walking and cycling to 50% of daily trips in each city.118.50.27937.50.08855.30.1308.50.02011.30.0271.80.0045.80.0146.80.01611.70.0285.40.013262.70.617
6Combined scenarios 2-5635.01.492134.30.316223.70.52630.90.07336.10.08530.00.07015.70.03731.80.07531.70.07513.40.0321182.62.779
Publisher’s Note: MDPI stays neutral with regard to jurisdictional claims in published maps and institutional affiliations.

