Article

Green GDP Indicator with Application to Life Cycle of Sugar Industry in Thailand

by
Ekkaporn Nawapanan
1,2,
Ratchayuda Kongboon
1 and
Sate Sampattagul
1,3,*
1
Research Unit for Energy, Economic and Ecological Management, Science and Technology Research Institute, Chiang Mai University, Chiang Mai 50200, Thailand
2
The Joint Graduate School of Energy and Environment (JGSEE), King Mongkut’s University of Technology Thonburi, Bangkok 10140, Thailand
3
Department of Industrial Engineering, Faculty of Engineering, Chiang Mai University, Chiang Mai 50200, Thailand
*
Author to whom correspondence should be addressed.
Sustainability 2022, 14(2), 918; https://doi.org/10.3390/su14020918
Submission received: 4 December 2021 / Revised: 3 January 2022 / Accepted: 11 January 2022 / Published: 14 January 2022
(This article belongs to the Collection Circular Economy and Sustainable Strategies)

Abstract

:
The objective of this study was to develop new indicators that reflect economic growth by taking into account the impact on the environment and natural resources as well. The indicator calculated by subtracting environmental cost from the “Gross Domestic Product (GDP)” and is used in the assessment of the GDP by taking into consideration the cost of natural resources and the environment, called “green GDP”. This study uses Life Cycle Assessment, which is a technique used to assess the environmental impact of sugar industry from raw materials, distribution, production, and waste management. The system boundary for the life cycle inventory are cultivation, planting, transportation and sugar production. The results of the green GDP and GDP is difference about 6–12% due to the depletion cost resulting from the use of natural resources between 9.0–9.52 $/ton of sugar production and the degradation cost caused by the airborne emission and waterborne emission between 37–57 $/ton of sugar production. The quantity of Total Suspended Particulate (TSP) generated from the sugar production process is the main causing the environmental cost about 55%. In order to solve environmental causes, the policy making as Circular Economy Strategies can be used to meet the sustainable development in the future.

1. Introduction

The sugar production for domestic consumption and export are become one of the main economic sectors of Thailand and may increase concern on natural resources and climate security. The production includes burning the cane before harvesting which has an impact on greenhouse gas emissions, in addition to air pollution causing small dust particles to have an effect on human health, etc.
In Thailand, the sugar industry is a sector in Input-output (I/O) Table 2015 and 73% of gross domestic product (GDP) in the Food and Beverage sector [1]; this industry is concerned with other sectors such as sugarcane and transportation. It can seem a whole life cycle or supply chain. Thailand sugar industry is one of the five major sugar producers in the world. The country holds a percentage of about 6–7% in the 2016–2020 year of sugar production in the world [2]. It has to keep the position and be concerned about environmental issues.
Economies and the industry are dramatically increasing in growth, and this is the impetus to many countries around the world to focus on effecting economic development through adjustment of the gross domestic product (GDP) value in order to revise the format with regard to the depreciation of natural capital such as forests, wildlife, etc. This can also be carried out through maintenance of environmental quality, the destruction of which is the effect of economic development, such as in the cases of soil, water, and air pollution, in addition to the destruction of natural resources capital and social capital. This approach is part of the Sustainable Development Goals (SDGs), starting from the RIO+20 conference, appearing at a conference called “The Future We Want” which is the Millennium Development Goals (MDGs). In 2015, the annual Conference of Parties (COP21) purposed to achieve a developing national plan and implemented plans to curve downward in the projected global temperature rise [3]. These make an effort to develop new indicators that can reflect the economic growth by taking into consideration the impact on the environment and natural resources. As early mentioned, the environmental security are driven force to find a way to make a cost accounting system for resources and the environment by deducting the net book value of the resource used, which consists of the wasted resource cost and environmental protection and recovery costs under the System of Integrated Environmental and Economic Accounting [4] by evaluating resource cost by converting the activities that are associated with the resource into the money unit from GDP for use in the assessment of GDP, taking into consideration the costs of natural resources and the environment, called “green GDP” and the aimed of the result of green GDP is the close to the originality GDP by purpose such an environmental policy (e.g., circular economy, reduce, reuse, recycle etc.) to make a sustainability of economic growth.

1.1. Green GDP Evaluation Background

1.1.1. A Perform in the Global Green Economy

In order to achieve green economic indicators, social, and Gross Domestic Product (GDP) in the past 10 years, many countries, such as Japan, China, and Australia have been set up as a resource and environmental accounting system by focusing on the environmental impact of the reduction of natural resources and the damage to the environment, but only at the macroeconomic level. Asafu-Adjaye J. [5] have theorized about adjusting macroeconomic indicators to account for environmental change, which was developed in their work. In China, Xu et al. [6] have introduced a new type of accounting for green gross products. The direct value of ecosystem services has been taken into account in the calculation of GDP. This value has been weighted by price and is aggregated to the market and services in GDP calculations. Yanhong L. et al. [7] develop a new concept “green finance” to support the policy, awareness of green consumption of enterprise, encourage enterprises to research and reduce pollution emissions, environmental protection and also promote the transformation of others green concept (e.g., “green water and green mountain”). Mahnaz K. and Hamed A. [8] investigated the spatial effects of energy consumption and green production in Shanghai Cooperation Organization member states. The result shown that, the CO2 emission from the impact of fossil fuels is almost four times greater than renewable energy and both fossil fuels and renewable energy have a negative effect on green GDP. The study in Thailand about green GDP started around 2010, Study of national accounting, including 4 natural resources and environment, including forest resources, energy, water resources, and geothermal resources by using the framework and procedures for estimating the economic, natural, and environmental accounting system (SEEA) according to the United Nations Statistics Division (UNSTAT) Manual in 2000 and 2003 [9]. Some study used the Life Cycle Inventory (LCI) and Life Cycle Assessments (LCA) along with the National database for assessing impacts on resources and the environment.

1.1.2. Thailand’s Green GDP Research

Office of the National Economic and Social Development Council (NESDC) [10] evaluate natural resources and environmental degradation in sub-sectors, including livestock and fisheries, that total economic value is 80% of the agricultural sector, their result shown that the studying of the National accounting, including natural resources and environment, forest resources, energy, water resources and geothermal resources by SEEA framework. The result shown that when considered in global warming impact, green GDP is lower than GDP of between 2–3%. The study applying the LCA principle to determine the quantity of raw materials and energy, including the air and water pollution emission of the manufacturing process in the industry. This LCA principle can be fully integrated throughout the life cycle, starting with the acquisition of raw materials, production, use, and destruction. Attavanich W. et al. [11] estimated Thailand’s green gross domestic (GDP) in agricultural sector based on LCA approach; their result of total environmental damage cost was approximately 0.1003% (22.05 million $) of total GDP in agricultural sector. Kunanuntakij K. et al. [12] used I/O model to evaluate Thailand green GDP. The proportion of total greenhouse gases (GHG) contribution to GDP is about 2% from degradation impact of GHG emissions. In additionally, in their results, the proportion between GDP and green GDP is lower than this study due to their study evaluated in macroeconomic level. In context of individual sector study, Kunanuntakij K. et al. [13] used LCI-LCA method to evaluate green GDP of the refinery sector during the year 2010–2012, the result is about 2–4% lower than GDP due to environmental impacts such as photochemical oxidant, eutrophication, acidification, and climate change. For Thailand’s sugar industry, Pantavisid S. [14], studied environmental cost of goods and service production in Thailand by I/O model, the result shown that environmental cost of sugar production (cultivation, transportation and sugar production included) is about 0.05 $/$ of sugar production.

1.1.3. Towards Integration of Green GDP and Circular Economy

Many economists, scientists, and other scholars such as Silalertruksa et al. [15] evaluated the employment and other socio-economic impacts of the biofuel production in Thailand, the result found that the agricultural improvement and rural development due to biofuels policy need to be urgently promoted socio-economic development including employment generation, economic effects on GDP and trade balance. The highest influence on the change in sugarcane biorefinery was sugarcane yields, which associated with GDP [16]. Giannetti et al. [17] identified two main approaches which a key indicator to measures the economic development of a country by socializing and environmentally. Many the resulting from socio-economic, shown the clearly sustainable about circular economic concept to make the understanding of implementing this concept to all economic stakeholders (e.g., industry, social components, energy, transportation, agriculture, and more) The using of waste as an original resource and adopting the circular economy (CE), such a possible way to reach a new milestone in economic development [18]. The sustainable waste management approach for industrial waste is recycling (or reuse) not only raises green productivity but also reduces the environmental risk from traditional treatment methods such as incineration and landfill [19]. The achievements in the CE implementations in Poland was increasing from 26.5% in 2014 to 34.3% in 2018 [20].
Furthermore, there are many studies about LCA and circular economy. Marit B. and Sigurd V. [21] used the interaction between LCA and circular economy such as “Circular business models (CBMs)” efforts to the environmental sustainability. The sustainable waste management approach for industrial waste is recycling (or reuse) not only raises green productivity but also reduces the environmental risk from traditional treatment methods such as incineration and landfill. The bioelectricity from bagasse and leaf residues in Sugar industry can also be converted into value-added products such as biochar, due to the high carbon content [22]. In the other hand, another interesting environmental impact such as freshwater ecotoxicity due to chemicals that went into sugar production process decreasingly [23].
In this article aims to follow the principles of LCA to create the environmental inventory data, began from cultivation, planting, transportation to the sugar factory and sugar production. The data were collected gate to gate from 2016 to 2019 and the functional unit was per 1 kg sugar to evaluate the green GDP of the sugar industry, their inventory was converted into monetary unit by characterization factor of life cycle impact assessment (LCIA) such as ReCiPe and LIME2. Moreover, the analysis of the factors affecting the green GDP of the sugar industry were studied. The new novelty of this paper is to evaluate the green GDP in the level of industrial sector of “Thailand’s sugar industry” by using the LCA method, and purpose the appropriate circular economy strategies for Thailand’s sugar industry that has a potential to represents a highly effective on their green GDP result.

2. Materials and Methods

2.1. Functional Unit and System Boundary

In this study, the principles of LCA in accordance with ISO 14040 [24], ISO 14044 [25] and the 2006 IPCC (Intergovernmental Panel on Climate Change) guidelines for National GHG inventories [26,27], is followed, begin with planting to transportation to the sugar factory and sugar production, excluding electricity and ethanol production; the method identifies that the chemical inputs and outputs are fossil fuel, non-renewable resources, emission to air, and emission to water, with the functional unit as 1 t of sugar produced. The data were reviewed in our paper from 2016 to 2019.

2.2. Data Sources and Analysis

LCI of sugarcane cultivation and sugar production process was collected in order to prepare the accounting information for environmental impact analysis based on the principles of LCA as shown in Table 1. It was collected by the gate-to-gate from the primary data by onsite-interviewing with sugarcane farmers, which were the contract farming of 15 sugar factories, which a sugar production capacity was 60% of Thailand. The secondary data such as the reports/forms of the departments, ministries, or organizations which measures the emissions to air and emissions to water by calculating.
The scope and format of information storage in the sugar industry, it consists of two parts: factory/establishment data access which uses the average of production data at least one year. The data collection process is divided into two parts: the cultivation process, transportation to the factory and sugar production process. Data regarding to the production process are retrospectively collected at least once in a year and cover production information such as quantity of fresh and burned sugarcane, chemicals, energy, water, fuel, products, waste, etc., as shown in Figure 1.

2.3. Sugar Production in Thailand

For each unit process, the following considerations, conditions, and allocations were indicated in Table 1 shows the most important material inputs emission to water and emission to air for the. About the information of data sources used to create the inventory from field survey in the sugar milling plant and secondary data were referred in Table 1.

2.3.1. Cultivation

Considering the scope of sugarcane cultivation, unit process was land preparation, planting and treatment, and harvesting, the use of fuel and water, chemical fertilizers, pesticides, tops and leaves, and GHG emissions.
  • The chemical fertilizer (15-15-15) 312 kg per hectare was used [28].
  • Diesel use in tractor machine for land preparation and harvesting.
  • Emission to air of ammonia, nitrous oxide and nitrogen oxides due to fertilizer consumption were estimated by [29], whereas calculated from cradle to gate and assume that the fertilizers use in Thailand as N-P-K in terms of Urea, Diammonium phosphate, and Potassium oxide, whereas nitrogen losses to air in terms of nitrous oxide were estimated with a factor of 1%.
  • GHG emissions from fertilizer was calculated from Equation (1).
  • GHG emissions from diesel combustion was calculated from Equation (2).
  • Sugarcane productivity was transported to sugar milling plant, the proportion as 70% fresh sugarcane and 30% burned sugarcane, of all the sugarcane planted per hectare. In addition, the average sugarcane yield is 58 t per hectare.

2.3.2. Transportation

  • Diesel use in transportation, which use diesel amounted 2.30 L per ton of sugarcane.
  • GHG emissions from diesel combustion was calculated from Equation (2).

2.3.3. Sugar Production

  • Diesel, LPG and fuel oil use in stationary machine and GHG emissions from their combustion was calculated from Equation (2).
  • Emission to air and water from sugar production were calculated by Equations (3) and (4), respectively.

2.3.4. GHG Emissions from Fertilizers Use, Transportation and Sugar Production

Fertilizers uses and energy-derived GHG emissions, e.g., CO2, N2O and CH4 were generated impacts on global warming and can be weighted depend on their global warming potential (GWP). The global warming potential is the ratio of substances impact on the global warming impacts of different gases in termed of CO2-equivalent (CO2eq). A GWP is calculated over 100 years regulated under the Kyoto Protocol on the fourth assessment report of the IPCC (AR4) which are carbon dioxide was 1; methane was 25 and nitrous oxide was 298 [33]. Note that GHG emissions from land use change and manpower are not taken into account in this article.
Determine the greenhouse gas emissions from fertilizer and fuel combustion as Equations (1) and (2), respectively.
GHG fertilizer = ( N %   ×   A ) + ( P 2 O 5 %   ×   B ) + ( K 2 O %   ×   C )   +   ( N %   ×   0.01 )   ×   44 / 28
GHG combustion   =   Fuel i   ×   EF i
where is
GHGfertilizer = Greenhouse gases emission caused by the use of chemical fertilizers (kgCO2eq).
N%, P2O5% and K2O% = The percentage of Nitrogen, Phosphate and Potassium, respectively.
A, B and C = The emission factor of Urea fertilizer, DAP and Potassium Chloride, respectively (kgCO2eq) [20].
GHGcombustion = Greenhouse gases emission caused by fuel combustion (kgCO2eq)
Fueli = Quantity of fuel type i (TJ).
EFi = Emission factor of combustion of fuel type i (kgCO2/TJ, kgCH4/TJ and kgN2O/TJ) [26].

2.3.5. Airborne Emission from Sugar Production

For sugar production, not only GHG emissions from fertilizers use, transportation and sugar production. The others of airborne emission could calculate the quantity from Equation (3) [34]
  Emission j = ( C ppm   ×   MW 24.45 )   ×   Q a   ×   T a
where is
Emissionj = Airborne emission type j (kg/year).
Cppm = Concentration of airborne emission (ppm).
MW = Molecular weight of airborne emission type j (g).
Qa = The flow rate of airborne emission (m3/h).
Ta = The temperature of airborne emission (°C).

2.3.6. Waterborne Emission from Sugar Production

The waterborne emission is calculated from the data published in sugar production at the country level as shown in Table 1. The basic equation used to calculate the quantity of waterborne emission as follows Equation (4) [34]
Emission k = Q w   ×   W out   ×   day 1000
where is
Emissionk = Waterborne emission type k (kg/year).
Qw = Wastewater generated (m3/day).
Wout = Quantity of waterborne emission type k (mg/L).
Day = Working day (day/year).

2.4. GDP of Sugar Industry

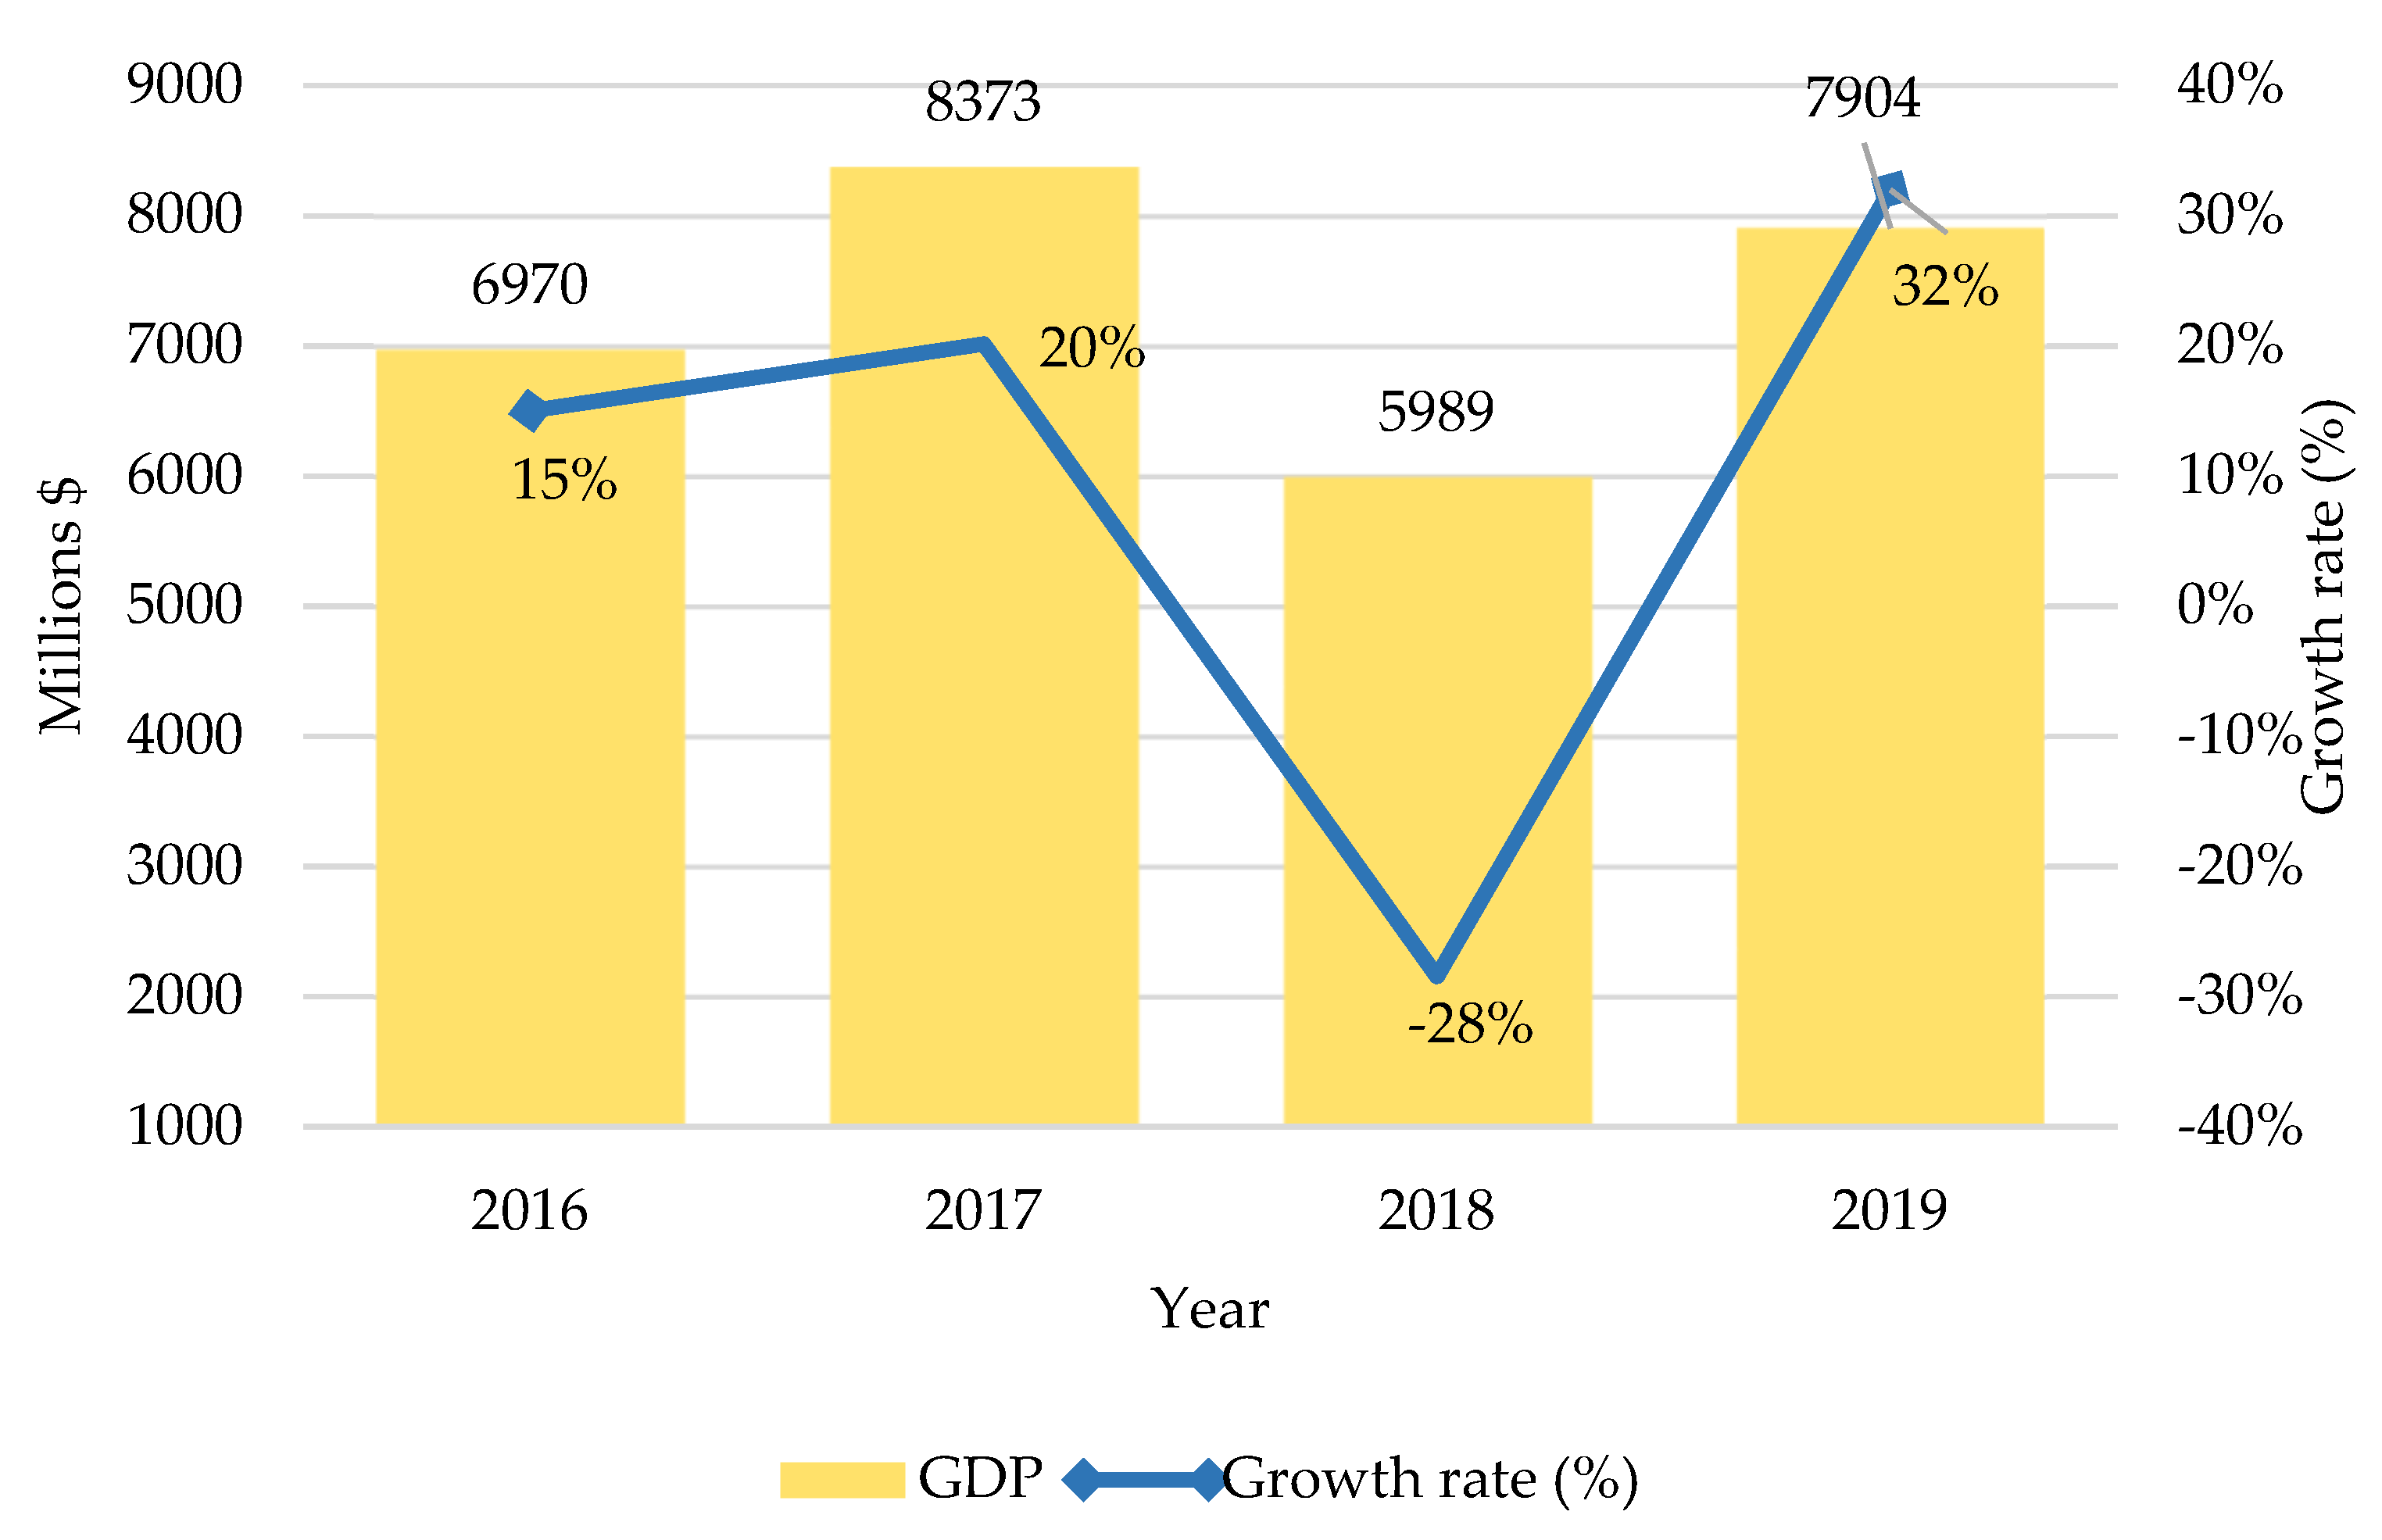
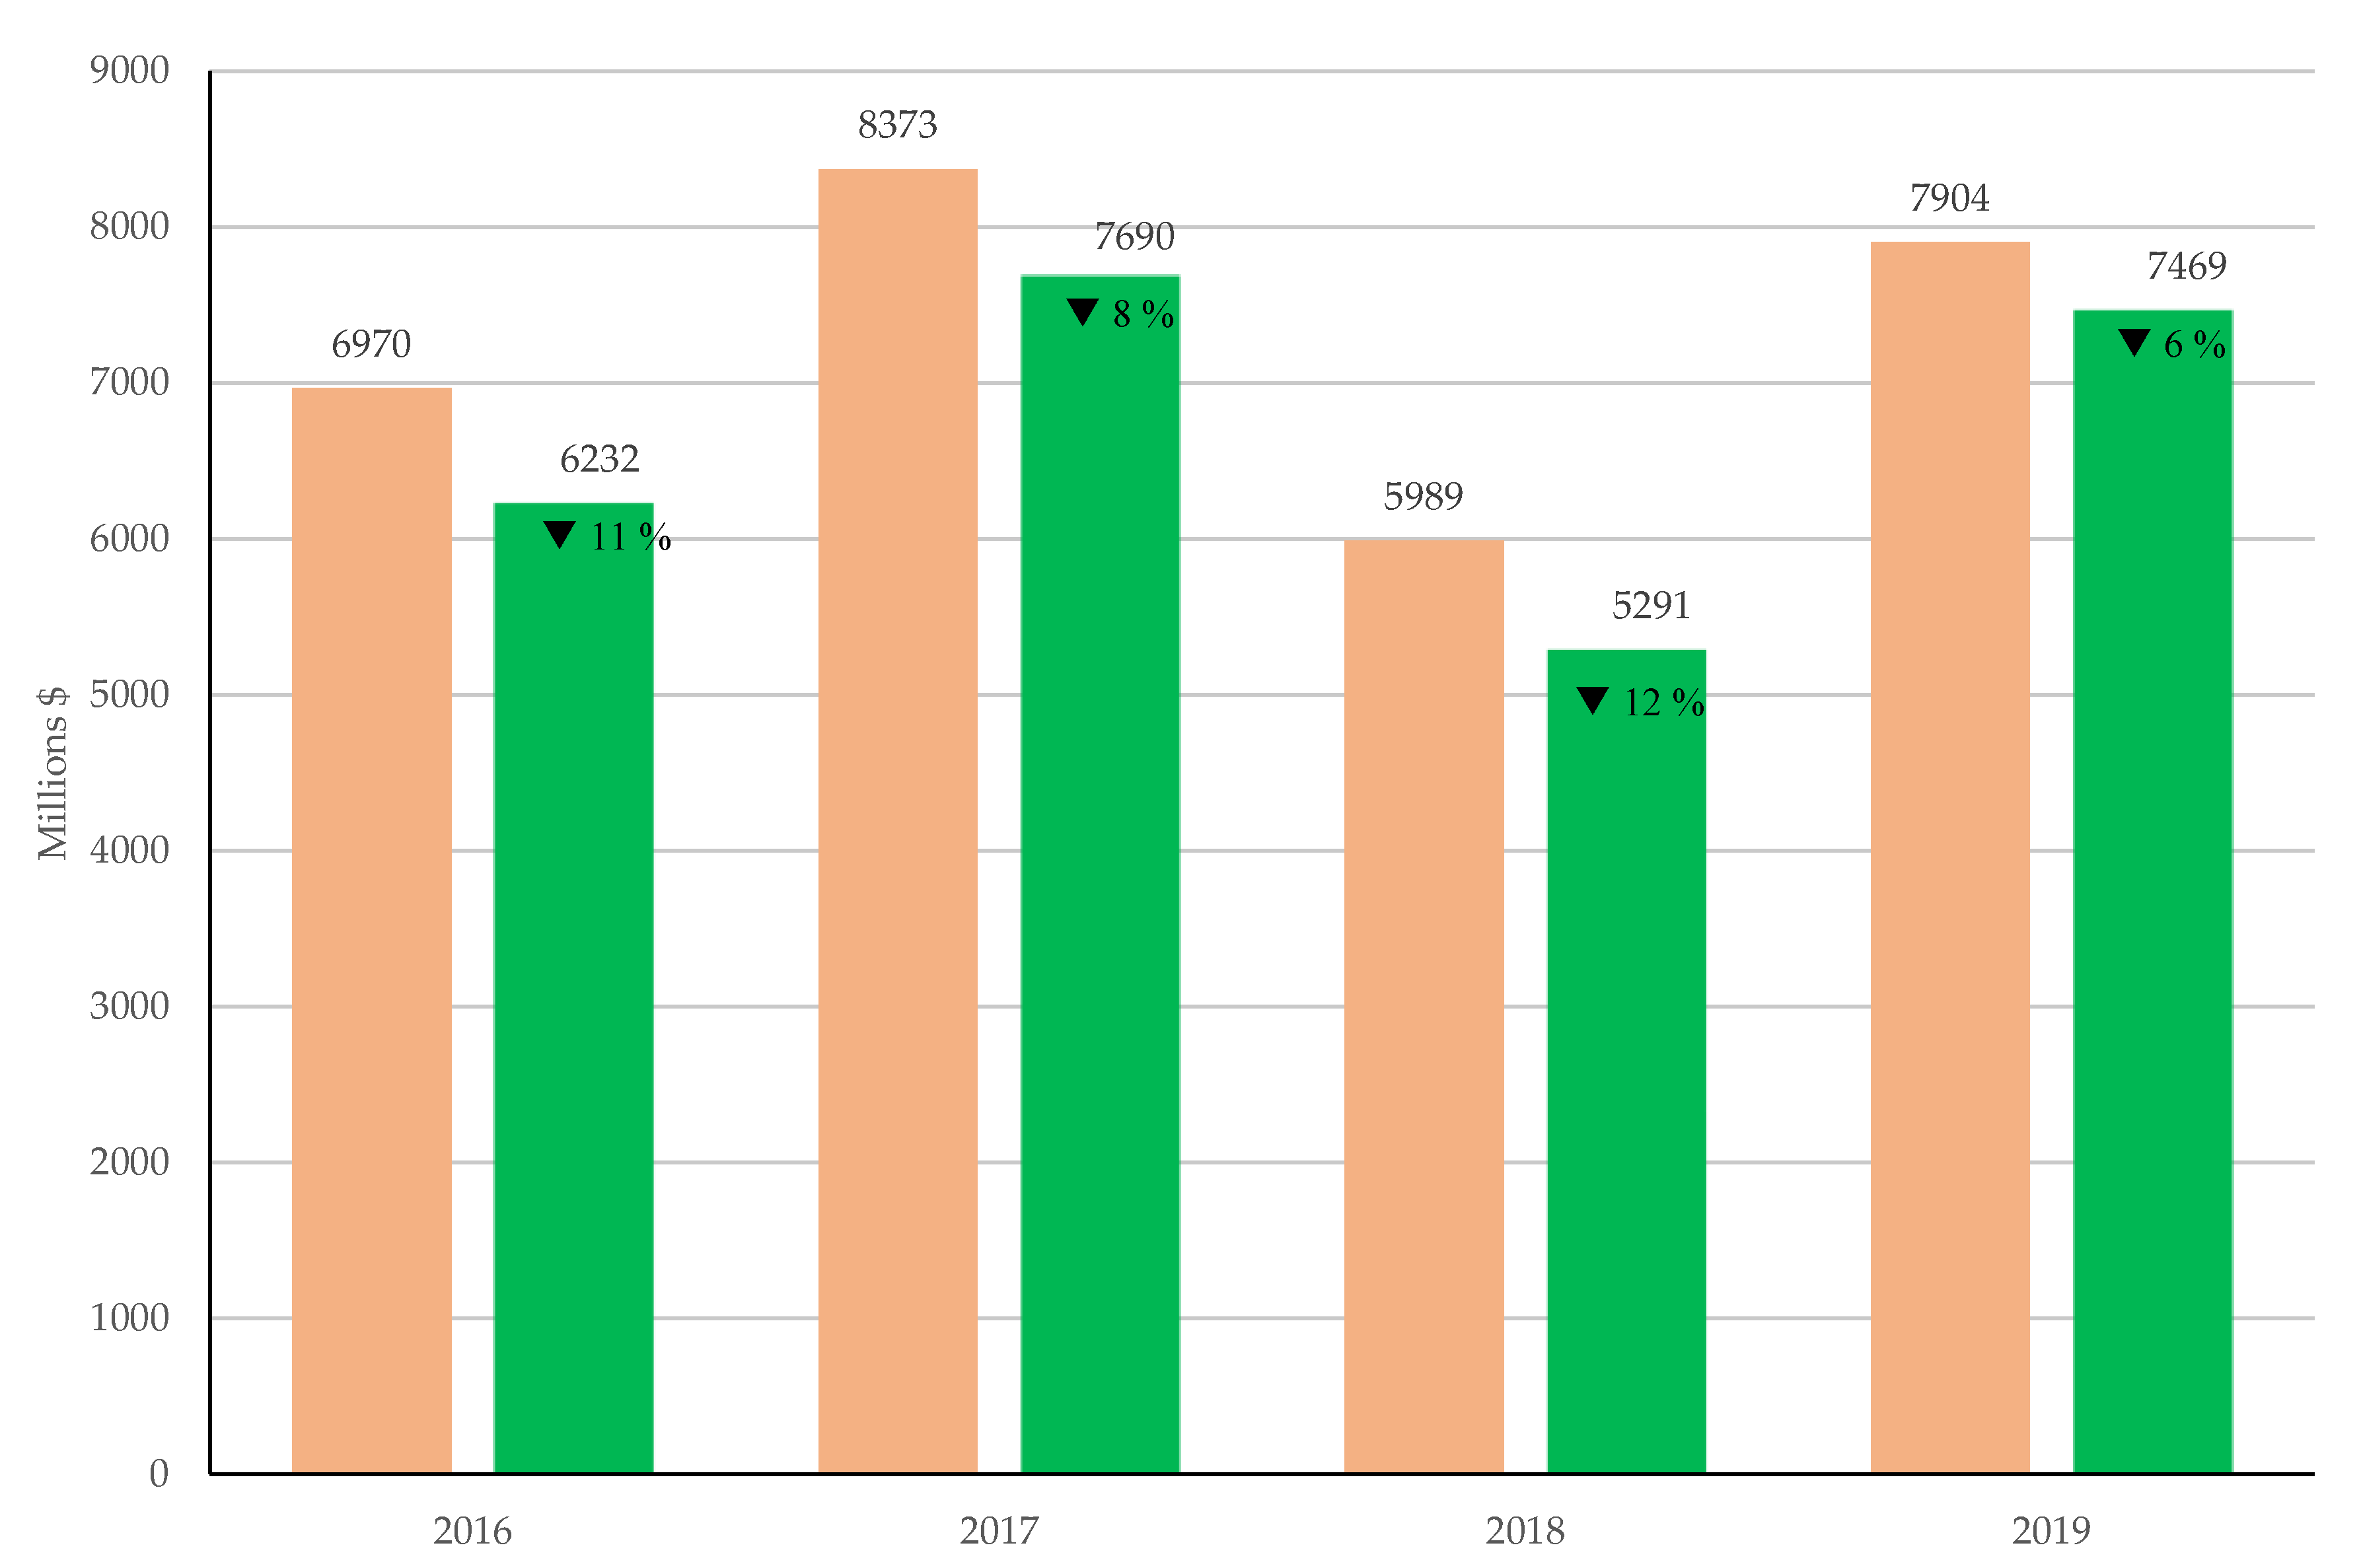
The primary data of Sugar industry’s GDP at current market price year 2016–2019, from NESDC [35] used in this article as shown in Figure 2. GDP is the summation of the market prices of goods and services in final of industry sector that produced domestically for a period of time, normally measured annual year. In this study, the scope of GDP’s sugar industry is referred by I/O table covers the sugarcane cultivation and sugar production but the electricity generation not included due to bagasse will use in the electricity generation. As mentioned, the process of electricity generation excluded.

2.5. Green GDP Model

The impact was evaluated through LCA; then, when the value comes up, it is assessed with respect to the value of the environment. The value of the entire group is divided into two characteristics, which are depletion cost and degradation cost [11]. The value of these two environmental impacts is based on the LCIA, and the value is shown in this study is $ per unit.
The resource consumption, e.g., fossil fuel, water use converted to depletion cost based on ReCiPe method, which is resources surplus costs, expressed as the surplus costs of the future resource production over an infinitive timeframe and displayed in $/kg of resource consumption. For example, weighting factor of diesel oil was 0.18 $/liter [36].
The depletion cost can be evaluated by using the following relation:
  DPC t = i ( RC i   ×   MAC i )
where is
RCi is the resource consumption, the use of fossil fuel type i, in the L, kg, etc.
MACi is the marginal abatement cost of the use of fossil fuel type i, in $/L, $/kg, etc.
Meanwhile, the quantity of airborne emission and waterborne emission such as TSP, HCl, CO2, SO2, NOx, COD and BOD was generated to assessed as the environmental impact “Degradation cost” based on the LIME2 method, which is an environmental impact method displayed in JPY/kg of emission. The life cycle impact assessment method based on Endpoint modeling (LIME) is statistical analysis and purposes to average weighting factors based on damage-oriented approach and willingness to pay. For example, weighting factor of CO2 substance was 2.33 JPY/kg CO2 [37].
In addition, the degradation cost can be evaluated by using the following relation:
  DGC t = j , k ( S j , k   ×   DMC j , k )
where is
Sj,k is the substance type j emitted to the compartment type k, in kg, ton, L, etc.
DMCj,k is the damage cost of the generation of the substance type j emitted to the compartment type k, in $/kg, $/ton, etc.
As mentioned, the currency unit displayed in this study is $ per unit, to be used in this study, the value needs to be converted from JPY into $ by the principle of PPP (purchasing power parity).

2.5.1. Purchasing Power Parity (PPP)

Due to the environmental cost involved from environmental degradation and depletion, energy depletion resources and emission to air and water were taken into consideration in this study. To adapt the model to this study, it was assumed that the degradation cost and the depletion cost is proportional to the per capita income (GDP expressed in terms of PPP) to convert into a considered year [38]. The environmental cost for this study is thus presented by the following equation:
EC USD = EC j   ×   GDP ( PPP ) US GDP ( PPP ) JPY
where is
ECUSD = Environmental cost ($/unit).
ECj = Degradation cost of emissions type j (JPY/unit).
GDP(PPP)US = GDP per capita of United States (Millions of $).
GDP(PPP)JPY = GDP per capita of Japan (Millions of JPY).

2.5.2. Green GDP Calculation

Modeling and valuation of green GDP of sugar industry in Thailand were carried out. As far as green GDP valuation of sugar production is concerned, it is evaluated by using the prevailing market prices, from which the depletion cost and the degradation cost are subtracted, and the green GDP value is calculated by using Equation (8):
Green   GDP s = GDP s   -   ( DPC t + DGC t )
where is
Green GDPs = Green gross domestic product of the sugar industry (Millions of $).
GDPs = Gross domestic product of the sugar industry (Millions of $).
DPCt = Total of depletion cost (Millions of $).
DGCt = Total of degradation cost (Millions of $).

3. Results and Discussion

3.1. Life Cycle Inventory of Sugar Industry

The result obtained from accounting for all the environmental items throughout the life cycle is expressed per functional unit, which is 1 t of sugar.
The process of sugarcane cultivation in sugar production consists of sub-steps which include soil preparation, planting, and harvesting. In the soil preparation step, diesel oil is using 56 L per hectare. The primed with 9.38 t of manure per hectare. The sugarcane is planted and maintained by water at a rate of 43,750 L per hectare. The amount of carbon dioxide and nitrous oxide are generated from diesel oil combustion of land preparation, chemical fetilizer of planting and treatment about 22.56 kg of CO2 per hectare and 0.12 kg of N2O per hectare, respectively. A cycle of sugarcane planting is 12 months. Most of the planting areas are located in the Northeast of Thailand, amounting to more than 37%. After sugarcane cultivation period, top and leaves 0.20 kg per hectare [30] were plough and burned by post-harvesting.
In the sugar production process, starting from juice extraction; the products are sugarcane juice and bagasse. The bagasse is using in the sugar production and electricity generation. Diesel oil, LPG and fuel oil were used about 99% of total energy consumption. The by-product is sludge or filter cake, which is distributed to farmers as fertilizer and also the molasses is for ethanol production. Some chemicals use such sodium acrylate, di-glyceride, amylase, sodium hydroxide (NaOH), isopropyl alcohol, etc. The average amount of sugar produced is 0.11 t per 1 t of sugarcane input [31]. The life cycle inventory of sugar production is shown in Table 2.

3.2. Green GDP of Sugar Industrial Sector Evaluation

The life cycle inventory as shown in Table 2 was calculated by scaling up by the total productivity of sugar production, The LCI of sugar industrial sector used to assess the environmental impact with regard to two costs: depletion cost and degradation cost. This is to assess the environmental impact of the loss of resources and the loss of quality of the environment in the form of money which can be deducted from the gross domestic product at the current market price of the sugar industry. In this article we provided the LCIA methods namely ReCiPe and LIME2, which is used the characterization factor of endpoint to convert the consumption of resources, energy and emissions occurring to environmental cost ($) into resource consumption (depletion cost) and damage cost (degradation cost) each stage of life cycle and compare by the proportion of environmental cost.
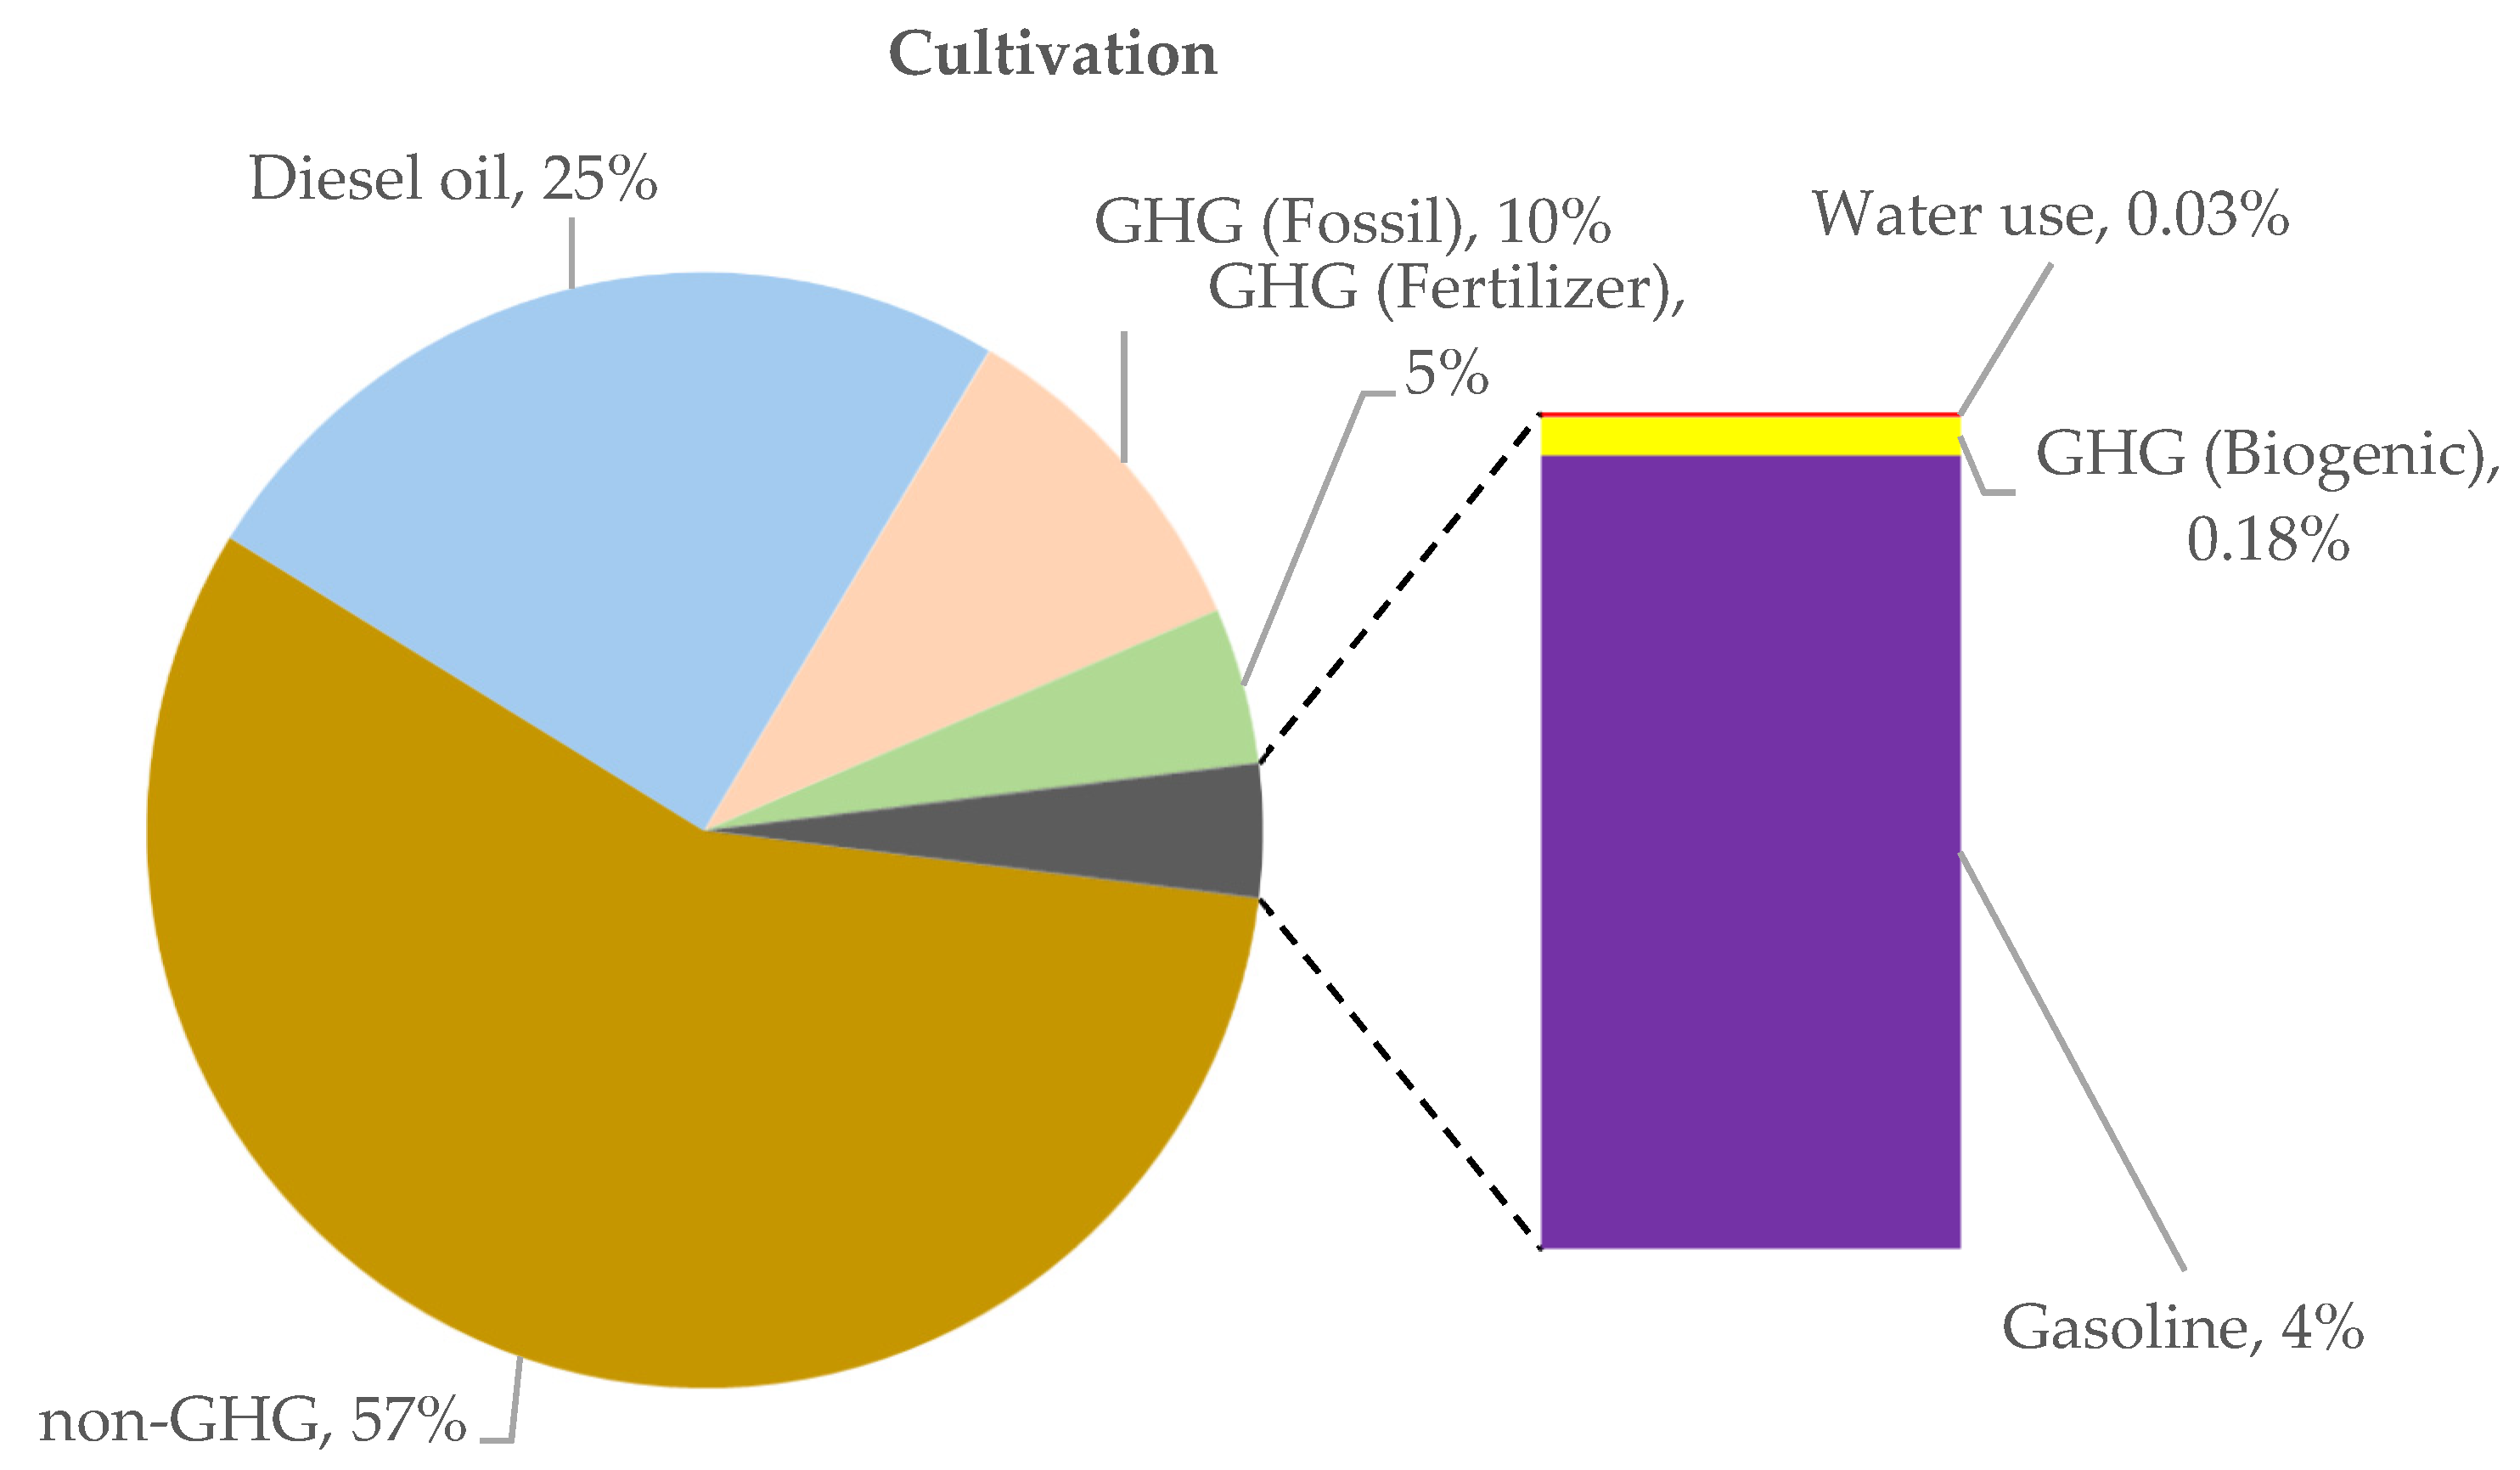
In the sugarcane production from the study as shown in Figure 3, total environmental cost approximately about 200 million $, the highest was from non-GHG emissions, e.g., TSP, CO, SO2 etc. due to the cane trash burning after harvesting, it approximately about 57% of total environmental cost in this stage due to the most of farmers do not have a high technology for harvesting by machine. As such, there is possibly to change the condition by putting cane trash open burning outside the sugarcane production, the magnitude of the decreases is in the order of 0.1% for GHG emissions to 13.1% for TSP, CO [30]. The contributions from diesel use and gasoline use to all environmental cost about 25% and 4%, respectively, it causes to GHG emissions from fossil combustion about 10%. The use of N fertilizer applied was approximately emitted GHG emissions about 5% of total environmental cost in this stage. About the contribution from water use are not as significant due to in cultivation, the water use relies on rainy season.
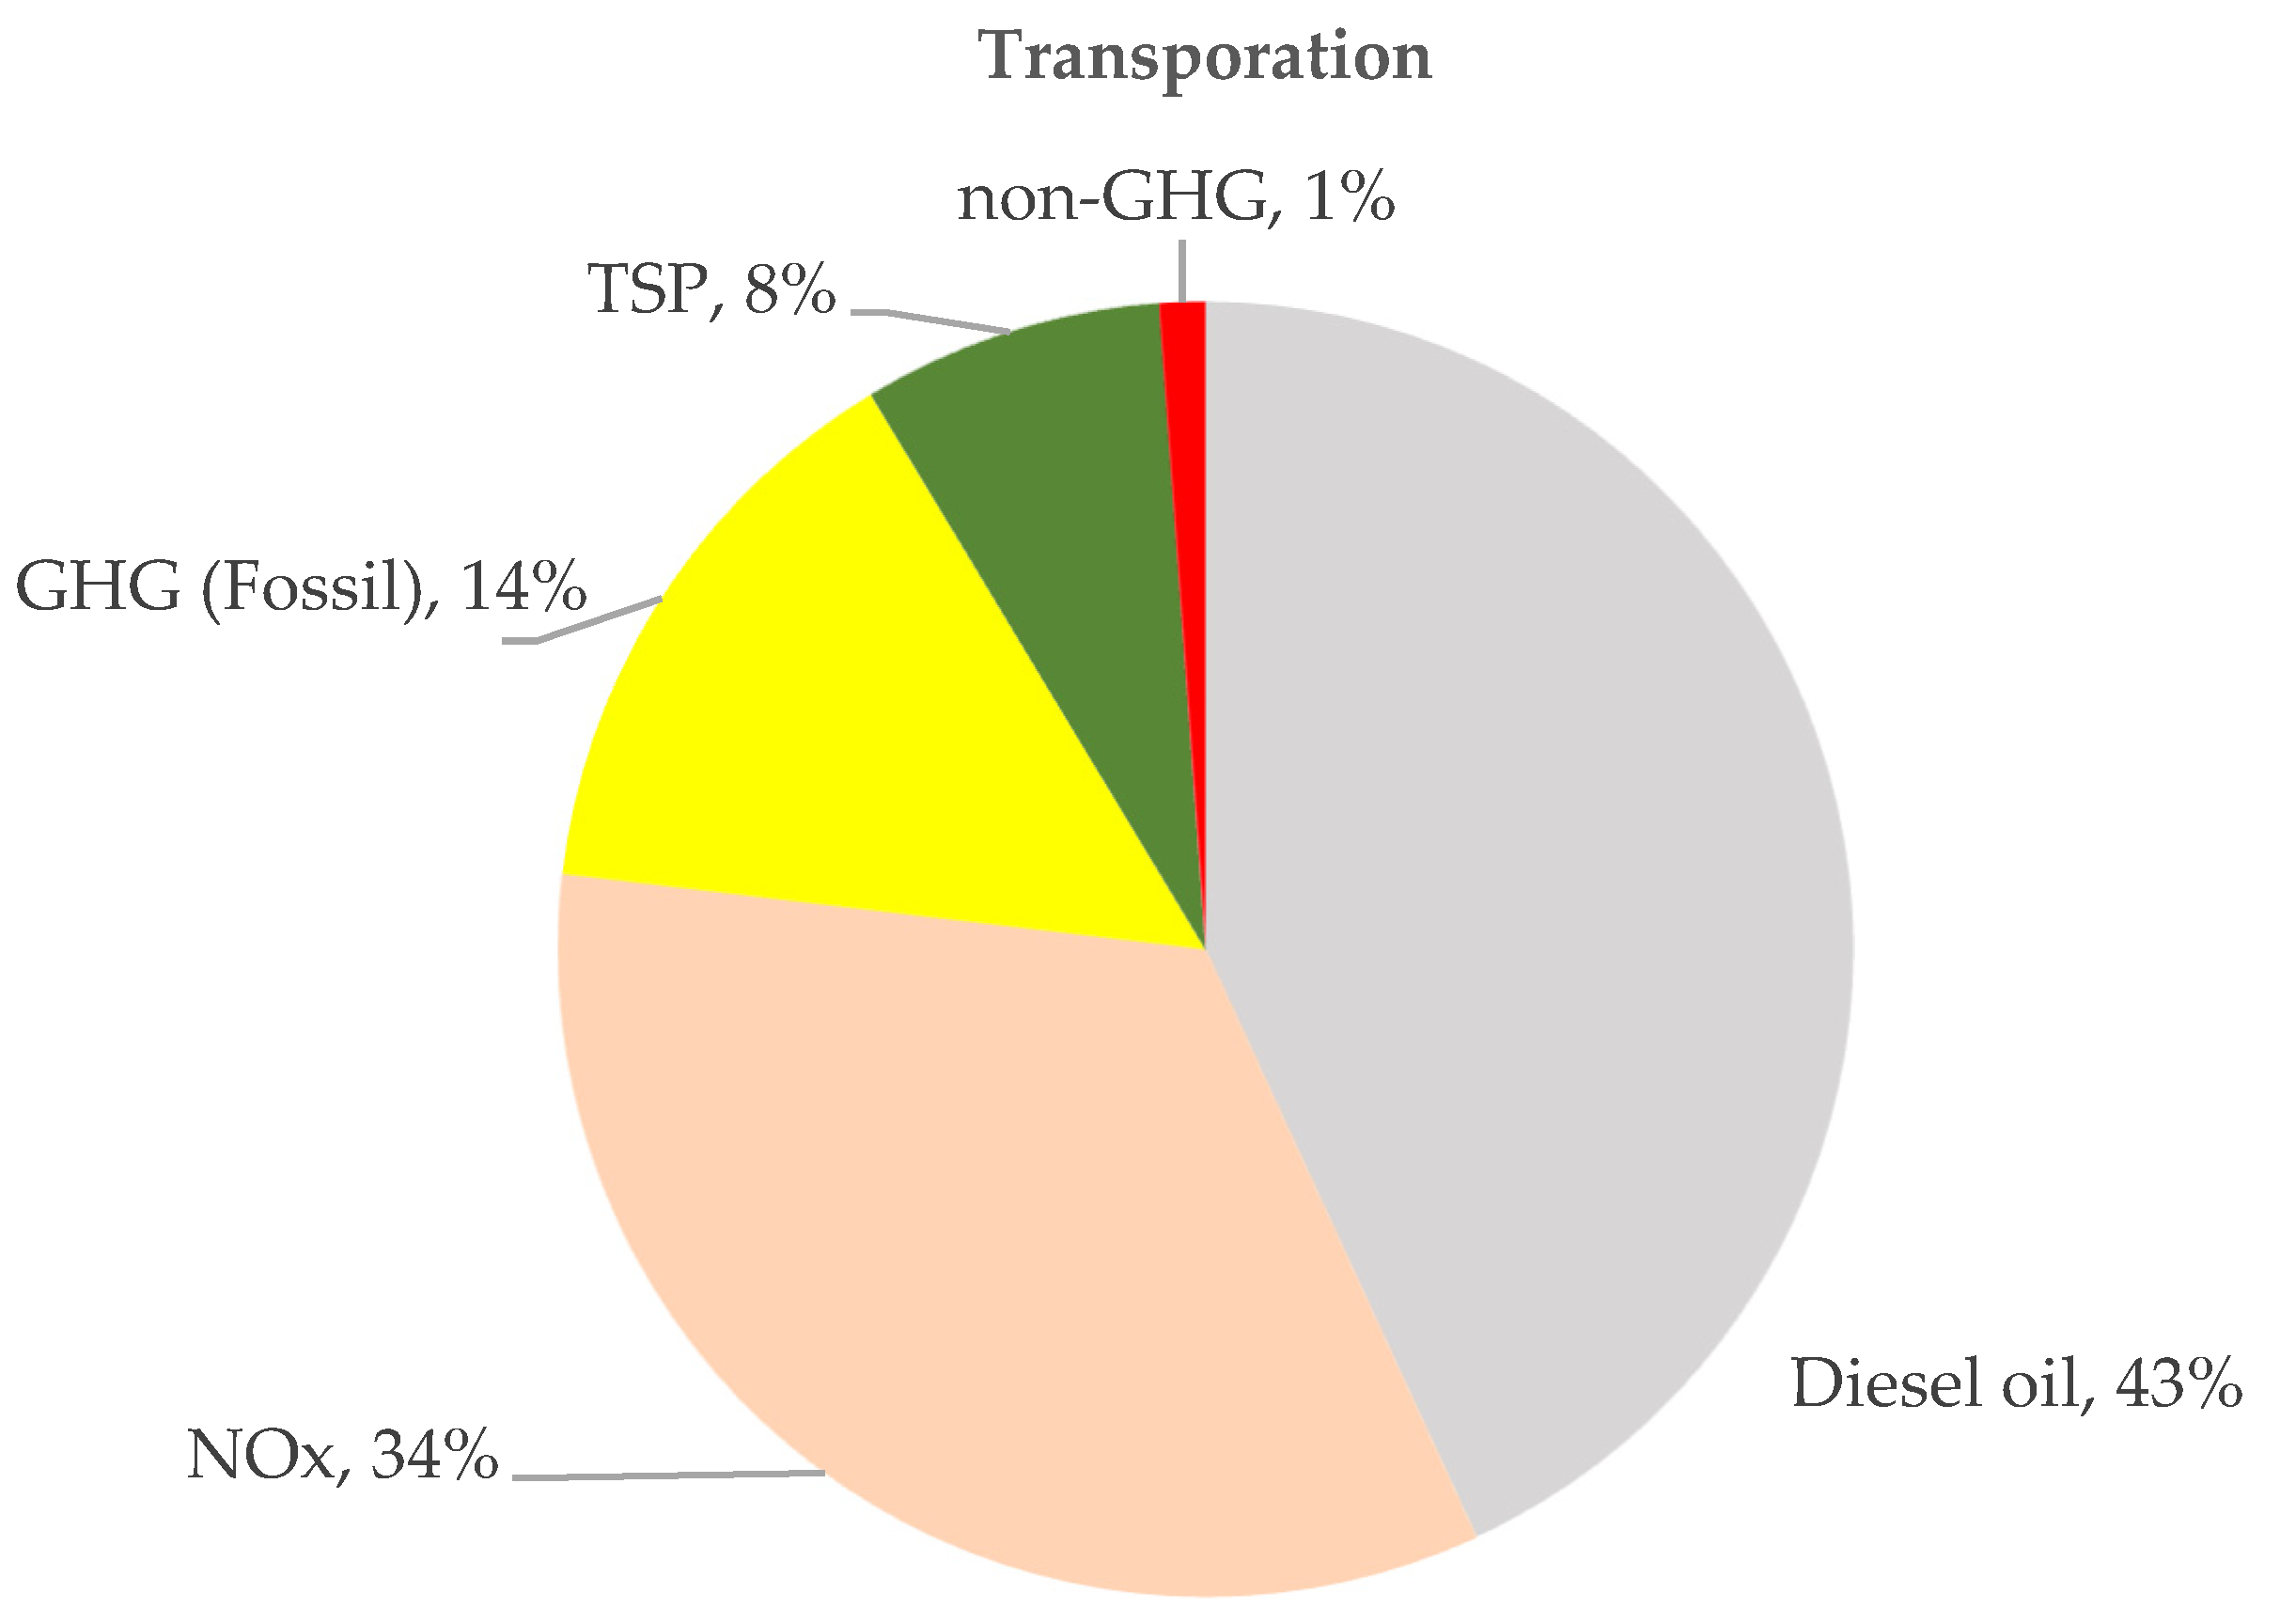
The following stage as shown in Figure 4, transportation have the total environmental cost about 96 million $. The main contribution was from diesel oil use in 10-wheels and 18 wheels about 43% of total environmental cost in transportation stage, it causes to degrade the air pollution aspect of NOx and GHG emissions about 34% and 14%, respectively. The contributions of NOx emission from fossil fuel combustion were high, due to affected by degradation cost factor, the degradation cost for NOx about 530.75 JPY/kg of NOx [37] (12.72 $/kg) when comparison with others air emissions (e.g., carbon dioxide or carbon monoxide).
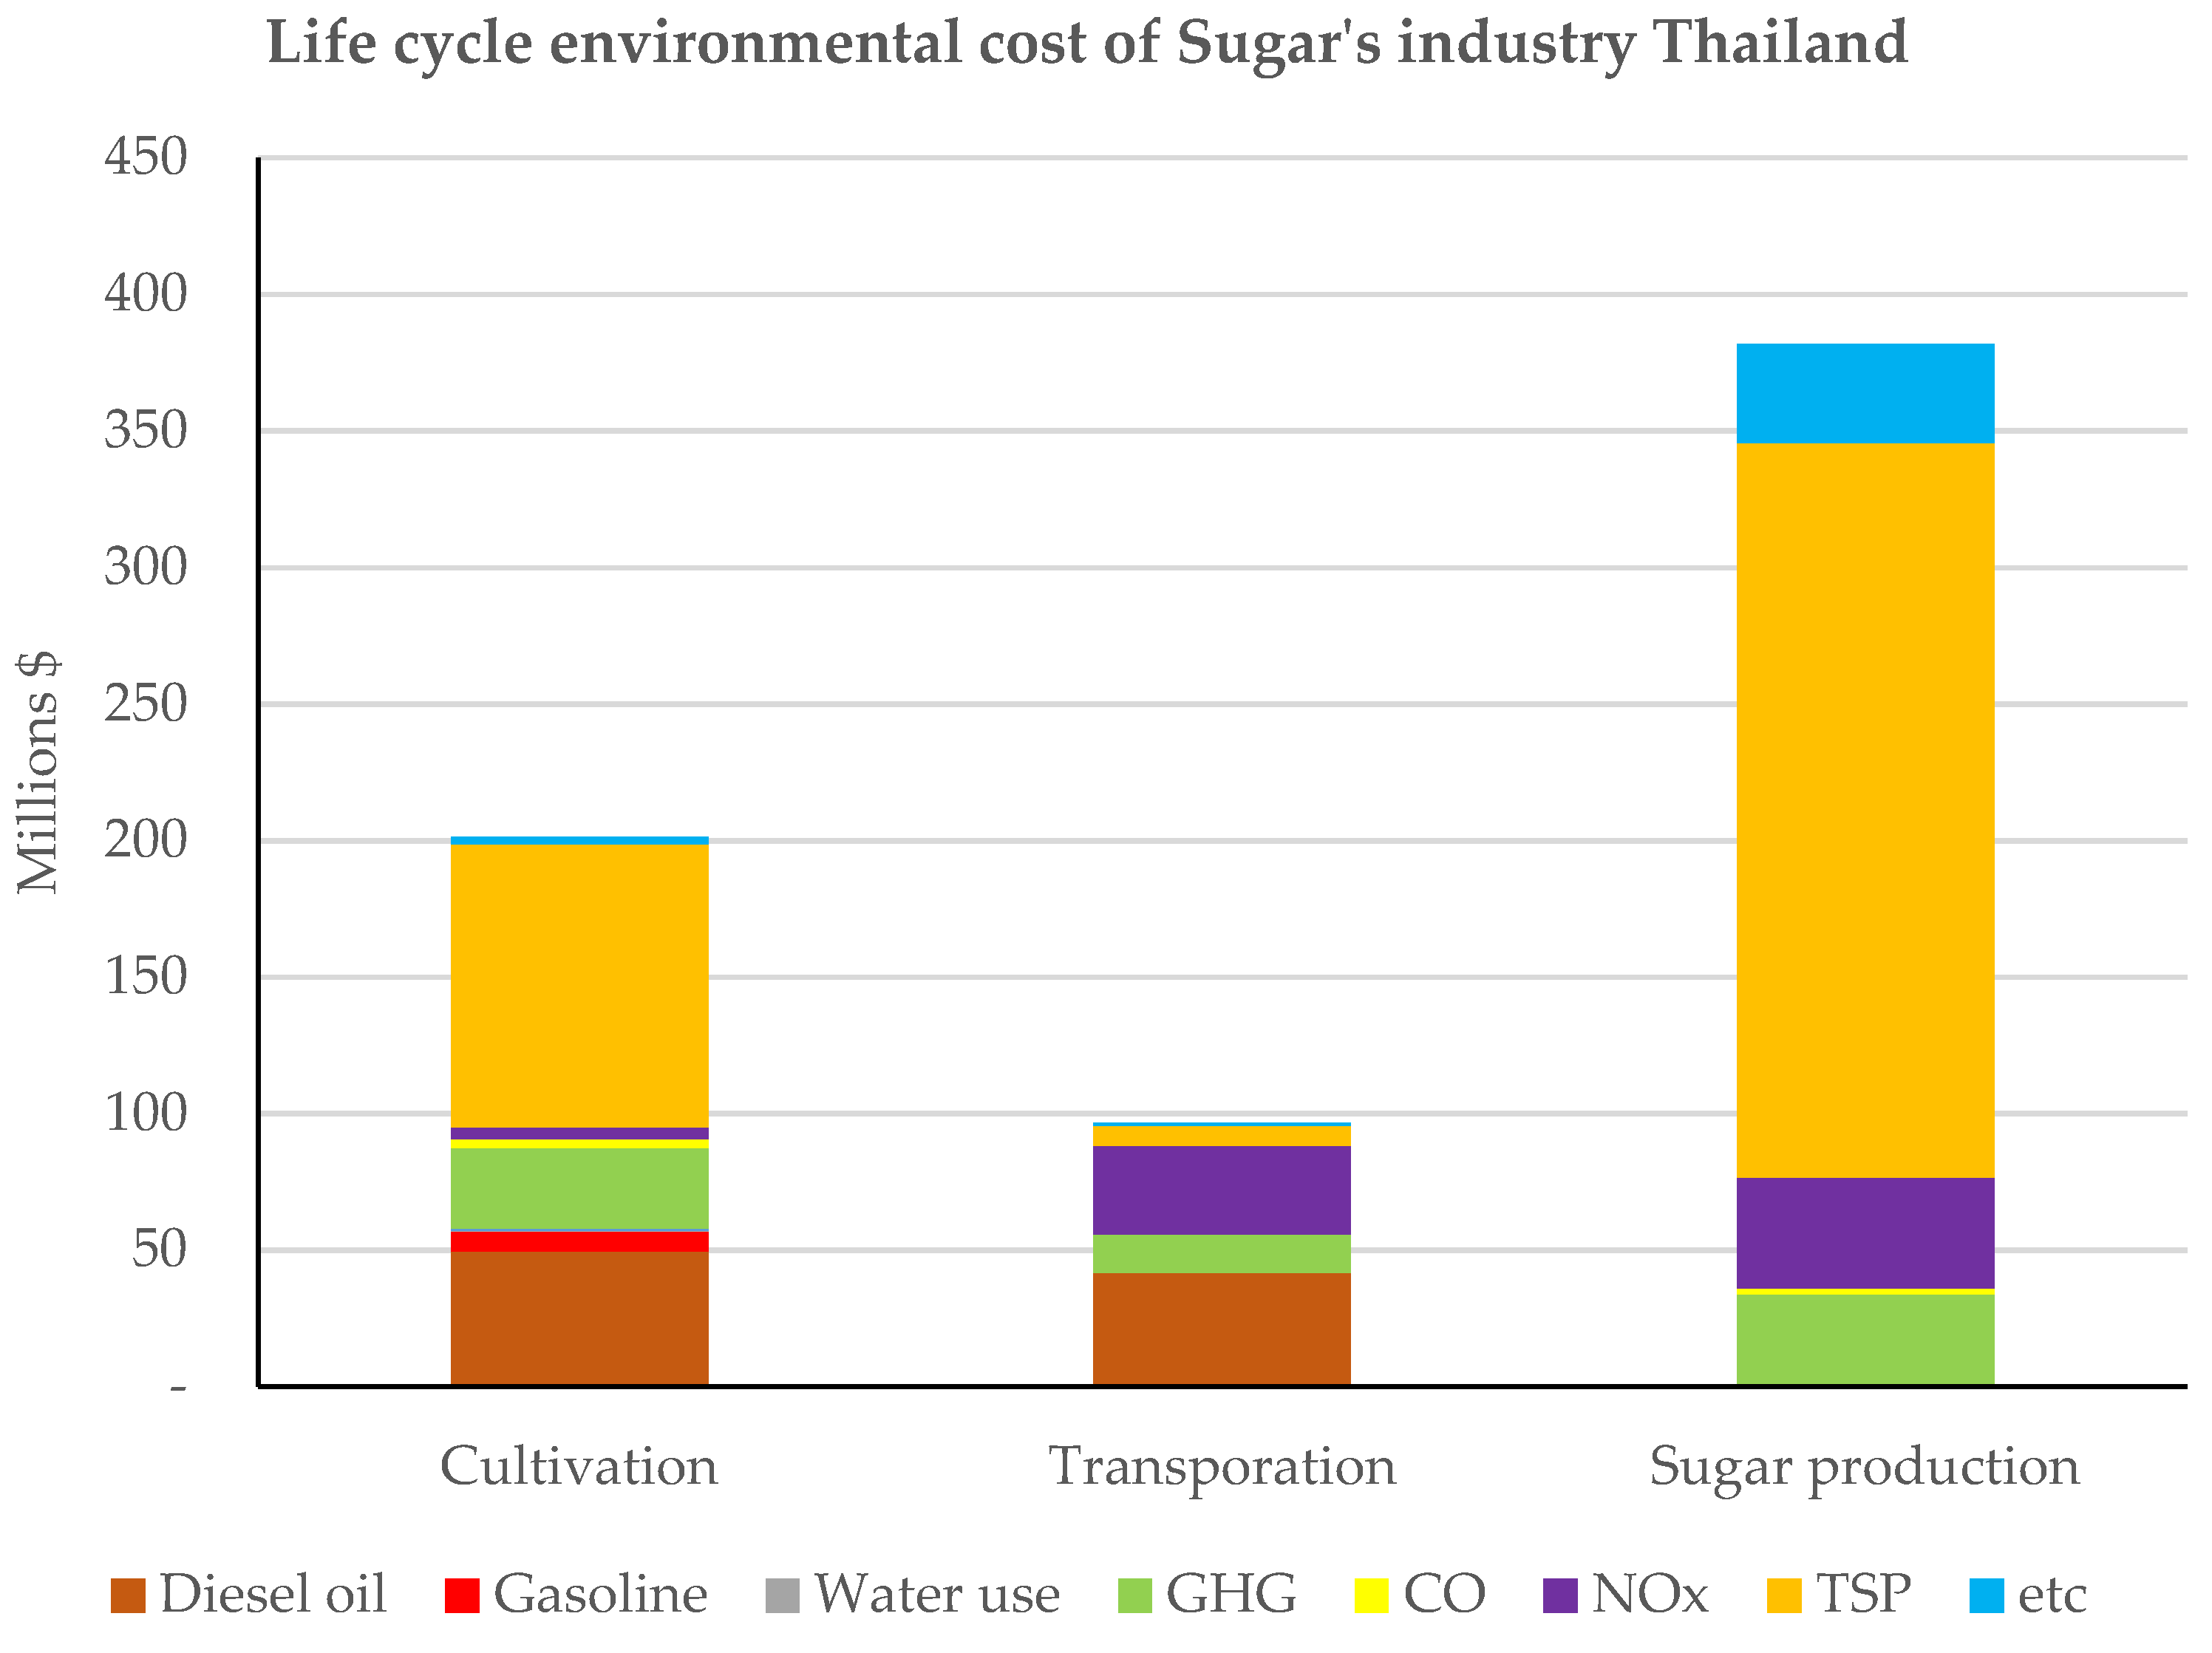
The total environmental cost of sugar production stage about 380 million $ or 56% of total environmental cost whole life cycle. As shown in Figure 5. Illustrates the total environmental cost from life cycle of sugar’s industry Thailand, which comes from cultivation 30%, transportation 14% and sugar production 56%. The main contribution was TSP involved more 55% of life cycle environmental cost or about 380 million $, following by diesel oil use about 14% (91 million $) and GHG emissions approximately 11% (77 million $). The proportion of total environmental cost of this study approximately 0.03–0.05 $/$ of sugar production.
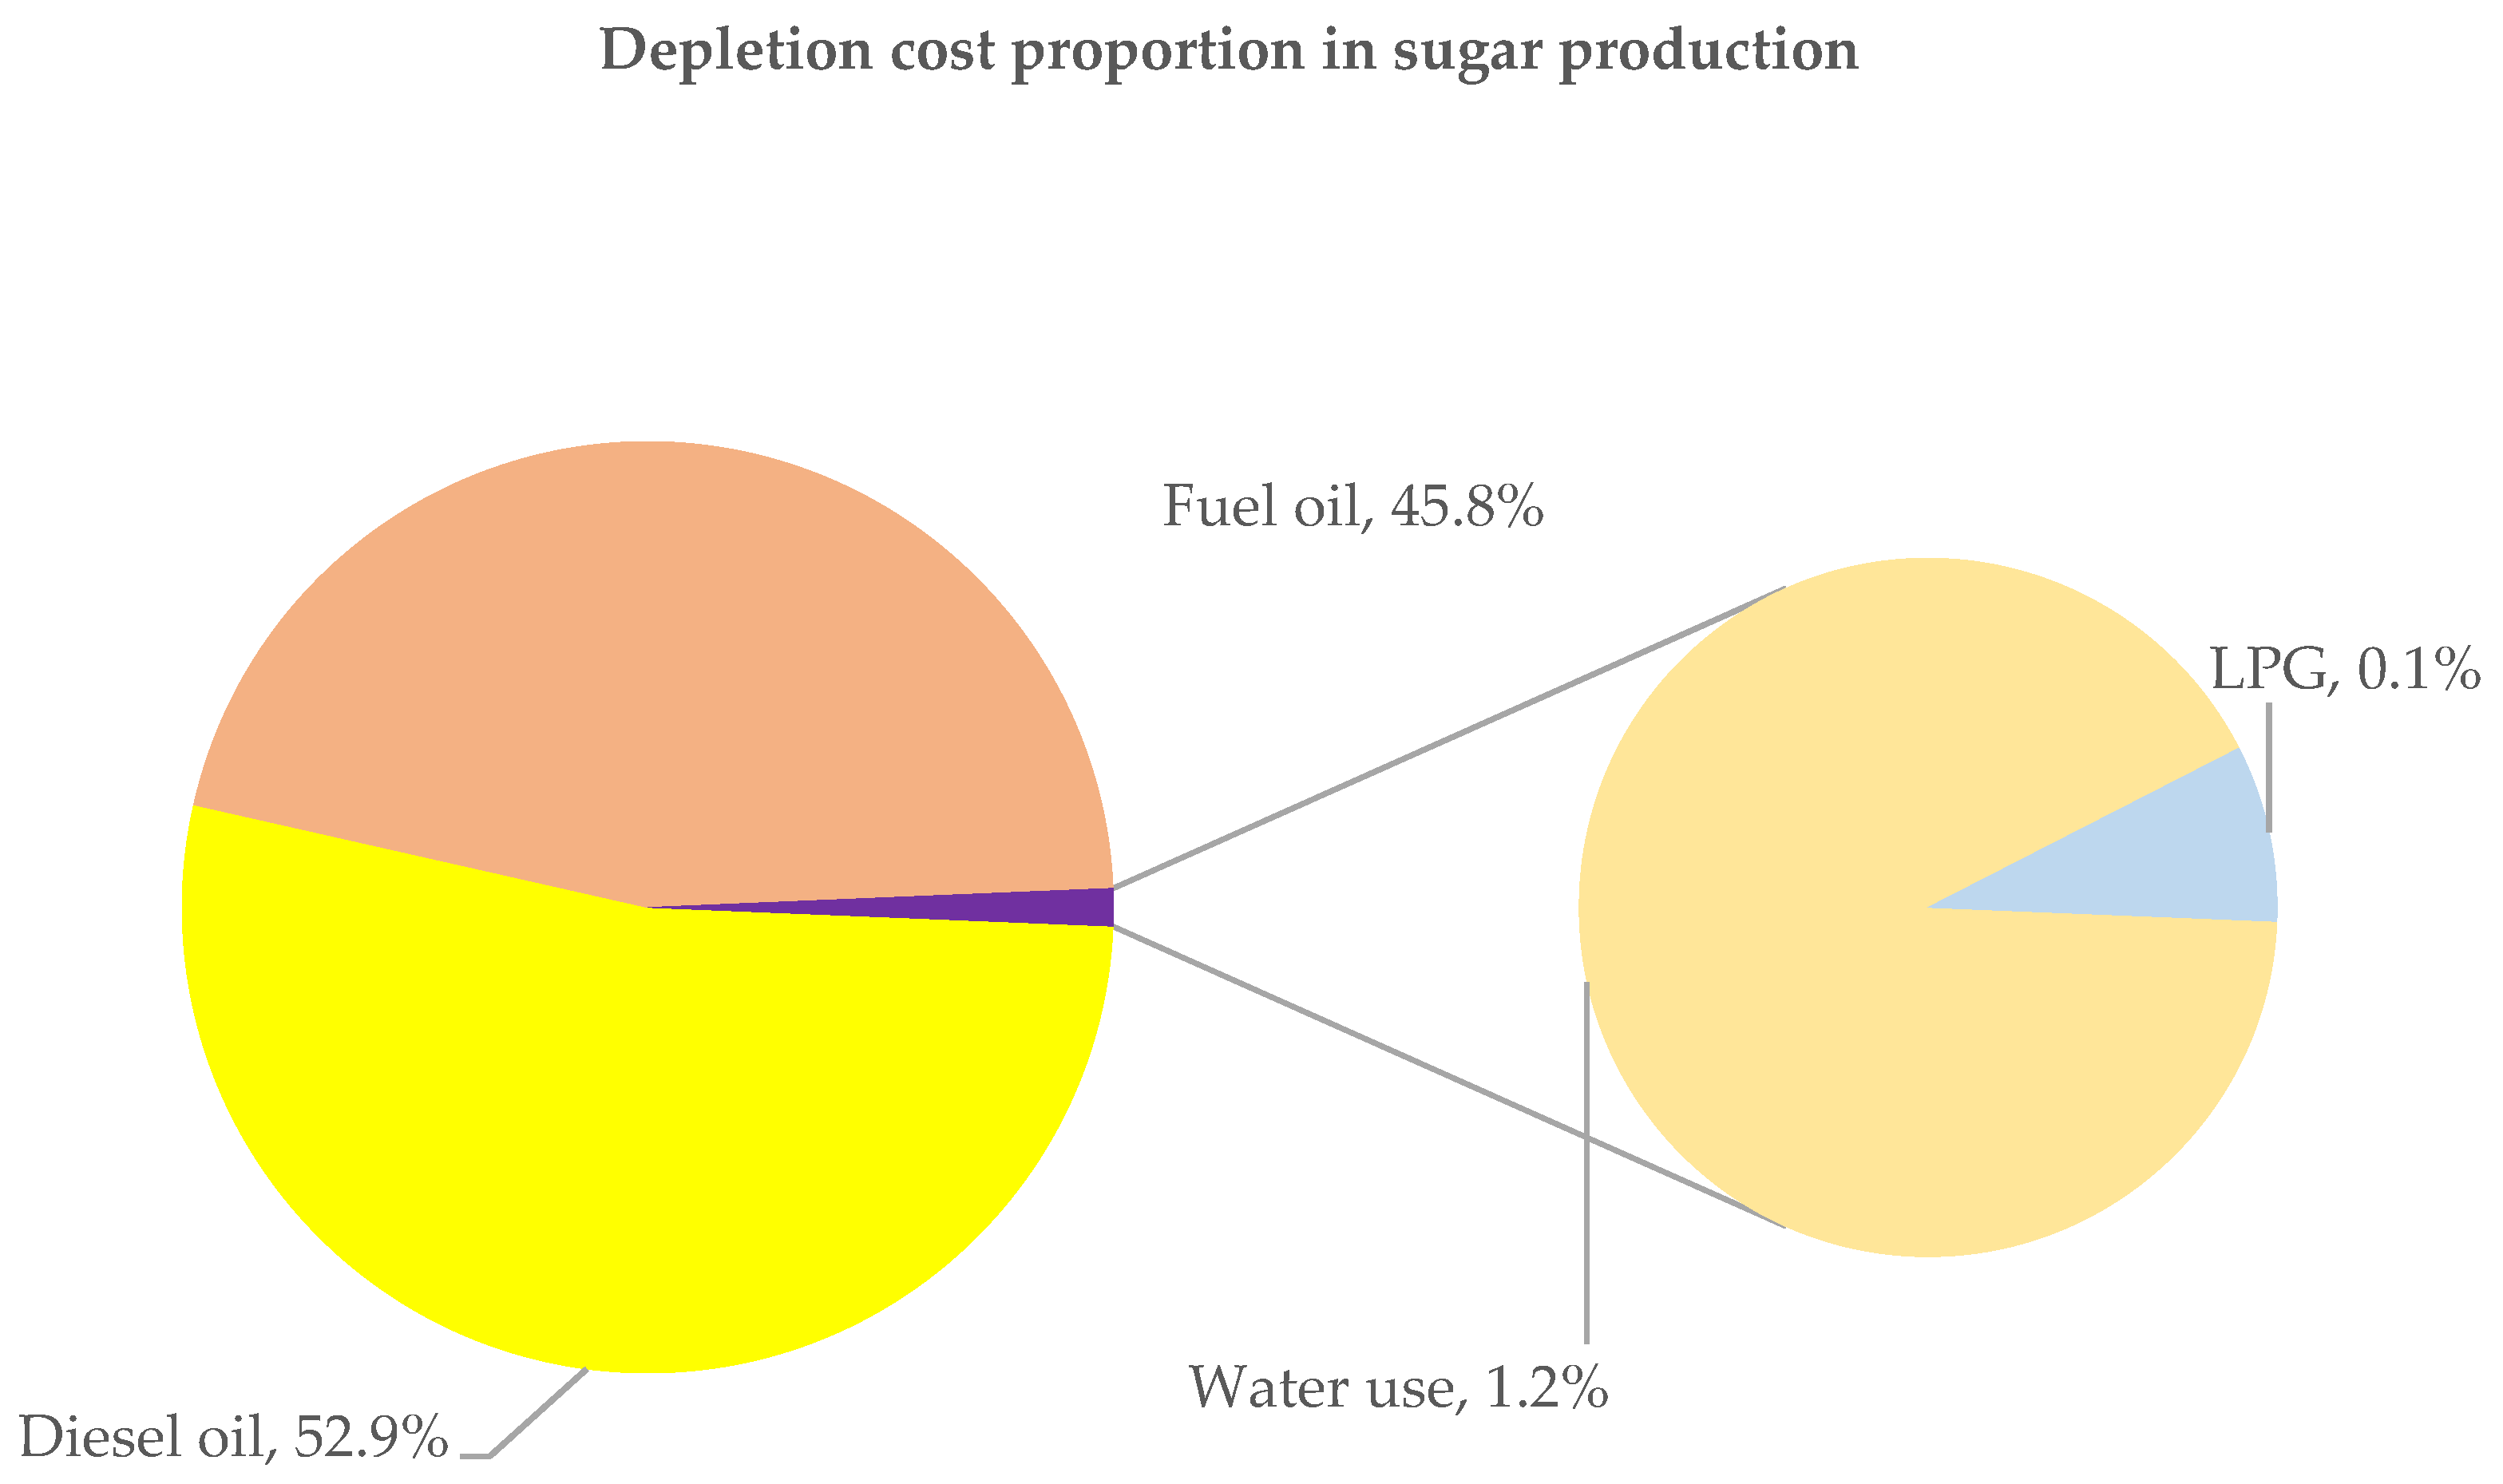
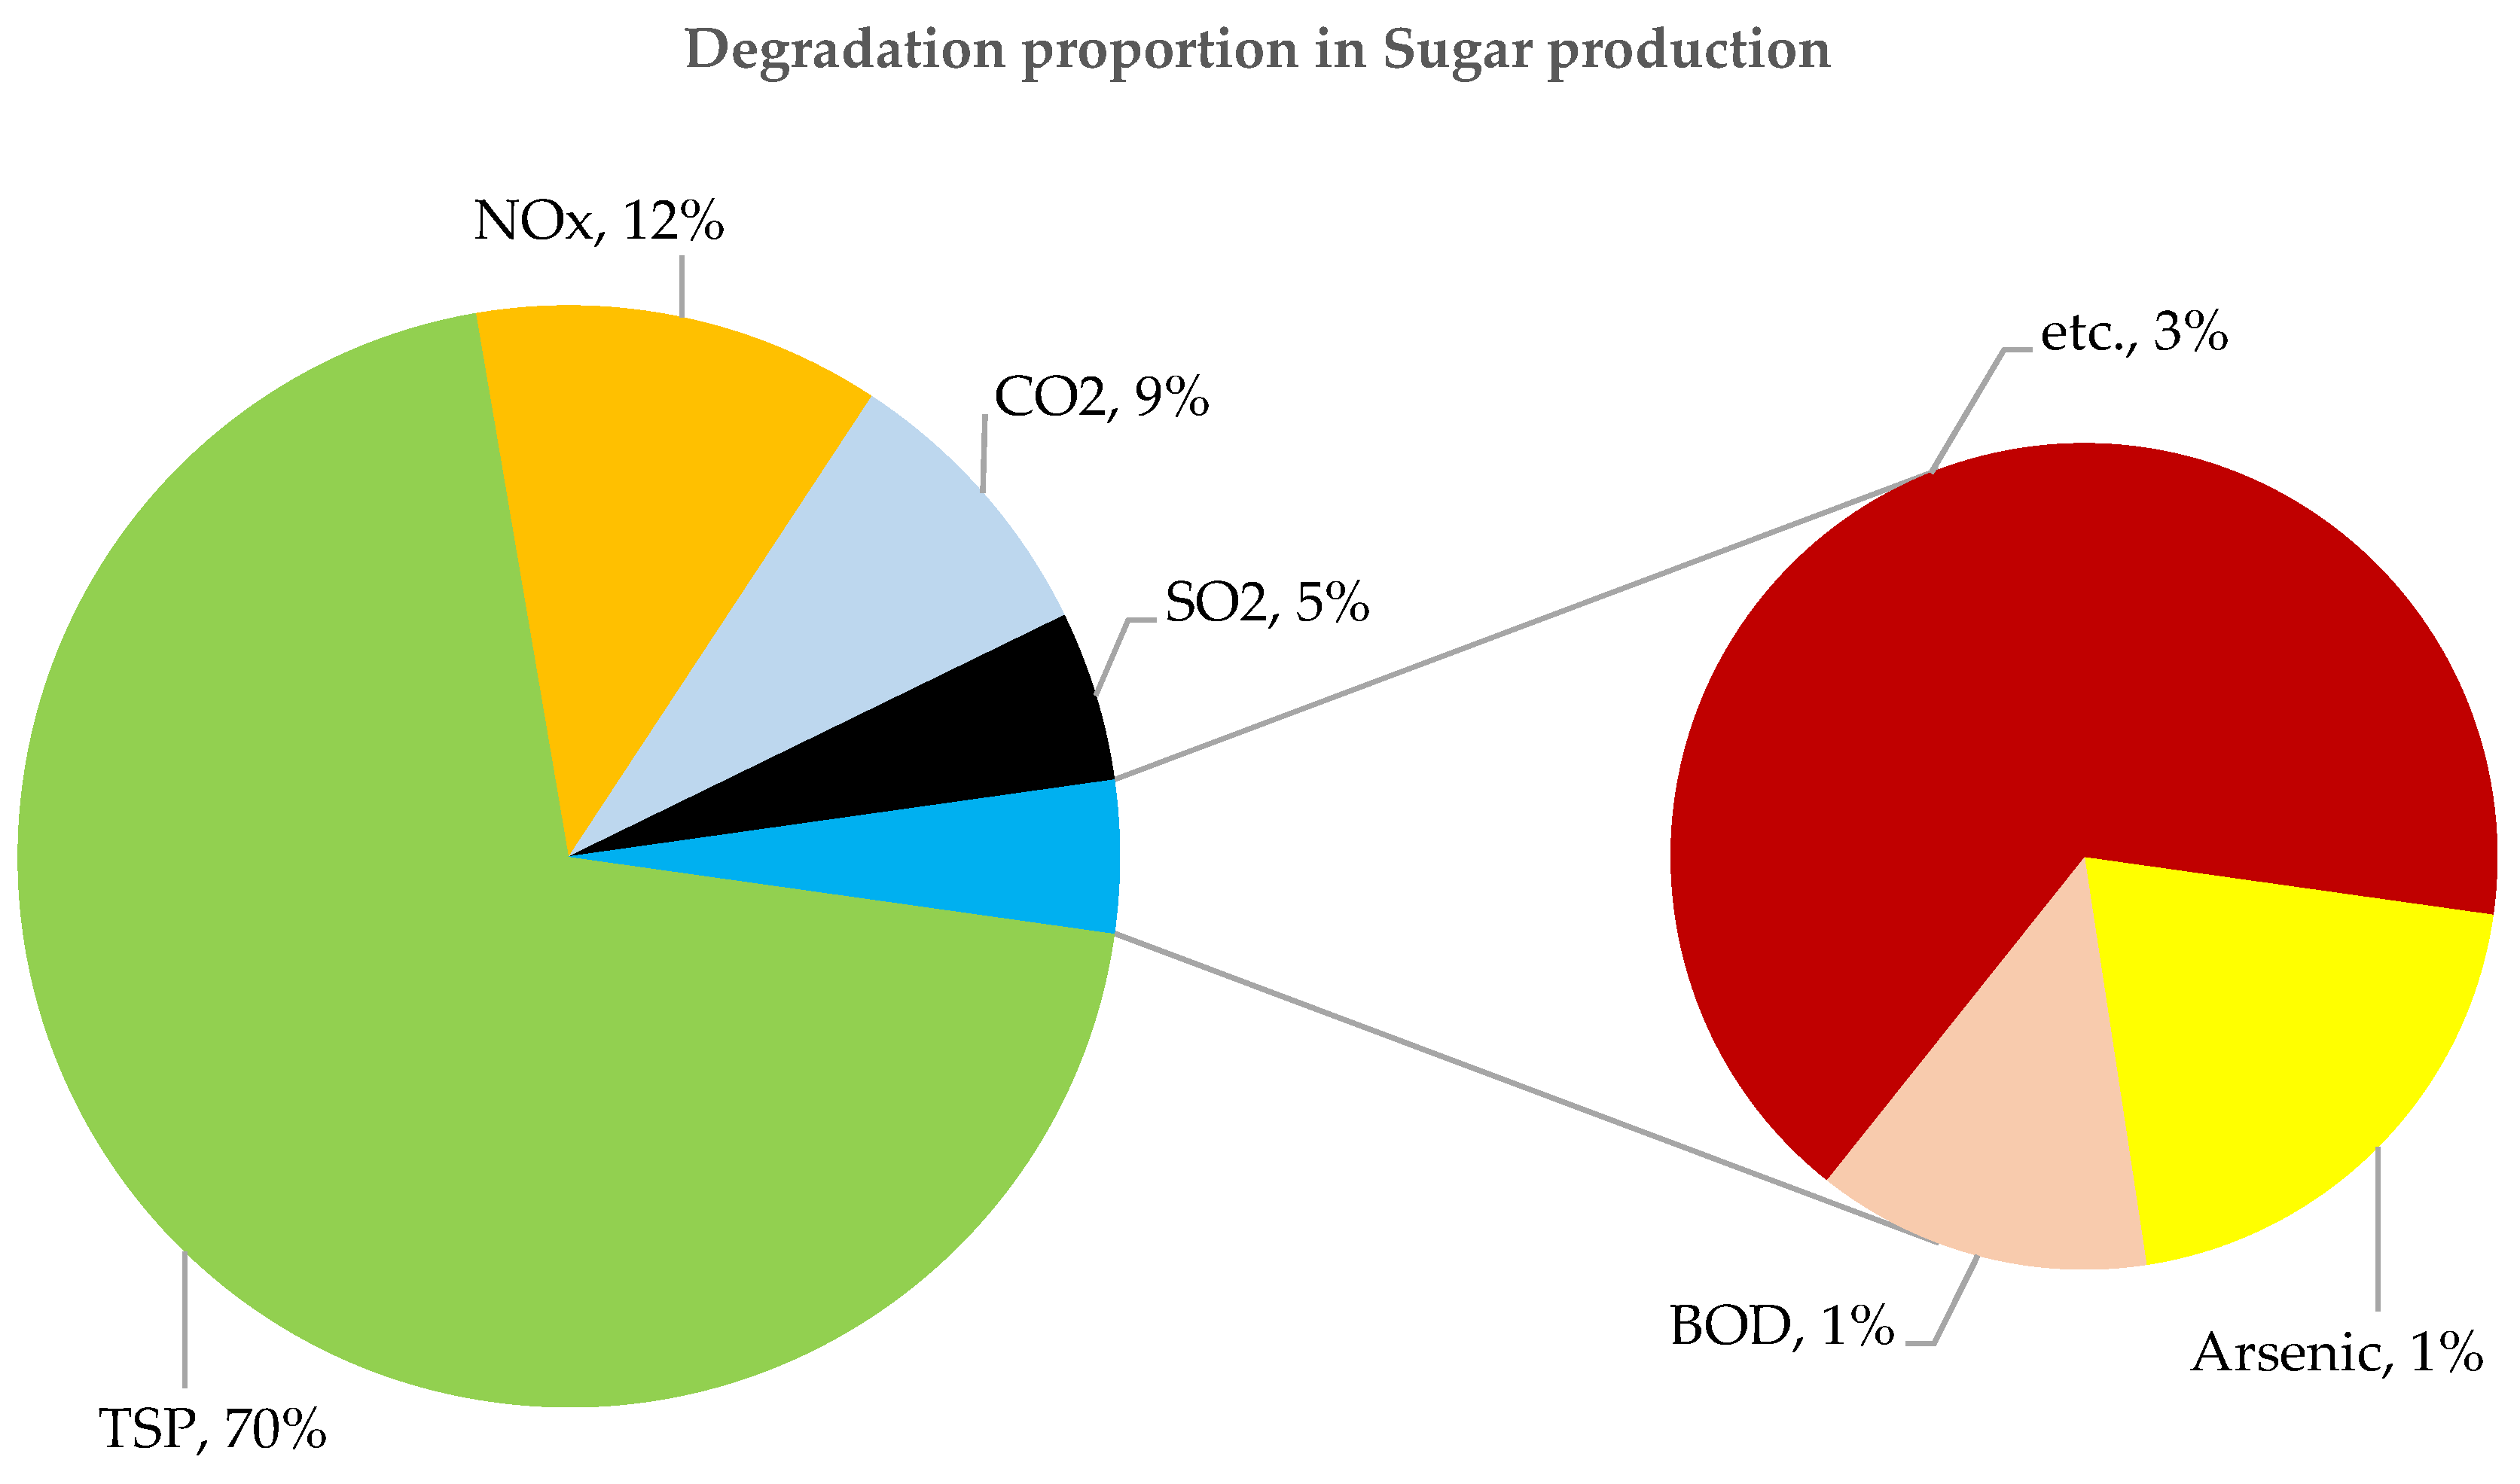
As the result, it can be observed that the value of the depletion cost is due to the decrease in natural resources. In the sugar industry, the use of diesel, fuel oil, and LPG is prevalent but the proportion of use of fossil fuels is low because the sugar industry uses the sugarcane bagasse obtained from the extraction process by burning it to produce electricity for its own production in order to reduce dependence on fossil fuels. Diesel oil has the highest environmental impact as regards the type of depletion cost, about 53% as shown in Figure 6. With regard to the degradation cost shown in Figure 7, which accounts for 99% of the total environmental cost, more than 70% from the TSP generated by the juice extraction process because the process of extracting the juice from the sugarcane involves feeding the sugarcane into the machine to acquire juice and bagasse, a process which generates a large quantity of TSP. To removal of TSP from process, it is proposing to promote ESP (Electrostatic precipitator) posted cyclone system treatment for reduction of TSP, it can be removal of the remaining 35% of TSP [39]. This option should be implemented in the sugar industry due to TSP was main contributor of this stage, the magnitude of the decrease for degradation cost. It implies that TSP contributes largely to degradation cost via TSP emissions. The sugar production stage emitted wastewater emissions (e.g., COD, BOD and other compound) are not as significant as TSP, NOx, and CO2 due to low environment cost per unit approximately 0.64 JPY/kg [37] (0.02 $/kg).
The total environmental cost approximately about 678 million $; consists with depletion cost 15% that was from resource consumption based on the surplus cost of ReCiPe is between 9.0–9.50 $/ton of sugar production and degradation cost 85% that was from emitted emissions based on the damage cost of LIME method is between 37–57 $/ton of sugar production from 2016 to 2019.
Resource consumption, airborne emissions and waterborne emissions from sugar industrial sector were used to calculate the depletion cost and degradation cost to subtract from original GDP to acquire the evaluation of green GDP of sugar industry sector. In the year of 2016 to 2019, the green GDP is lower than GDP by about 6–12% due to the degradation cost and depletion cost as shown in Figure 8. The only global warming impact was considered, the green GDP at macro level for Thailand is lower than GDP about 2–3%. In the same way, the green GDP of the sugar industry about 5900–8300 million of USD and the proportion about 1–2 percentage of the total green GDP for Thailand. The proposed the improvement the environmental impact by circular economy strategies such reduces the using of solid waste to be mixed fuel to produce products and reduce the sludge wastewater to produce a product instead of landfill. The proximately of GHG emissions reduction about 35%, it can be making a new green GDP of “Sugar industry Thailand” better than the old green GDP in the range 2–4%. To enhance the sustainability of green GDP result in the future, the other appropriate strategies such dust collector efficiency improvement, reuse of wastewater treatment and using biorefinery instead of fossil fuel. These strategies can reduce the other environmental impacts such fine particulate matter formation, freshwater eutrophication, water consumption and fossil resource scarcity. As earlier strategies mentioned would result in the increased green GDP comparison with base case more than 2–4%.

3.3. Sensitivity Analysis for Factor Contribution in Green GDP Model

Factors that affect the result of green GDP were GDP, Degradation cost, Depletion cost and PPP conversion factor. Therefore, the factors that make the green GDP differences were studied by analyzing sensitivity with four different factors described in Table 3.
The results as shown in Table 4. illustrates the results from the sensitivity analysis to evaluate the differences of the green GDP compared to the green GDP of based assumption in all the four factors, it was found that for GDP factor in scenario 1, if GDP increase 5%. The difference between green GDP and green GDP of based assumption is higher about 5%. For scenario 2, the depletion cost factor, if depletion cost increase 15%. The difference between green GDP and green GDP of based assumption is lower about 0.03%. In scenario 3, if the appropriately install of catalyst production to absorb the dust, TSP or NOx and can substantially reduce the environmental impacts, which the causes of degradation cost [40]. Meanwhile, the optimization of the amount of oxygen which controlled by the aeration fan. The optimum of air volume to combust should be approximately excess air about 23.5% or the amount of oxygen in the flue gas discharged from the flue should not exceed 8%. If there is an appropriate amount of the air for combustion, it will increase the efficiency of boiler. This scenario may induce to the decrease rates of degradation cost had 15% of based assumption, the green GDP lower about 0.87% in comparison with the based assumption. Meanwhile, in scenario 4 about the PPP conversion factor, which had 10% of based consumption, had green GDP lower about 0.60% in comparison with the based assumption. This shows that the GDP factor has the most effect of increasing or decreasing the green GDP when compared to the other factors.

4. Conclusions

The green GDP of sugar industry evaluation was developed by the concept of LCA, a powerful technique used to assess the potential environmental impact of a product. Firstly, the goal and scope definition used to define the framework and scope of the consideration of sugar industry in order to avoid omissions and double counting data related to other industries and how much of sugar industry’s GDP. Secondly, to obtain the LCI data is well known as its limitation such as representative data, the quantity of data, and study duration, which used to collect the data of inputs and outputs such as energy use, airborne emission, waterborne emission, and solid waste in accordance with the goal and scope definition in the first step. The LCI data caused to environmental impact was evaluated by the third step, LCIA. The LCIA method especially endpoint indicators in term of a monetary unit of LIME2 or ReCiPe was adopted an environmental impact assessment occurring from the LCI data. Then the LCI data was converted into monetary unit or life cycle environmental costs in accordance with the sugar industry. Finally, the green GDP of sugar industry was evaluated by life cycle environmental costs subtracting with their GDP. The most important for real life practical application was the approach of data collecting not only the sugar industry, but also the other industry. The approach of data collecting has been mentioned in this study in order to create the inventory data, primary data from sugar milling factory and secondary data as the statistics data from the reports/forms of the departments, ministries, or organizations. The alternative ways to be obtained the LCI for green GDP evaluation, it would be using the secondary data as statistical data and the advantage can be representative due to peer-reviewed by the owner data. Due to all of sugar milling plants in Thailand have to annually report their data to the government. For instances of their handling, The Ministry of Energy, Thailand for the energy use data, The Ministry of Industry, Thailand for the emission to air, emission to water, Office of the Cane and Sugar Board for the sugar and cane productivity. These data of them can integrate to the center data to support the government policy such as big data on any kind of platforms. The template of platform should report into LCI template and easily to analyze of the other evaluation of environmental impact assessment (e.g., carbon footprint of product, carbon footprint for organization, water footprint and green GDP). In addition, evaluation of green GDP should consider the usage of econometrical tools. However, if the efficiency of energy consumption, air control system, and wastewater treatment system of the industry was positively improvement and integration with the promotion of sugar productivity. The increased value of new green GDP of sugar industry relative to the base case because the new green GDP were increased caused by the sugar productivity and reduction of environmental impact from emission to air and water. Finally, the circular economy strategies by the policy making support by government was promoted in order to develop a green economy coupled with sustainable industrial growth in the future.

Author Contributions

Conceptualization, E.N. and S.S.; methodology, E.N. and S.S.; resources, E.N.; data curation, E.N.; writing—original draft preparation, E.N.; writing—review and editing, R.K. and S.S.; visualization, S.S.; supervision, S.S. All authors have read and agreed to the published version of the manuscript.

Funding

This research received no external funding.

Institutional Review Board Statement

Not applicable.

Informed Consent Statement

Not applicable.

Data Availability Statement

The data presented in this research are available on request, due to the privacy reasons.

Acknowledgments

This study was supported by Ministry of Industry, Thailand, Research Unit for Energy Economic and Ecological Management, Science and Technology Research Institute, Chiang Mai University, and The Joint Graduate School of Energy and Environment (JGSEE), King Mongkut’s University of Technology Thonburi, Bangkok, Thailand.

Conflicts of Interest

The authors declare no conflict of interest.

References

  1. Office of the National Economic and Social Development Council. I/O table of Thailand 2015. Available online: https://www.nesdc.go.th/ewt_news.php?nid=9712&filename=io_page (accessed on 4 November 2021). (In Thai)
  2. USDA, United States Department of Agriculture (Foreign Agricultural Service). Sugar: World Markets and Trade. Available online: https://apps.fas.usda.gov/psdonline/circulars/Sugar.pdf (accessed on 4 November 2021).
  3. UN, United Nations. The Paris Agreement: Frequently Asked Questions. 2016. Available online: https://www.un.org/sustainabledevelopment/blog/2016/09/the-paris-agreement-faqs/ (accessed on 4 November 2021).
  4. United Nations; European Commission; International Monetary Fund; Organisation for Economic Co-operation and Development; World Bank. Handbook of National Accounting-Integrated Environmental and Economic Accounting 2003. 2003. Available online: https://unstats.un.org/unsd/environment/seea2003.pdf (accessed on 4 November 2021).
  5. Asafu-Adjaye, J. Green National Accounting and the Measurement of Genuine (Extended) Saving. In Integrating Economic and Environmental Policies: The Case of Pacific Island Countries; Development Papers No.25; Raj Kumar; United Nations: Bangkok, Thailand, 2004; pp. 59–77. Available online: https://library.sprep.org/sites/default/files/603.pdf (accessed on 5 November 2021).
  6. Xu, L.; Yu, B.; Yue, W. A method of green GDP accounting based on eco-service and a case study of Wuyishan, China. Procedia Environ. Sci. 2010, 2, 1865–1872. [Google Scholar] [CrossRef] [Green Version]
  7. Yanhong, L.; Jia, L.; Yihua, Z. A Study on the Sustainable Relationship among the Green Finance, Environment Regulation and Green-Total-Factor Productivity in China. Sustainability 2021, 13, 11926. [Google Scholar]
  8. Mahnaz, K.; Hamed Najafi, A. Spatial Effects of Energy Consumption and Green GDP in Regional Agreements. Sustainability 2021, 13, 10078. [Google Scholar] [CrossRef]
  9. Office of The National Economic and Social Development Board. Personal Communication about A System of Environmental and Economic Accounting—SEEA: Water and Mineral Resources; Office of The National Economic and Social Development Board: Bangkok, Thailand, 2010.
  10. National Center for Genetic Engineering and Biotechnology. Thailand Green GDP: A Study of a Framework for Environmental and Economic Accounting of Agricultural Sector; NSTDA: Bangkok, Thailand, 2014.
  11. Attavanich, W.; Mungkung, R.; Mahathanaseth, I.; Sanglestsawai, S.; Jirajariyav, A. Developing green GDP accounting for Thai Agricultural Sector using the economic input output-life cycle assessment to assess green growth. In Proceedings of the SEE 2016 in Cojunction with ICGSI 2016 and CTI 2016, Bangkok, Thailand, 28–30 November 2016. [Google Scholar]
  12. Kunanuntakij, K.; Varabuntoonvit, V.; Vorayos, N.; Panjapornpon, C.; Mungcharoen, T. Thailand Green GDP assessment based on environmentally extended input-output model. J. Clean. Prod. 2017, 167, 970–977. [Google Scholar] [CrossRef]
  13. Kunanuntakij, K.; Varabuntoonvit, V.; Vorayos, N.; Mungcharoen, T. Green GDP Study Based on Life Cycle Impact Assessment of Refinery Sector in Thailand. In Proceedings of the 11th International Conference on EcoBalance 2014, Tsukuba, Japan, 27–30 October 2014. [Google Scholar]
  14. Pantavisid, S. Natural Resource and Environmental Costs of Good and Service Production via Sustainable Consumption and Production Approach towards Prioritizing the Environmental Management in Thailand. Ph.D. Dissertation, National Institute of Development Administration, Bangkok, Thailand, 25 September 2012. [Google Scholar]
  15. Silalertruksa, T.; Gheewala, S.H.; Hunecke, K.; Fritsche, U.R. Biofuels and employment effects: Implications for socio-economic development in Thailand. Biomass Bioenergy 2012, 46, 409–418. [Google Scholar] [CrossRef]
  16. Silalertruksa, T.; Gheewala, S.H.; Pongpat, P. Sustainability assessment of sugarcane biorefinery and molasses ethanol production in Thailand using eco-efficiency indicator. Appl. Energy 2015, 160, 603–609. [Google Scholar] [CrossRef]
  17. Giannetti, B.F.; Agostinho, F.; Almeida, C.M.V.B.; Huisingha, D. A review of limitations of GDP and alternative indices to monitor human wellbeing and to manage eco-system functionality. J. Clean. Prod. 2015, 87, 11–25. [Google Scholar] [CrossRef]
  18. Zvonimira, S.G.; Marinela, K.N.; Elena, R. Circular Economy Concept in the Context of Economic Development in EU Countries. Sustainability 2020, 12, 3060. [Google Scholar]
  19. Chi-Hung, T.; Yun-Hwei, S.; Wen-Tien, T. Sustainable Material Management of Industrial Hazardous Waste in Taiwan: Case Studies in Circular Economy. Sustainability 2021, 13, 9410. [Google Scholar]
  20. Marzena, S.; Joanna, D.; Agnieszka, K.; Dominika, S. Transformation towards Circular Economy (CE) in Municipal Waste Management System: Model Solutions for Poland. Sustainability 2020, 12, 4561. [Google Scholar]
  21. Marit, B.; Sigurd, V. Life Cycle Assessment to Ensure Sustainability of Circular Business Models in Manufacturing. Sustainability 2021, 13, 11014. [Google Scholar] [CrossRef]
  22. Gillian, E.; Isabel, L. Sustainability Issues and Opportunities in the Sugar and Sugar-Bioproduct Industries. Sustainability 2015, 7, 12209–12235. [Google Scholar]
  23. Munagala, M.; Yogendra, S. Sustainable valorization of sugar industry waste: Status, opportunities, and challenges. Bioresour. Technol. 2020, 303, 122929. [Google Scholar]
  24. International Organization for Standardization. Environment Management-Life Cycle Assessment-Principle and Framework, 2nd ed.; International Organization for Standardization: Geneva, Switzerland, 2006. [Google Scholar]
  25. International Organization for Standardization. Environment Management-Requirements and Guideline (ISO 14044:2006), 2nd ed.; International Organization for Standardization: Geneva, Switzerland, 2006. [Google Scholar]
  26. Eggleston, H.S.; Buendia, L.; Miwa, K.; Ngara, T.; Tanabe, K. 2006 IPCC Guidelines for National Greenhouse Gas Inventories; Volume 2 Energy; Institute for Global Environmental Strategies (IGES): Hayama, Japan, 2006. [Google Scholar]
  27. Eggleston, H.S.; Buendia, L.; Miwa, K.; Ngara, T.; Tanabe, K. 2006 IPCC Guidelines for National Greenhouse Gas Inventories; Volume 5 Waste; Institute for Global Environmental Strategies (IGES): Hayama, Japan, 2006. [Google Scholar]
  28. Department of Agriculture, Thailand. Study on Effective Method of Chemical Fertilizer Application to Increase Cane Yield. 2008. Available online: https://www.doa.go.th/research/attachment.php?aid=1618 (accessed on 4 November 2021). (In Thai)
  29. Thailand Greenhouse Gas Management Organization (Public Organization). Emission Factor, Carbon Footprint of Product, GHG emissions from Fertilizer. 2013. Available online: http://thaicarbonlabel.tgo.or.th/index.php?lang=TH&mod=Y0hKdlpIVmpkSE5mWkc5M2JteHZZV1E9 (accessed on 4 November 2021). (In Thai).
  30. Nguyen, T.L.T.; Gheewala, S.H. Life Cycle Assessment of fuel ethanol from cane molasses in Thailand. Int. J. Life Cycle Assess. 2008, 13, 301–311. [Google Scholar] [CrossRef]
  31. Office of the Cane and Sugar Board, Ministry of Industry, Thailand. Personal Communication about the Productivity of Sugarcane and Sugar Production from 2016 to 2019; Office of the Cane and Sugar Board, Ministry of Industry: Bangkok, Thailand, 2021.
  32. Department of Industrial Works, Ministry of Industry, Thailand. Personal Communication about the System for Reporting the Type and Amount of Pollutants Discharged from the Factory (RV2, RV3); Department of Industrial Works, Ministry of Industry: Bangkok, Thailand, 2021.
  33. The Working Group I Contribution to the IPCC 4th Assessment Report. Available online: https://www.ipcc.ch/site/assets/uploads/2018/05/ar4-wg1-errata.pdf (accessed on 4 November 2021).
  34. Pollution Control Department, Ministry of Natural Resources and Environment, Thailand. Calculating Emissions from Measurement Data. Available online: https://www.pcd.go.th/wp-content/uploads/2020/05/pcdnew-2020-05-25_04-41-26_574047.pdf (accessed on 4 November 2021). (In Thai)
  35. Office of the National Economic and Social Development Council. Personal Communication about Sugar INDUSTRY’s GDP from 2016 to 2019; Office of the National Economic and Social Development Council: Bangkok, Thailand, 2021.
  36. Goedkoop, M.; Heijungs, R.; Huijbregts, M.; Schryyer, A.; Struijs, J.; Zelm, R.V. ReCiPe 2008 A Life Cycle Impact Assessment Method which Comprises Harmonized Category Indicators at the Midpoint and Endpoint Level, 1st ed.; (Version 1.08); Report I: Characterization; Ministry of Housing, Spatial Planning and the Environment (VROM): Zoelermeer, The Netherlands, 2013. [Google Scholar]
  37. Itsubo, N.; Tokyo City University, Yokohama Campus, Yokohama, Japan. Personal Communication, About LIME 2: Life—Cycle Impact Assessment Method Based on Endpoint Modeling. 2015.
  38. PPP Conversion Factor, GDP (LCU Per International $)—Japan, United States. Available online: https://data.worldbank.org/indicator/PA.NUS.PPP?page=1&locations=JP-US (accessed on 4 November 2021).
  39. George, K.V.; Manjunath, S.; Chalapati Rao, C.V.; Bopche, A.M. Cyclone as a precleaner to ESP—A need for Indian coal based thermal power plants. Environ. Technol. 2008, 24, 1425–1430. [Google Scholar] [CrossRef] [PubMed]
  40. Mianquiang, X.; Bin-Le, L.; Kiyotaka, T.; Kimitaka, M.; Tetsuya, N.; Tohru, K. Life Cycle Assessment of Nitrogen Circular Economy-Based NOx Treatment Technology. Sustainability 2021, 13, 7826. [Google Scholar] [CrossRef]
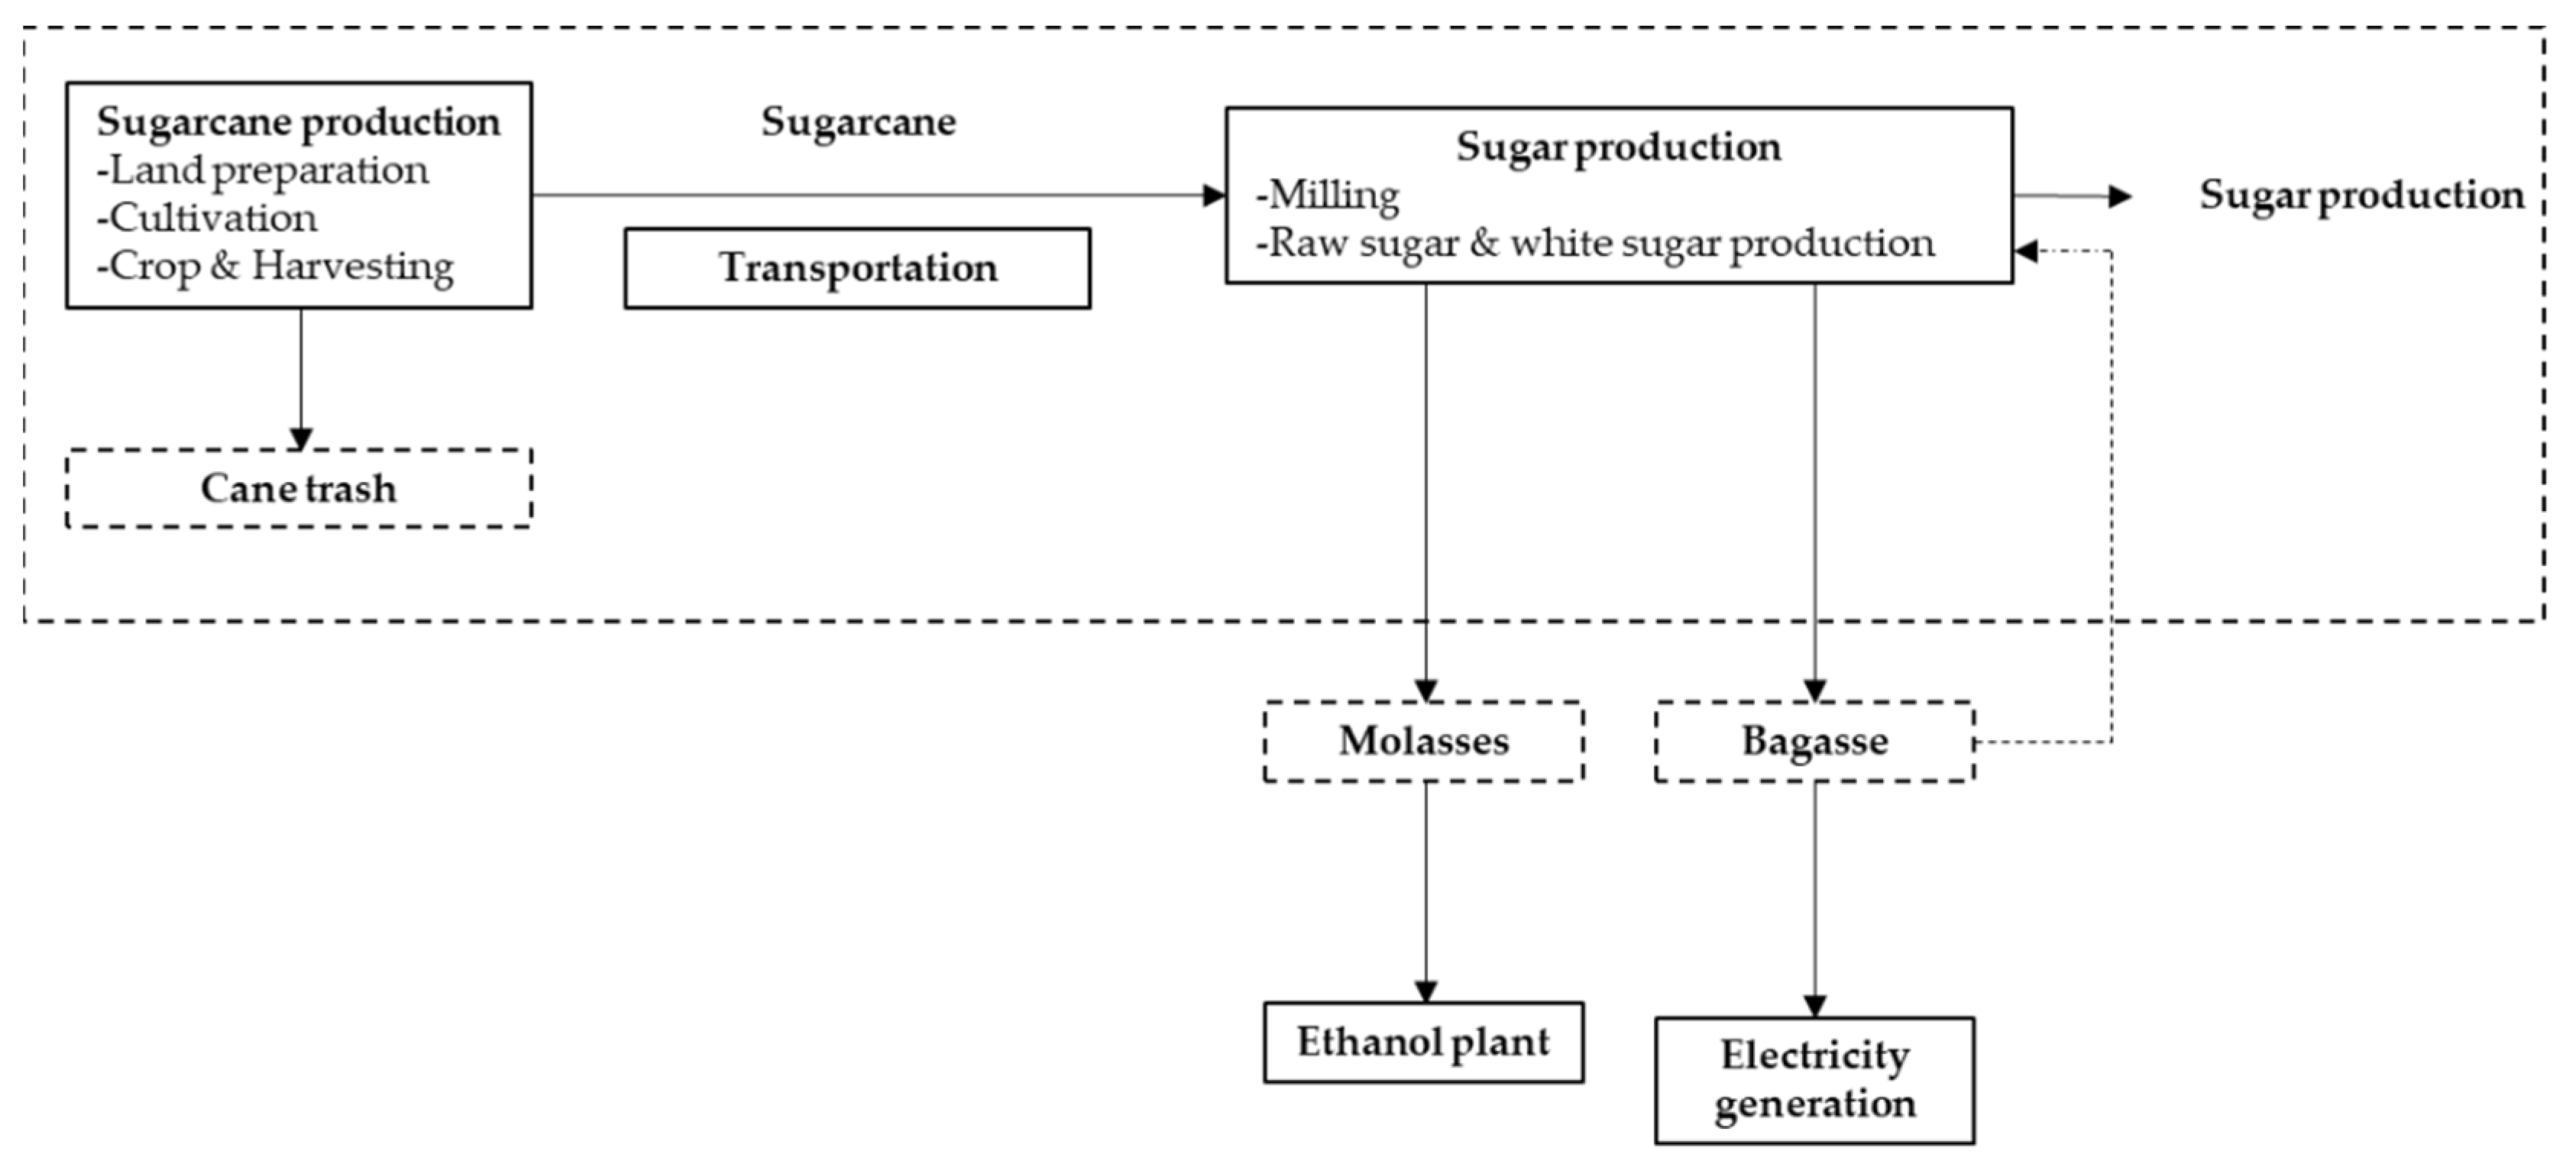
Figure 1. The flow chart of the sugar industry Thailand and system boundary.
Sustainability 14 00918 g001
Figure 2. Thailand Sugar industry’s GDP at current market price from 2016 to 2019.
Sustainability 14 00918 g002
Figure 3. The proportion of environmental cost of cultivation stage.
Sustainability 14 00918 g003
Figure 4. The proportion of environmental cost of transportation stage.
Sustainability 14 00918 g004
Figure 5. Life cycle environmental cost of Sugar’s industry Thailand.
Sustainability 14 00918 g005
Figure 6. Total depletion cost portion by natural resources.
Sustainability 14 00918 g006
Figure 7. Total degradation cost portion by airborne emission and waterborne emission.
Sustainability 14 00918 g007
Figure 8. Thailand’s GDP and green GDP comparison of sugar industry.
Sustainability 14 00918 g008
Table 1. Data sources of Sugar Production.
Process InformationData InformationUnitData Source
Cultivation
Land preparation
Planting and treatment
Inputs
Sugarcane stockston1 Questionnaires
Diesel oilliter1 Questionnaires
HarvestingGasolineliter1 Questionnaires
Fertilizerkg[28]
Paraquatliter1 Questionnaires
Water from groundliter1 Questionnaires
Outputs
GHG emissions and etc.kg[26,27,29]
Tops and leaveskg[30]
Sugarcaneton1 Questionnaires
Sugar production and transportationInputs
Sugarcaneton[31]
Diesel oilliter1 Questionnaires
Liquefied Petroleum Gas (LPG)kg1 Questionnaires
Fuel oilliter1 Questionnaires
Water from groundliter1 Questionnaires
Chemicalskg, ton1 Questionnaires
Outputs
Sugarton[31]
Molasseston1 Questionnaires
Bagasseton1 Questionnaires
Emission to airkg, ton[26,27,32]
Emission to waterkg, ton[32]
1 Collect from contract farming of sugar milling plant and sugar milling plant, which a sugar production capacity was 60% of Thailand.
Table 2. Life cycle inventory of Sugar Production.
Input Output
Unit Process 1: Sugarcane Production (Per Hectare)
Non-renewable resourceAmountEmission to airAmount
Diesel56 L1 CO222.56 kg
Pesticides2.06 kg2 N2O0.12 kg
Fertilizers312 kgSolid waste
Top and leaves0.20 kg
Renewable resource Product
Water use43,750 LSugarcane58 t
Unit process 2: Transportation (per ton of sugarcane)
Non-renewable resourceAmountEmission to airAmount
Diesel6.90 LCO218.60 kg
N2O0.001 kg
CH40.001 kg
Unit process 3: Sugar production (per 1 kg of sugar production)
Non-renewable resourceAmountEmission to airAmount
Diesel0.203 kgTSP0.76 kg
LPG3.0 × 10−4 kgHCl1.10 × 10−2 kg
Fuel oil5.30 × 10−2 kgCO2.00 kg
Chemicals4.60 × 10−4 kgSO24.00 × 10−2 kg
Renewable resource NOx8.50 × 10−1 kg
Water use0.88 m3NMVOC3.50 × 10−2 kg
Energy consumption CO20.14 t
Electricity135 kWhN2O4.90 × 10−3 kg
CH43.70 × 10−5 kg
Emission to water
TDS0.08 t
SS0.64 kg
COD0.01 t
BOD0.13 kg
1 From fossil fuel combustion and fertilizers use. 2 From fertilizers use only. CO2; Carbon dioxide N2O; Nitrous oxide. TSP; Total Suspended Particulate. HCl; Hydrochloric compound. CO; Carbon monoxide. SO2; Sulfur dioxide. NOx; Nitrogen oxide. NMVOC; Non-methane volatile organic compound. CH4; Methane. TDS; Total dissolved solids. SS; Suspended solids. COD; Chemical oxygen demand. BOD; Biochemical oxygen demand.
Table 3. Scenarios of the factor contribution in green GDP model.
DescriptionAffected Factors
Base caseConventional sugarcane
production, transportation and sugar production
Scenario 1Base case, Productivity
increases 5% or decrease 5%
GDP
Scenario 2Base case, Energy
consumption increases 15% or decrease 15%
Depletion cost
Scenario 3Base case, Efficiency of air pollution control system and wastewater treatment system increases 15% or decrease 15%Degradation cost
Scenario 4Base case, PPP conversion factor increases 10% or
decrease 10%
PPP conversion factor
Table 4. Green GDP results from the factor contribution in green GDP model.
GDP
(Millions $)
Depletion Cost
(Millions $)
Degradation Cost
(Millions $)
Green GDP Result
(Millions $)
Comparison with Green GDP of Base Case
Base case640010.83350.326038.84
Scenario 1
+5%672010.83350.326358.84+5%
−5%608010.83350.325718.84−5%
Scenario 2
+15%640012.46350.326037.22−0.03%
−15%64009.21350.326040.47+0.03%
Scenario 3
+15%640010.83402.875986.30−0.9%
−15%640010.83297.776091.39+0.9%
Scenario 4
+10%640011.92385.356002.73−0.6%
−10%64009.75315.306074.96+0.6%
Publisher’s Note: MDPI stays neutral with regard to jurisdictional claims in published maps and institutional affiliations.