1. Introduction
Hydrogen energy is eco-friendly energy that does not generate pollutants. Conventional fossil fuels are causing serious problems, as they emit pollutants, such as carbon dioxide, when making energy. Hydrogen produces heat and electricity through a chemical reaction with oxygen. Hydrogen can be stored in large capacities, drawing attention toward it as an alternative beyond the limits of other environmentally friendly energies. The shift from fossil energy to hydrogen energy will change the paradigm of industry beyond technological evolution and innovation and emerge as a major factor that will determine national competitiveness over the next generation. It is expected that if even a quarter of the global strategies of various countries are realized by 2030, the transition to a green hydrogen energy society will be solidified, and hydrogen will become the center of a carbon-neutral energy society [
1].
The world also faces the imminent depletion of fossil fuel resources due to limited reserves [
2]. As concerns about the fossil fuel crisis have become a reality, the demand for eco-friendliness and decarbonization is growing stronger. The transition to hydrogen energy in the transport sector, which accounts for a large portion of carbon emissions, is expected to accelerate further.
According to the International Energy Agency (IEA), emissions from the global transport sector increased by less than 0.5% in 2019. Despite their slowdown in growth, CO
2 emissions from fuel combustion in transportation account for 24% of the total, of which road vehicles (cars, trucks, buses, and two- and three-wheelers) account for 75%. In addition, emissions from aerospace and shipping continue to rise [
3]. With such an increase in social interest and investment, significant research on hydrogen energy and transport, where commercialization is the fastest among hydrogen energy fields, is being actively conducted. Research on transportation technology using hydrogen as an energy source is spreading to various types of mobility. The most rapidly commercialized vehicle is the passenger vehicle sector. Hydrogen commercial vehicles are also following in the market. Ford Moto introduced a two-wheel-drive vehicle powered by a fuel cell stack and battery in 2000. Starting with this, Hyundai Motor Company and Toyota Motor Company are currently occupying most of the hydrogen passenger car market [
4]. Technology development for hydrogen fuel cell vehicles is focused on enhancing price competitiveness and realizing economies of scale. Key components such as stacks account for 40% of the manufacturing cost of fuel cell vehicles. Reducing stack cost will play an important role in the proliferation of hydrogen fuel cell vehicles. The structure of a hydrogen fuel cell vehicle is simpler than that of a conventional internal combustion engine vehicle. It consists of a fuel tank, an FC stack, a DCDC power converter, an inverter, and an electric motor. The key features are high mileage, fast charging time, cold start capability, quiet, continuous energy supply, and low emissions [
5,
6,
7].
Global leading countries are increasingly competing to dominate the hydrogen energy industry. Countries are developing hydrogen roadmaps to foster the hydrogen energy industry and are expanding large-scale policy support and investment. The United States created H2@Scale to lead the transition to a hydrogen economy. The United States is actively nurturing the hydrogen industry at the national level and announced government support of
$40 million in 2019 [
8]. The Department of Energy also predicted that hydrogen use in the hydrogen program plan is currently 10 million metric tons (MMT)/year, which will increase to 22–41 MMT/year in 2050 [
9]. Japan has published a Green Growth Strategy for carbon neutrality in 2020. They proposed that by 2050, they will achieve a carbon-neutral, decarbonized society and solve the related economic growth and environmental problems [
10]. In addition, plans and roadmaps for technology development investment and support are also presented. Each country provides policies and funding to develop key technologies. The United States has published the Energy Hydrogen Program Plan and presented a strategic framework encompassing research, development, and demonstration efforts. In this plan, research, development, and demonstration (RD&D Thrust) technology were presented, and the development goal of the technology was presented [
9]. To prepare for the growing size of the hydrogen market, Japan has developed a framework for securing the safety of hydrogen energy and establishing measures to reduce costs [
11]. Europe presented a strategy and roadmap for the performance and mechanism of hydrogen fuel cells [
12]. Research and development (R&D) strategies for technologies are being actively developed, and policy research for industrial development is being proposed. Nevertheless, there is a lack of research considering the entire field to discover promising technologies through big data analysis and support establishing technology development strategies.
The purpose of this study was to predict future promising technologies and vacuum technology for hydrogen fuel cell-based transport. We derive promising technology at the core of future hydrogen fuel cell transportation using the published US patent and paper databases (DB). The discovery of promising technologies in the transport sector, which will emerge as a key competitive power in the hydrogen age, will be very applicable to the development of policies and strategies for countries and companies and the direction of investment.
2. Literature Review
A patent is an administrative act that grants the inventor or their legitimate successor an exclusive right for a certain period of time in exchange for disclosing their invention to the public. The purpose is to encourage the disclosure of inventions and the development of new inventions and technologies. Therefore, a patent is a document with strong legal character as a right granted to an inventor. However, at the same time, patents provide useful information for statistical analysis. Patent data are characterized by large size and objectivity [
13].
The use of patent data has been expanded in various fields over the past several decades alongside the development of computers [
14]. The advent of analysis of technological change in the industry using the information on the number of patents in the 1950s showed the potential of a statistical analysis based on patent data. The data used for analysis included publishing country, title, inventor, assignee, International Patent Classification (IPC), and applicant country [
15]. Since then, patent index development and analysis studies using bibliometric data of patents have been actively conducted. Even today, statistical and research results using patent information are being used in various ways as key data for policy development, technical strategy establishment, and investment direction setting.
Together with bibliographic information of patent documents, patent citation information is widely used. The validity of the number of citations and objectivity of citations granted by patent examiners are different from scientific citations [
13]. The analysis of patent citation information has evolved from statistical analysis to a wide range of applications. The analysis of patent citation information of merger and acquisition (M&A) candidates suggested a way to evaluate acquisition candidates by identifying their influence in the industry and analyzing key inventors. The analysis of a company’s patent citation information has been found to have potential in evaluating the company and its market value. Patent citation analysis has suggested that patent information can be very useful to identify the influence of M&A candidate companies in the industry, discover key inventors, and evaluate acquisition candidates. It has been found that citations of patents affect the market value of a company, and additional citations per patent increase the market value [
16,
17].
Co-citation analysis presents a similar patent classification methodology and shows the possibility of automatic patent classification, possibly presenting an alternative to the IPC or United States patent classification systems [
18]. After that, citation analysis applying the bibliographical coupling methodology measured technological progress and deepened the indirect citation analysis methodology [
19]. A methodology for selecting a basic patent through patent citation network analysis and applying hierarchical cluster analysis to confirm the mainstream of a given technology was presented in [
20]. In addition, by utilizing the characteristics of including various documents in patent citations, it was identified that there is a difference in science linkage depending on the types of citations of scientific papers, and the relation between self-citation by inventor/applicant and citation by examiner was revealed [
21]. To establish a competitive strategy, citation analysis of competitors has provided a new alternative to the measures of hindrance and encroachment [
22]. As the application of text mining techniques expanded, a method for measuring knowledge flow by combining patent citation analysis and text mining was proposed, and patent analysis research was intensified with the application of various analysis techniques [
23]. Patent citation information is composed of forward and backward citation information, and through forward citation analysis, knowledge spillover in renewable energy technology was identified by category [
24]. However, analysis based on patent citation information has limitations in predicting emerging technologies, as it takes at least two years for a patent to be cited [
25]. It has also been noted that the bias of the examiner may act in the granting of citation information [
26]. Many methods have been proposed to overcome this problem. Nevertheless, the citation information of patents is still very useful in big data research in the technical literature due to the expertise in information provision.
Recently, it has provided the possibility to measure the semantic similarity of documents through text mining in patent data analysis, offering an alternative to the limitations of patent citation analysis [
27]. The possibility of patent clustering through text mining was shown through clustering applied to the text mining of patents and classification and comparison with patents from Derwent World Patents Index [
28]. A patent analysis methodology that overcomes the limitations of patent citation analysis was proposed through text mining-based patent network analysis [
29]. Patent network analysis using semantic patent similarity based on subject–action–object structures presented a direction for identifying the characteristics of patent clusters and competitor’s technological capabilities [
30]. By applying the self-organizing map (SOM) of business model (BM) patents, clustering analysis and citation analysis showed new possibilities of a taxonomical approach toward BM patents [
31]. SOMs have been presented as a tool to visualize high-dimensional data. The SOM is used in data mining for full-text document collection [
32]. A patent analysis method that combines kernel principal component analysis and support vector machine with an SOM presented a new direction in the field of patent quality analysis and patent classification [
33].
Since then, generative topographic mapping (GTM) was proposed as an alternative to the SOM model. GTM provides a probabilistic reformulation of the SOM [
34]. GTM is a probability density model that maps from the perspective of latent or hidden variables to a low-dimensional space [
35]. A method for discovering patent vacancy was developed based on the GTM of a multidimensional data space to a low-dimensional latent space [
35]. To predict a promising essential patent (standard patent), one study attempted to derive a vacant technology by applying GTM analysis to visualize a standard map and a patent map [
36]. GTM was also applied to the establishment of a patent roadmap. A method was devised to predict the appearance of new patents by applying the Bass diffusion model [
37]. GTM was expanded to analyze patent DB, and it was extended to the analysis of patents, trademarks, and design patents, which are Intellectual Property Rights (IPRs); moreover, promising research and business development fields were derived [
38]. GTM was used to identify vacuum technologies in technical fields such as lithography technology, mobile communication technology, and organic light-emitting diode (OLED) technology [
35,
37,
38].
Research on technology analysis and prediction in the field of hydrogen fuel cell-based transportation using patent information has recently been attempted in various forms. A study measuring the convergence of hydrogen storage technology was conducted through entropy analysis of patent data to discover promising hydrogen vehicle technologies. Hydrogen vehicle technology patent analysis confirmed the promise of high-pressure storage technology and was able to discover major technological options [
39]. In addition to identifying promising technologies, it enabled technology prediction through patent analysis. A method of quantifying the technology prediction method using the S-curve was developed by conducting hydrogen energy and fuel cell patent bibliometric analysis. Through this method, the growth stage of the technology was confirmed, and it was concluded that hydrogen production and storage technology has not yet reached technological maturity [
40]. A study to identify technology trends by co-word map analysis of patents was also conducted. The conversion and application of hydrogen technology was confirmed as a mainstream technology, and production, storage, and conversion of hydrogen energy were discovered as core technologies [
41]. After that, citation analysis was also used for fuel cell vehicle technology patent analysis. Core patents were identified through patent citation analysis, and core technologies were discovered through the core patents. These results opened up the possibility of contributing to the establishment of a company’s portfolio strategy and technological innovation direction [
42]. As research on the convergence of science and technology has gradually increased, research to measure this has been attempted. The sensitivity of time to patent and paper citations was studied through the analysis of mutual citations between papers and patents for fuel cell technology. Through this, it was found that papers citing patents are more time-sensitive than patents citing papers. They also found that the time lag between papers and patent citations was 3–5 years shorter than between patents and paper citations [
43]. To investigate the relationship between science and technology, analysis of patent–paper pairs was attempted. Through analysis of fuel cell patents and papers, it was confirmed that if the same researcher produces a patent and paper for the same technical idea, the patent is approved before the paper is published [
44]. Technology opportunity discovery was proposed through fuel cell electric vehicle (FCEV) technology patent analysis. As a result, novel patents for technologies such as fuel cell stacks, powertrains, and temperature management could be searched, and through this method, the direction of a company’s technology development could be inferred [
45]. Through the analysis of FCEV patents and papers, the current status of FCEV research was analyzed, and the evolutionary direction of scientific technological research was identified [
46].
Existing hydrogen energy-based transportation technology prediction research is lacking an in-depth investigation of the entire hydrogen-based transport sector by deriving technology innovation directions for detailed technologies. We intend to suggest promising technologies and directions in the field of hydrogen fuel cell-based transport through analysis of patent and paper big data. Patent data are very standardized and highly reliable, making them very suitable for objective and quantitative big data analysis. Since research on transportation systems using hydrogen has not yet been extensively studied, it is very important to figure out which field to focus on. To develop hydrogen fuel cell technology, various technologies must be secured, because the actual budget and research manpower are limited. To overcome this problem, it is necessary to conduct a patent analysis first to establish a strategy for the latest technology trends and future technologies and then to develop the technology.
Hydrogen research is an emerging technology field. Therefore, citation analysis that can derive accurate analysis results only when citation information accumulated is not appropriate. This study tried to identify promising technologies in the emerging technology field through text-based analysis, which is unstructured data. We try to improve the accuracy of the analysis results by overcoming the limitations of the patent unpublished period by conducting paper analysis.
3. Research Methodology
3.1. Overall Framework
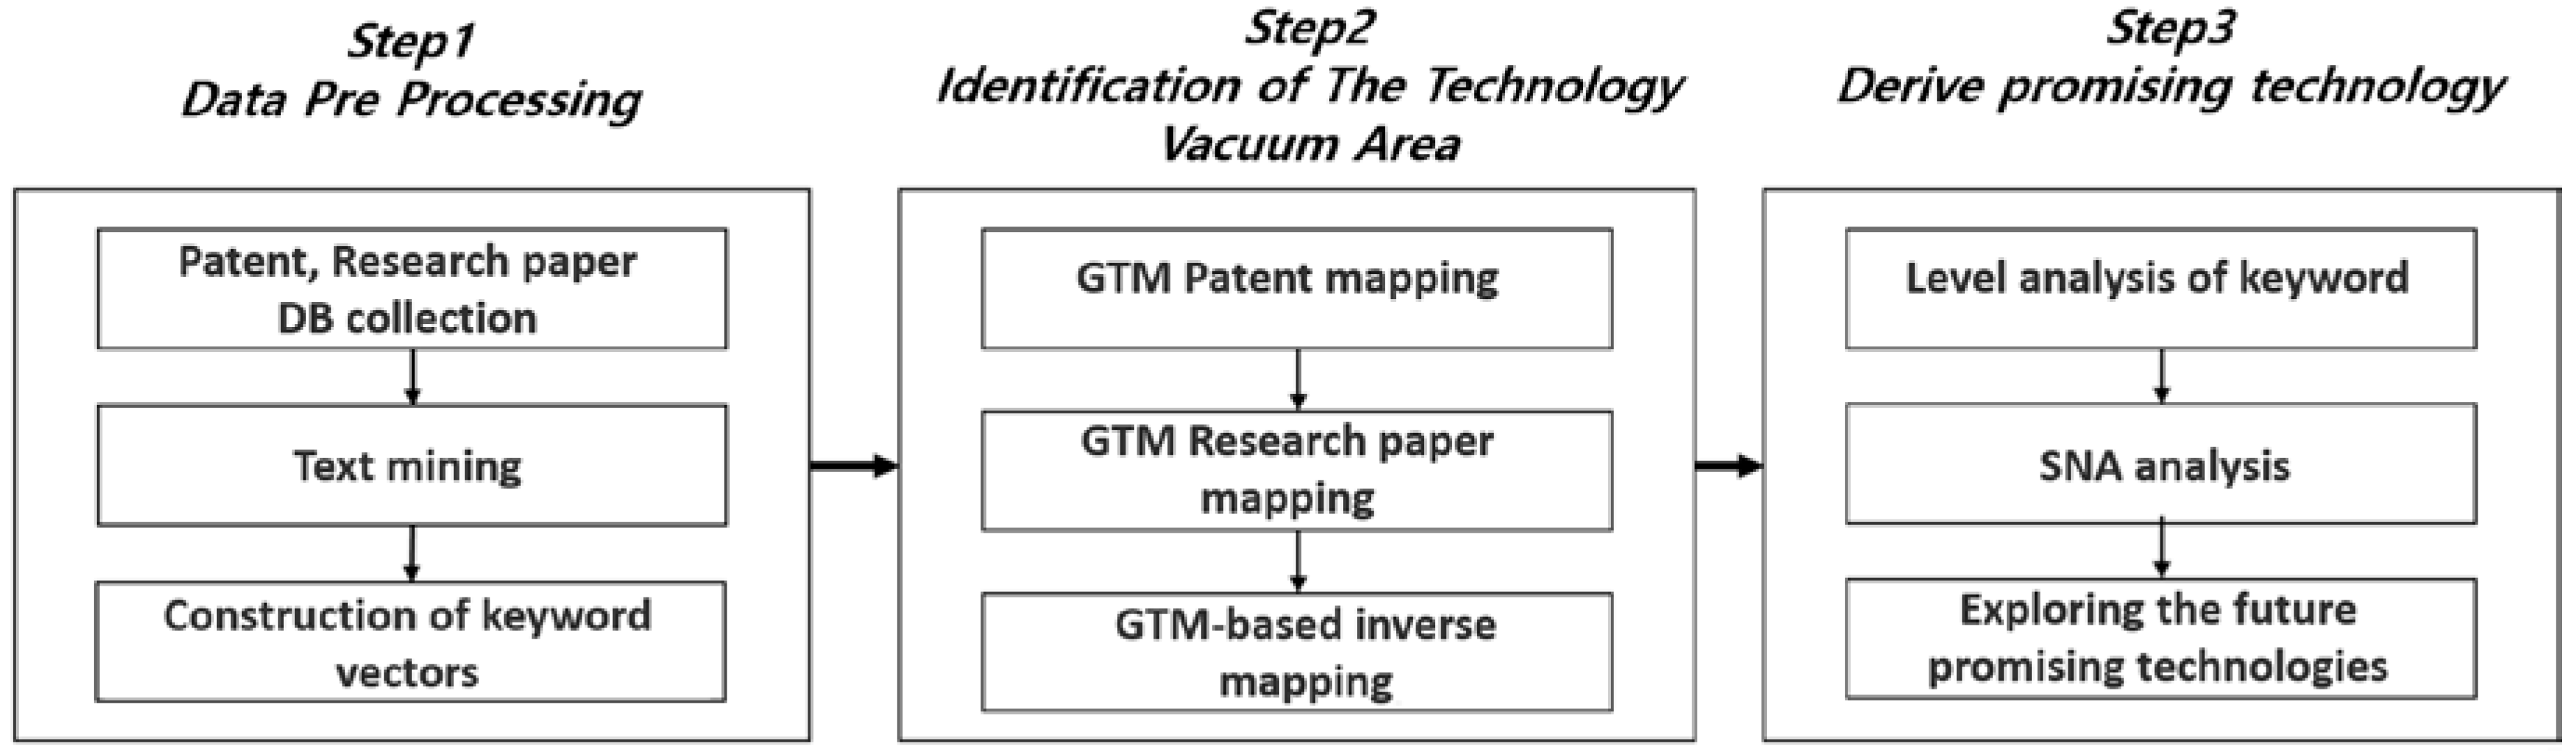
The purpose of this research was to explore and propose a new approach for deriving promising technologies in the field of hydrogen fuel cell-based transportation. Promising technologies were derived by exploring vacant technologies through GTM and identifying the centrality of technologies through social network analysis (SNA).
The entire process was as shown in
Figure 1. In this study, patent analysis and paper analysis were performed in the same process, respectively. Patents are not disclosed before 18 months. Therefore, it is not possible to monitor the evolution of the technology during this period [
47]. We derived the vacuum area by GTM analysis using not only a patent DB but also a research paper DB.
After that, each result was derived the results for strategy development. The application of research paper analysis will overcome the limitation of the blind period of a patent.
3.2. Data Collection
Patent data are collected using the United States Patent and Trademark Office (USPTO) because the USPTO has the highest number of patents filed among all national patent offices [
48,
49]. The United States is regarded as a major market for patents and technologies in that it has a vast amount of data [
50]. In addition, patent offices of other countries mainly apply for their own country’s patents, but the USPTO has applied for patents from various countries around the world, so it is used more than European patents and makes it easy to analyze patents [
51,
52].
Paper data were collected from the Web of Science database. The Web of Science is a multidisciplinary bibliographic database [
53]. It provides bibliographic data in various fields and has its classification system in the database, so it has the advantage of making it easy to find data in the technology field [
54]. In addition, it is easy to collect and analyze data in that it is easy to search by electronically documenting data in one’s database [
55,
56].
3.3. Data Preprocessing
Patents and scientific papers contain many abbreviations and acronyms specific to each technology sector, which must be revised or removed prior to analysis. Data preprocessing refers to the work involved in processing data, such as text cleaning, conversion of abbreviations/acronyms, and conversion of upper/lower cases, into a form that can be easily used in analysis. In this process, data are converted to a format that can be more easily and effectively applied in the analysis. For this, the original data in the form of sentences were decomposed into individual words, after which conversion to upper/lower case letters was performed, followed by tokenizing to removing spaces, numbers, and other symbols. Second, filtering by the Stopword method was applied to remove unnecessary words. Finally, all prefixes and suffixes were removed to leave only the words that form each document.
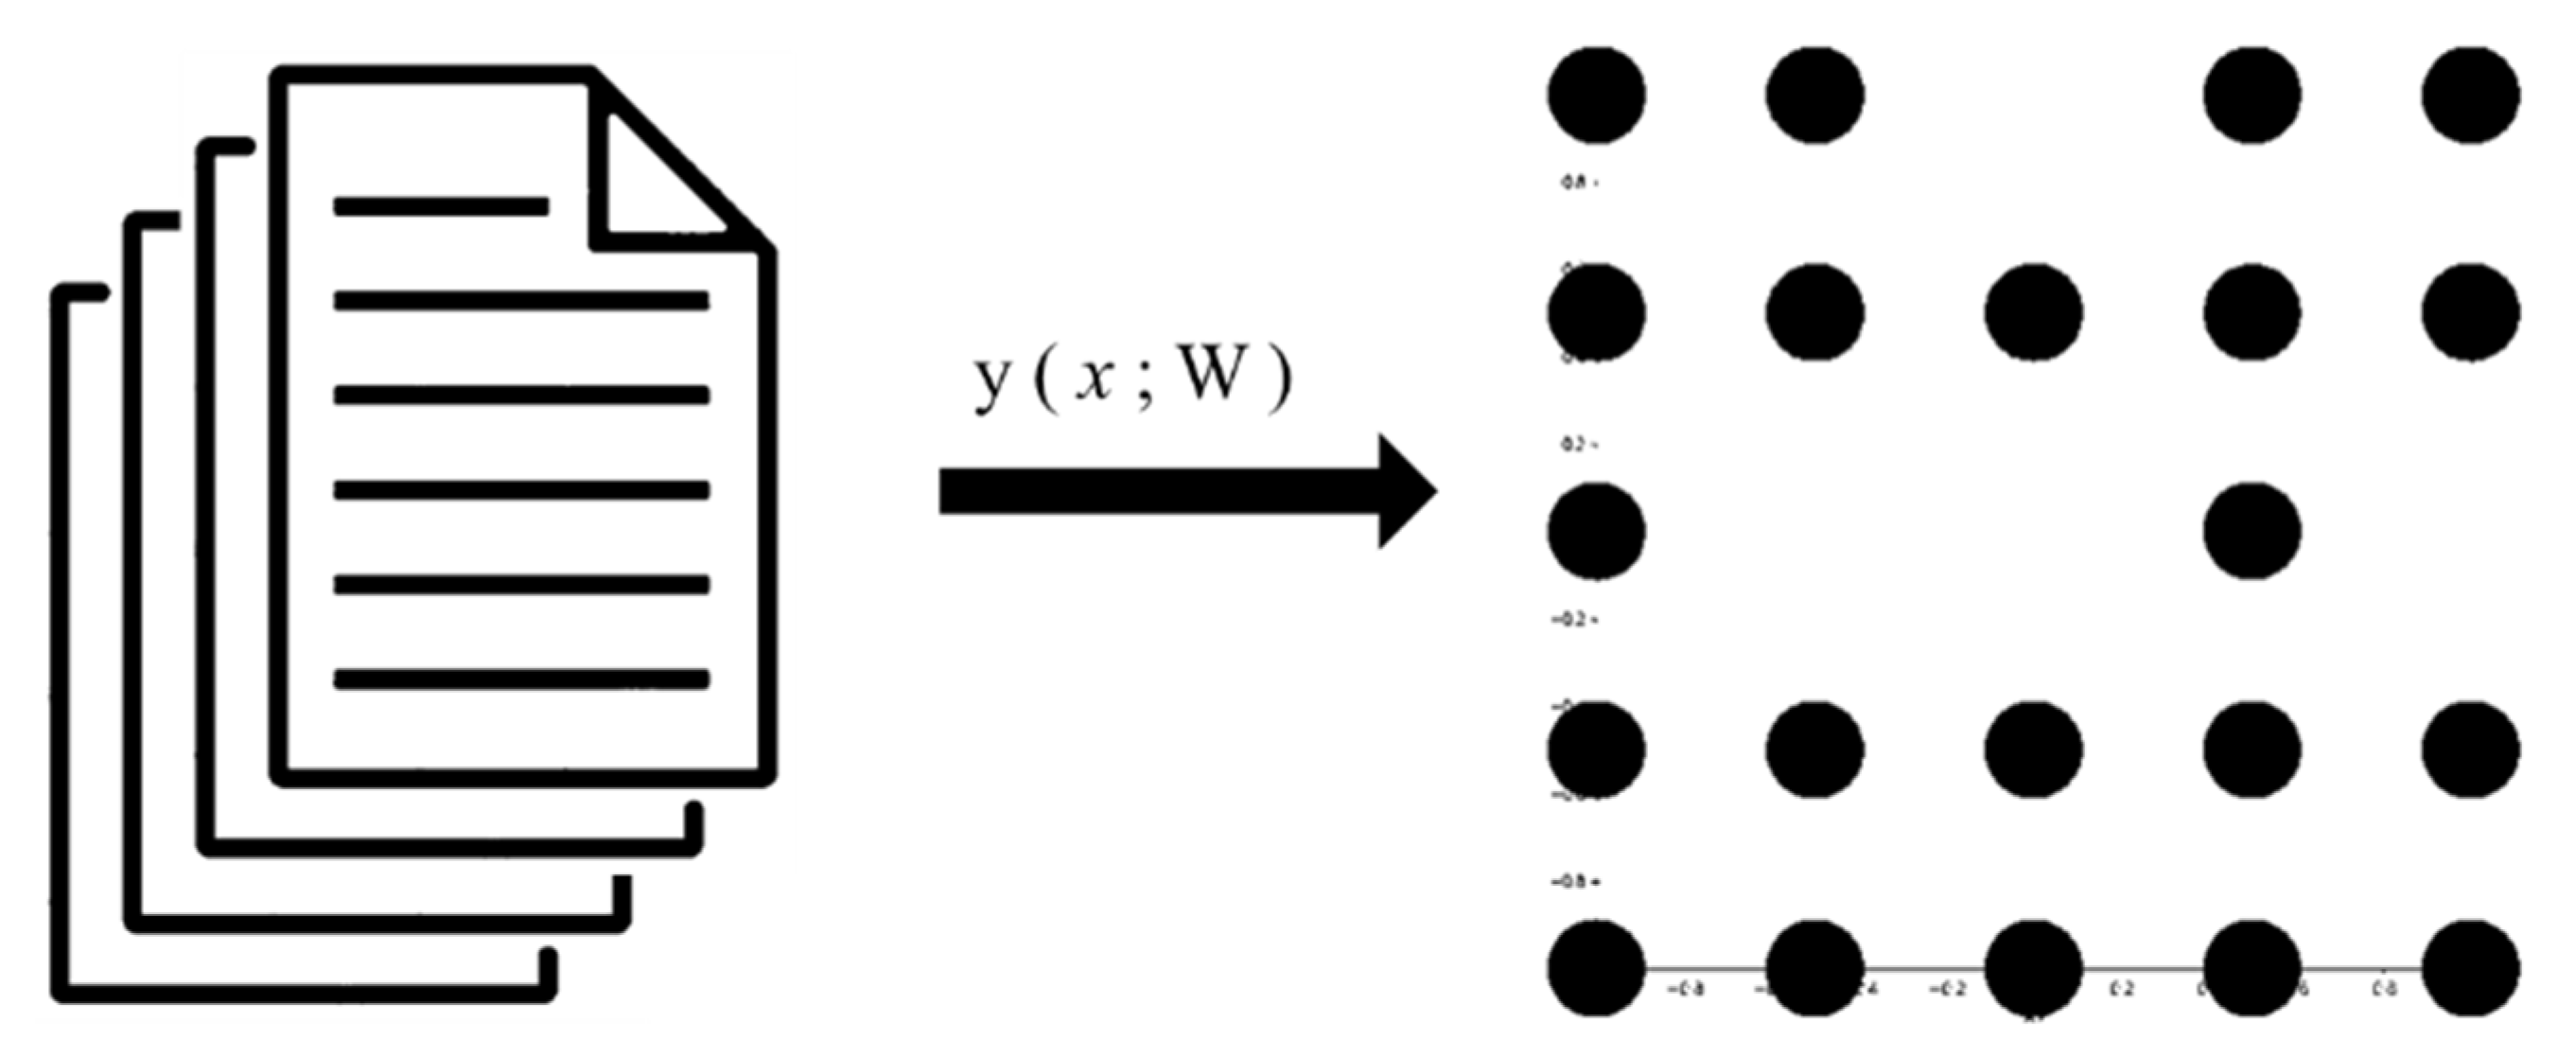
This process is carried out for the keywords of patents and papers document abstracts. Since the abstract is the part where the inventor of the patent and the author of the scientific paper write core information about the invention and research, keywords are extracted from the abstract. We extracted keywords using R program 4.1 and converted them into keyword vectors as shown in
Figure 2.
3.4. Generative Topographic Mapping (GTM) Analysis
Various correlations exist between many variables in the input data, and latent variables are used for modeling this. GTM is a typical algorithm that uses latent variables. GTM is a nonlinear mapping method that maps data from a multidimensional space to a low-dimensional using the characteristics of such data. GTM is widely used for data analysis and visualization because of its visualization characteristics. GTM is used for classification and regression modeling for the ease of data classification by visualization.
GTM is a method for mapping data in two-dimensional latent space, as shown in
Figure 3. Each point in low-dimensional latent space is mapped onto a manifold in the initial descriptor space. The manifold is in a square grid, consisting of nodes with k × k in size. Nodes are marked on the grid in low-dimensional latent space by radial basis functions (RBFs), which are Gaussian functions. Latent space generally has a size of [−1,1]
2 [
38,
57]. The RBFs are included in the function y (
x; W) connecting the two spaces, and the manifold distortion is controlled within the limits of the predefined parameter set.
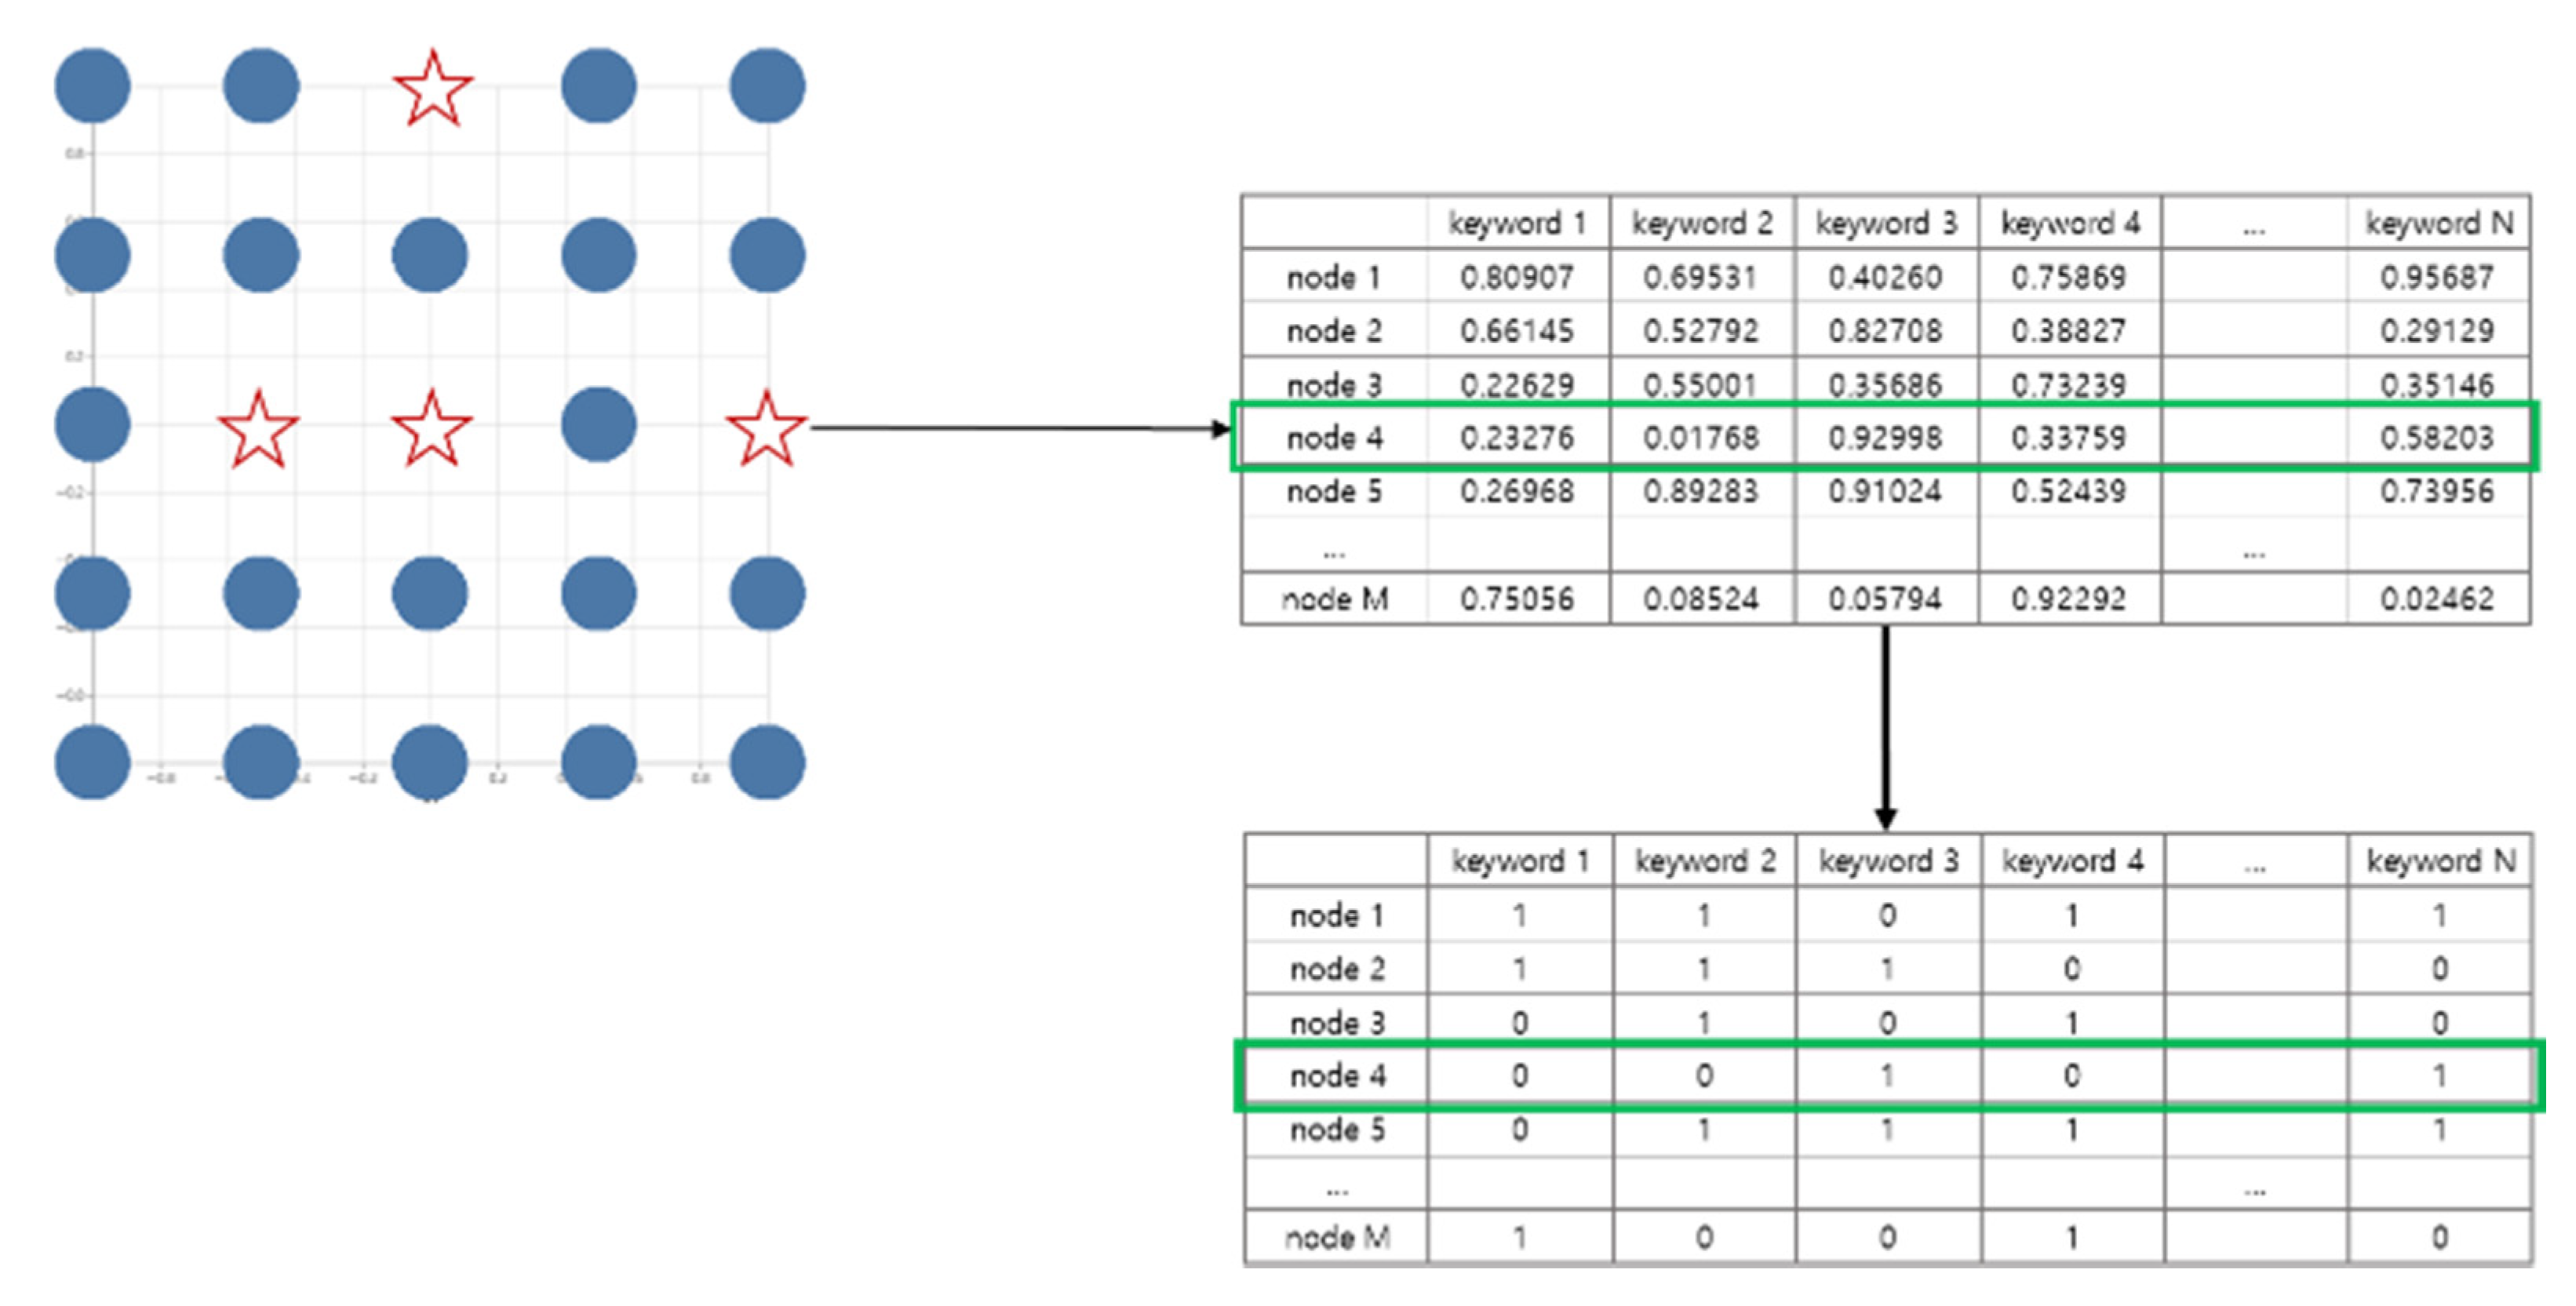
In this study, keywords extracted from patent data were used to construct a key–patent matrix, and the constructed matrix was used as GTM data. Because each keyword represents a vector attribute, a keyword vector has as many dimensions as the number of keywords extracted, meaning N-dimensional data were analyzed. Subsequently, the data were mapped in two-dimensional latent space, and as a result, mapped nodes in the map formed a single node as an aggregate of those close to each other relative to the keyword, meaning patents with similar topics.
The GTM patent map can use the inverse function to find vacuum technology keywords in the node. As shown in
Figure 4, a keyword vector corresponding to a vacuum node can be calculated, and the characteristics of a node can be identified through the calculated vacuum technology keyword. Through this method, it is possible to analyze the technology of the vacuum node [
58,
59].
3.5. Tracking the Frequency of Vacuum Technology Keywords
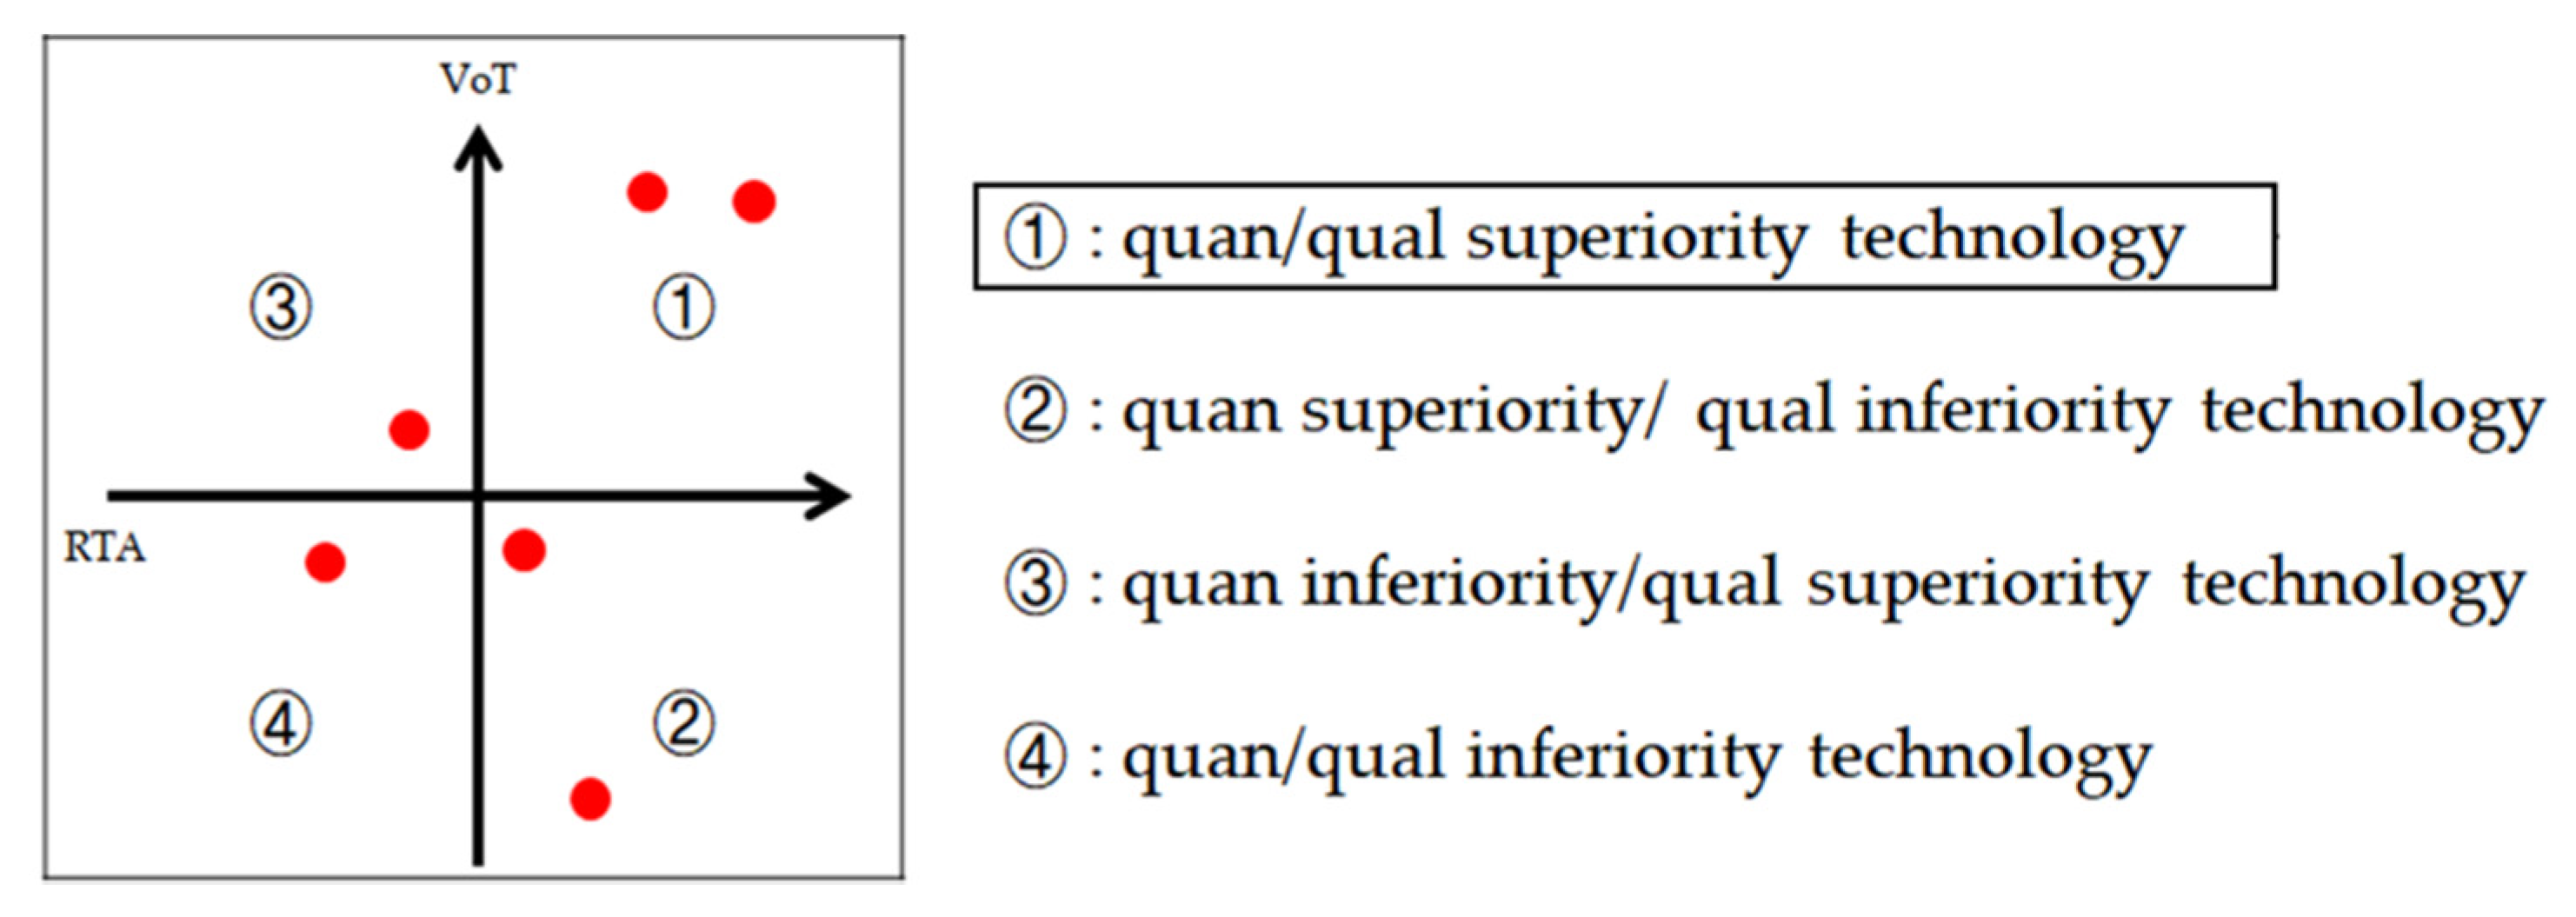
A vacuum node derived through GTM indicates that the field is technological opportunities, and technical keywords in the specific technology can be derived. The technology level graph may analyze the technology level of the data by analyzing the relationship between the qualitative level and the quantitative level of the data [
60,
61]. As shown in
Figure 5, the
X-axis represents the revealed technological advantage (RTA) for the relative quantitative evaluation of technology, and it shows that the technology is also rapidly growing as patents are applied [
62]. The
Y-axis represents the Value of Technology (VoT) for the relative qualitative evaluation of technology is suitable as an evaluation index for the effectiveness of the technology because it indicates the validity of a patent [
63,
64].
In the technology level graph, the technology can be located in one of the four quadrants, and the level of the technology can be analyzed by identifying the quadrant where it is located. The technology located at quadrant 1 in the graph is analyzed as having a high technology level, and technology located at quadrants 2 and 3 is analyzed as having a medium technology level. The technology of quadrant 4 can be analyzed as having a low level of technology.
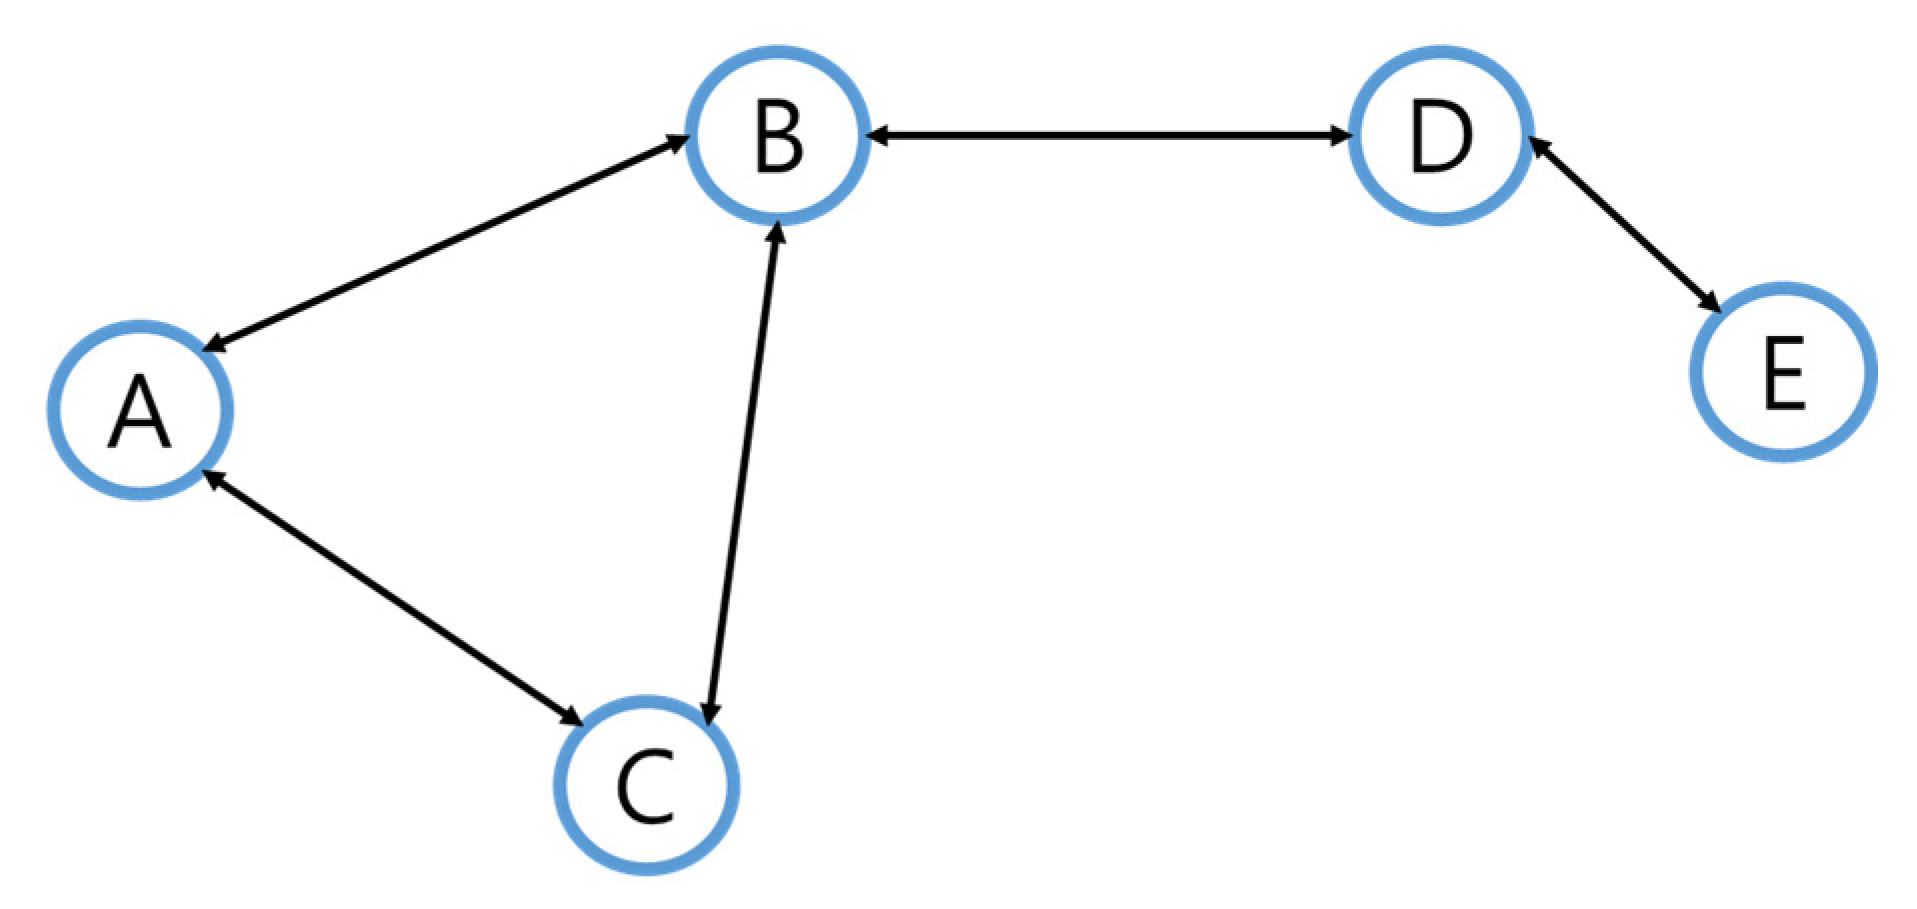
3.6. Social Network Analysis (SNA) Analysis
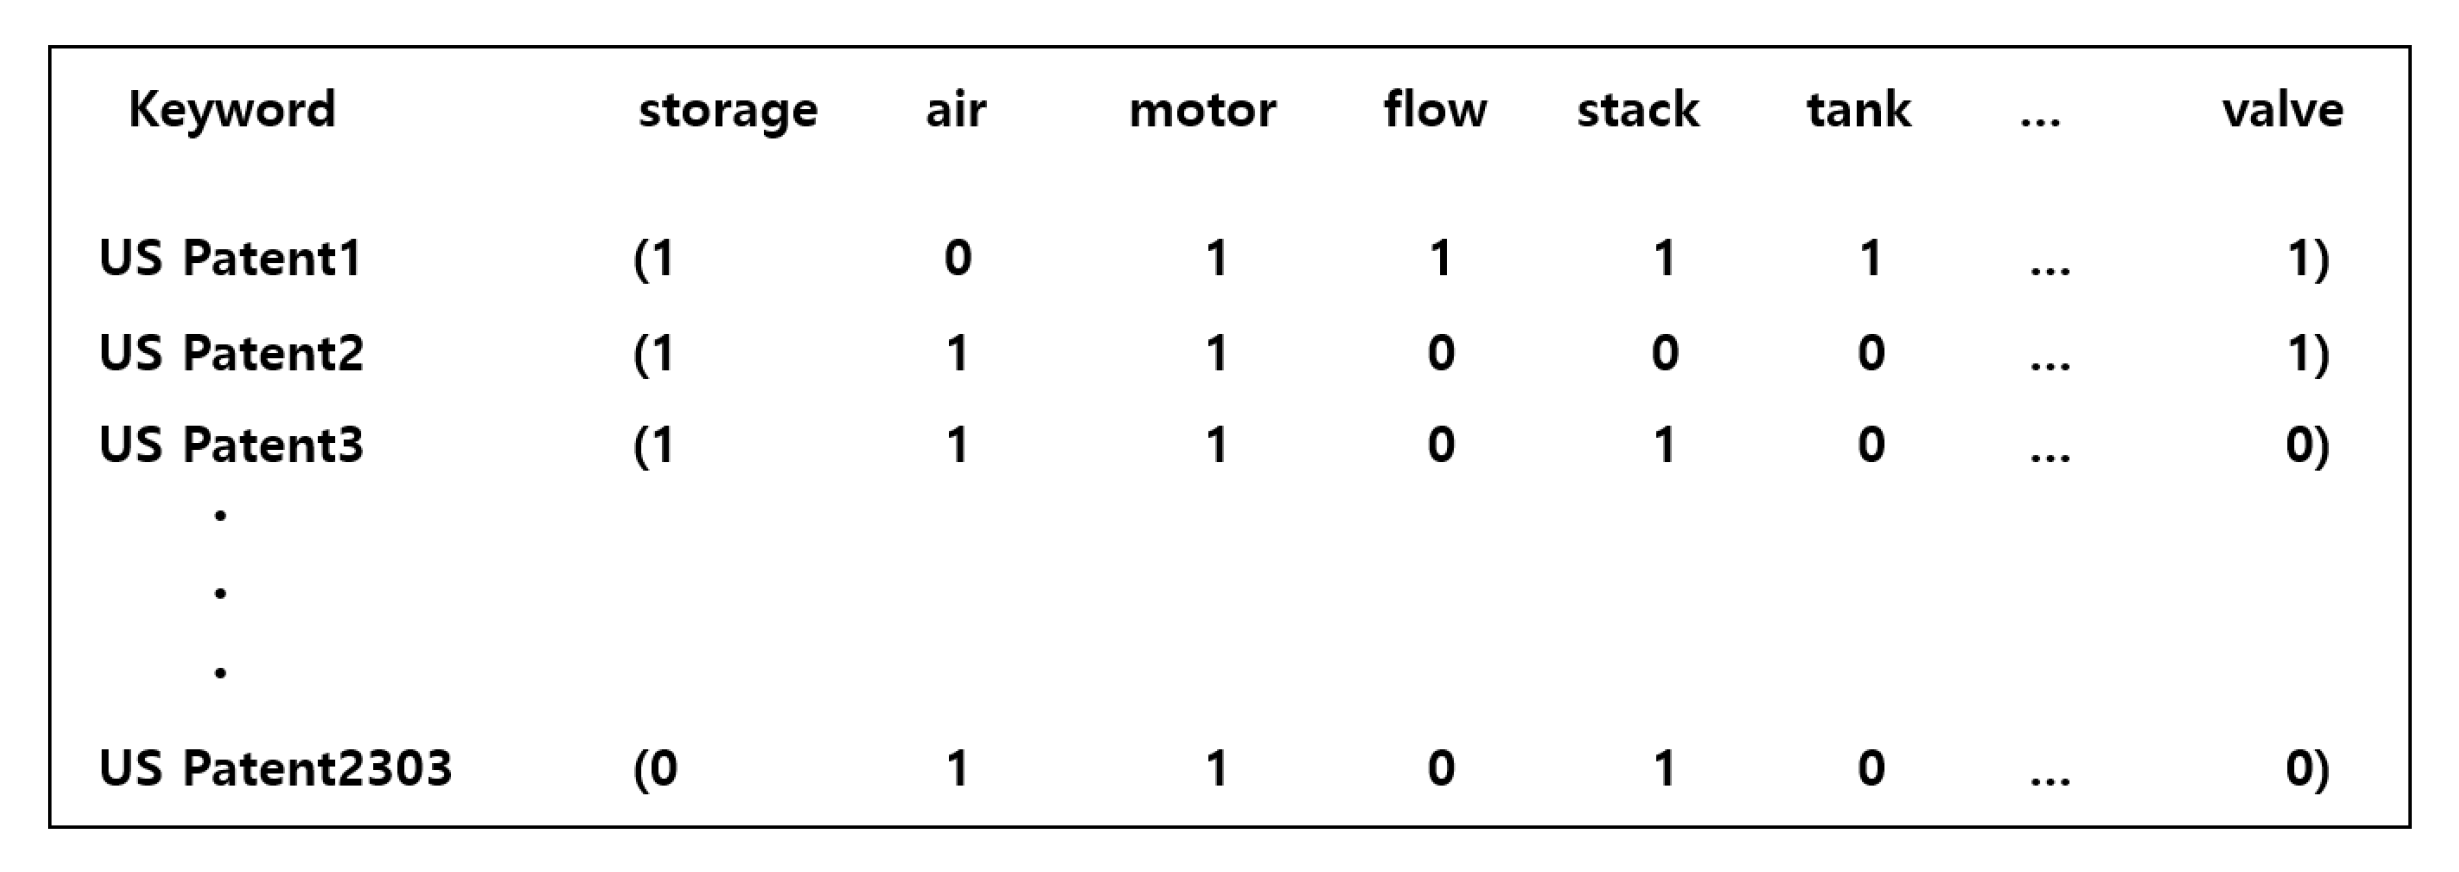
SNA was performed using a keyword classification-based correlation matrix. It was used to analyze data contained in patents and papers to identify keywords that appear frequently and analyze the correlations between such keywords. Correlations between keywords were analyzed, and relevant technology was identified through keywords with high correlation.
In
Table 1, Patent 1 has keywords A, B, and C, and thus, it could be interpreted to have correlations between these technologies. Such correlations can be demonstrated as the matrix shown in
Table 2, and here, SNA could be combined to derive significant technological implications.
In SNA, actors within a social network are expressed as nodes, and influence between actors is expressed as an edge to illustrate the relationships and patterns between actors. As shown in
Figure 6, SNA is used as an analytical method for easily understanding and interpreting the complex relationships between actors.
SNA can not only be used to illustrate network structures but can also be used to quantify the relationships between nodes through centrality indices. Keywords can be expressed as nodes through SNA for visualization of each keyword and analysis of the connectivity between nodes, whereby keywords with high centrality could be analyzed, and core technology sectors can be predicted. However, centrality only demonstrates the direct or indirect proximity between technologies, so it is difficult to adequately explain the correlations between technologies based on identification of centrality.
4. Results
In this study, we analyzed 2303 US published patents and 2466 papers to discover future promising technologies for hydrogen fuel cell-based transportation. For the analysis, US patents published between January 2000 and April 2021 were searched in the WIPS ON database. Through this process, 5691 patents were identified, and to screen valid patent data, noise filtering was performed together with an expert. Consequently, a total of 2303 patents were selected for the analysis. For scientific paper data, 2466 papers out of 3230 papers searched in the Web of Science database were selected together with an expert. The search keywords used for analysis of patent and paper data included “hydrogen”, “fuel cell”, “vehicle”, “car”, “automobile”, “bus”, “truck”, “railway”, “train”, “tram car”, “locomotive”, “railroad car”, “ship”, “vessel”, “aircraft”, “airline”, and “airplane”. For patent search, an IPC search was performed concurrently to increase the accuracy of the search results. IPC is an internationally unified patent classification system that represents the technical field of patents and is used as a major source for patent classification and search. The World Intellectual Property Organization (WIPO) has presented the IPC’s technical classification for comparative analysis of cross-border production, employment, research and development, and foreign trade. We used the IPC codes (B60; B61; B62; B63; B6) of the Transport Area defined by WIPO and applied them to the patent search in the transportation field [
65]. For text mining, keywords from abstracts of patents and papers were used for keyword extraction. Since the abstract is the part where the author of the patent describes important information, keywords are extracted from the abstract for analysis [
36].
For the preprocessing of the learning data, a document–word matrix was created by extracting only the part about “summary” from patents and papers using text mining techniques. Since it is difficult to structurally interpret multidimensional variables, it is analyzed by converting them to a lower dimension through principal component analysis. In this case, the number of principal components for each national patent document is selected so that the explanatory power explained by the principal components exceeds 90% [
66]. Misspelled words or abbreviations included in the extracted data were corrected or removed [
67]. After decomposing the original data in the form of sentences into individual words, the uppercase and lowercase letters were changed, and spaces, numbers, and other symbols were removed through the tokenizing process. After that, by filtering, words, prefixes, and suffixes that are considered unnecessary were removed, leaving only the words constituting each document to form a patent–keyword matrix.
4.1. Identification of Technology Vacuum Area
In general, methods that rely on experts have been used to identify technical vacuum fields through patent analysis. GTM analysis makes it possible to automatically detect technical vacuum fields [
36]. In this study, GTM analysis was performed using Python3. GTM creates a two-dimensional map by analyzing the relationships between patent data. Several parameters need to be set to values, but the size of the map is very important if you want to investigate the vacuum areas of the map. Because there is no empirical rule for determining map size, a sensitivity analysis was performed, which allowed analysts to evaluate the relevance of a selected parameter by changing the parameter values [
67]. Patent analysis was performed based on the GTM-based patent map, and an appropriate K value should be assigned so that the map is not too sparse or dense [
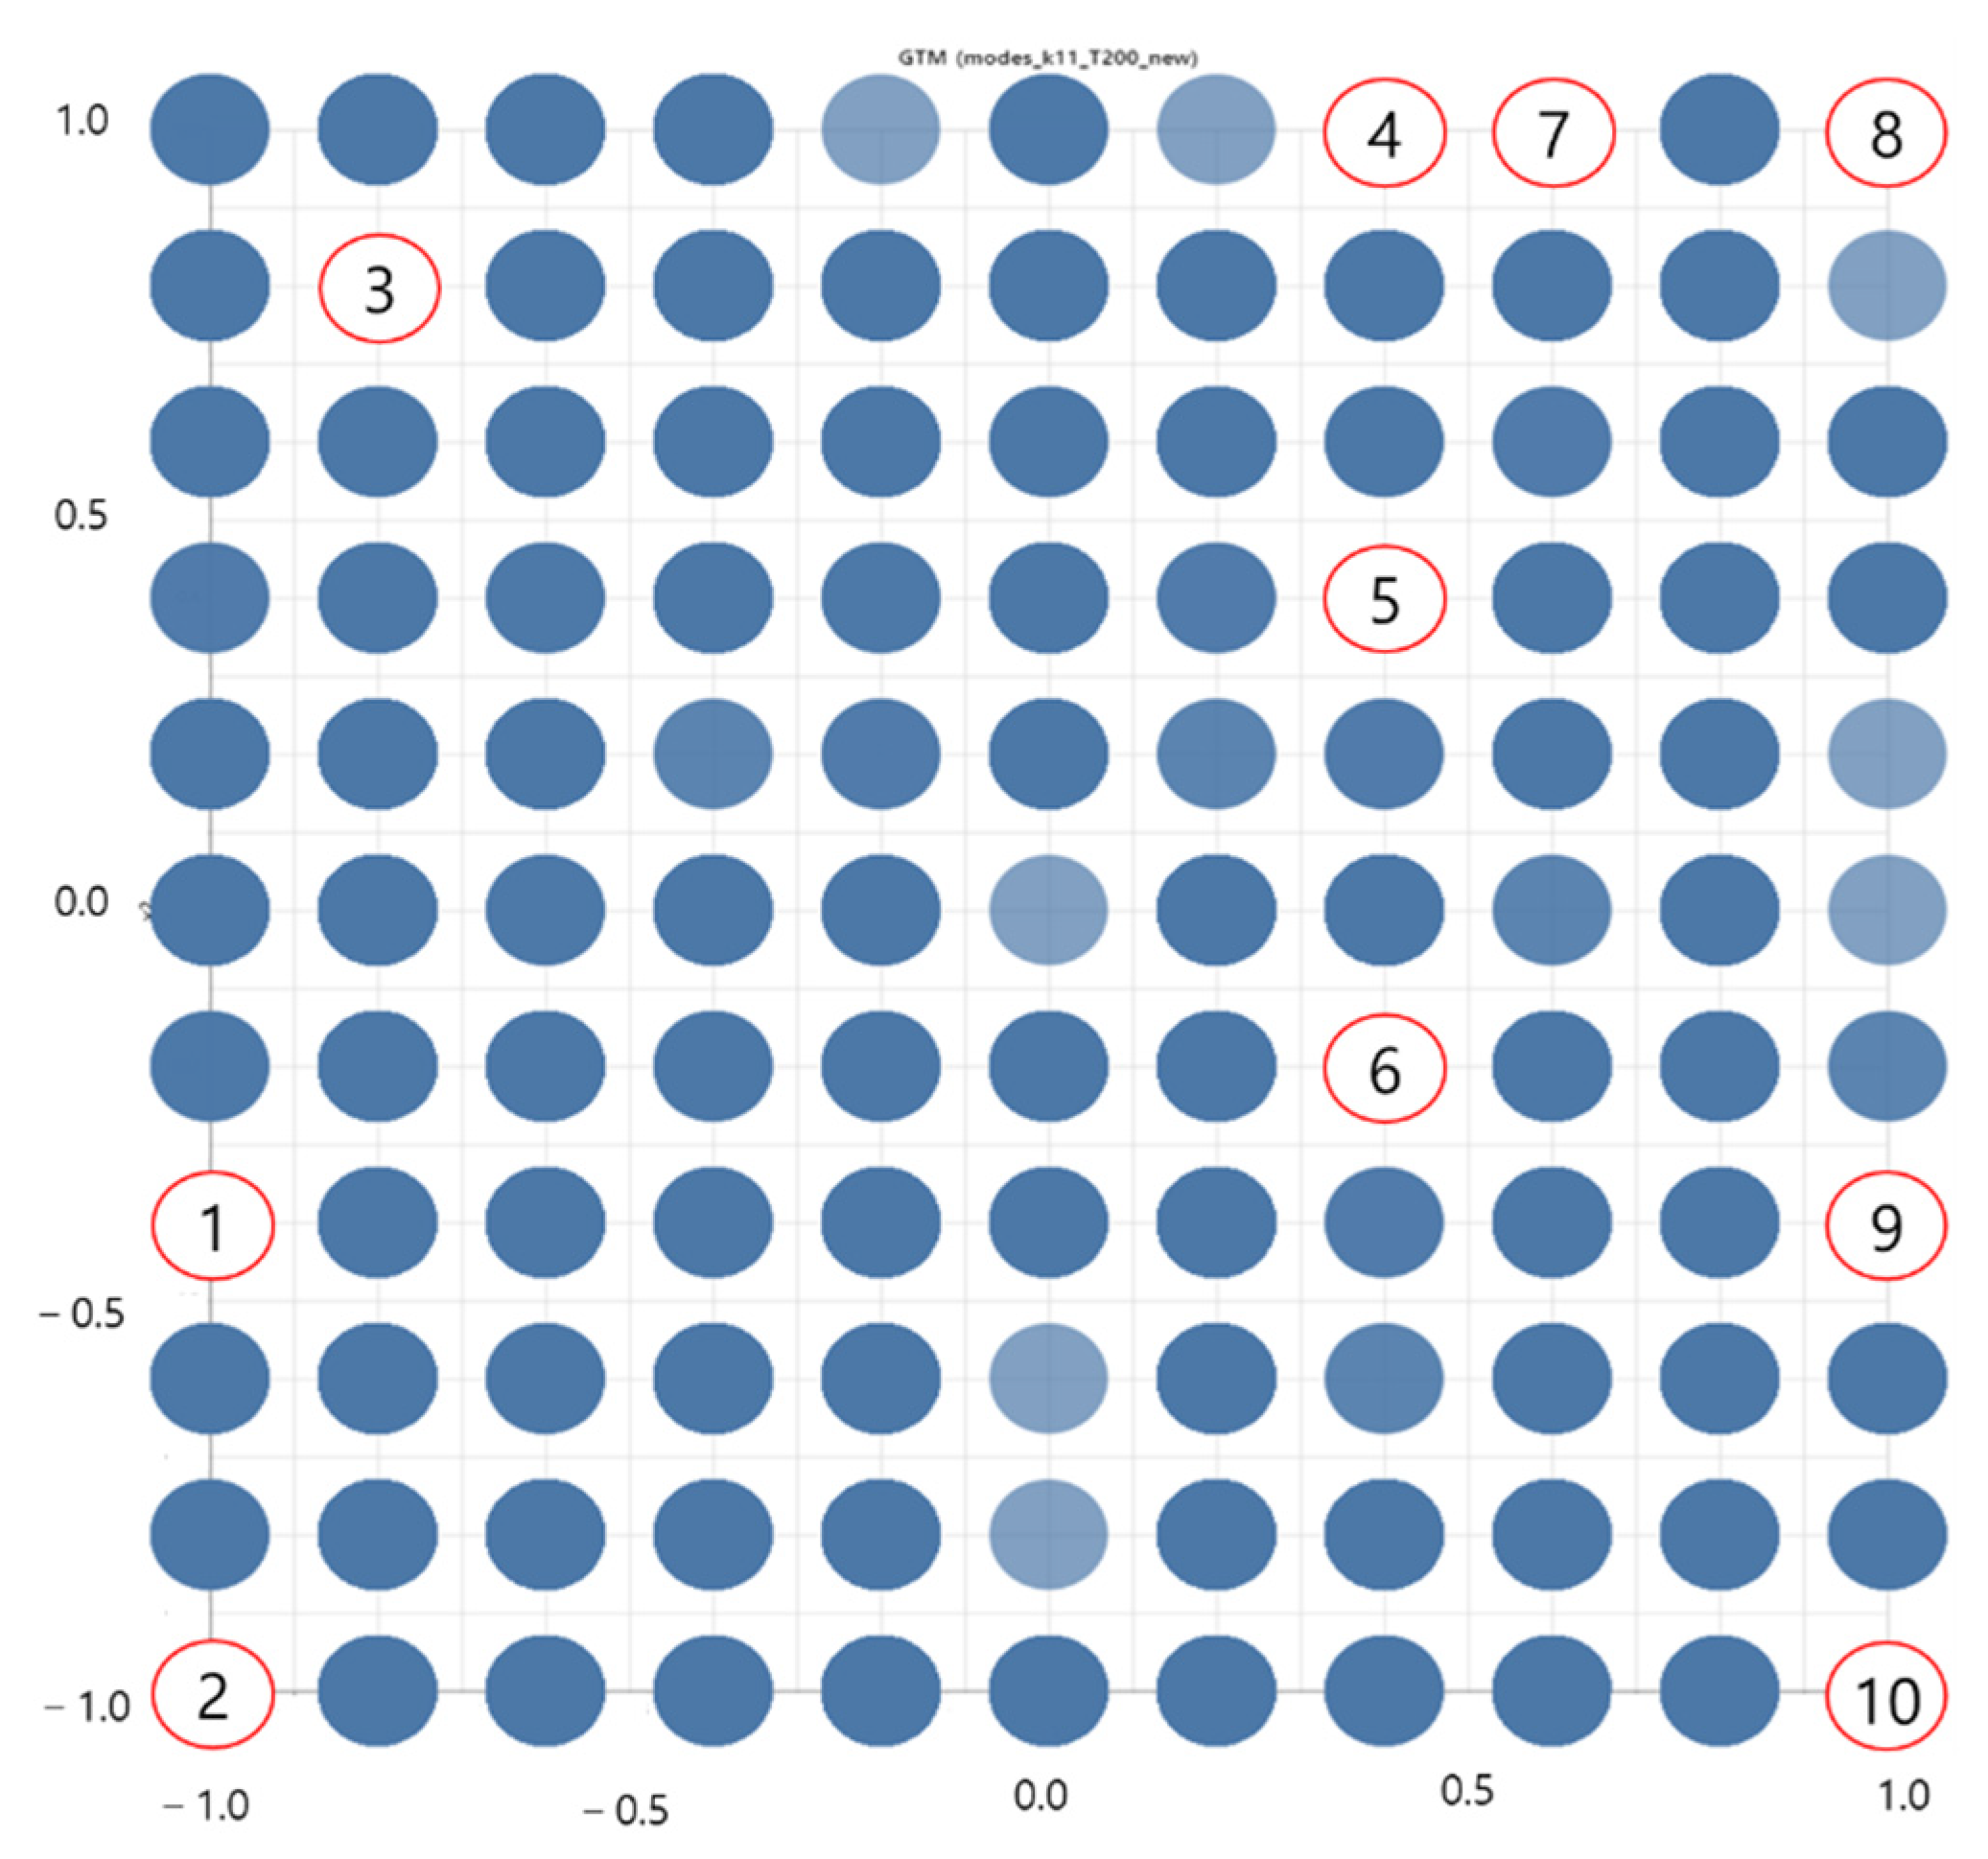
36]. In this study, to set the value of K, the experiment was conducted within the range between 8 and 13, and finally, the value of K was set to 11.
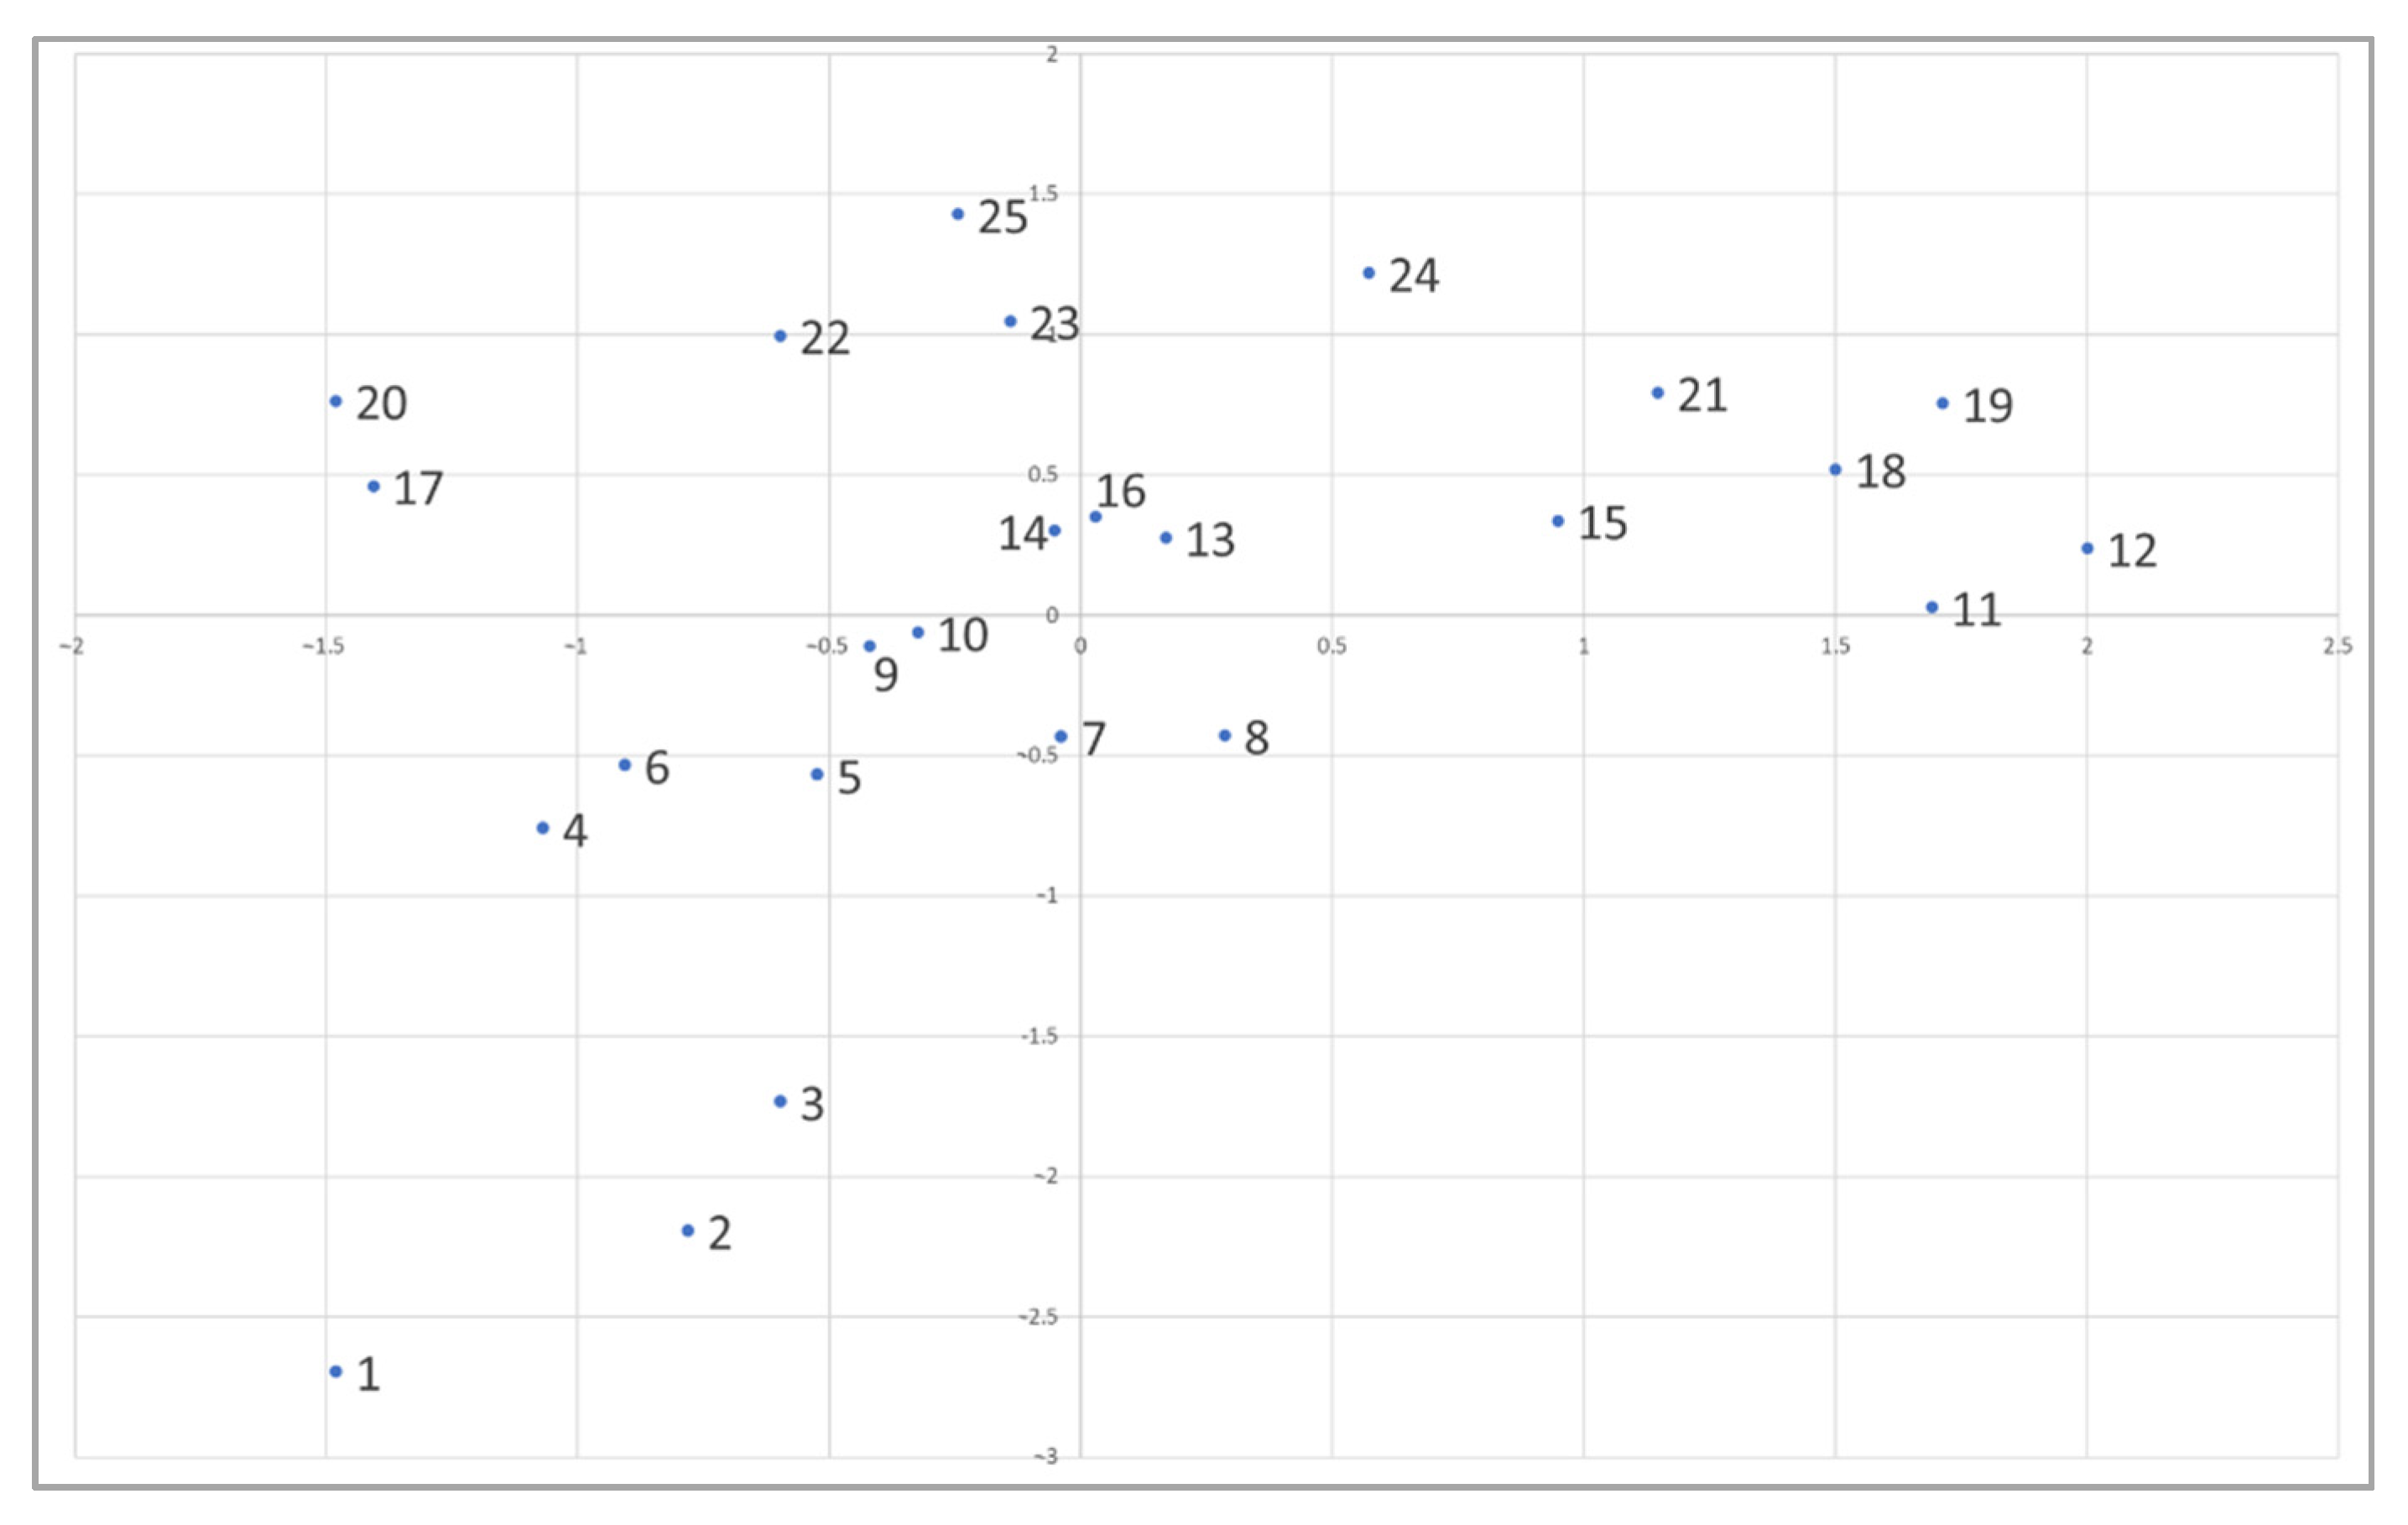
As a result of analyzing the patent DB, the vacuum area was searched. The vacuum area appeared differently depending on the value of K. We repeated the experiment with various K values, and when K was 11, the following experimental results were derived from the nodes of the vacuum area, as shown in
Figure 7.
We performed inverse mapping to identify the technologies of the nodes of the vacuum area [
67].
Table 3 lists the results. The keywords of each node do not represent one technology category. Therefore, we had to integrate and analyze the technology of hydrogen fuel cell transportation suggested by the technology keywords of each node.
Vacuum technology #1, #4, #7, and #9 in patent analysis represents stack technology. Vacuum technology #2 is a technology for a hydrogen storage tank in a hydrogen fuel cell vehicle. Hydrogen systems in transportation applications include hydrogen storage, hydrogen delivery, and fuel cells. In the system, the hydrogen storage tank is a key technology in relation to vehicle safety. Hydrogen is stored as a high-pressure gas in a hydrogen vehicle, so hydrogen leakage or tank rupture poses a serious threat. Vacuum technology #3 is a cooling control system, which is a technology for heat control of fuel cell transportation applications. Vacuum technology #5 is the DCDC converter technology. A Fuel Cell DCDC Converter is a device that receives the voltage of the hydrogen stack and boosts it (step-up FC output voltage) to charge the high-voltage battery while supplying power to the inverter that drives the motor. The required performance of DCDC converter is high efficiency, high power density, small size, and low weight, etc., and research to lower the cost should be continuously carried out [
68].
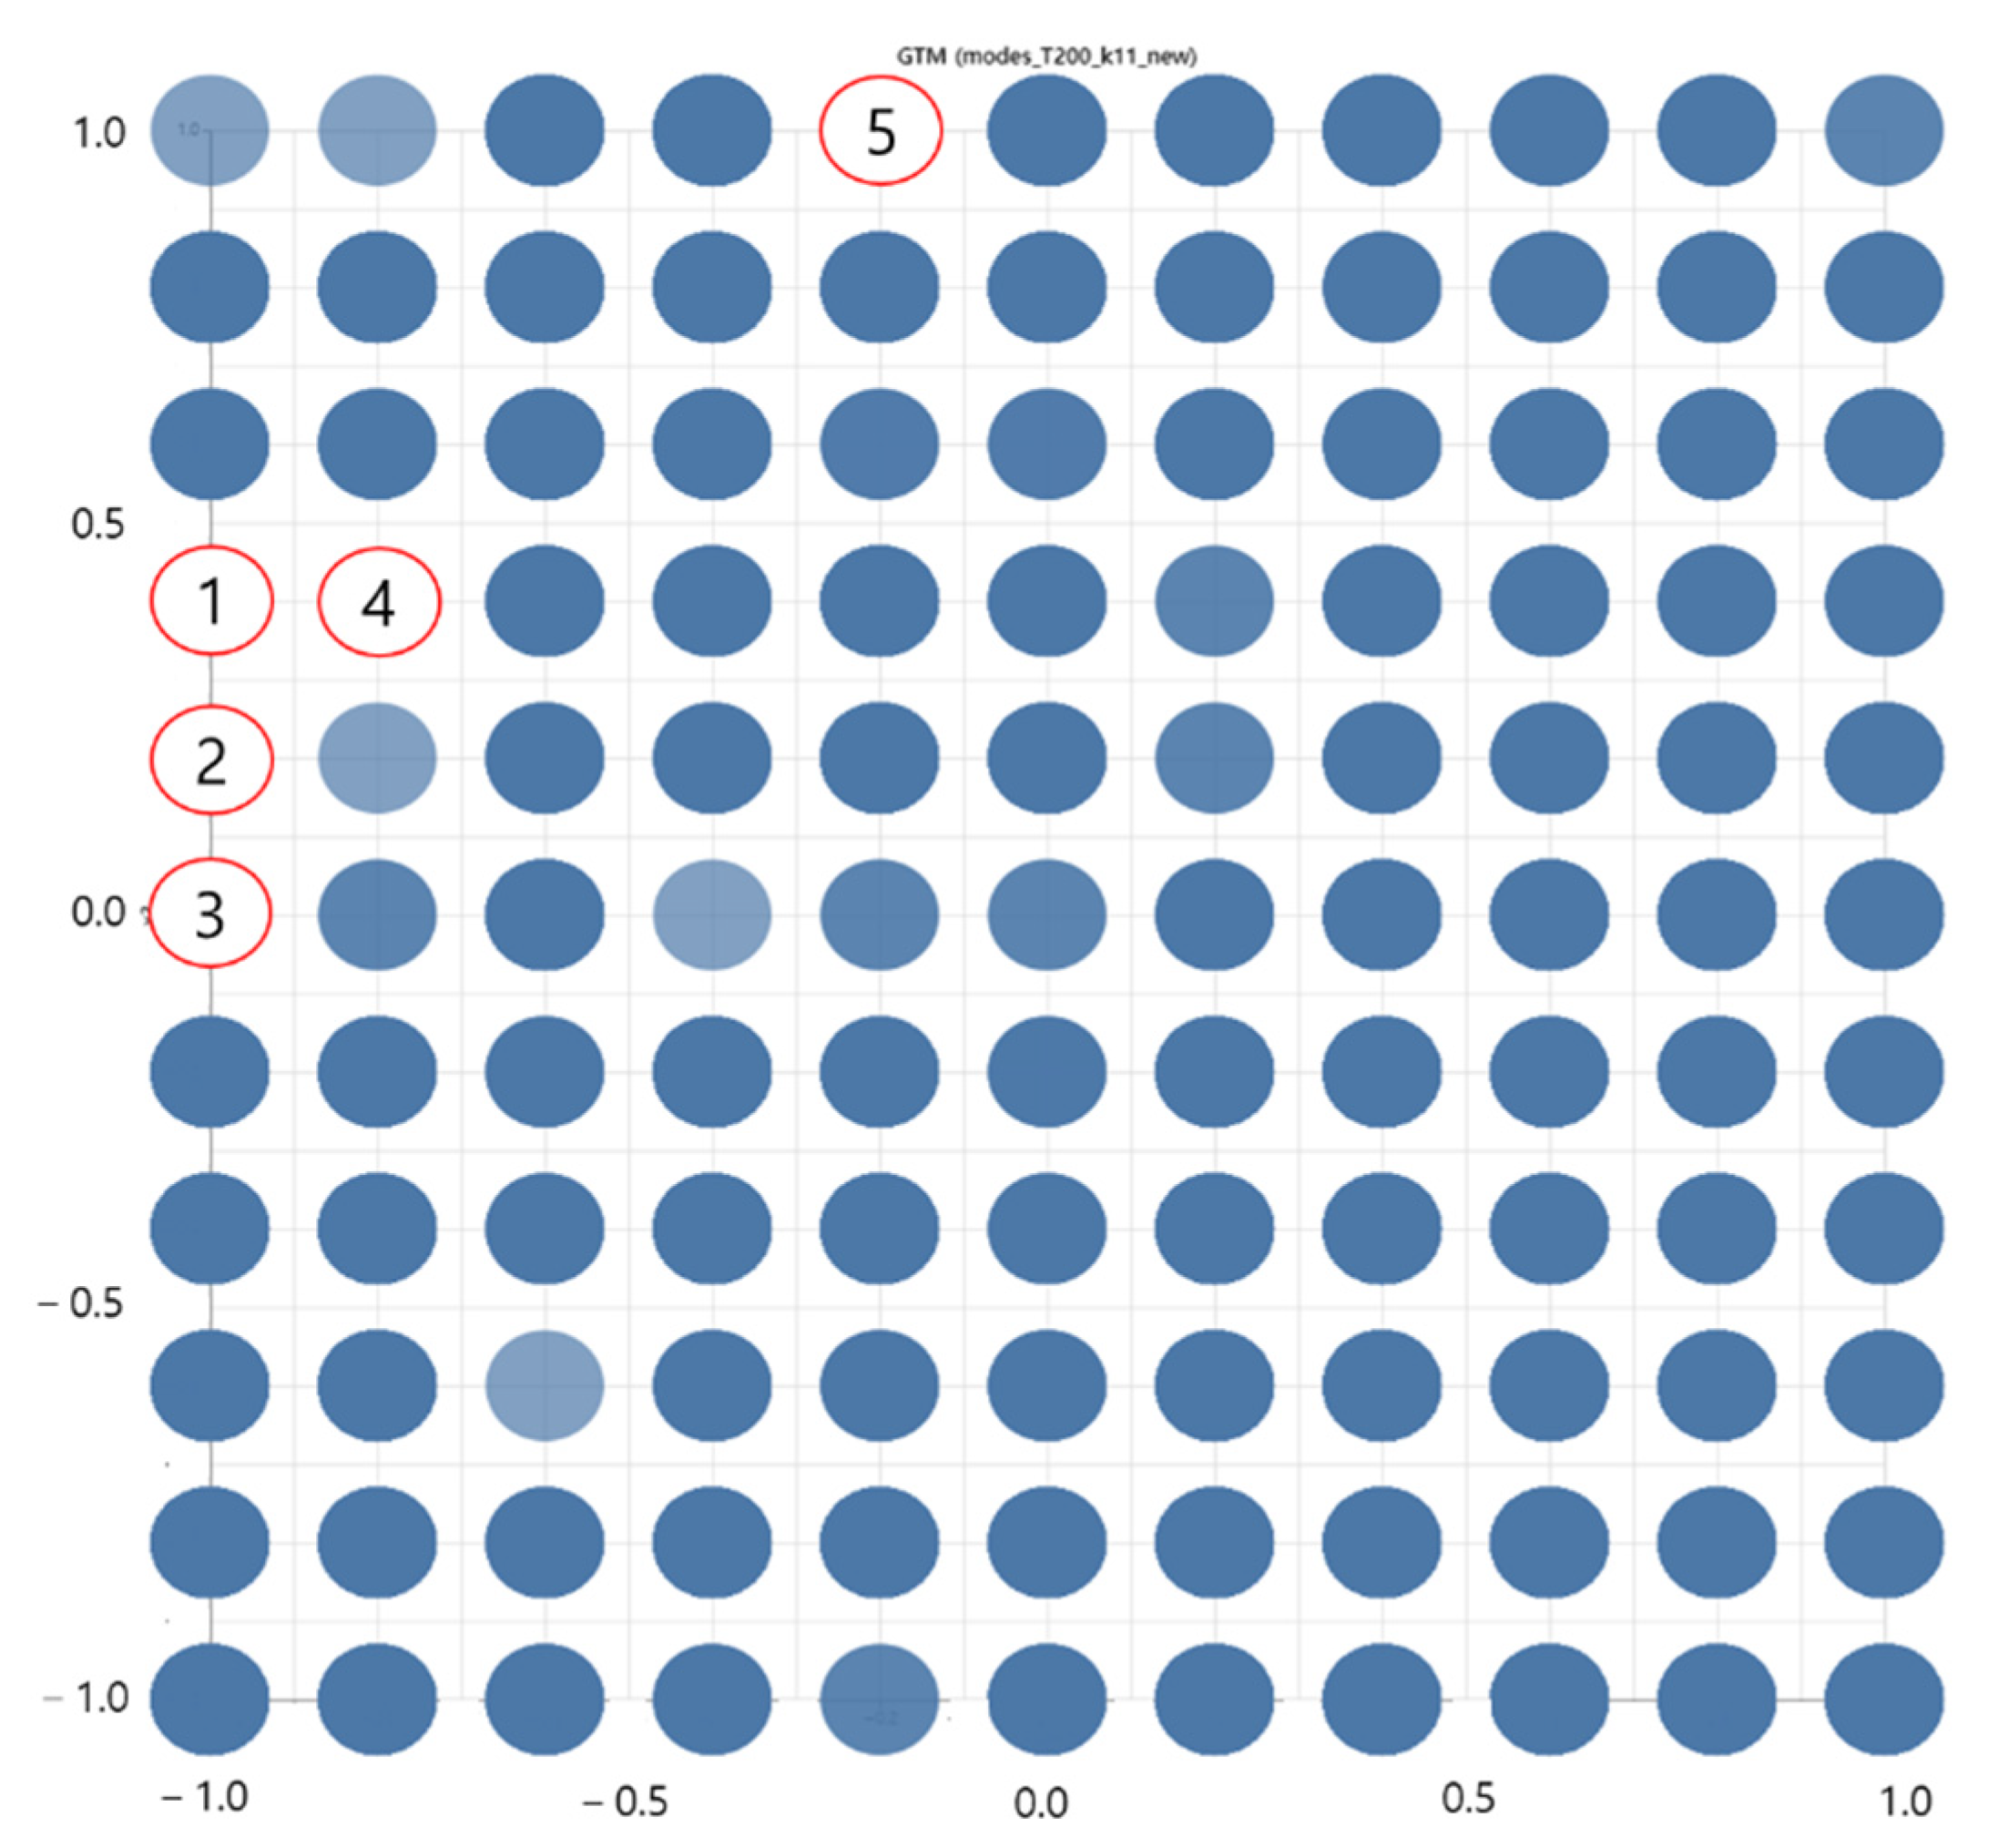
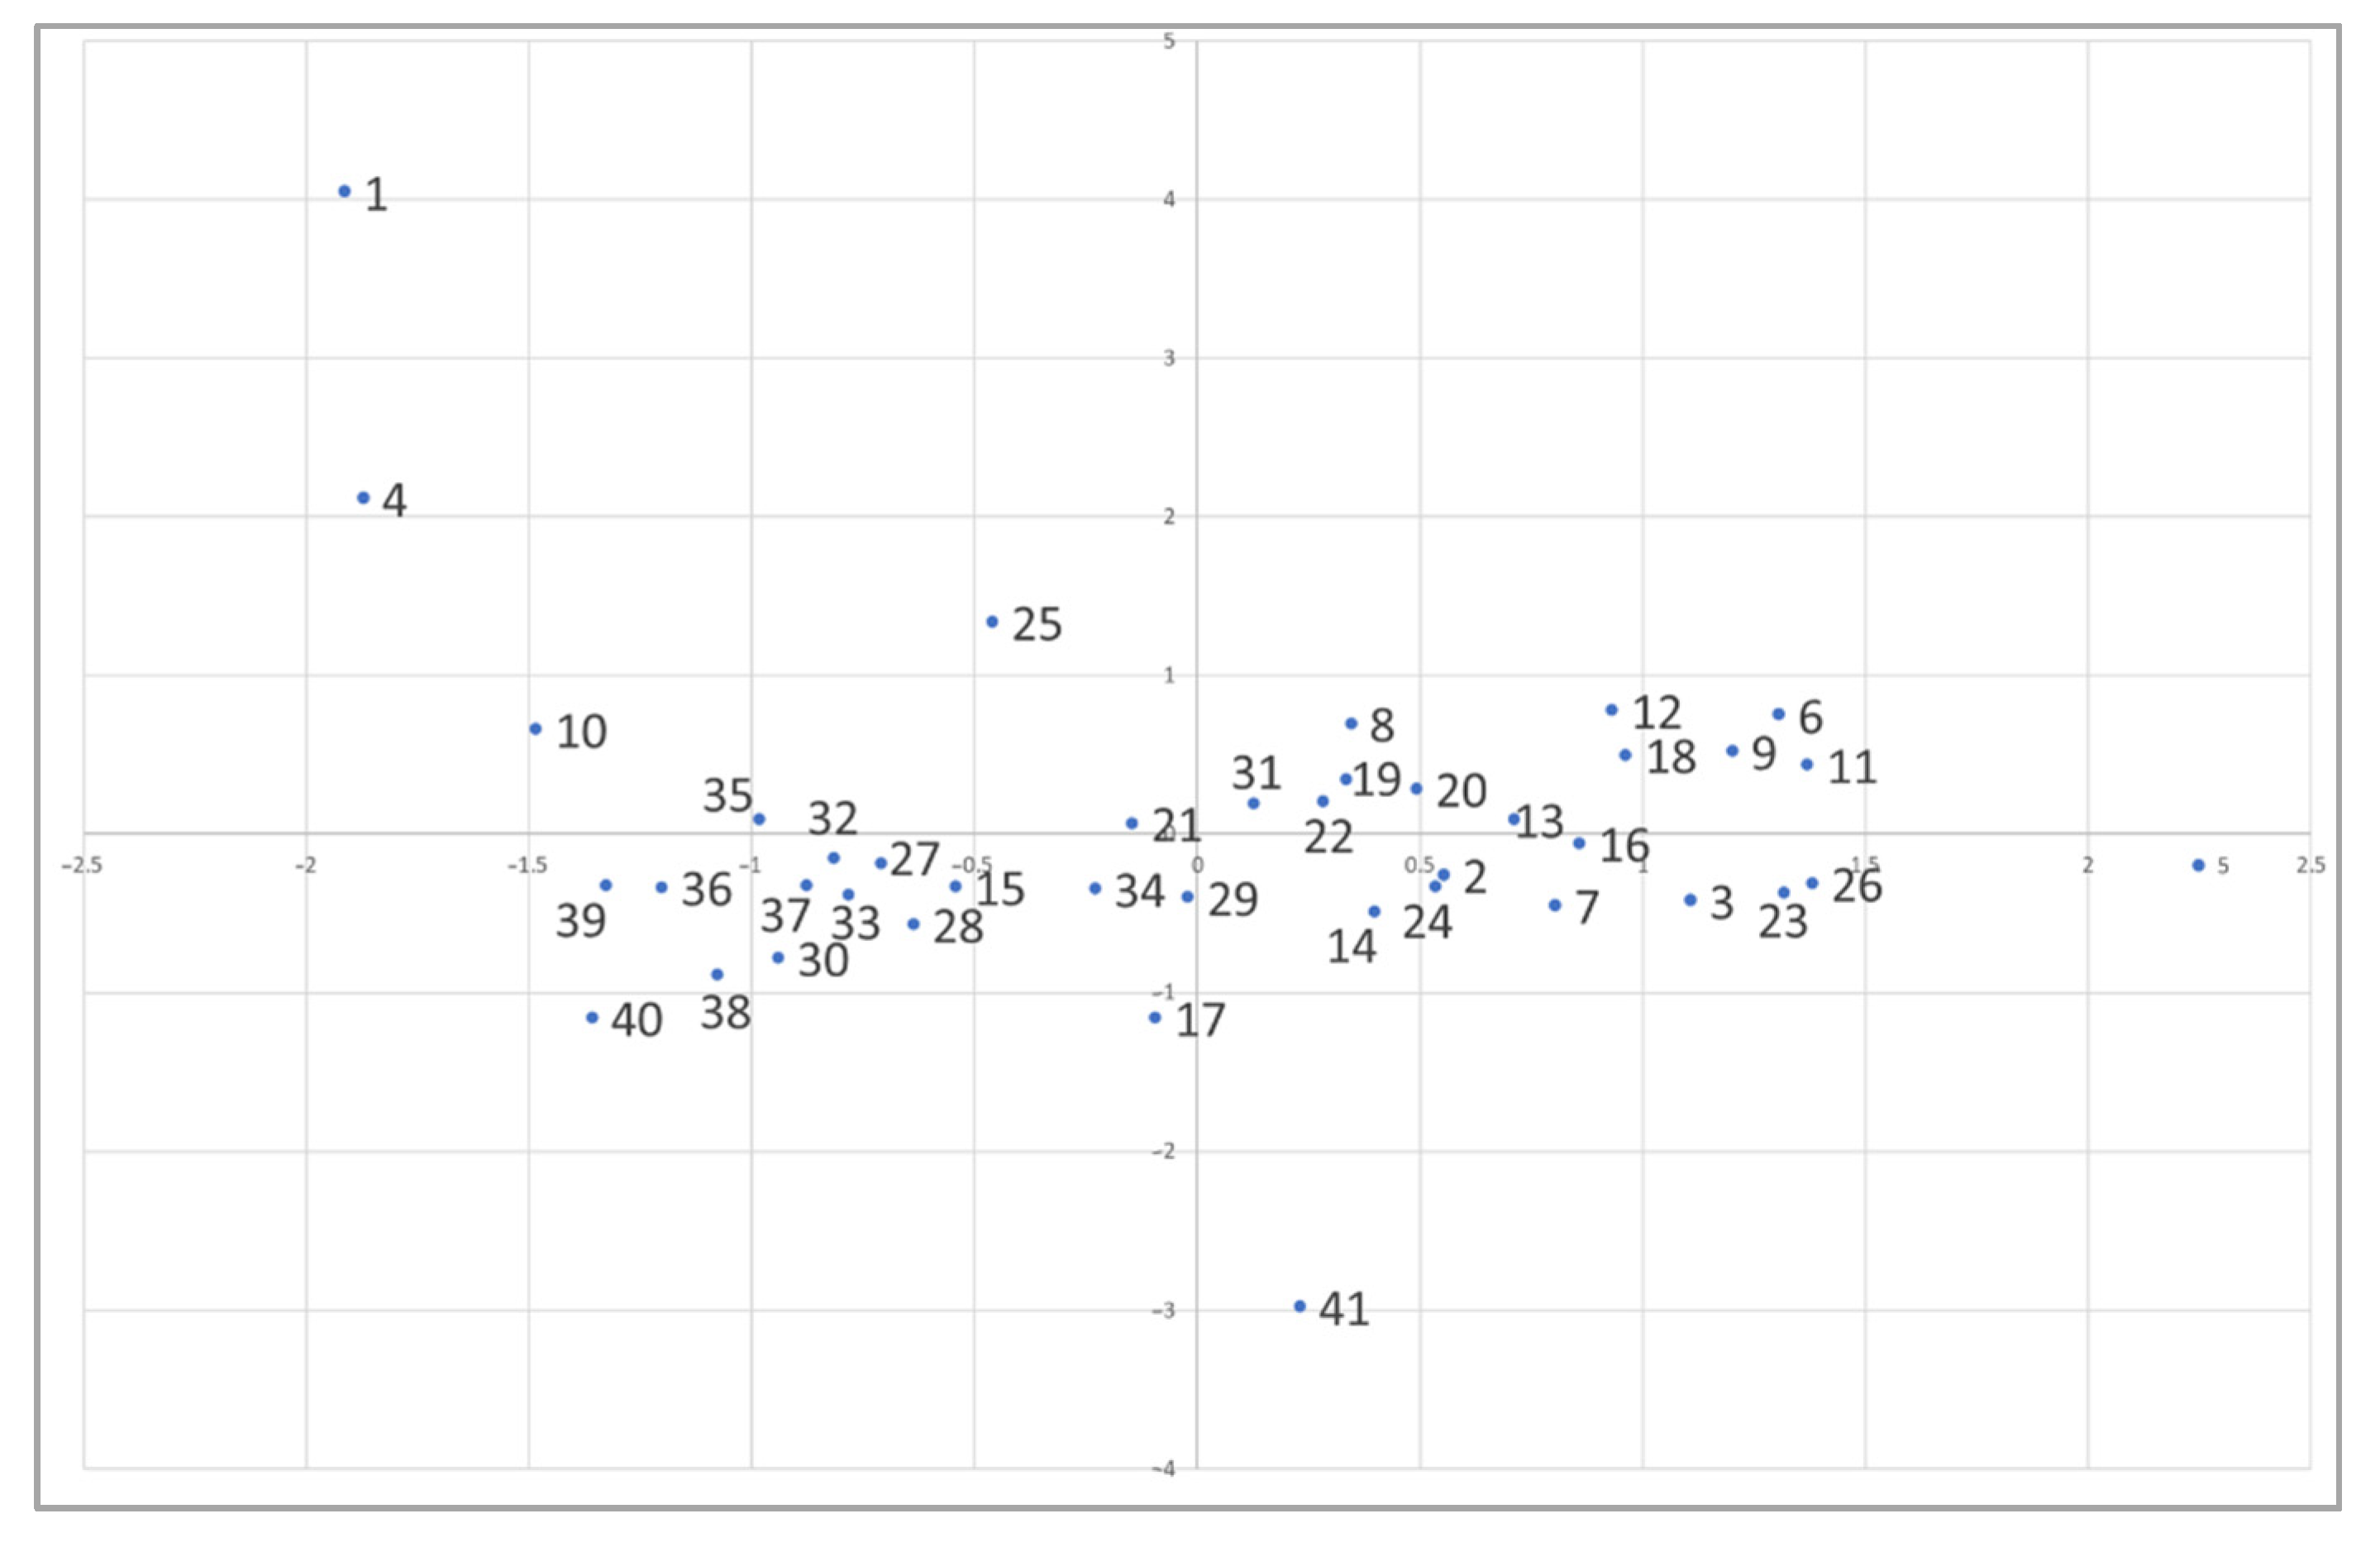
The research paper DB was analyzed by the same process as the patent DB. As a result, when k was 11, the vacuum area of 5 nodes was checked. After that, like in the patent analysis, the inverse mapping was executed to identify the technology of each node. As a result, technical keywords were identified, as shown in
Figure 8 and
Table 4. In vacuum technology #1, we derived proton exchange membrane technology. The keywords of vacuum technology #1 are water, PEM, proton, exchange, flow, density, rate, PEMFC, and stack. In hydrogen transportations, the membrane is a polymer electrolyte membrane (PEM). PEM is a membrane that selectively passes only hydrogen ions, and electricity is generated in this process. PEM should be developed to operate stably, even at low temperatures, while maintaining a constant power density. In addition, since it is an expensive material, it is a part that requires cost reduction. Although technology is progressing from hydrocarbon-based membranes to fluorine-based membranes and improving performance, the high-cost problem must be resolved. With vacuum technology #2, we identified the catalytic and cathode electrodes as important technology factors. In hydrogen fuel cell-based transportation technology, catalyst technology is a key material for the stack cost [
69]. The catalyst currently used is platinum (Pt), in which nanometer-sized Pt particles are attached to carbon particles. Pt catalysts have problems with high cost and instability in supply and demand, and the performance degradation of Pt catalyst electrodes is highly related to the fuel cell replacement cycle. There is an urgent need to the replacement of catalysts other than platinum group metals (PGMs) for fuel cells. The replacement catalyst should have benefits of cost, durability, and accessibility. Metal–nitrogen–carbon catalysts (M–N–C) are suggested as PGM-free catalysts. As metals, Fe, Co, Ni, Cu, Mn, etc., are suggested. Catalyst research will focus on future catalyst performance, durability, and cost issues. The keywords of vacuum technology #3 (carbon, diffusion, layer) are important technical elements in the stack. The stack of a hydrogen vehicle is a core technology, and the gas diffusion layer (GDL) of the stack occupies an important part in the price of the stack. GDL evenly diffuses air into the cell and is located outside the membrane electrode assembly to support the membrane electrode assembly and supply oxygen or hydrogen as a reactive gas. The GDL is made of carbon paper with a micropore structure inside the stack, and thin-film manufacturing process technology and cost reduction are being actively developed. In vacuum technology #4, keywords such as railway, optimal, algorithm, safety, locomotive, engine, and supply are interpreted as hydrogen train and hydrogen locomotive technology. Vacuum technology #5 is confirmed by Fuel Cell DCDC converter technology.
4.2. Technology Level Analysis of Vacuum Technology Keywords
For vacuum technology keywords derived through GTM, keyword analysis was performed to confirm the current technology level. To this end, the vacuum technology keywords of patents and papers derived from the GTM results are analyzed, and the vacuum technology level is checked based on the quantitative indicators of the keywords. Based on the number of publications and average publication date of each keyword of patents and papers, the graphs are as follows [
70].
Figure 9 is the result of the vacuum technology level of the patent DB, and
Figure 10 is the result of the vacuum technology level of the paper DB.
The technical level of vacuum technology derived through patent analysis was classified into three levels: high, medium, and low. In the patent data, the technologies indicated by the high level of vacuum technology are gas (11), electric (12), flow (13), motor (15), water (16), hydrogen (18), stack (19), air (21), and voltage (24), and the technologies with intermediate technology levels are storage (8), controller (14), exchanger (17), DCDC (20), high (22), heat (23), and temperature (25). The technologies listed as low technology are conversion (1), aircraft (2), converter (3), compressor (4), valve (5), oxygen (6), tank (7), cooling (9), and drive (10).
The technical level of vacuum technology derived from the analysis of the paper was classified into three levels: high, medium, and low. In the patent data, the technologies with high vacuum technology levels are pressure (6), engine (8), load (9), cycle (11), air (12), flow (13), supply (18), carbon (19), density (20), algorithm (22), and effect (31), and the technologies with intermediate technology levels are railway (1), PEMFC (2), stack (3), locomotive (4), temperature (5), voltage (7), catalytic (10), water (14), optimal (16), bus (21), proton (23), rate (24), safety (25), exchange (26), cathode (35), and diffusion (41). The technologies that came out with a low level of technology are converter (15), PEM (17), controller (27), reaction (28), electrolyte (29), DCDC (30), oxygen (32), durability (33), polymer (34), anode (36), electrochemical (37), surface (38), layer (39), and electrode (40).
4.3. Derive Promising Technology for Hydrogen Fuel Cell-Based Transport
We tried to clarify promising technologies through SNA analysis of vacuum technology keywords. We derived technologies with high correlation by analyzing the network between vacuum technology keywords.
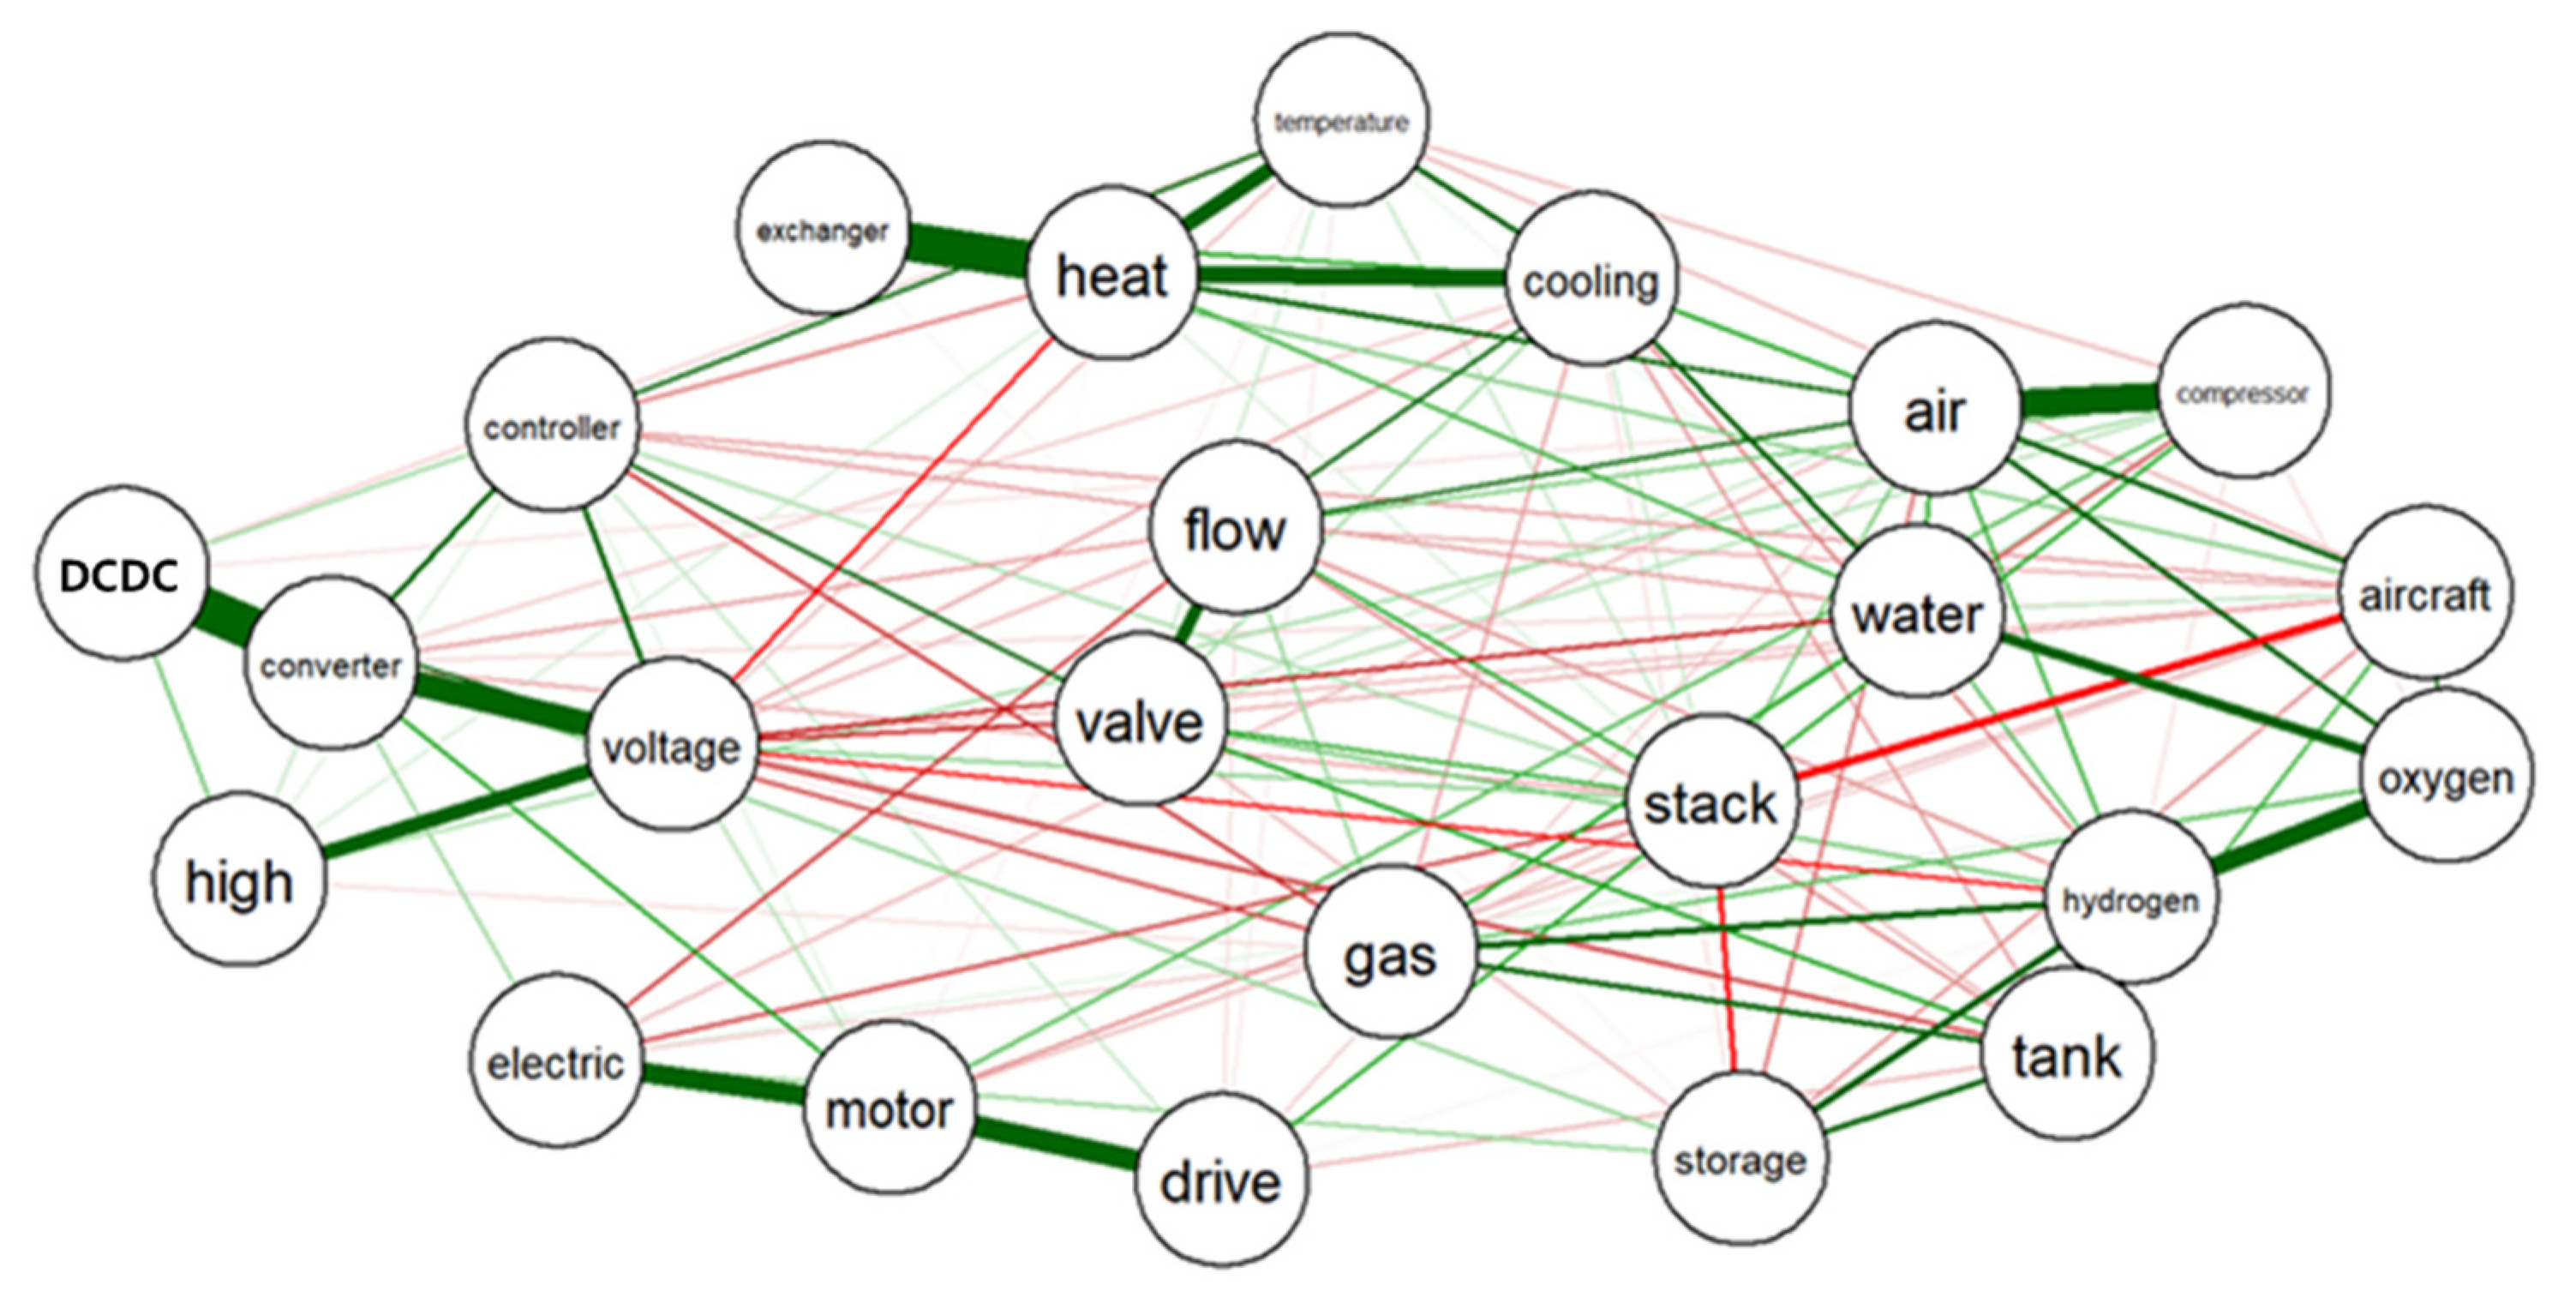
Figure 11 shows the results of SNA of vacuum technology keywords identified in patents. SNA analysis results: (1) valve, flow, gas; (2) air, compressor, water; (3) stack, aircraft, storage; (4) DCDC, converter, voltage, high; (5) heat, cooling, exchanger; and (6) vacuum technology keywords such as storage, tank, and hydrogen were identified as highly correlated technologies.
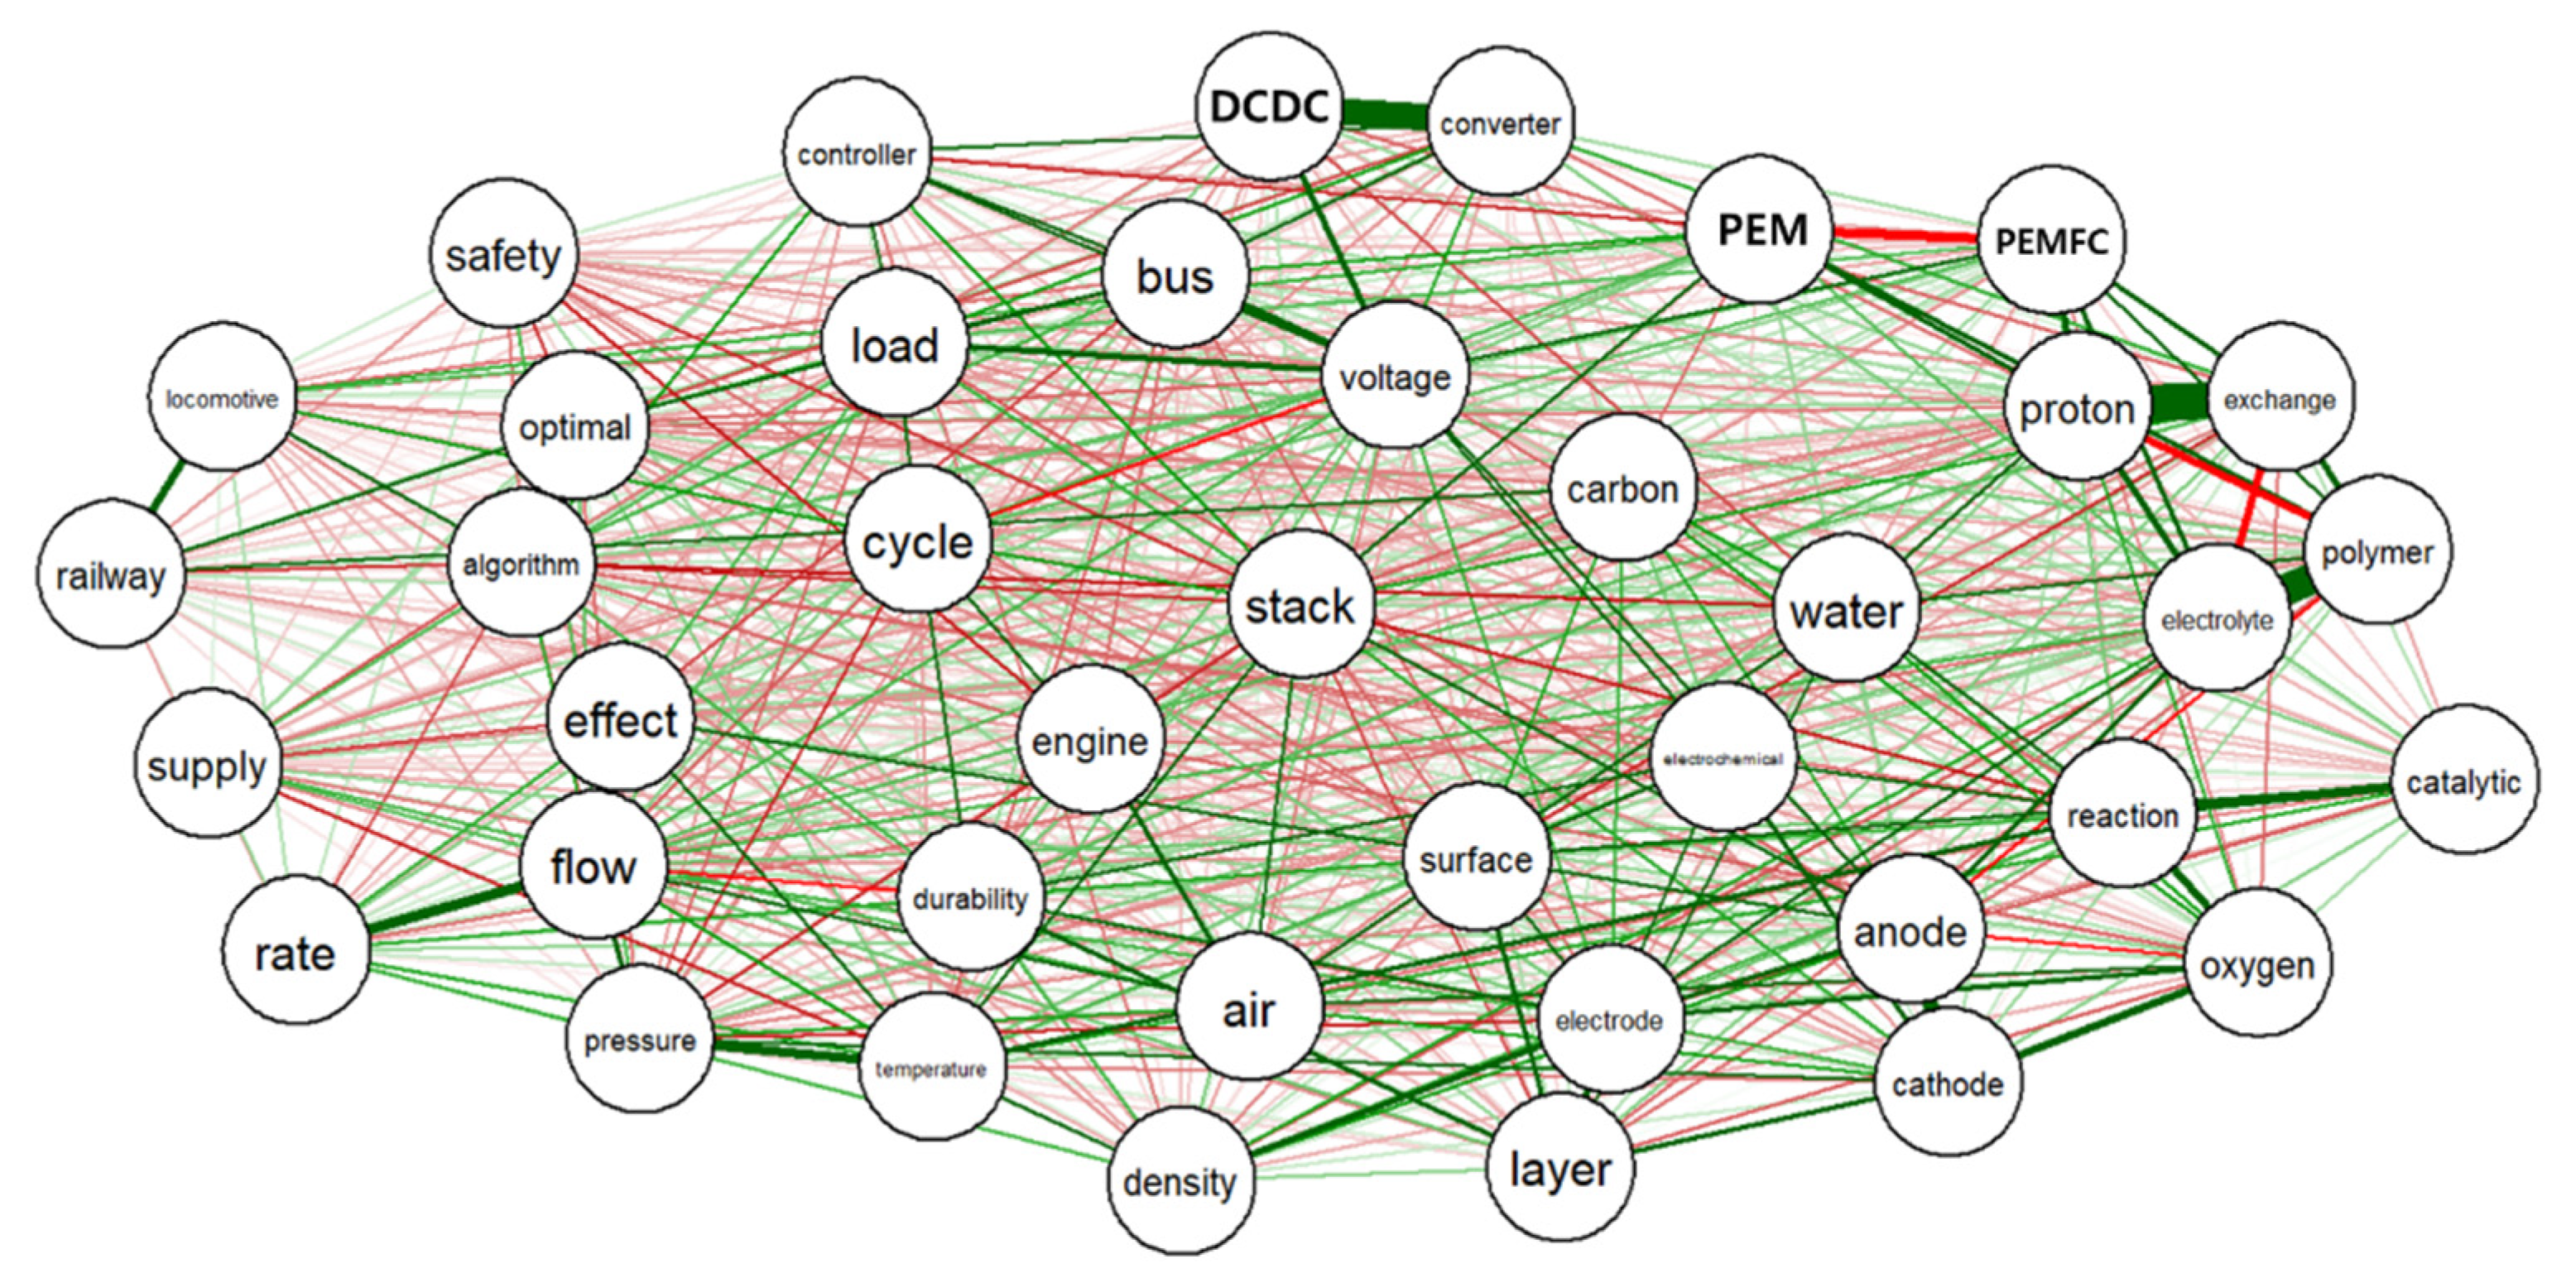
Figure 12 shows the results of SNA in patent data. SNA analysis results: (1) DCDC, converter, voltage; (2) proton exchange membrane FC; (3) catalytic, reaction, oxygen; (4) flow, rate; (5) density, electrode; and (6) railway, locomotive, optimal, and vacuum technology keywords such as algorithm were identified as highly correlated technologies.
We applied several methods to discover promising technologies for hydrogen fuel cell-based transportation technology. First, to discover the vacuum area, a GTM map was created. To overcome the limitation of the patent blind period, this process was executed in parallel with each of the patent and paper DB. As a result, 10 vacuum areas were detected in the patent, and 5 vacuum areas were detected through paper analysis. To derive the description of this vacuum area, inverse mapping was performed. Through this process, technology keywords in the vacuum area were derived. Second, technology level analysis was added to understand the potential of the vacuum region. Future prospects were identified using the technology level map. The technology level was classified in the order of high, middle, low. Finally, to refine the promising vacuum technology, we analyzed the relationship between the technologies using keyword network analysis. Finally, two promising technologies were discovered in the patent analysis: (1) hydrogen tank and (2) DCDC converter. Five technologies were identified as promising technologies through paper analysis: (1) DCDC converter, (2) proton exchange membrane, (3) GDL, (4) catalyst technology, and (5) hydrogen railway/locomotive.
5. Conclusions
In this study, we tried to predict future promising technologies for hydrogen fuel cell-based transportation. The purpose of this study was to derive promising technologies for the transport of hydrogen fuel cells, thereby supporting the development of research and development policy and presenting directions for investment. Hydrogen energy, as the core of carbon neutral and green energy, is a major issue in changing the future industrial structure and national competitive advantage. In this study, we derived promising technology at the core of future hydrogen fuel cell transportation using the published US patent and paper DB. We first performed text mining and data preprocessing and then discovered vacuum technologies through GTM analysis. We also analyzed the vacuum technology keywords and SNA. By this process, two promising technologies were derived from the patent DB analysis, and five were derived from the paper DB analysis. Promising technologies discovered by patent analysis are (1) hydrogen tank and (2) DCDC converter technology. Promising technologies discovered in the paper analysis are (1) DCDC converter, (2) proton exchange membrane, (3) GDL, (4) catalyst technology, and (5) hydrogen railway/locomotive.
To evaluate the data analysis results analyzed in this study, we compared them with future technology roadmaps for hydrogen fuel cells developed in the US, Japan, and the EU. For the development of hydrogen fuel cell technology, research related to the technology is being conducted in many countries around the world, and promising future technologies related to technology development and roadmaps are being developed [
11,
12,
13]. As shown in
Table 5, the roadmap in the United States and the like and the results of this study predict similar promising technologies as those with high development potential. The technology predicted to be developed by the US Department of Energy (DOE) and the promising technology predicted in our study were analyzed to be similar to stack technology, PEM, and catalyst. The technical topics of stack technology, hydrogen tank, cooling technology, and PEM were analyzed to be similar to that of METI (Ministry of Economy, Trade, and Industry) research in Japan, and the topics of the hydrogen tank, cooling control system, GDL, and the locomotive was similar in the EU.
The research results obtained in this study can be applied to hydrogen locomotive technology development. Research on liquid hydrogen locomotives is underway, and hydrogen storage tank technology is expected to be studied as a core technology for liquid hydrogen locomotive technology. Based on the results obtained through research, a strategy was developed to identify blank technologies in each field and to avoid unnecessary patent dispute. As such, the results of this study are very valuable and useful in analyzing patents and paper DB to discover promising technologies in the field of hydrogen fuel cell transportation systems. In addition, the hydrogen fuel cell system can be applied to various transportation systems. The results of this study are expected to be widely used in follow-up studies to support decision-making by policymakers within the transportation industry and to apply environmentally friendly hydrogen fuel cells not only to locomotives but also to other mobility of transportation such as airplanes, buses, and automobiles. In particular, we are sure that it will greatly contribute to establishing a core technology development strategy for the development of an eco-friendly transportation system to minimize climate change.
Developing a technology roadmap requires a large amount of information. It develops a technology roadmap by integrating interviews with experts in related fields and information analysis. This study made it possible to derive research results similar to the technology development roadmap through data analysis of patents and papers. By applying patent and paper analysis, it suggests that a lot of time and money invested in developing a technology roadmap can be reduced. Our method of discovering promising technologies cannot completely replace the methods of technology prediction by experts. However, when developing a technology strategy, promising technologies derived through objective and scientific methods provide very useful information. To establish a technology strategy and make a technology roadmap, a lot of time and money is required, and a lot of manpower must be put into it. With our method and procedures, even a person who is not an expert or specialist can carry out the analysis of vacuum technologies. Application of these methods and results will reduce resource input when creating technology strategies. This can be used to establish a technology development direction, set an investment direction, and establish a technology roadmap. This study is expected to present future development possibilities and application expansion. The patent publication period is an essential limitation of the patent DB. In this study, paper analysis aimed to overcome this problem, but analysis linkage with other data may also be attempted. In addition, as more research to identify the relationship between technology development is conducted, the results of this study will be used as more accurate data.


 ,
, 


