Abstract
The Brazilian government intends to complete the paving of the BR-319 highway, which connects Porto Velho in the deforestation arc region with Manaus in the middle of the Amazon Forest. This paving is being planned despite environmental legislation, and there is concern that its effectiveness will cause additional deforestation, threatening large portions of forest, conservation units (CUs), and indigenous lands (ILs) in the surrounding areas. In this study, we evaluated environmental degradation along the BR-319 highway from 2008 to 2020 and verified whether highway maintenance has contributed to deforestation. For this purpose, we created a 20 km buffer adjacent to the BR-319 highway and evaluated variables extracted from remote sensing information between 2008 and 2020. Fire foci, burned areas, and rainfall data were used to calculate a drought index using statistical tests for a time series. Furthermore, these were related to data on deforestation, CUs, and ILs using principal component analysis and Pearson’s correlation. Our results showed that 743 km2 of forest was deforested during the period evaluated, most of which occurred in the last four years. A total of 16,472 fire foci were identified. Both deforestation and fire foci occurred mainly outside the CUs and ILs. The most affected areas were close to capital cities, and after resuming road maintenance in 2015, deforestation increased outside the capital cities. Current government policy for Amazon occupation promotes deforestation and will compromise Brazil’s climate goals of reducing greenhouse gas (GHG) emissions and deforestation.
1. Introduction
At the beginning of the 26th UN Conference on Climate Change (COP 26), Brazil surprisingly changed its discourse on climate change, which was initially one of denial, just before the upcoming presidential elections, promising to eliminate illegal deforestation by 2028 and reach carbon neutrality by 2050. At the same time it announced these ambitious climate targets, the country was witnessing an escalation in Amazon occupation. These include paving existing roads [], planning new roads [], the construction and planning of hydropower plants [,], a proposal to allow sugarcane planting [], and the legalization of economic activities in indigenous territories [], in addition to recent increases in deforestation [] and commitment to environmental monitoring [,]. These factors, particularly road development [,], are vectors for deforestation and inexorably associated with forest fires, whose greenhouse gas emissions, such as carbon dioxide (CO2), can compromise the climate goals set by Brazil.
In this study, we evaluated the impact of the BR-319 highway, which we call the “new Transamazonian highway”. It connects the region known as the “arc of deforestation” with the center of the Brazilian Amazon, which contains portions of still intact forest, indigenous lands (ILs), and conservation units (CUs). The Alvaro Maia highway, also known as BR-319, begins in the municipality of Manaus, the capital of the state of Amazonas, and ends in Porto Velho, the capital of the state of Rondônia []. It was inaugurated in 1976 and was approximately 885 km long. It is currently the only route connecting the states of Amazonas and Roraima to Rondônia, and consequently to the rest of Brazil []. It was originally built as part of a general effort by the Brazilian government to develop the Amazon. Unlike other Amazonian roads that were unpaved, it was initially paved. A lack of maintenance and weather effects soon compromised the asphalt overlay, resulting in a rutted road that was impassable during the rainy season, culminating in its closure in 1988 []. In its southern and northern portions, parts of the highway have been reconstructed and paved, but repairing the central portion was suspended until April 2015. This 406 km portion, called the “Middle section,” is located between km 250 and 656 and had its construction halted by a court order for not being compliant with requirements presented in environmental impact studies []. In 2020, however, the Brazilian government, turning a blind eye to the court decision and opened a bidding process for the reconstruction of “Lot C” (km 198 to 250) of the road, while an environmental study for the “Middle section” was submitted to the environmental agency and is awaiting approval [].
Despite not approving the environmental studies, a road “maintenance” program began in 2015 (without paving) [], which allowed transit most of the year and substantially impacted the surrounding environment [,]. An evaluation between 1988 and 2000 showed that, along the BR-319 highway, 89,328 ha of land was deforested within the 40 km buffer, and 300,116 ha was deforested within a 150 km buffer []. Along the highway route, illegal land occupation occurs on 40 CUs, 6 million ha of public lands, and 50 ILs, and more than 18,000 indigenous people’s rights are being violated within the 150 km limit. None of these indigenous communities have been contacted, and only five ILs are required to be consulted by the Brazilian federal government through the National Department of Infrastructure and Transports (DNIT)—the department responsible for the highway construction [].
An efficient tool to assess environmental degradation in tropical forests is remote sensing, which can be used to identify deforestation [,] and measure greenhouse gas emissions, contributing to our understanding of global warming []. This study hypothesized that BR-319 is directly related to an increase in deforestation in the Amazon. Thus, we collected data for variables using remote sensing over a 13-year period to investigate whether the “maintenance” of the highway since 2015 contributed to deforestation and forest fires in ILs and UCs along the highway.
2. Materials and Methods
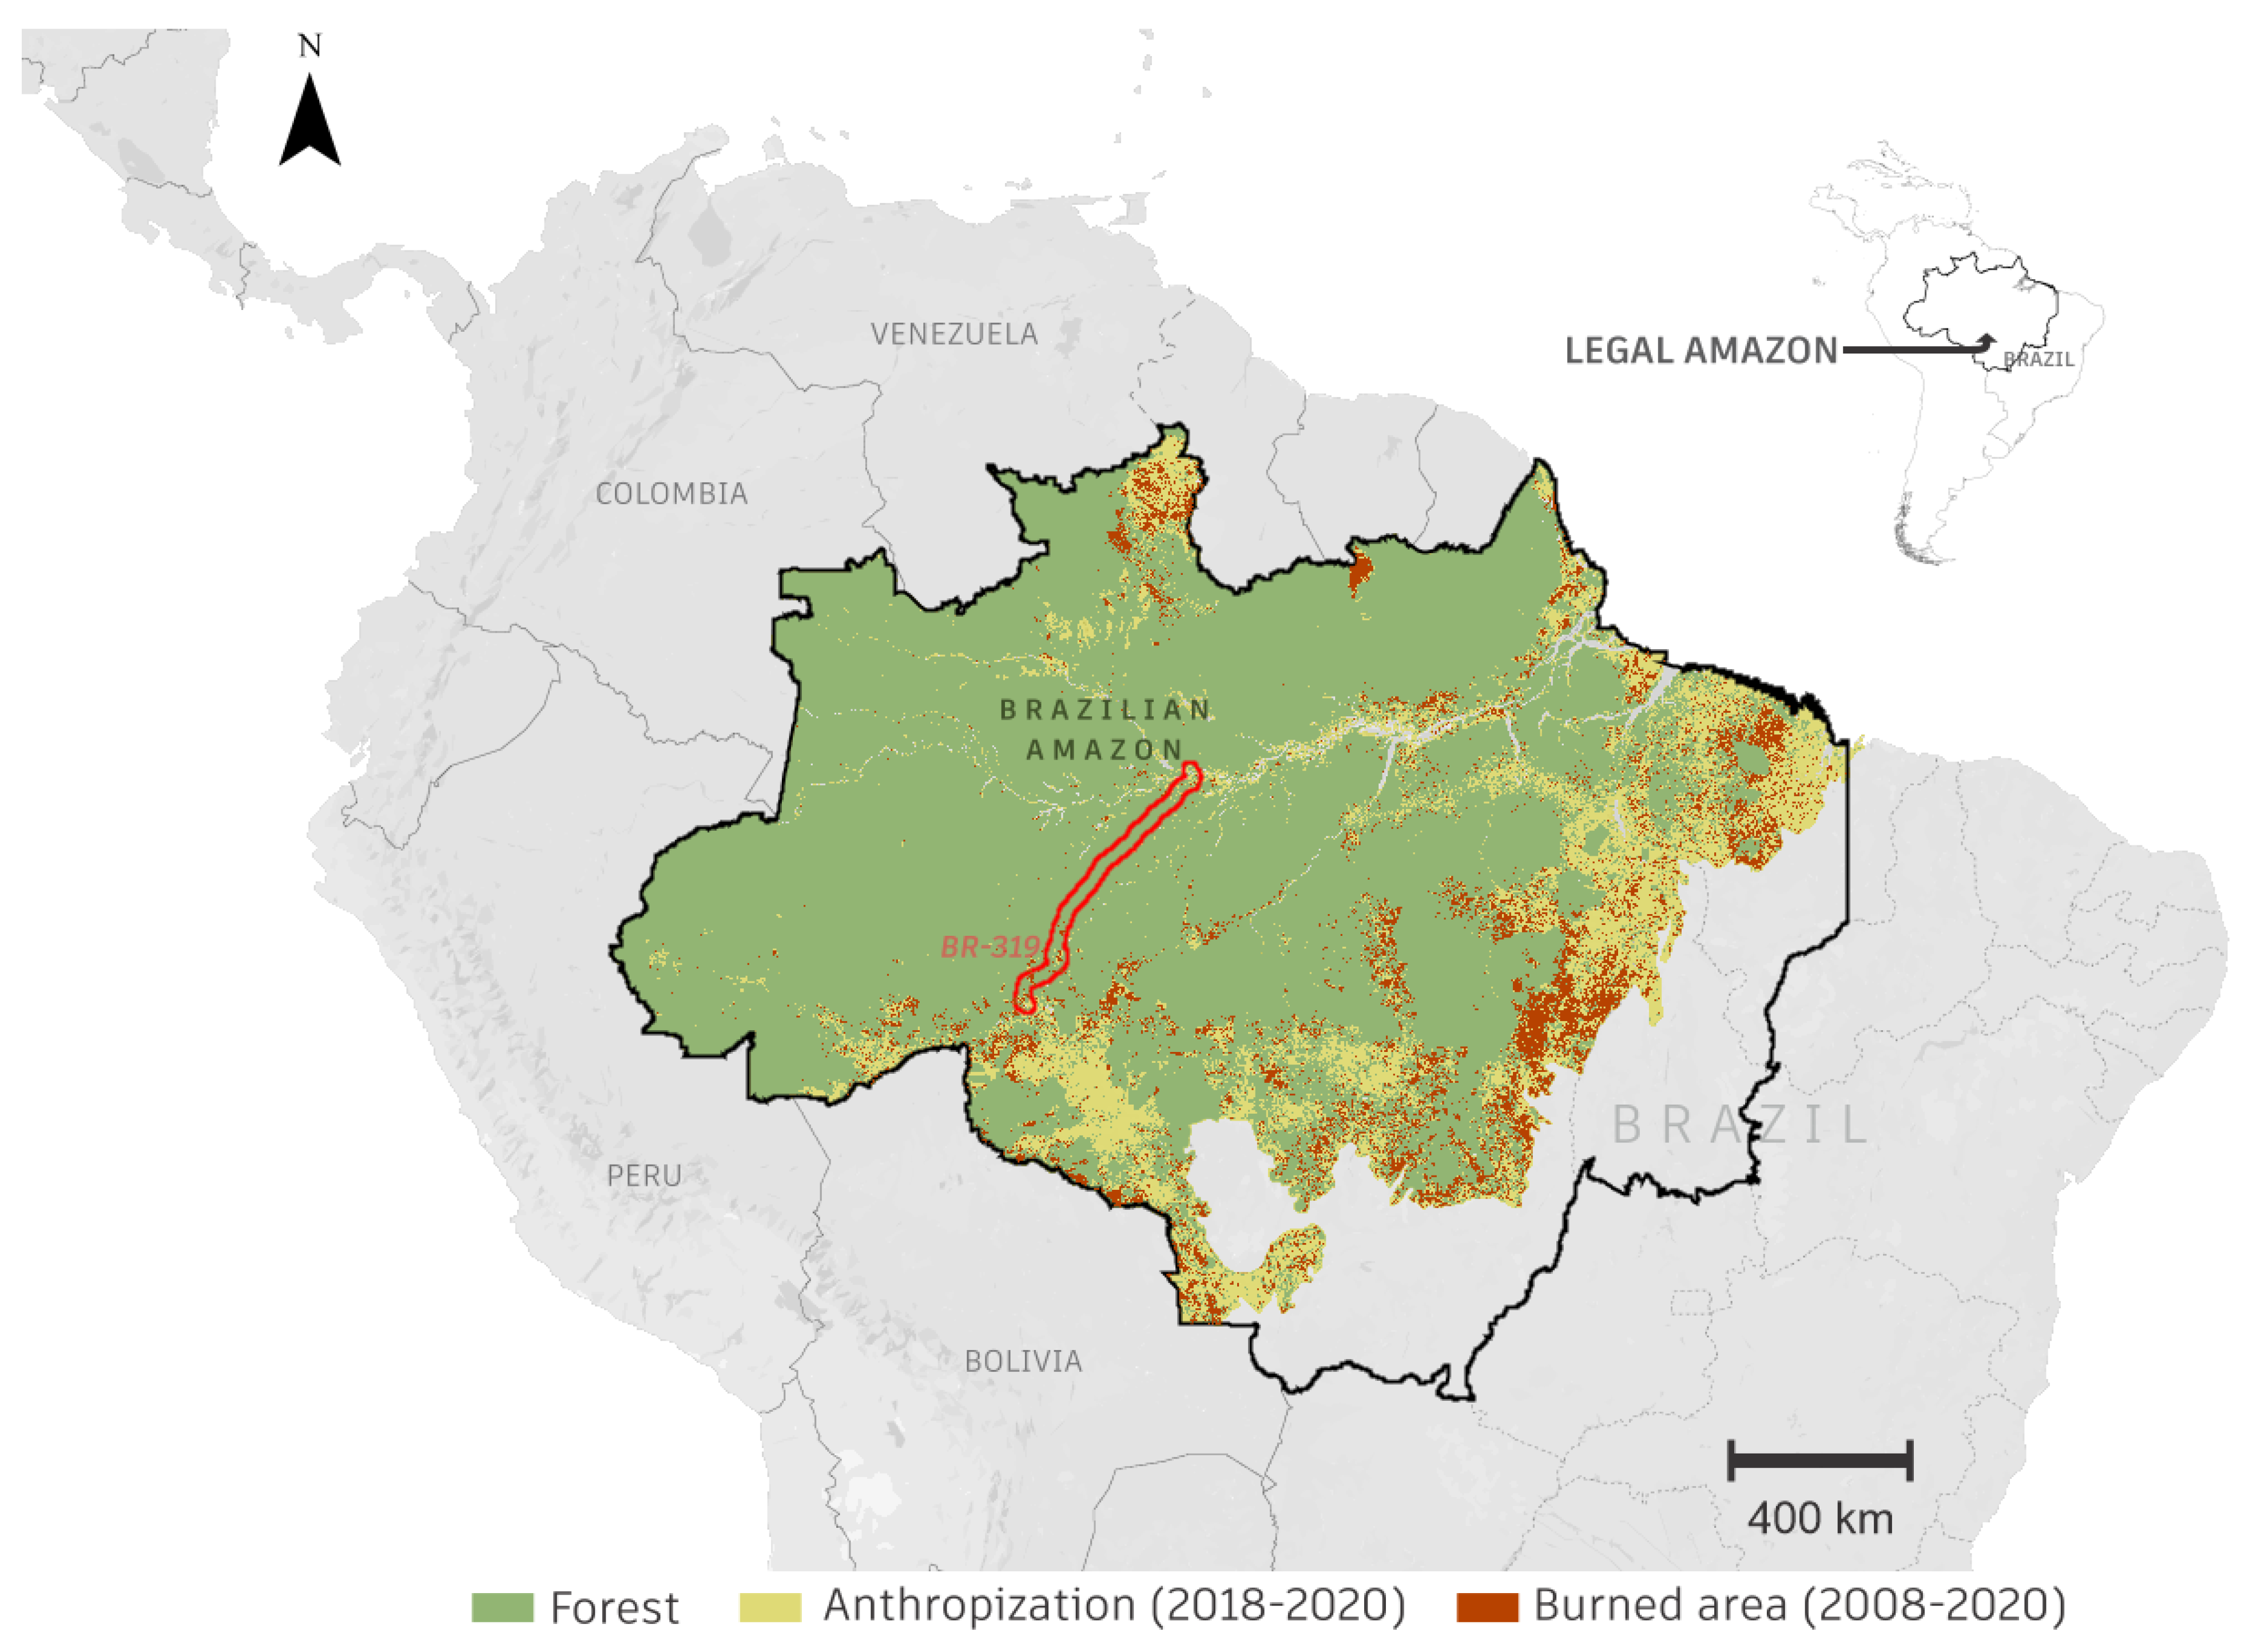
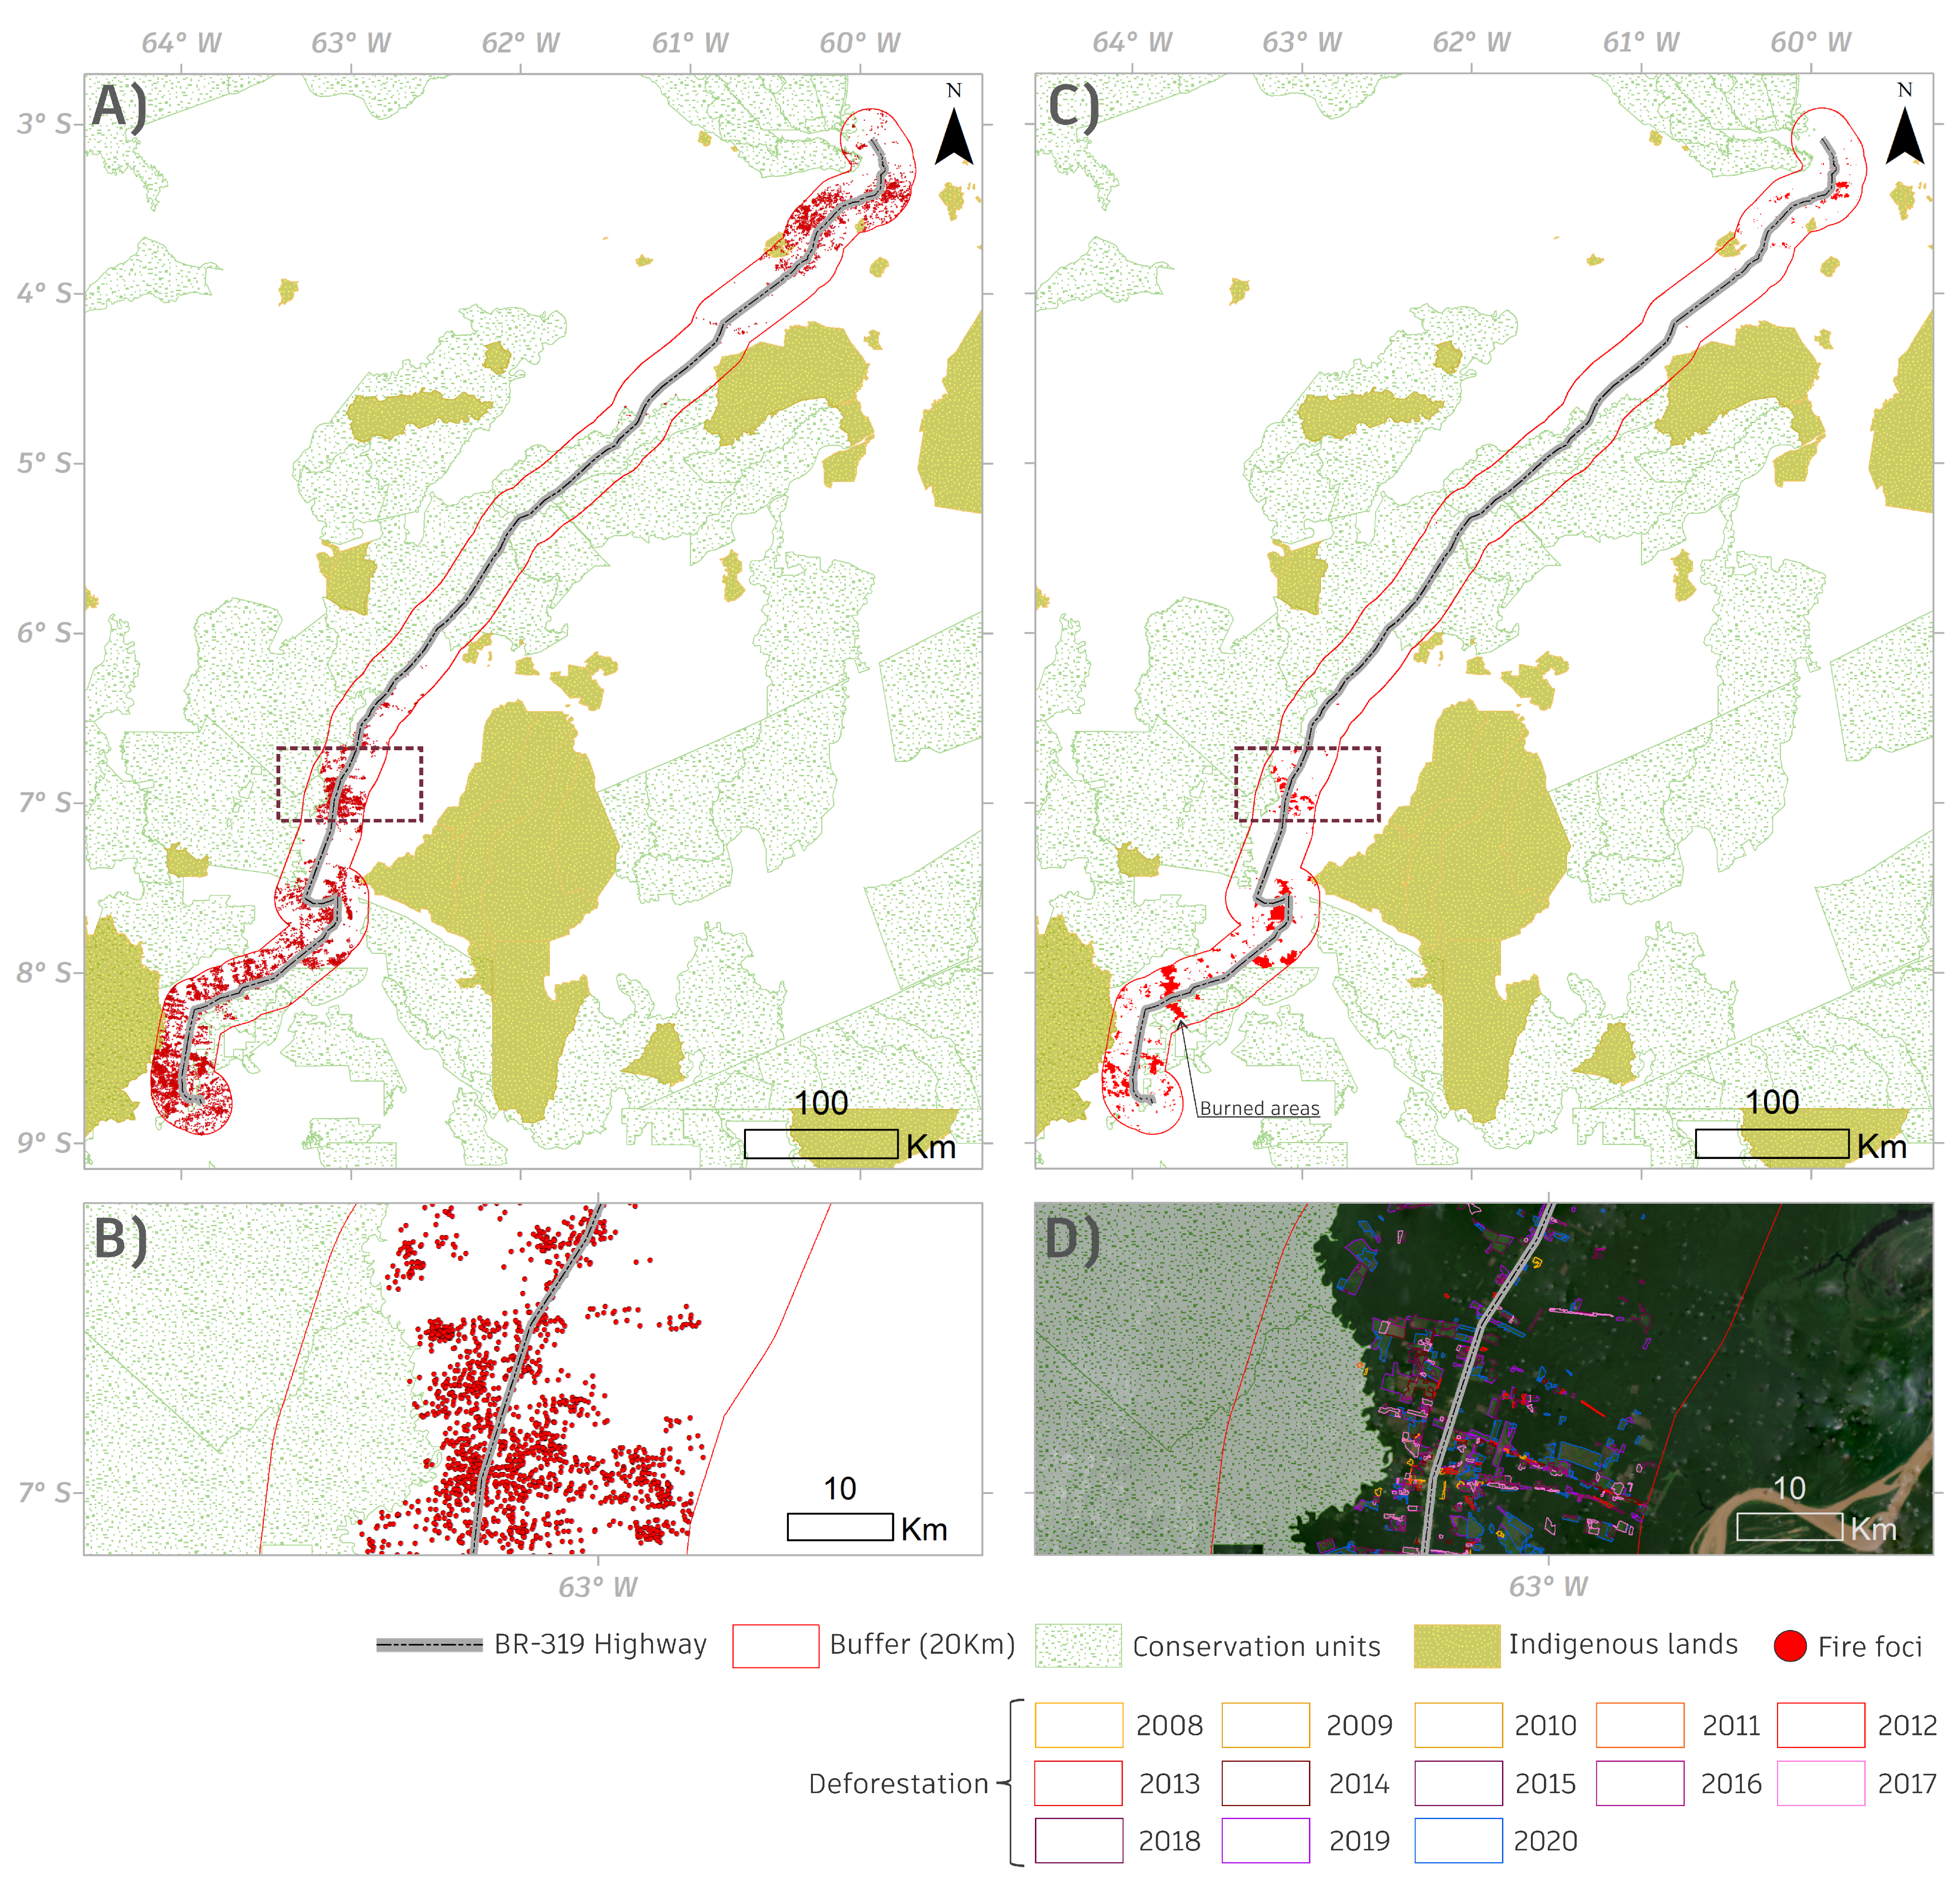
2.1. Study Area
The study was conducted along BR-319, officially known as Rodovia Álvaro Maia or Rodovia Manaus-Porto Velho, an 885 km-long highway (Figure 1). In Amazonas, the highway begins in the capital city of Manaus and passes through the municipalities of Careiro da Várzea, Careiro, Manaquiri, Borba, Beruri, Manicoré, Tapauá, Humaitá, and Canutama. It ends in the capital city of Porto Velho, the only municipality within the State of Rondônia. BR-319 was built in the Amazon biome [,], and a 20 km buffer was considered, resulting in a total area of 35,697.52 km2 (Figure 1). More than 2500 tree species (one-third of the world’s tropical wood) and 30,000 plant species grow in the Amazon biome []. According to the Köppen classification, updated by Alvares et al. [], the climate type is “A” and is categorized into four main sub-climates: tropical monsoon (“Am”), dry and humid tropical (“Aw”), rainy equatorial (“Af”) and hot tropical and wet (“AS”).
Figure 1.
Study area comprising the extension of the Brazilian BR-319 highway (with a 20 km buffer) in the Amazon biome.
Forest and anthropization are presented in the previous figure using a methodology developed by Souza Jr et al. [] based on the normalized difference fraction index (NDFI). The NDFI values range from −1 to 1, with high values (close to 1) indicating intact forest. This is due to the combination of a high pattern of healthy vegetation and low values of photosynthetically inactive vegetation and soil. The methodology for logged area data collection is presented in Section 2.3. We utilized data from the PRODES project [] for the calculation of deforestation along the buffer created between 2008 and 2020.
2.2. Fire Foci Analysis
Fire foci data were calculated using the Moderate Resolution Imaging Spectroradiometer (MODIS) sensor product MCD14DL (TERRA/AQUA). Near real-time (NRT) MODIS Thermal Anomalies/Fire locations—Collection 6 processed by NASA’s Land, Atmosphere NRT Capability for EOS (LANCE) Fire Information for Resource Management System (FIRMS), using swath products (MOD14/MYD14) rather than the tiled MOD14A1 and MYD14A1 products, was used to obtain solid data that are also used by the Brazilian program BDQueimadas []. The thermal anomalies/active fire represent the center of a 1 km pixel that is flagged by the MODIS MOD14/MYD14 fire and thermal anomaly algorithm [], which contains one or more fires within the pixel. This characteristic is the most basic fire product in which active fires and other thermal anomalies, such as volcanoes, are identified. Data were downloaded directly from FIRMS (https://firms.modaps.eosdis.nasa.gov/, accessed on 15 November 2021) and changed to shapefile format (https://earthdata.nasa.gov/active-fire-data, accessed on 15 November 2021). The FIRMS Fire Map allows users to interactively browse the full archive of global active fire detection from MODIS and VIIRS. NRT fire data are available within approximately 3 h of satellite overpass and imagery within 4–5 h. In this case, we used only processed data and excluded NRT data because the foci were calculated for the BR-319 buffer between 2008 and 2020 with MODIS data only.
2.3. Burned Area Analysis
The burned area data product from the combined Terra and Aqua satellites MCD64A1 Version 6 is a monthly 500-m grid product containing per-pixel burned area information. The burned area mapping approach employs surface reflectance imagery from MODIS []. A burn-sensitive vegetation index was calculated using MODIS time series data from shortwave infrared channels. Dynamic thresholds were then applied to guide the statistical characterization of burn- and non-burn-related changes. Finally, spatial and temporal active fire information was used to create regional probability density functions to classify each pixel as burned or unburned [].
The MCD64 burned area mapping approach employs MODIS imagery along with 1 km active MODIS fire observations. The hybrid algorithm applies dynamic thresholds to composite images generated from a burn-sensitive index, derived from MODIS shortwave infrared channels 5 and 7, and a temporal texture measure (Equation (1)).
where ρ5 and ρ7 are the atmospherically corrected surface reflectance in bands 5 and 7, respectively.
Mapping was used to identify the recording date of the satellite pass to the nearest record for individual grid cells. The date was then encoded into a single data layer of the astronomical day output. Burn output ranged between 1 and 366, and a value of 0 indicated “no burn” pixels and additional special values were reserved for missing data and water grid cells. For this purpose, mapping was performed along the entire length of BR-319, including a 20 km buffer, and calculated in km2 between 2008 and 2020. A cloud processing algorithm was adopted using Google Earth Engine (ImageCollection ID: MODIS/006/MCD64A1; see link in Supplementary Material).
2.4. Standardized Precipitation Index
The standardized precipitation index (SPI) [] seeks to quantify the rainfall deficit or excess at different time scales and was calculated on an annual scale (SPI-12) for the 20 km buffer along BR-319 from 1981 to 2020 to identify drought events in the historical time series. The SPI was calculated from the total accumulated rainfall records over 30 years, which was fitted to a probability distribution function and transformed into a normal probability distribution function. This set the average SPI value for a given location and period to zero.
To determine the SPI, we initially used the gamma distribution calculation, which was defined by the probability density function (PDF) given by Equation (2).
where α (>0; dimensionless) is the shape parameter, β (>0; mm) is the scale parameter, (>0; mm) is the total rainfall, and Г (α) is the Gamma function: .
All parameters and the gamma PDF were fitted to the frequency distribution of accumulated rainfall using remote sensing data at the mentioned scale. The gamma PDF parameters α and β estimated at the mentioned scale were calculated. The parameters α and β were estimated using the maximum likelihood method (MLM), which is the most appropriate method [,]. Calculations of the α and β parameters were performed to determine the cumulative probability of an observed rainfall event for the adopted scale.
The cumulative probability is given by Equation (3).
From the resulting annual SPI values for the buffer, the wet and dry periods were classified accordingly: extremely wet (≥2.00), very wet (1.5 to 1.99), moderately wet (1.00 to 1.49), approximately normal (0.99 to −0.99), moderately dry (−1.00 to −1.49), very dry (−1.50 to −1.99), and extremely dry (≤−2.00) [].
For this purpose, a Climate Hazards Group InfraRed Precipitation with Station data (CHIRPS) dataset developed by the U.S. Geological Survey (USGS) and the Climate Hazards Group at the University of California, Santa Barbara, was used. It combines pentadal precipitation climatology, near-global geostationary TIR satellite observations of the CPC and the National Climatic Data Center (NCDC) [], precipitation fields from the atmospheric model of the NOAA Climate Forecast System (CFSv2) [], and in situ rainfall observations []. In the first step of this study, these resources were used because of the lack of temporal data from in situ stations along the BR-319 and because they are available from 1981 to the present. Their spatial resolution is 0.05° (±5.3 km) and is provided in monthly, pentadal, and decadal temporal resolution for the entire globe [].
2.5. Statistical Analyses
2.5.1. Mann–Kendall and Pettitt Tests
The Mann–Kendall test was used to verify trends in the timeframe under study (2008–2020) for each variable [,]. Then, the Pettitt test was applied to identify change points in the time series when shown as significant in the Mann–Kendall test. For both tests, a 5% significance level was employed.
The Mann–Kendall test is calculated as follows (Equation (4)):
where is the Z-index of the Mann–Kendall test, S is the “score” statistic, and Var(S) is the variance of the S statistic.
The Pettitt test is obtained as follows (Equation (5)):
The change point is t at which the maximum k(t) occurs. The critical values of K are obtained as follows (Equation (6)):
2.5.2. Principal Components Analysis
Data were subjected to principal component analysis (PCA) to assess the relationship between the variables and the years studied. PCA is a multivariate statistical analysis that transforms an original dataset (, , …, ) into another dataset of the same dimensions (, , …, principal components), reducing data mass with minimum information loss (Equation (7)). The principal components are derived from the linear combination of the original variables, which are independent of each other and retain the maximum amount of information [].
where , , …, are the eigenvectors of the correlation matrix between variables.
2.5.3. Pearson’s Correlation
Pearson’s correlation coefficients were estimated to verify the interdependence between the analyzed variables. A correlation heatmap was used to graphically express results. Positive correlations are expressed in blue, and negative correlations are expressed in red (Equation (8)).
where , , …, and , , …, are the measured values of both variables and and are the arithmetic averages of the variables.
The free software Rbio was used to process the Mann–Kendall and Pettitt tests []. PCA and correlation analyses were performed using R software [].
3. Results
There were 16,472 fires recorded near the BR-319 highway during the period of study. In 2010, 10.97% of the fires (1807) occurred, followed by 2015 with 12.20% (2010), and 2020 with 11.32% (1865). Of all the fires analyzed, 832 occurred in CUs, 44 in ILs, and 2,888 in forested areas. The size of the accumulated deforested area in the study region is 743 km2. Of this total, the largest area of deforestation occurred in 2020, 149 km2 (20.05%). The total burned area during the evaluation period was 3597 km2. The study results show that areas were affected by fires each year near BR-319, especially in 2015 (542 km2). However, deforestation and fire foci in deforestation were the only significant variables according to the Mann–Kendall test and were shown to increase during the years of study. According to the Pettitt test, none of the variables showed significance, and no point of change was detected along the time series (Table 1).
Table 1.
Quantification of variables deforestation (km2), fire foci in deforestation (count), burned area (km2), fire foci (count), fire foci in conservation units, fire foci in indigenous lands and SPI and Mann–Kendall and Pettit tests of the 2008–2020 time series.
Figure 2 highlights the burned areas, fires, and deforestation between 2008 and 2020 along the BR-319 highway. The image shows a high concentration of fires around the highway, mainly outside CUs and ILs, but these areas were also affected in smaller proportions, especially in the extreme north and south (Figure 2A,B). There was a larger clustering of burned areas in fragments where a high concentration of fire foci predominated, located in the municipality of Humaitá, AM (Figure 2B,C). This indicates an advancement in deforestation in areas near the CUs in the south–north direction of the highway (Figure 2D). Deforestation over the 13-year-long study period has been present in the surrounding area along the highway. It was shown to progress annually, with the highest incidence in 2020.
Figure 2.
(A) Fire foci along the entire highway; (B) fires in one stretch of the highway; (C) burned areas; (D) deforestation years inserted in the BR-319 buffer with PlanetScope base map (April 2021).
As shown in Figure 3A,B, fires predominated in deforested areas, CUs, and ILs. Of the analyzed fires, 17.53% occurred in deforested areas and were located near roads and urban areas. Of note, the fires occurring in CUs and ILs were recorded mainly in regions near the capital cities of Porto Velho-RO and Manaus-AM. In Figure 3D, it is shown that most deforestation that occurred in the study area was near the BR-319 highway, a process that occurred because of highway road network expansion.
Figure 3.
(A,B) Fire foci within deforested areas, conservation units (CUs) and indigenous lands (ILs) inserted into the BR-319 buffer (beginning of the BR in the region of Porto Velho, Rondônia); (C) PlanetScope base map (April 2021); (D) deforestation over the years studied.
Positive SPI values indicate above-average rainfall, while negative values indicate below-average rainfall [,,]. It is shown in Figure 4 that from June to September were critical periods with minimal rainfall throughout the study period. Similarly, December to April experienced significant rainfall as compared to other months, except for the years 2010 and 2011, when there was less rainfall in the first half than in the other years. The months of May, October, and November represented the average rainfall at the site. Likewise, when comparing the annual SPI values, negative values were observed in almost all years, except for 2013, 2017, and 2019 (Table 1), which indicates a reduction in the average annual rainfall over the years.
Figure 4.
Standardized Precipitation Index (SPI) applied to the 20km BR-319 buffer using CHIRPS Pentad (Climate Hazards Group InfraRed Precipitation) data at 0.05° spatial resolution.
The sum of the first two components in the PCA analysis explained 78% of the total variation in the data, and as the sum was greater than 70% it was considered adequate [] (Figure 5A). It can be observed that the deforestation and fire foci in deforestation vectors were close for the years 2008, 2018, 2019, and 2020. This suggests a significant variable contribution and that these years reached a higher index for both variables (Table 1). Moreover, these variables contrasted with the fire foci, burned areas, and fire foci variables in ILs and CUs. This indicates a lower tendency of fire foci and burning in areas with high rainfall. The fire foci vectors in ILs and CUs were close in the years 2010, 2012, and 2015—periods of higher incidence for these variables (Table 1).
Figure 5.
(A) Principal component analysis for the years 2008–2020 according to the following variables: deforestation (km2), fire foci in deforestation (count), burned area (km2), fire foci (count), fire foci in conservation units (CUs), fire foci in indigenous lands (ILs), and SPI; (B) Pearson’s correlation among these variables, where positive correlations are expressed in blue and negative correlations are expressed in red.
Correlations between 0.2 and 0.5 can be considered weak; those from 0.5 to 0.7 have a strong correlation; and those above 0.7 have a very strong correlation []. It is possible to observe a strong and positive correlation of 0.8 between fire foci and burned areas, which means that the increase in one influences the increase in another. This is also observed between the burned areas and fire foci in ILs (a strong and positive correlation of 0.7). A strong and negative correlation was observed between fire foci in the CUs and there was an SPI with a magnitude of 0.6.
4. Discussion
Government-approved or illegal roads developed in the Amazon have often been at the forefront of deforestation [,]. This is demonstrated by the BR-319 highway, which has coincided with an increase in deforestation in the surrounding areas. In just 13 years, 743 km2 of the forest was cleared. From 2009 to 2016, deforestation remained below the average of 57.15 km2 per year. At the beginning of the study period, in 2008, the deforested area exceeded the interstitial average. Overall, 42% of the forest area in the study region was deforested by 2016. Approximately 58% of the deforestation occurred between 2017 and 2020. This was concentrated mainly in 2019 and 2020 and is approximately 2.2 and 2.6 times larger than the overall average, respectively. This result is due to two factors. First, the “maintenance” of the highway after 2015, which facilitated its access, and second, the Brazilian government’s campaign promises to occupy the region and the commitment of providing enforcement agencies [,]. One factor to highlight is the importance of protected areas in avoiding deforestation [,,]. More than 95% of deforestation occurred in unprotected areas, while in CUs, this rate was 4.3% and in ILs only 0.3%.
We counted 16,472 fire foci. Of these, 2888 (17.5%) occurred in areas that had been deforested, 832 (5%) in CUs, and only 44 (0.2%) in Lis. This demonstrates the role that protected areas play in mitigating deforestation and fires. The remaining fire foci focused on areas that had already been anthropized since fire is the least expensive way to clear areas and is widely practiced by Amazonian farmers. The average number of fire foci remained high and without statistical significance in all years. It did not vary even in periods of extreme drought or periods of higher rainfall, thus attesting to human interference in the environment. According to the classification determined by Oliveira-Júnior et al. [], the SPI values in 2009, 2014, 2016, and 2017 were considered normal. For the positive SPI values, 2013 was a year of high rainfall, and 2019 was a year of severe rainfall. As for the negative SPI values, 2008 and 2018 were considered moderate and severe drought years, respectively, while 2010, 2011, 2012, 2015, and 2020 were extreme drought years (Table 1). However, the results of the Mann–Kendall test [,] presented only 70% assertiveness, which could be explained by the absence of fire foci in the ILs even with extreme drought, for example, for the years 2011 and 2020. It was clear that the critical SPI values in 2010 (−4.39) and 2015 (−4.86) were also the highest for burned areas, foci of fire, foci of fire in CUs, and ILs of 487 km2, 1807, 157, and 6 for the year 2010, and 542 km2, 2010, 129, and 6 for the year 2015, respectively. The critical SPI values observed in 2010 and 2015 matched the highest values for burned areas, fire foci, and fire foci in CUs and LIs, possibly explained by the El Niño climate pattern [,].
The Amazon is a Brazilian biome with the largest amount of greenhouse gas (GHG) emissions that compromise the climate agreements signed by Brazil []. As long as the Brazilian government does not establish a strong national policy to combat deforestation and fire foci throughout its territory, and especially in the Amazon, Brazil will never achieve its assumed climate goals. BR-319 is a duality of the government. The government announced ambitious targets at COP 26; however, it provides opportunity for Amazonia occupation. A disorderly occupation has serious environmental consequences, such as loss of biodiversity and detrimental GHG emissions. Regarding these emissions, the PCA analysis showed the proximity of the deforestation and fire foci in deforestation variables in 2008. This fact can be explained by the re-opening of the BR-319 highway in 2007, under the Lula government. In 2008, the Army began paving 190 km of road near the city of Humaitá, and another 215 km further north, leading to Manaus, which subsequently caused increased deforestation and fire foci. Due to the lack of an environmental license, BR-319 was again abandoned, which explains the decrease in deforestation and fires in subsequent years. The years 2009, 2011, 2013, 2014, and 2016 showed no relationship with any variables, which indicates that fire outbreaks and deforestation were lower for these years. Again, this is most likely attributed to the abandonment of the BR-319, mainly at 250 and 655 km, called the “Middle stretch.” The proximity of the variables deforestation and fire foci in deforestation between 2019 and 2020 can be explained by the new environmental policies of the Brazilian government, coupled with the “maintenance” of the highway after 2015.
In situ studies should be pursued in the future to analyze the occupations and land uses in certain highway sections. These data can then be extrapolated with orbital images. In addition, it is necessary to compare specific paved and unpaved areas in relation to environmental impacts, such as fires, loss of native vegetation cover, and the characteristics of regional occupation impacts.
5. Conclusions
BR-319 is already a vector of deforestation and occupation of Amazonia without being completely paved. Deforestation has been consistent during the mandate of various governments, but 2019 and 2020 revealed significant increases. The highest deforestation and fire foci were observed near the capital cities of Manaus and Porto Velho, particularly following resumed road paving at its northern and southern extremes. Its intermediate section experienced a rapid increase in deforestation after a government plan to repair the road in 2015, but without paving it. CUs and ILs have proven effective in controlling the advancement of deforestation, although 4.3% of deforestation occurred illegally in the CUs, as shown in our study. Regardless of severe droughts or high rainfall, there was a change in the use and occupation of the soil, evidencing anthropic action along the highway. Deforestation and GHG emissions resulting from fire foci in 2019 and 2020 characterize the regional occupation policy intended by the Brazilian government, which greatly contradicts promises made in the climate agreements at COP 26.
Supplementary Materials
The following are available online at https://gaaf.users.earthengine.app/view/transamazonianbr-319.
Author Contributions
Conceptualization, M.L., C.A.d.S.J. and P.E.T.; methodology, C.A.d.S.J., M.L., F.S.R., P.E.T. and D.C.S.; formal analysis, I.C.M.J., P.M.C.d.C., P.P.G.d.O. and R.P.d.A.; investigation, C.A.d.S.J., M.L., R.d.S.S., U.d.F.M. and V.d.S.; writing—original draft preparation, M.L. C.A.d.S.J., D.C.S., I.C.M.J. and J.A.A.d.S.; writing—review and editing, R.C.D., P.E.T., L.P.R.T. and F.S.R.; supervision, M.L., C.A.d.S.J., R.C.D., L.P.R.T. and P.E.T. All authors have read and agreed to the published version of the manuscript.
Funding
This research received no external funding.
Institutional Review Board Statement
Not applicable.
Informed Consent Statement
Not applicable.
Data Availability Statement
The datasets used and/or analyzed during the current study are available from the corresponding author upon reasonable request.
Acknowledgments
This study was financed in part by the Coordenação de Aperfeiçoamento de Pessoal de Nível Superior—Brasil (CAPES)—Finance Code 001, National Council for Research and Development (CNPq).
Conflicts of Interest
The authors declare no conflict of interest. The funders had no role in the study design; in the collection, analyses, or interpretation of data; in the writing of the manuscript; or in the decision to publish the results.
References
- Fearnside, P.M. Brazil’s Cuiabá- Santarém (BR-163) Highway: The Environmental Cost of Paving a Soybean Corridor Through the Amazon. Environ. Manag. 2007, 39, 601. [Google Scholar] [CrossRef] [PubMed]
- Vilela, T.; Harb, A.M.; Bruner, A.; da Silva Arruda, V.L.; Ribeiro, V.; Alencar, A.A.C.; Grandez, A.J.E.; Rojas, A.; Laina, A.; Botero, R. A Better Amazon Road Network for People and the Environment. Proc. Natl. Acad. Sci. USA 2020, 117, 7095–7102. [Google Scholar] [CrossRef] [PubMed] [Green Version]
- Fearnside, P.M. Hydroelectric Dams in the Brazilian Amazon as Sources of ‘Greenhouse’ Gases. Environ. Conserv. 1995, 22, 7–19. [Google Scholar] [CrossRef] [Green Version]
- Fearnside, P.M. Amazon Dams and Waterways: Brazil’s Tapajós Basin Plans. Ambio 2015, 44, 426–439. [Google Scholar] [CrossRef] [PubMed] [Green Version]
- Lima, M.; da Silva Junior, C.A.; Pelissari, T.D.; Lourençoni, T.; Luz, I.M.S.; Lopes, F.J.A. Sugarcane: Brazilian Public Policies Threaten the Amazon and Pantanal Biomes. Perspect. Ecol. Conserv. 2020, 18, 210–212. [Google Scholar] [CrossRef]
- Lima, M.; do Vale, J.C.E.; de Medeiros Costa, G.; dos Santos, R.C.; Filho, W.L.F.C.; Gois, G.; de Oliveira-Junior, J.F.; Teodoro, P.E.; Rossi, F.S.; da Silva Junior, C.A. The Forests in the Indigenous Lands in Brazil in Peril. Land Use Policy 2020, 90, 104258. [Google Scholar] [CrossRef]
- INPE TerraBrasilis/Prodes (Desmatamento)—Amazônia Legal. Available online: http://terrabrasilis.dpi.inpe.br/app/dashboard/deforestation/biomes/legal_amazon/rates (accessed on 7 December 2021).
- Abessa, D.; Famá, A.; Buruaem, L. The Systematic Dismantling of Brazilian Environmental Laws Risks Losses on All Fronts. Nat. Ecol. Evol. 2019, 3, 510–511. [Google Scholar] [CrossRef] [PubMed]
- Ferrante, L.; Fearnside, P.M. Brazil’s New President and `ruralists’ Threaten Amazonia’s Environment, Traditional Peoples and the Global Climate. Environ. Conserv. 2019, 46, 261–263. [Google Scholar] [CrossRef]
- dos Santos, A.M.; da Silva, C.F.A.; de Almeida Junior, P.M.; Rudke, A.P.; de Melo, S.N. Deforestation Drivers in the Brazilian Amazon: Assessing New Spatial Predictors. J. Environ. Manag. 2021, 294, 113020. [Google Scholar] [CrossRef] [PubMed]
- Trigueiro, W.R.; Nabout, J.C.; Tessarolo, G. Uncovering the Spatial Variability of Recent Deforestation Drivers in the Brazilian Cerrado. J. Environ. Manag. 2020, 275, 111243. [Google Scholar] [CrossRef]
- Ferrante, L.; Andrade, M.B.T.; Fearnside, P.M. Land Grabbing on Brazil’s Highway BR-319 as a Spearhead for Amazonian Deforestation. Land Use Policy 2021, 108, 105559. [Google Scholar] [CrossRef]
- Julião, G.R.; Novo, S.P.C.; Ríos-Velásquez, C.M.; Desmoulière, S.J.M.; Luz, S.L.B.; Pessoa, F.A.C. Sand Fly Fauna Associated With Dwellings and Forest Habitats Along the BR-319 Highway, Amazonas, Brazil. J. Med. Entomol. 2018, 56, 540–546. [Google Scholar] [CrossRef]
- Fearnside, P.M.; de Alencastro Graça, P.M.L. BR-319: Brazil’s Manaus-Porto Velho Highway and the Potential Impact of Linking the Arc of Deforestation to Central Amazonia. Environ. Manag. 2006, 38, 705–716. [Google Scholar] [CrossRef]
- Ritter, C.D.; McCrate, G.; Nilsson, R.H.; Fearnside, P.M.; Palme, U.; Antonelli, A. Environmental Impact Assessment in Brazilian Amazonia: Challenges and Prospects to Assess Biodiversity. Biol. Conserv. 2017, 206, 161–168. [Google Scholar] [CrossRef]
- Ferrante, L.; Fearnside, P.M. The Amazon’s Road to Deforestation. Science 2020, 369, 634. [Google Scholar] [CrossRef] [PubMed]
- Meirelles, F.A.; Carrero, G.C.; Neto, J.G.F.; Cenamo, M.C.; Guarido, P.C.P. Análise Ambiental e Socioeconômica Dos Municípios Sob Influência Da Rodovia BR-319.; Instituto Do Desenvolvimento Sustentável Da Amazônia, IDESAM: Manaus, Brazil, 2018. [Google Scholar]
- Fearnside, P.M. BR-319 e a Destruição Da Floresta Amazônica 2018. Available online: https://amazoniareal.com.br/br-319-e-destruicao-da-floresta-amazonica/. (accessed on 16 November 2021).
- Ferrante, L.; Andrade, M.B.T.; Leite, L.; Silva Junior, C.A.; Lima, M.; Coelho Junior, M.G.; Silva Neto, E.C.; Campolina, D.; Carolino, K.; Maria Diele-Viegas, L.; et al. Brazils Highway BR-319: The Road to the Collapse of the Amazon and the Violation of Indigenous Rights. DIE ERDE 2021, 152, 65–70. [Google Scholar] [CrossRef]
- Ferrante, L.; Gomes, M.; Fearnside, P.M. Amazonian Indigenous Peoples Are Threatened by Brazil’s Highway BR-319. Land Use Policy 2020, 94, 104548. [Google Scholar] [CrossRef]
- Assis, L.F.F.G.; Ferreira, K.R.; Vinhas, L.; Maurano, L.; Almeida, C.; Carvalho, A.; Rodrigues, J.; Maciel, A.; Camargo, C. TerraBrasilis: A Spatial Data Analytics Infrastructure for Large-Scale Thematic Mapping. ISPRS Int. J. Geo-Inf. 2019, 8, 513. [Google Scholar] [CrossRef] [Green Version]
- Lourençoni, T.; da Silva Junior, C.A.; Lima, M.; Teodoro, P.E.; Pelissari, T.D.; dos Santos, R.G.; Teodoro, L.P.R.; Luz, I.M.; Rossi, F.S. Advance of Soy Commodity in the Southern Amazonia with Deforestation via PRODES and ImazonGeo: A Moratorium-Based Approach. Sci. Rep. 2021, 11, 21792. [Google Scholar] [CrossRef] [PubMed]
- da Silva Junior, C.A.; Teodoro, P.E.; Delgado, R.C.; Teodoro, L.P.R.; Lima, M.; de Andréa Pantaleão, A.; Baio, F.H.R.; de Azevedo, G.B.; de Oliveira Sousa Azevedo, G.T.; Capristo-Silva, G.F.; et al. Persistent Fire Foci in All Biomes Undermine the Paris Agreement in Brazil. Sci. Rep. 2020, 10, 16246. [Google Scholar] [CrossRef]
- IBGE Área Territorial Brasileira. Available online: http://www.ibge.gov.br/ (accessed on 7 December 2021).
- da Silva Junior, C.A.; de Medeiros Costa, G.; Rossi, F.S.; do Vale, J.C.E.; de Lima, R.B.; Lima, M.; de Oliveira-Junior, J.F.; Teodoro, P.E.; Santos, R.C. Remote Sensing for Updating the Boundaries between the Brazilian Cerrado-Amazonia Biomes. Environ. Sci. Policy 2019, 101, 383–392. [Google Scholar] [CrossRef]
- MMA Towards Achieving the Objective of the United Nations Framework Convention on Climate Change. Available online: https://antigo.mma.gov.br/biomas/amazônia.html (accessed on 6 December 2021).
- Alvares, C.A.; Stape, J.L.; Sentelhas, P.C.; De Moraes Gonçalves, J.L.; Sparovek, G. Köppen’s Climate Classification Map for Brazil. Meteorol. Z. 2013, 22, 711–728. [Google Scholar] [CrossRef]
- Souza, C.M.; Roberts, D.A.; Cochrane, M.A. Combining Spectral and Spatial Information to Map Canopy Damage from Selective Logging and Forest Fires. Remote Sens. Environ. 2005, 98, 329–343. [Google Scholar] [CrossRef]
- Barlow, J.; Berenguer, E.; Carmenta, R.; França, F. Clarifying Amazonia’s Burning Crisis. Glob. Chang. Biol. 2019, 26, 319–321. [Google Scholar] [CrossRef] [Green Version]
- Giglio, L.; Descloitres, J.; Justice, C.O.; Kaufman, Y.J. An Enhanced Contextual Fire Detection Algorithm for MODIS. Remote Sens. Environ. 2003, 87, 273–282. [Google Scholar] [CrossRef]
- Giglio, L.; Justice, C.; Boschetti, L.; Roy, D. MCD64A1 MODIS/Terra+Aqua Burned Area Monthly L3 Global 500 m SIN Grid V006 [Data Set]. Available online: https://doi.org/10.5067/MODIS/MCD64A1.006 (accessed on 5 December 2021).
- Zhou, L.; Wang, Y.; Chi, Y.; Wang, S.; Wang, Q. Contrasting Post-Fire Dynamics between Africa and South America Based on MODIS Observations. Remote Sens. 2019, 11, 1074. [Google Scholar] [CrossRef] [Green Version]
- McKee, T.B.; Doesken, N.J.; Kleist, J. The Relationship of Drought Frequency and Duration to Time Scales. Proc. Eighth Conf. Appl. Climatol. 1993, 17, 179–184. [Google Scholar]
- de Oliveira-Júnior, J.F.; Teodoro, P.E.; da Silva Junior, C.A.; Baio, F.H.R.; Gava, R.; Capristo-Silva, G.F.; de Gois, G.; Correia Filho, W.L.F.; Lima, M.; de Barros Santiago, D.; et al. Fire Foci Related to Rainfall and Biomes of the State of Mato Grosso Do Sul, Brazil. Agric. For. Meteorol. 2020, 282–283, 107861. [Google Scholar] [CrossRef]
- Oliveira-Júnior, J.F.; Silva Junior, C.A.; Teodoro, P.E.; Rossi, F.S.; Blanco, C.J.C.; Lima, M.; Gois, G.; Filho, W.L.F.C.; Santiago, D.B.; Vanderley, M.H.G.S. Confronting CHIRPS Dataset and in Situ Stations in the Detection of Wet and Drought Conditions in the Brazilian Midwest. Int. J. Climatol. 2021, 41, 4478–4493. [Google Scholar] [CrossRef]
- Knapp, K.R.; Ansari, S.; Bain, C.L.; Bourassa, M.A.; Dickinson, M.J.; Funk, C.; Helms, C.N.; Hennon, C.C.; Holmes, C.D.; Huffman, G.J.; et al. Globally Gridded Satellite Observations for Climate Studies. Bull. Am. Meteorol. Soc. 2011, 92, 893–907. [Google Scholar] [CrossRef]
- Saha, S.; Moorthi, S.; Pan, H.-L.; Wu, X.; Wang, J.; Nadiga, S.; Tripp, P.; Kistler, R.; Woollen, J.; Behringer, D.; et al. The NCEP Climate Forecast System Reanalysis. Bull. Am. Meteorol. Soc. 2010, 91, 1015–1058. [Google Scholar] [CrossRef]
- Toté, C.; Patricio, D.; Boogaard, H.; van der Wijngaart, R.; Tarnavsky, E.; Funk, C. Evaluation of Satellite Rainfall Estimates for Drought and Flood Monitoring in Mozambique. Remote Sens. 2015, 7, 1758–1776. [Google Scholar] [CrossRef] [Green Version]
- Funk, C.C.; Peterson, P.J.; Landsfeld, M.F.; Pedreros, D.H.; Verdin, J.P.; Rowland, J.D.; Romero, B.E.; Husak, G.J.; Michaelsen, J.C.; Verdin, A.P. A Quasi-Global Precipitation Time Series for Drought Monitoring; U.S. Geological Survey: Reston, VA, USA, 2014. [Google Scholar] [CrossRef]
- Mann, H.B. Nonparametric Tests Against Trend. Econometrica 1945, 13, 245. [Google Scholar] [CrossRef]
- Kendall, K. Thin-Film Peeling-the Elastic Term. J. Phys. D Appl. Phys. 1975, 8, 1449–1452. [Google Scholar] [CrossRef]
- Regazzi, A.J.; Cruz, C.D. Análise Multivariada Aplicada; Universidade Federal de Viçosa: Viçosa-MG, Brazil, 2020. [Google Scholar]
- Bhering, L.L. Rbio: A Tool for Biometric and Statistical Analysis Using the R Platform. Crop Breed. Appl. Biotechnol. 2017, 17, 187–190. [Google Scholar] [CrossRef] [Green Version]
- R Core Team. R: A Language and Environment for Statistical Computing. Available online: https://www.R-project.org/. (accessed on 10 November 2021).
- Teodoro, P.E.; CorrÊa, C.C.G.; Torres, F.E.; de Oliveira-JÚnior, J.F.; da Silva Junior, C.A.; Gois, G.; Delgado, R.C. Analysis of the Occurrence of Wet and Drought Periods Using Standardized Precipitation Index in Mato Grosso Do Sul State, Brazil. J. Agron. 2015, 14, 80–86. [Google Scholar] [CrossRef]
- de Bodas Terassi, P.M.; de Oliveira-Júnior, J.F.; de Góis, G.; Galvani, E. Variabilidade Do Índice de Precipitação Padronizada Na Região Norte Do Estado Do Paraná Associada Aos Eventos de El Niño-Oscilação Sul. Rev. Bras. De Meteorol. 2018, 33, 11–25. [Google Scholar] [CrossRef]
- Kozak, M. What Is Strong Correlation? Teach. Stat. 2009, 31, 85–86. [Google Scholar] [CrossRef]
- Fearnside, P.M. Deforestation in Brazilian Amazonia: History, Rates, and Consequences. Conserv. Biol. 2005, 19, 680–688. [Google Scholar] [CrossRef]
- Nepstad, D.; Schwartzman, S.; Bamberger, B.; Santilli, M.; Ray, D.; Schlesinger, P.; Lefebvre, P.; Alencar, A.; Prinz, E.; Fiske, G.; et al. Inhibition of Amazon Deforestation and Fire by Parks and Indigenous Lands. Conserv. Biol. 2006, 20, 65–73. [Google Scholar] [CrossRef]
- Nolte, C.; Agrawal, A.; Silvius, K.M.; Soares-Filho, B.S. Governance Regime and Location Influence Avoided Deforestation Success of Protected Areas in the Brazilian Amazon. Proc. Natl. Acad. Sci. USA 2013, 110, 4956–4961. [Google Scholar] [CrossRef] [PubMed] [Green Version]
- Nepstad, D.; McGrath, D.; Stickler, C.; Alencar, A.; Azevedo, A.; Swette, B.; Bezerra, T.; DiGiano, M.; Shimada, J.; da Motta, R.S.; et al. Slowing Amazon Deforestation through Public Policy and Interventions in Beef and Soy Supply Chains. Science 2014, 344, 1118–1123. [Google Scholar] [CrossRef] [PubMed]
- Barbosa, M.L.F.; Delgado, R.C.; de Andrade, C.F.; Teodoro, P.E.; Junior, C.A.S.; Wanderley, H.S.; Capristo-Silva, G.F. Recent Trends in the Fire Dynamics in Brazilian Legal Amazon: Interaction between the ENSO Phenomenon, Climate and Land Use. Environ. Dev. 2021, 39, 100648. [Google Scholar] [CrossRef]
- Berenguer, E.; Lennox, G.D.; Ferreira, J.; Malhi, Y.; Aragão, L.E.O.C.; Barreto, J.R.; Espirito-Santo, F.D.B.; Figueiredo, A.E.S.; França, F.; Gardner, T.A.; et al. Tracking the Impacts of El Niño Drought and Fire in Human-Modified Amazonian Forests. Proc. Natl. Acad. Sci. USA 2021, 118, e20193771182021. [Google Scholar] [CrossRef]
Publisher’s Note: MDPI stays neutral with regard to jurisdictional claims in published maps and institutional affiliations. |
© 2022 by the authors. Licensee MDPI, Basel, Switzerland. This article is an open access article distributed under the terms and conditions of the Creative Commons Attribution (CC BY) license (https://creativecommons.org/licenses/by/4.0/).