Article

Greenhouse Gas Emissions of the Forest Supply Chain in Austria in the Year 2018

1
Institute of Forest Engineering, University of Natural Resources and Life Sciences, Peter-Jordan-Str. 82/3, 1190 Vienna, Austria
2
Institute of Agricultural Engineering, University of Natural Resources and Life Sciences, Peter-Jordan-Str. 82/3, 1190 Vienna, Austria
*
Author to whom correspondence should be addressed.
Sustainability 2022, 14(2), 792; https://doi.org/10.3390/su14020792
Submission received: 23 November 2021 / Revised: 3 January 2022 / Accepted: 7 January 2022 / Published: 11 January 2022

Abstract

:
Wood is a renewable product, but for the supply of wood non-renewable materials are also necessary, which can have negative environmental impacts. The objective of this study was to analyze the greenhouse gas (GHG) emissions caused by the forest supply chain in Austria using Life Cycle Assessment (LCA) methods. The forest supply chain consists of several processes like site preparation and tending, harvesting, and transport. In total, 30 relevant forest processes from seedling production until delivery of wood to the plant gate were considered. Results show that in the year 2018, a total of 492,096 t of CO2 eq. were emitted in Austria for harvesting and transportation of 19.2 hm3 of timber. This corresponds to 25.63 kg CO2 eq. per m3. At 77%, transport accounts for the largest share of emissions within the supply chain. Extraction causes 14% of emissions, felling and processing cause 5%, and chipping causes 4%. GHG emissions for felling, delimbing, and crosscutting are much lower when using a chainsaw compared to harvester. The high numbers for the transport can be explained by the high transportation distances. Especially for the transportation of wood, it is necessary to find more climate-friendly solutions from a technical and organizational point of view. The provision of wood is climate-friendly, and its use enables the substitution of fossil fuels or materials with higher negative effects on climate change such as aluminum, steel, or concrete.

1. Introduction

The concept of sustainability in the forestry sector should consider three sustainability dimensions (economic, environmental, and social) of the whole forest wood supply chain [1]. Avoiding negative environmental impacts in the manufacturing process of products and the provision of services is becoming increasingly important. In terms of the magnitude of the environmental impacts of forestry, assessment often focuses on certain aspects, such as biodiversity [2,3], water [4,5], soil [6,7], and air [8,9]. In the last few decades, there has been a prevailing discussion about climate change and the increasingly critical attitude of consumers in terms of sustainability and specifically mitigating climate change. Anthropogenic greenhouse gas (GHG) emissions tend to lead to an increasing annual average surface temperature, which threatens species and ecosystems [10]. For climate change mitigation, Austria aims to reduce GHG emissions by 36% until 2030 compared to the level in 2005 [11]. The most important goal of climate protection is to reduce energy consumption through increased energy efficiency while at the same time reducing non-renewable shares in the energy mix [11,12].
The development of strategies to avoid negative environmental impacts affects almost all and therefore also the forestry sector. In general, increased usage of wood as a renewable raw material is seen as a part of the solution to mitigate climate change. However, it should be considered that non-renewable resources are used for harvesting and supply of wood to the industry and consumers, which does not allow the designation of a 100% CO2-neutral product [12]. Although it has been shown in many studies that the non-renewable share is low compared to the energy content (e.g., in [13]) or to the carbon storage of wood [14], holistic analyses of the total forest supply chain are important to demonstrate and reduce the non-renewable resources and thereby environmental impacts for the supply of wood and the provision of wood products [12].
For analyzing the environmental impacts of products or services, the Life Cycle Assessment (LCA) method is a useful and well-known approach. Following the EN ISO standard 14040 [15] definition, an LCA is the “compilation and evaluation of the inputs, outputs and the potential environmental impacts of a product system throughout its life cycle system”, assuming that the LCA is able to identify most of the environmental impacts. The impact on climate change is one of a manifold set of possible categories [12]. Although LCA has its origin in industrial production systems, they are now also widely used in the forestry sector [16].
In the last few years, a large number of life cycle assessments for the wood supply have been carried out, for example in Klein et al. [12] and Heinimann [17]. In forestry, mainly life cycle assessments have been carried out which dealt with the GHG emissions of country-specific wood supply networks in Europe, like Norway [18,19,20], Portugal [21,22,23], Ireland [24], Finland [25,26], Italy [27,28,29,30], Spain [31], and Germany [12,32,33]. Moreover, life cycle assessments can be found for other countries, particularly the US [34,35,36,37,38,39], Ghana [40], Malaysia [9], Japan [41] or Chile [42]. Available studies focus on forest operations to collect primary data of forest supply chains [17,22,32,42]. In addition, a large number of environmental studies have concentrated on industrial forests [20,26] and short rotation coppices [29,31,43,44]. Very few studies have analyzed local forest supply chains, close-to-nature management [27,30], or traditional wood products like cork [23] probably due to the large differences in forest conditions, forest management techniques, and wood products produced at regional and national level [16]. To our knowledge, no detailed LCA studies are available for forest supply chains in Austria. There is only one report which analyzed the effects of management strategies, the market dynamics of wood products, and the use of substitute materials (e.g., concrete, plastic) instead of wood on the development of greenhouse gas emissions [45]. Harvesting and logistic processes were not covered by the study.
The number of LCA studies for wood supply has increased in recent years. However, many of the LCAs dealt with the supply of fuel wood and the number of studies covering the production of sawlogs and pulpwood is still small. Frequently, there is a lack of information on some LCA aspects, such as the system boundaries and the identification of hotspots within forest supply chains [14]. Klein et al. [14] showed that the GHG emissions span a wide range due to different environmental conditions and the lack of harmonization of the studies and therefore no average value can be calculated for all relevant supply chains.
In Austria, forests cover about 48% of the area with a gross forest area of about 4 Mio ha and a total growing stock of 1135 hm3. In 2018 the annual cut of timber volume was more than 19.2 hm3, of which soft wood accounted for 16.0 and hard wood for 3.2 hm3. According to the national timber harvesting statistics, 60% were dedicated to round wood, 15% to industrial wood, and 25% to fuel wood [46].
Since the use of wood plays a major role in Austria’s climate change mitigation strategy, especially due to the carbon sequestration potential and the substitution of fossil fuels through the use of wood, it is particularly important to analyze the environmental impact of the supply of raw wood, as this is the very first step within the wood product chain.
The aim of this study was to analyze and evaluate the environmental impacts of the provision of raw wood in Austria. Since there is a legal requirement in Austria for larger companies to carry out measures to improve energy efficiency, this study is able to provide assistance. The study was based on a cradle-to-gate approach that begins with site preparation and ends with delivery at the factory gate. The impact assessment focused on greenhouse gas emissions. For this purpose, relevant forest supply processes were identified and modeled. In addition, differences between the wood assortments of round wood (saw logs, industrial wood) and fuel wood (split logs, wood chips) were considered. Outcomes of the study highlighted emission hotspots within the supply chain and provided decision makers with relevant data to improve the supply chain performance in terms of environmental impact in the future.

2. Materials and Methods

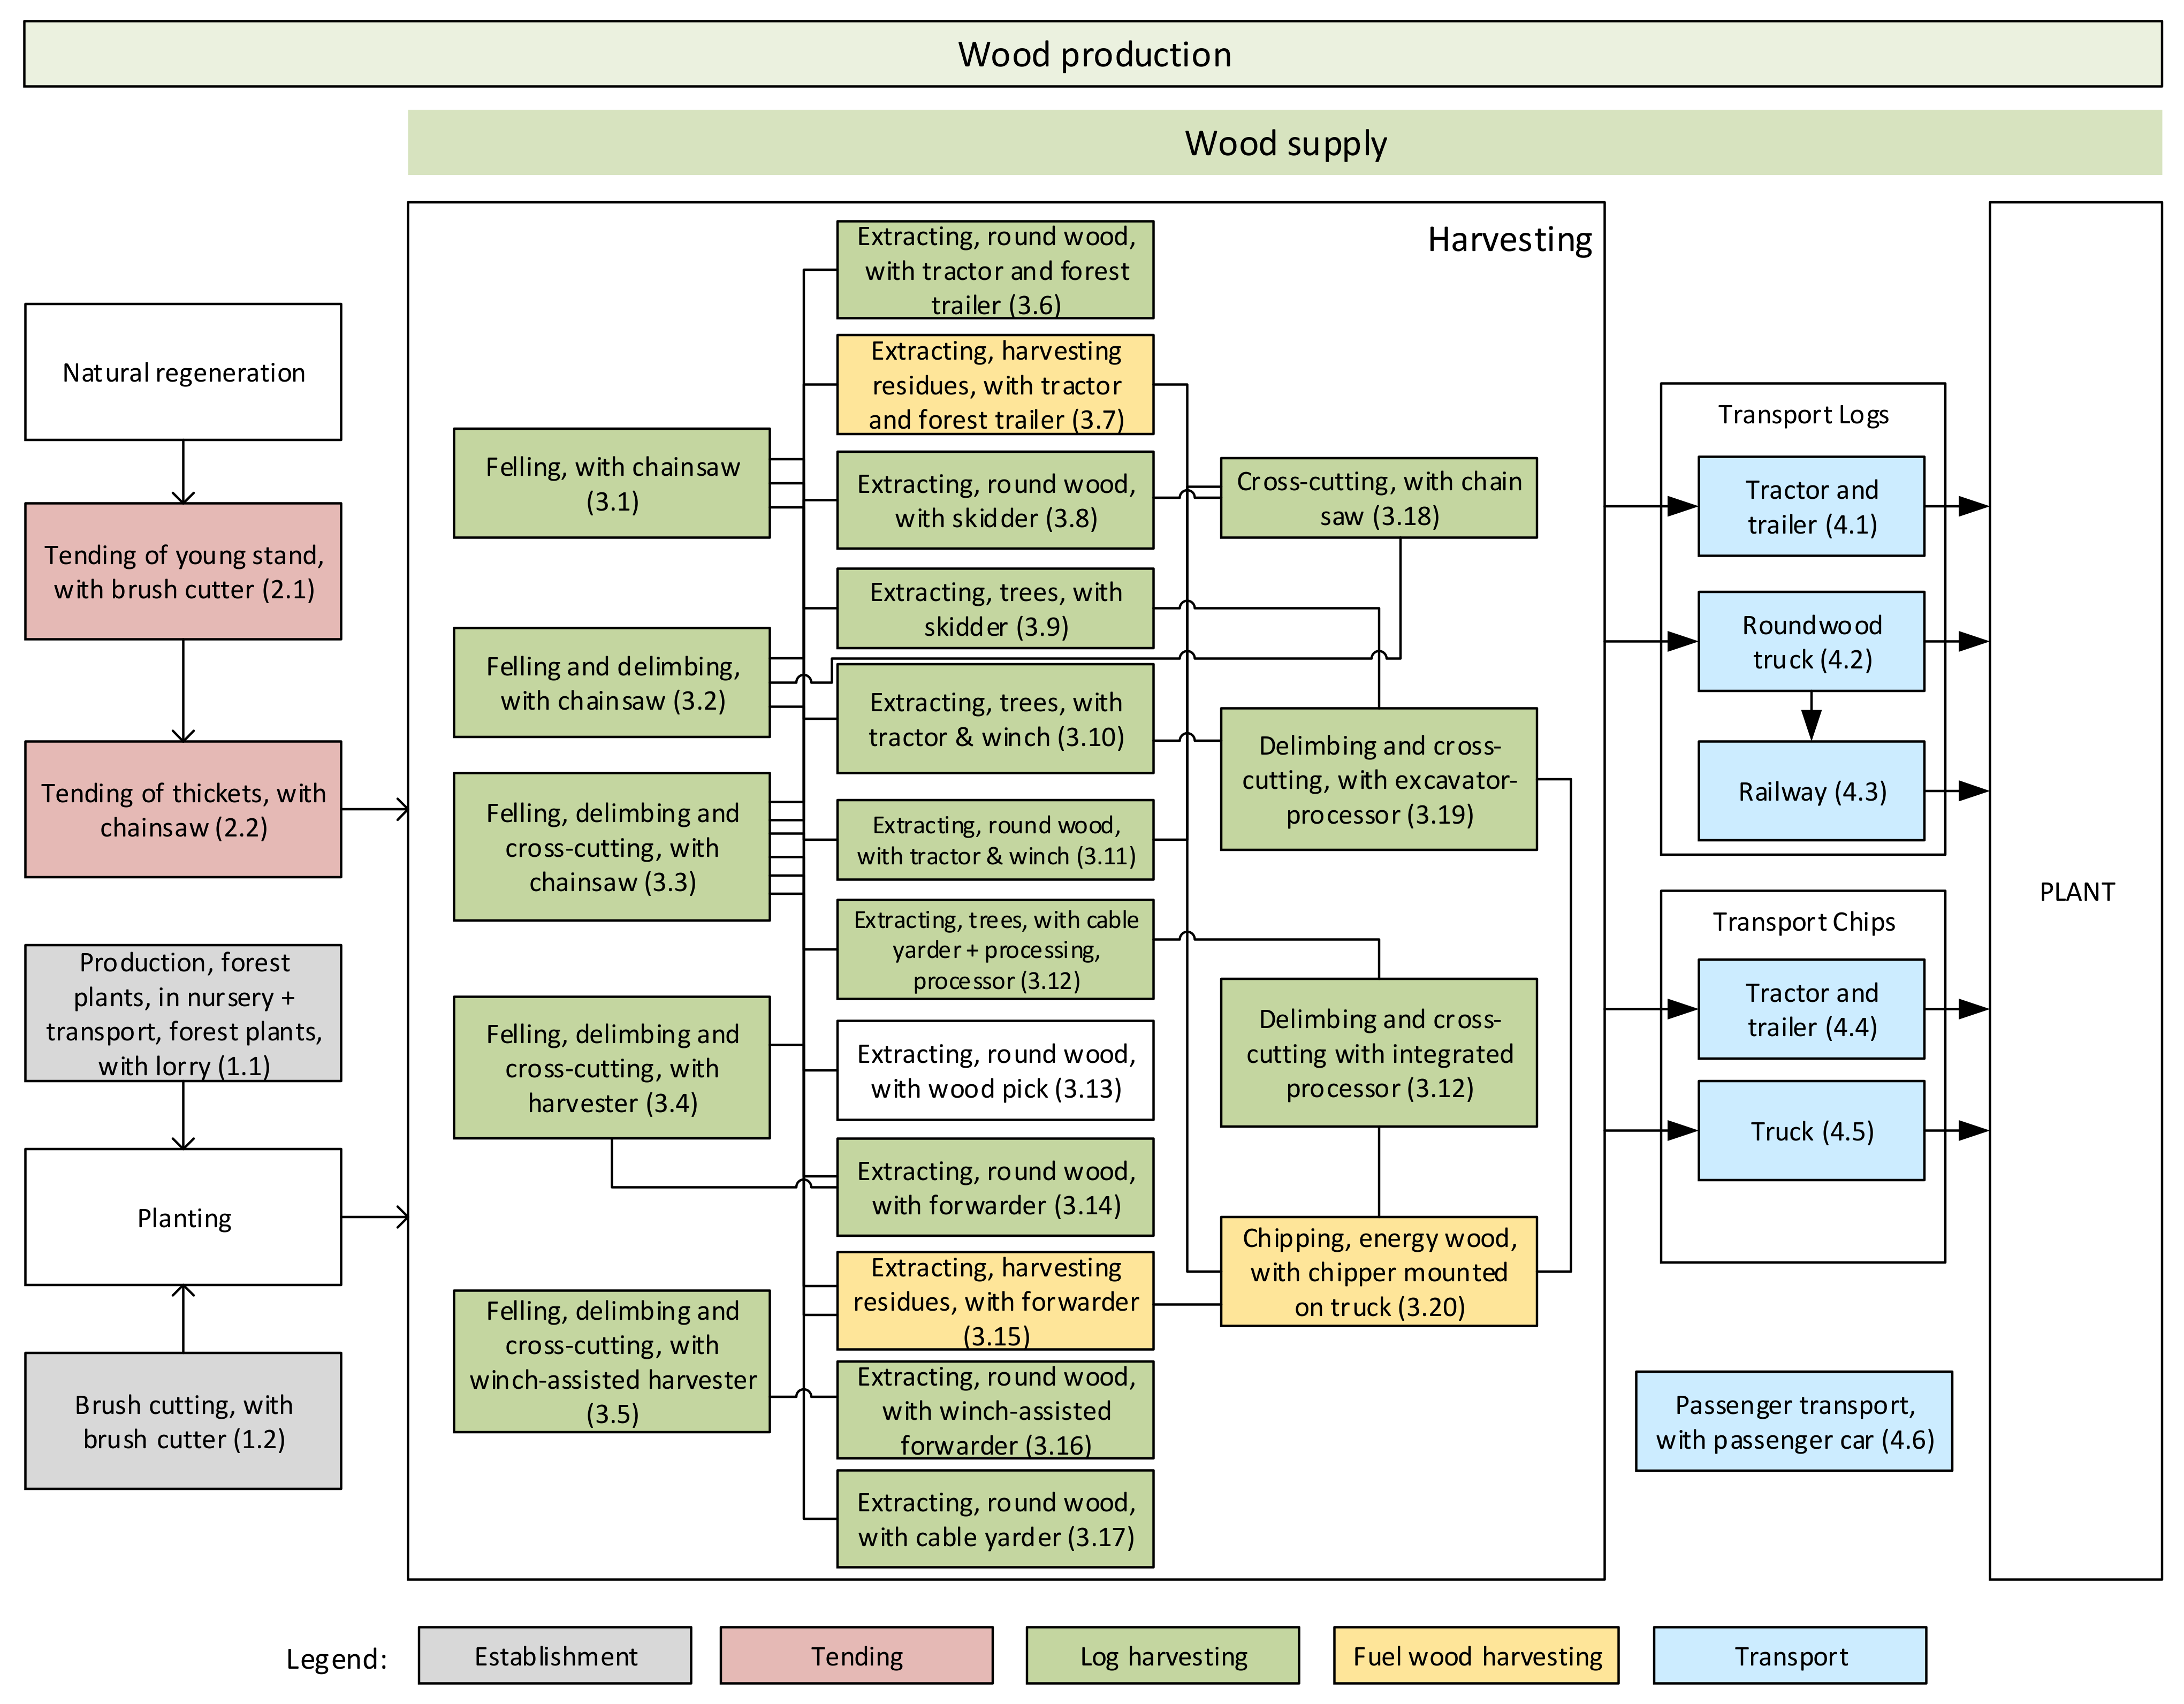
2.1. System Description and System Boundaries

The forest supply chain is part of the wood production chain and consists of several process groups like site preparation and tending, harvesting, transport, and secondary processes. The harvesting process covers the felling of trees and the extraction of trees (felled), stems (felled and delimbed), logs (felled, delimbed and crosscut), and harvesting residues (branches and harvested wood with a diameter of less than 7 cm). All mentioned processes encompass their respective secondary processes. Secondary processes include all processes which are not taking place in the forest but are also relevant for the provision of raw wood, for example the manufacture of machinery, transport of the machines from the factory to the local entrepreneur, or the provision of fuel. Figure 1 shows the wood production system with all relevant processes for typical Austrian forest supply chains. We include different levels of mechanization in harvesting (e.g., chainsaw, tractor, skidder, harvester, and forwarder) and different modes of transport (truck, railroad). Unique codes shown in parenthesis have been defined for the supply processes to distinguish different levels in the supply chain. For example, grey-colored boxes dealing with site establishment processes start with 1, the red-colored boxes contain tending processes starting with 2, the green-colored processes include harvesting and the yellow-colored fuel wood harvesting processes begin with 3, and the blue-colored transport processes start with 4.

2.2. Functional Unit

The functional unit is one m3 of extracted wood over bark delivered to the plant for four different wood assortment groups (saw logs, industrial wood, split logs, and wood chips). We used this functional unit because it is commonly used in other LCA studies, thus the results will be comparable with other studies.

2.3. Impact Category

The sum of all input flows of a system causes a certain number of different outputs and environmental impacts, for example through the manufacture of machines or the use of fossil fuels. The climate change impact category (hereinafter also referred to as GHG emissions, excluding biogenic CO2) in kg CO2-eq was used to assess the environmental impacts for the forest biomass supply chains. Possible changes in the carbon stocks in the biomass, the organic layer, and mineral soil on site due to forest management were not considered. A further division into different greenhouse gases (carbon dioxide, methane, nitrous oxide) was not in the scope of the study. Impact assessment was carried out according to the ILCD recommendations [47]. The method suggested by the IPCC [48] was used for climate change assessment.

2.4. Wood Supply Processes

All forest processes presented in Figure 1 and their respective model assumptions are illustrated in the subsequent sections. Most of the input data, where characteristics are explained in the following subsections, were derived from Austrian Federal Forests PLC by written and oral communication, whereby 2018 was taken as the reference year.
The establishment of forest stands begin with site preparation and include all processes that take place before planting, as well as the planting and regeneration processes themselves. In the present study, the processes for the production of the seedlings in the nursery as well their transport to the forest (P 1.1) and clearing of the area with brush cutter (P 1.2) were included. Site tending processes are primarily necessary for stands with natural regeneration to improve quality and growth of the trees. In this study, tending of young stands (P 2.1) and thickets (P 2.2) was considered. Timber harvesting encompasses all relevant processes such as felling, delimbing, bucking (crosscutting), and extracting to forest road. For tree felling (and processing), the chainsaw and harvester were modeled. Under Austrian conditions, machines used for extracting are tractor and trailer, tractor and winch, skidder, cable yarder, and forwarder depending on site and stand conditions, and consequently this machine had to be modelled. The category transport compromises the transport from forest road to mill or plant. Round wood (saw logs and industrial wood) is carried by tractor and trailer, timber truck, or railway. Fuel wood as chips is transported by tractor and trailer or truck. A detailed description of the input data for the inventory analysis of all relevant wood supply processes is documented in Appendix A.

2.5. Annual Harvested Timber Volumes and Harvesting Systems

To calculate the environmental impacts caused by timber supply in Austria, it is necessary to know the total annual harvested timber volumes and the corresponding timber harvesting systems (Table 1). For this purpose, the official statistics for annual timber volumes [46] as well internal statistics of the Austrian Federal Forests PLC were contracted. In the year 2018, in total 19.2 hm3 timber was harvested, where 14 hm3 was round wood (RW), 2.3 hm3 was solid fuel wood (FWS), and 2.9 hm3 was chipped fuel wood (FWC). The respective environmental impacts were assigned to all wood assortments and multiplied by the total wood quantities for the reference year 2018. This enabled an estimation of the total GHG emissions of the Austrian wood supply from the site preparation to the plant gate.

2.6. Life Cycle Assessment Modeling, Software, and Data Sources

The LCA was carried out in accordance with EN ISO 14040 [15] and 14044 [49]. The software openLCA 1.7 was used for modelling. The ecoinvent 3.4 database represents the data basis for all relevant background systems. The forestry processes were individually modeled or adapted in openLCA 1.7 with the help of literature data (see Section 2.5 and Appendix A). The results of the life cycle assessment for each individual supply process were exported from openLCA and then aggregated with Microsoft Excel to calculate the environmental impacts of wood supply processes (Section 3.1), harvesting systems (Section 3.2), and for the Austrian forestry sector (Section 3.3). No allocation was made for all harvesting and transport processes, as individual calculations were carried out for all the assortments. All GHG emissions caused by general processes (site preparation, site tending) were scaled to the total amount of wood provided within the tree-specific rotation period and then allocated to the assortments according to mass.

3. Results

In this section, the GHG emissions of the individual wood supply processes and of the most common harvesting systems in Austria are presented. Finally, the GHG emissions of the Austrian forestry sector is calculated.

3.1. Greenhouse Gas Emissions of Wood Supply Processes

For each process shown in Figure 1, the GHG emissions were calculated based on average conditions in Austria. The production of seedlings, transport to the forest, and planting as well clearing of weed with a brush cutter do not have a noticeable influence on the GHG emissions of the whole supply chain. The older the stands to be tended, the higher the GHG emissions (Table 2) for producing 1 m3 of timber.
Depending on the technology used, felling, delimbing, and crosscutting causes GHG emissions between 0.26 to 5.27 kg CO2 eq. m3. GHG emissions for felling, delimbing, and crosscutting are much lower when using a chainsaw compared to harvester or winch-assisted harvester. Winch-assisted harvester generates 55% more GHG emissions than the harvester operating without winch in flat terrain. From the climate change point of view, delimbing and crosscutting with an excavator-processor is much more emission intensive than doing the same work with a chainsaw (Table 3).
Timber extraction causes GHG emissions between 2.04 to 7.91 kg CO2 eq. m3. The lowest emissions occur when using tractor and forest trailer or tractor and winch. Skidder and cable yarder extracting round wood in cut-to-length method (CTL) have the highest GHG emissions. In total, 4.17 kg CO2 eq. m3 are produced during the extraction with cable yarder in whole-tree method (WT) but this also includes delimbing and crosscutting with a processor at the landing. Extracting with a wood pick generates no emissions because no machines are used (Table 4).
Extracting harvesting residues with tractor and forest trailer causes two times more GHG emissions than extracting with a forwarder. Transporting chips with tractor and trailer has similar GHG emissions as transporting chips with a truck (Table 5).
Transporting round wood with a round wood truck causes almost three times more emissions than transportation with tractor and trailer or with railway. Transportation with a round wood truck has the highest GHG emissions (26.95 kg CO2 eq. m3) of all analyzed wood supply processes (Table 6).

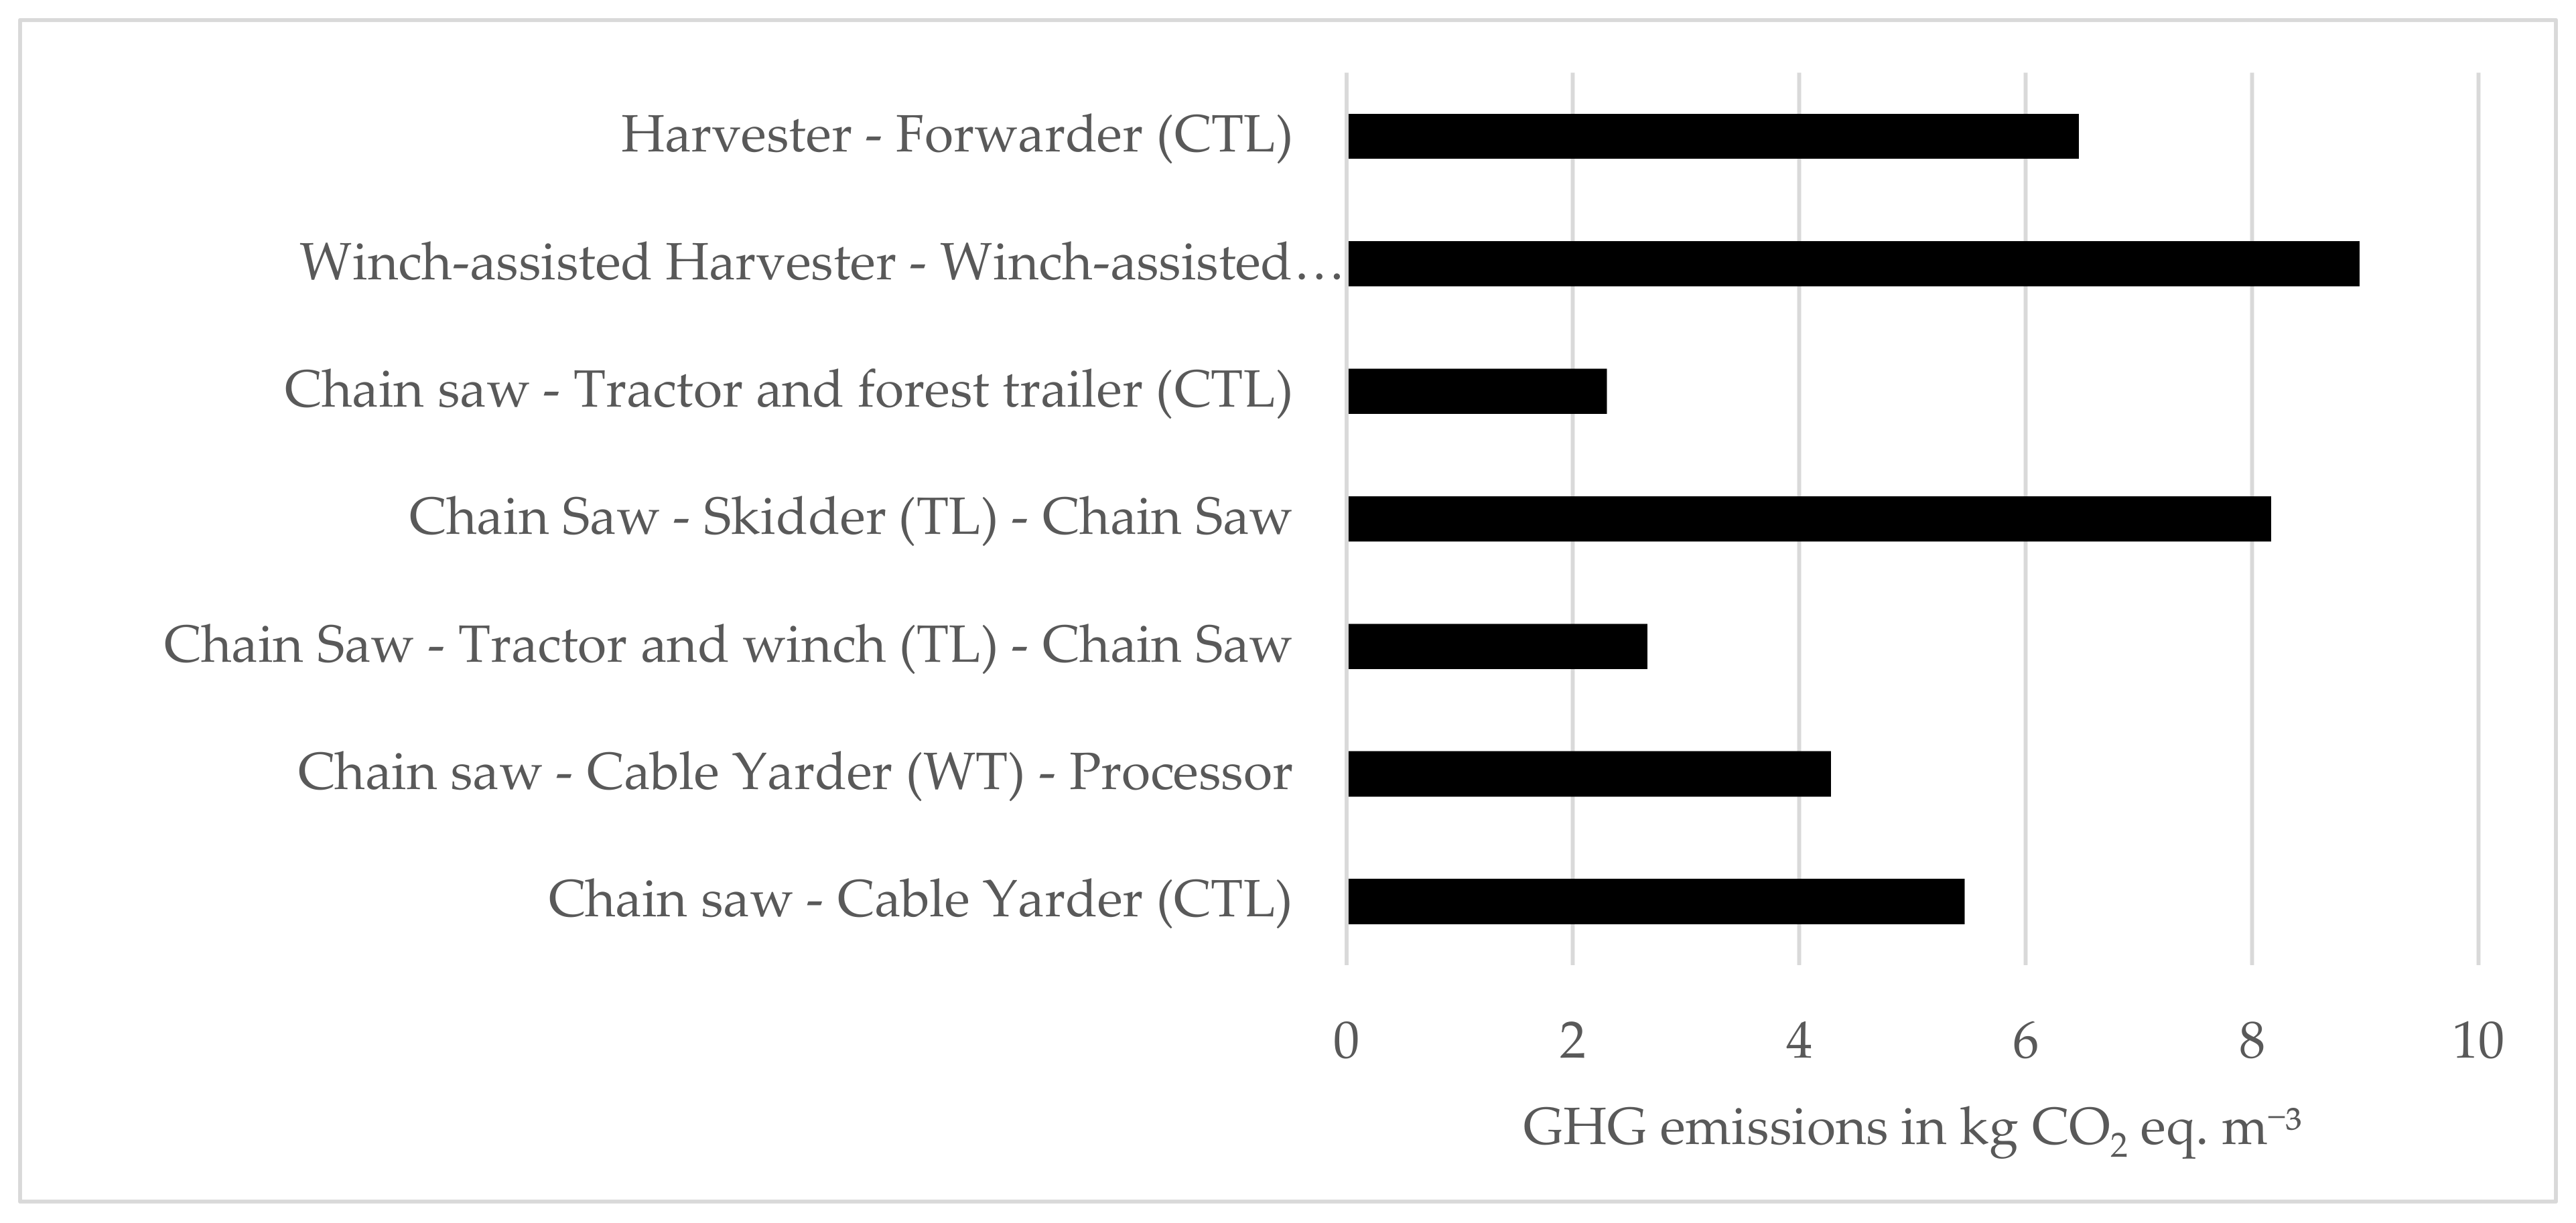
3.2. Greenhouse Gas Emissions of Most Common Harvesting Systems in Austria

Seven harvesting systems which are very common in Austria were analyzed in terms of GHG emissions. A harvesting system includes several supply processes starting with felling the tree in the forest and ending with storing the processed logs at the forest road or landing. The most environmentally acceptable harvesting systems are those where chainsaw and tractor are mainly used. Timber supply with chainsaw, tractor, forest trailer and chainsaw, tractor, and winch cause 2.30 and 2.66 kg CO2 eq. m3, respectively. Harvesting operations with winch-assisted harvester and winch-assisted forwarder have the highest GHG emissions with 8.17 kg CO2 eq. m3 (Figure 2). Harvesting operations are carried out in cut-to-length method (CTL), tree-length method (TL) or whole-tree method (WT).

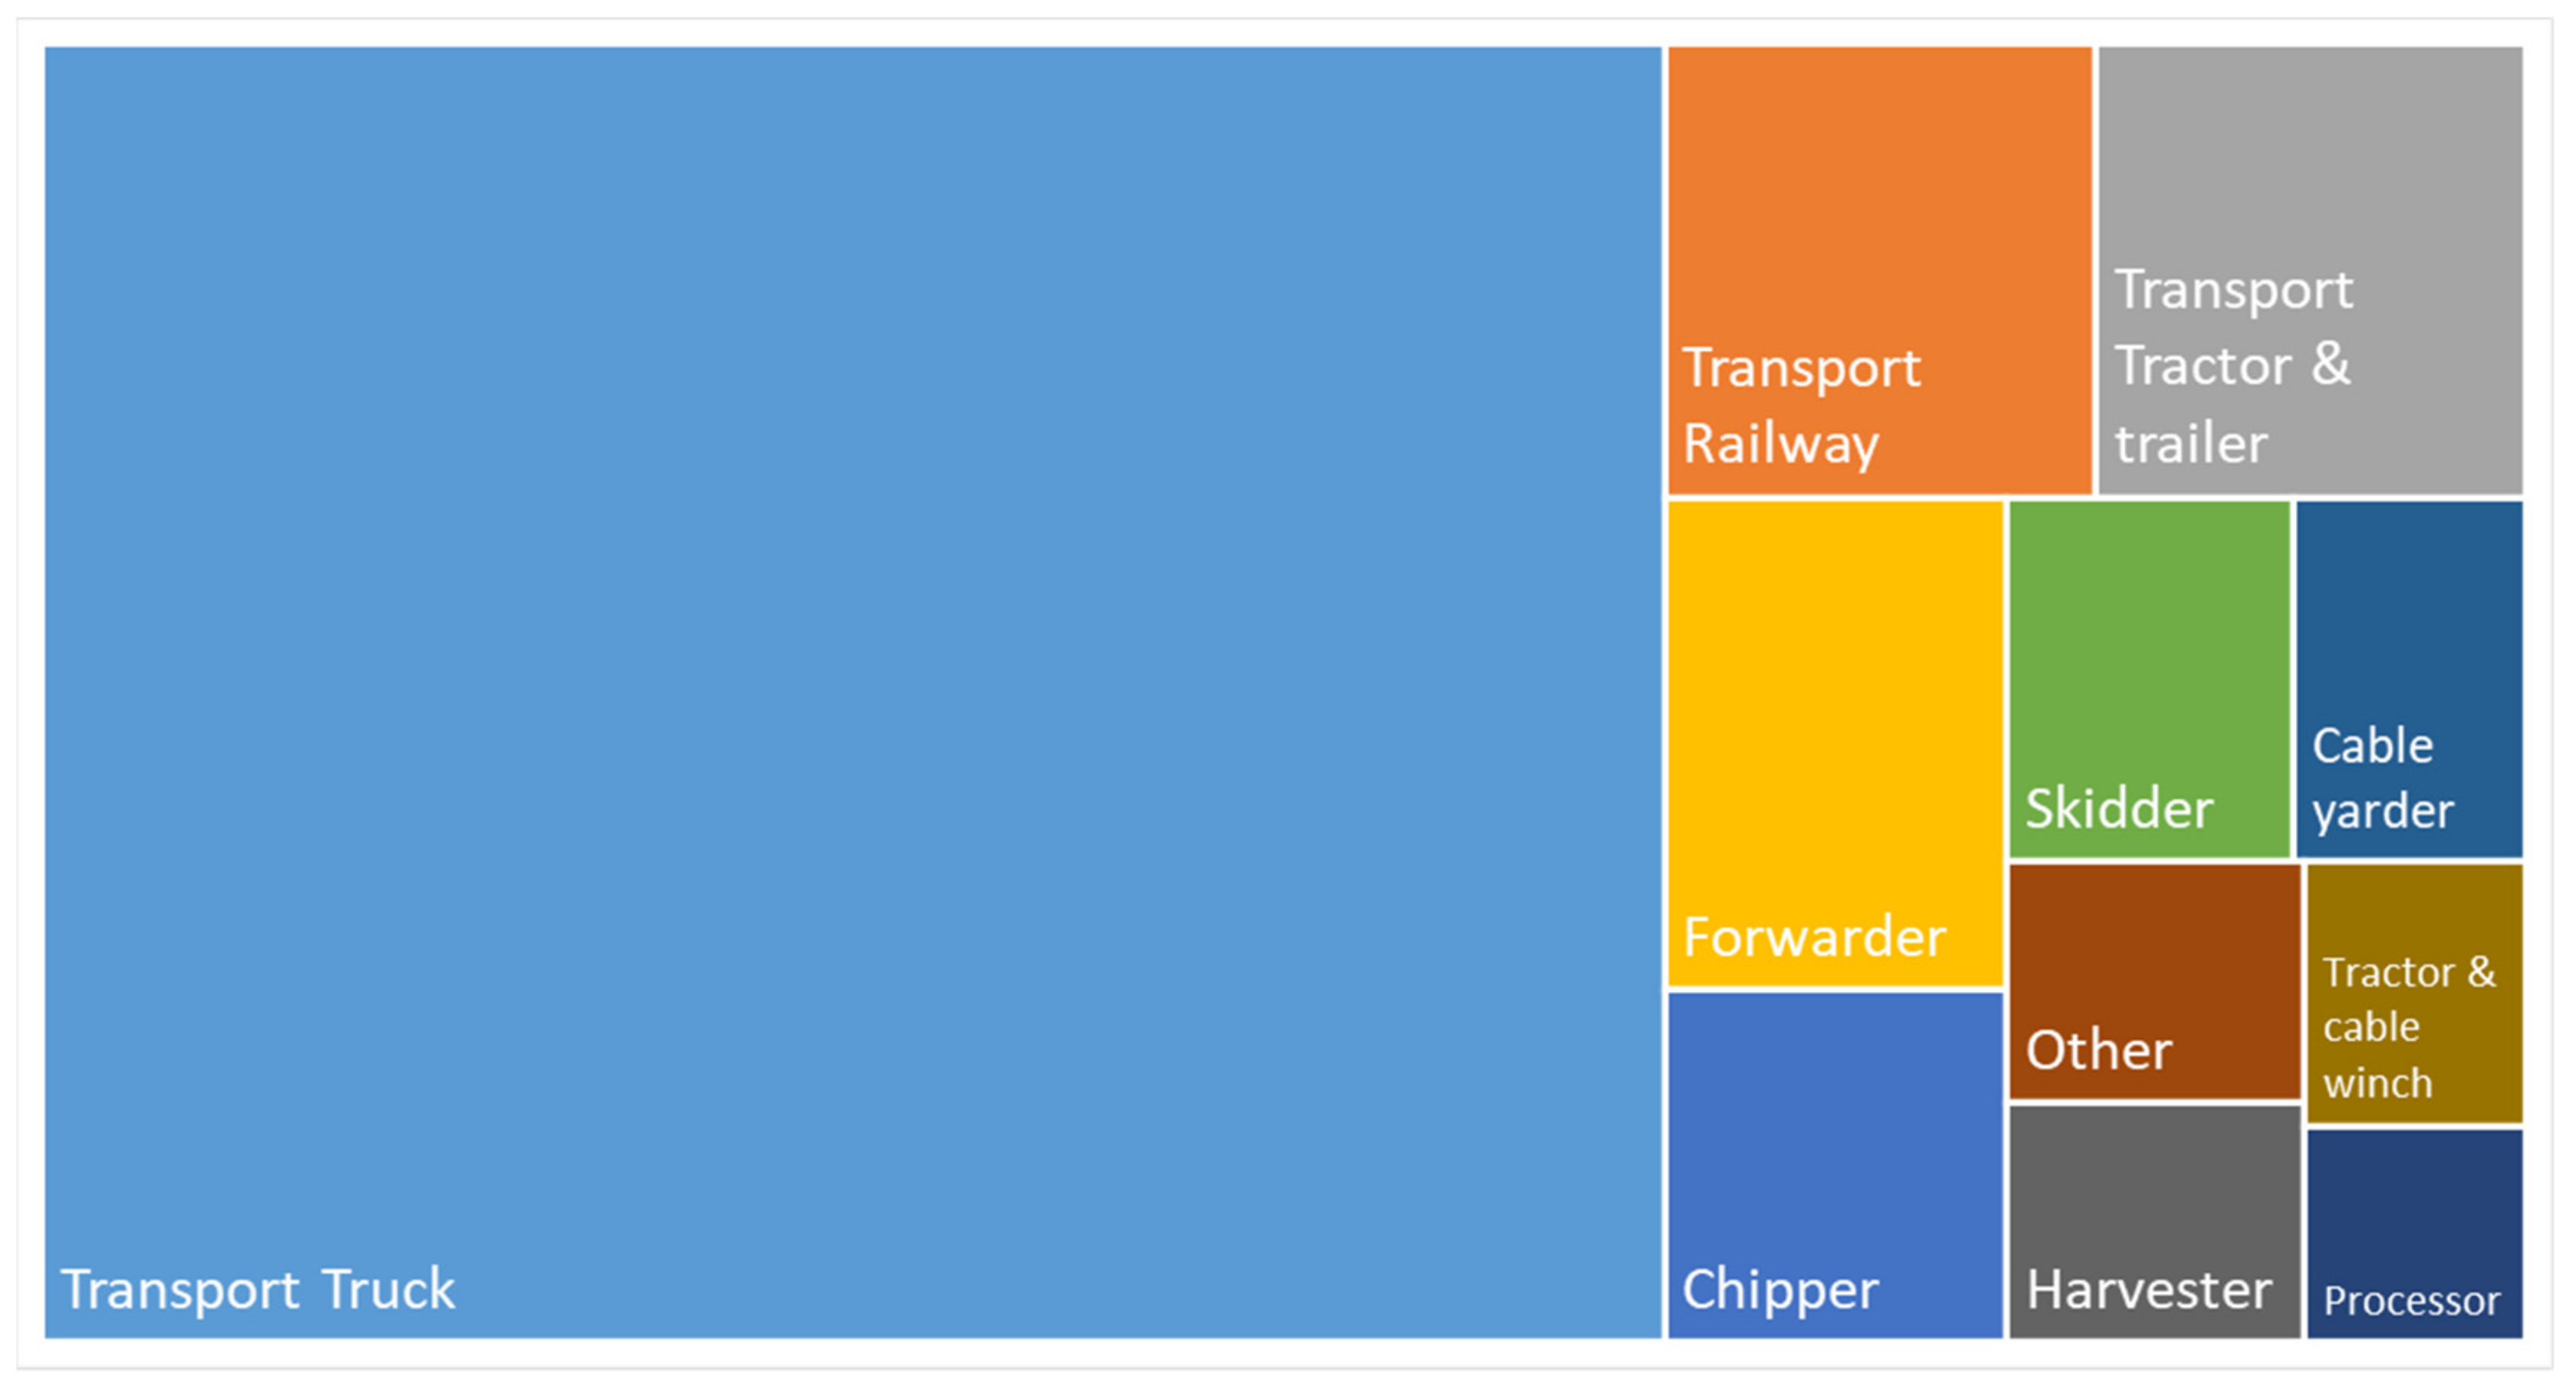
3.3. Greenhouse Gas Emissions of the Austrian Forestry Sector

Greenhouse gas emissions were upscaled to estimate the total amount of GHG emitted due to the wood supply in Austria and presented in overall tons and per m3 of wood chips, round wood and firewood, respectively. Furthermore, emissions were also analyzed separately for small-scale forestry and big forest enterprises.
In 2018, a total of 492,096 t of CO2 were emitted in Austria for harvesting and transportation of 19.2 hm3 of timber. This corresponds to 25.63 kg CO2 eq. per m3. The production of wood chips has slightly higher emissions with 28.29 kg CO2 eq. m3 average than the production of round wood and firewood with an average of 25.16 kg CO2 eq. m3 for both assortments. With 77%, transport emits the largest share of emissions within the supply chain, with truck transport accounting for 65% and transport by railway and tractor and trailer at 6% each. Extraction causes 14% of emissions, with forwarder (5%), skidder (3%), cable yarder (2.5%), and tractor and winch (2%) as the main drivers. Felling and processing accounts for 5% of the GHG emissions and chipping for 4% (Figure 3).
In 2018, a total of 299,450 t of CO2 eq. were emitted by Austrian small-scale forests with a size smaller than 200 ha for supplying 11.3 hm3 of timber to the gate. This corresponds to 26.50 kg CO2 eq. per m3. The production of wood chips (on average 29.02 kg CO2 eq. m3) has about 3 kg CO2 eq. per m3 higher emissions than the production of round wood and firewood (on average 25.85 kg CO2 eq. m3). With 74%, transport again accounts for the largest share of emissions within the supply chain. Extracting causes 17% of emissions, felling and processing cause 4%, and chipping causes 5%.
A total of 161,944 t of CO2 were emitted in Austria in forest enterprises with a size larger than 200 ha in the year 2018, whereby 6.2 hm3 of timber were harvested and transported to the gate. This corresponds to 26.12 kg CO2 eq. per m3. The production of wood chips (on average 28.29 kg CO2 eq. m3) has about 2.4 kg CO2 eq. per m3 higher emissions than the production of round wood and firewood (on average 25.85 kg CO2 eq. m3). With 78%, the transport again causes the largest part of emissions within the supply chain. Extracting creates 15% of emissions, felling and processing creates 4%, and chipping creates 3%.

4. Discussion

In the analyzed forest supply chains, the emissions are mainly caused by fossil fuel combustion and machine production. Results showed how the impacts relate to the examined forest supply chains in different conditions, whereby emissions mainly originate from the transportation phase.
Site preparation and site tending-inclusive seedling production summed up to 2.6% of the total GHG emissions of the supply chain. This is more or less the same amount as in Norway, which is 3% [18].
Felling and processing with a chainsaw is the harvesting process with the lowest GHG emissions. The productivity of the chainsaw (8.5 m3 h−1) is much lower in comparison to the harvester (27 m3 h−1) or winch-assisted harvester (20.2 m3 h−1) but on the other hand fuel consumption of the chainsaw (1.5 L h−1) is also lower compared to the harvester (40 l h−1) and winch-assisted harvester (40 L h−1). The productivity of the winch-assisted harvester is lower than for the harvester because of more difficult terrain conditions.
The higher fuel consumption of the harvester was not compensated by the higher productivity which leads to higher GHG emissions of the harvester compared to the chainsaw. Furthermore, the production of the harvester needs more resources than for the chainsaw. This can also not be compensated by the higher life span of the harvester (17,600 h) compared to the chainsaw (2500 h). Although the chainsaw shows better results in terms of GHG emissions, there are other factors like work safety and ergonomics where the harvester shows better performance. However, to make a comprehensive analysis of which machine to use, a multi-criteria assessment is recommended [50].
The low GHG emissions of tractor and forest trailer can be explained by low fuel consumption (3.5 L h−1) and moderate productivity (7.6 m3 h−1). Furthermore, the production of a tractor is not as resource intensive as a cable yarder or forwarder, but on the other hand, the life span of a tractor (7000 h) is shorter. Tractor and winch also have similar characteristics and therefore also low GHG emissions. The environmental impacts of extracting with a skidder are high, which can be explained by moderate fuel consumption (8 L h−1) and low productivity (4.3 m3 h−1). However, the data of both systems originate from different sources and are therefore not fully comparable. GHG emissions of forwarder and winch-assisted forwarder show values between 3 and 4 kg CO2 eq. per m3 of timber which is a good compromise for an environmentally acceptable and efficient harvesting system. We have to mention that most of the data stem from case studies and in these case studies, the forwarder (309 m) and the winch-assisted forwarder (271 m) had higher average extraction distances than other machines (e.g., tractor and forest trailer: 133 m, tractor and winch: 27 m, cable yarder: 142 m). If every machine under investigation would have the same extraction distance, the forwarder would have a higher productivity and even lower GHG emissions than all other options. Shorter distances for extracting wood from the forest site to the next forest road would reduce greenhouse gas emissions [18,20]. Cable yarders have almost the same fuel consumption but extracting the timber in whole-tree method (11.63 m3 h−1) is more productive than the cut-to-length method (8.34 m3 h−1) and therefore GHG emissions are lower (4.17 compared to 5.2 kg CO2 eq. m3). Extracting harvesting residues with a forwarder causes less GHG emissions than extracting with tractor and forest trailer which can be explained by the higher productivity of the forwarder (7.5 m3 h−1 compared to 1.1 m3 h−1).
Transport of timber has the highest GHG emissions within the forest supply chain. This can be explained by the high transportation distances which are 2 × 15 km (full on the forward run and empty on the way back) for tractor and trailer, 2 × 80 km for round wood truck, 2 × 54 km for the wood chips truck, and 227 km (one way) for the railway. If we compare the transportation performance, we can see that for transporting 1 m3 with tractor and trailer an effort of 12 t × km, for the wood chip truck 119 t × km, for the round wood truck 176 t × km, and for the railway 218 t × km is necessary. Nevertheless, because of using more eco-friendly energy sources, the railway has the lowest GHG emissions which is only one third of the emissions of the round wood truck. According to Klein et al. [12], the transportation processes of raw wood increase the range from 7.1 kg for beech split logs, with the shortest transport distance of 5 km to 71.3 kg CO2 eq. m3 for industrial wood and the maximum transportation distance of 250 km. Increasing the capacity of the transport vehicles reduces fuel consumption per volume transported and is therefore helpful for improving the energy efficiency of wood transport [18,51,52].
Based on the findings of the wood supply processes, it is no surprise that harvesting systems composed of chainsaw and tractor are those with the lowest GHG emissions (Figure 2). Other studies have shown that low mechanized harvesting with chainsaw and tractor is not the alternative with the lowest GHG emissions as the productivity of the tractor is much lower compared to a forwarder [12]. Proto et al. [53] analyzed the GHG emission of three different harvesting systems in Italy. The impact was equal with 8.57, 8.04 and 10.46 kg CO2 eq. m3 for the harvesting system with felling and processing with chainsaw and extraction carried out using tractor with winch, skidder, and cable yarder, respectively. The GHG emissions for skidders were very similar to our findings. The environmental impact of a tractor with winch is three times higher and for the cable yarder it is almost twice. It is assumed that the conditions in the Italian study are more difficult than in the Austrian one. Labelle and Lemmer [32] analyzed the impacts of a motor-manual harvesting system with chainsaw and forest tractor and a fully mechanized one with harvester and forwarder in Germany. According to their findings, the fully mechanized system (3.08 kg CO2 eq. m3) had a lower impact over the full rotation period if compared to the motor-manual system (4.42 kg CO2 eq. m3). Similar results were achieved by Haavikko et al. [54] for timber harvesting with harvester and forwarder in Finland. Their calculated CO2 eq. emissions averaged to 4.3 kg CO2 eq. m−3. By cutting method, the highest CO2 eq. emissions were recorded in first-thinning stands (7.3 kg CO2 eq. m−3), and the lowest in final fellings (3.1 kg CO2 eq. m−3).
Big forest enterprises cause on average 26.12 kg CO2 eq. per m3 lower GHG emissions than small-scale forests (26.50 kg CO2 eq. per m3). This is surprising because in small-scale forests the systems with the lowest emissions will be more often used than in big forest enterprises. Chainsaw and tractor and trailer have a share of produced timber of 23% in small forests and 5% in big forest enterprises. The same is true for chainsaw and tractor and winch where the share is 20% in small-scale forests compared to 14% in big forest enterprises. The system with the highest emissions—skidder—has a share of 10% in enterprises and only 4% in small ones. The main reason why enterprises perform better is because they have a higher share of difficult and steep terrain using cable yarders for the extraction. Cable yarder and processor have a better performance than harvester and forwarder, and they are used in 33% of all harvesting operations instead of only 7% in small forests. On the other hand, harvester and forwarder have with 31% a higher share in small forests compared to 20% in big enterprises.
For the forest area in Bavaria in the reference year 2013, an overall weighted mean of GHG emissions for timber harvesting of 9.25 kg CO2 eq. m3 for the most common tree species and assortments was estimated. The expansion of the system to plant gate led to an increased impact on climate change of 18.95 kg CO2 eq. m3 [12]. This value is in line with other studies that cover a larger forest area, for example, Timmermann and Dibdiakova [18]. They calculated average GHG emissions of 17.89 kg CO2 eq. m3 for plant to gate in eastern Norway in 2010. In Austria, timber harvesting and transportation causes GHG emissions of 25.63 kg CO2 eq. per m3. The higher emissions can be explained by the higher share of transport processes within the supply chain which in Austria is 77%, in Bavaria 44% to 53% [12], and in Norway 52% [18].
The findings of global warming potential related to logging activities were analyzed by Gan et al. [9]. GHG emissions of timber supply chains vary between 2.35 and 73.35 kg CO2 eq. m3. However, the comparison of studies is reasonably challenging as there are several aspects that need to be considered, e.g., the harvesting methods used in different regions, the forest management strategies, as well the system boundaries.
As part of this study, two calculation tools were developed in MS Excel including the GHG emission data presented in Section 3.1. The so-called “system calculator” enables the global warming potential to be calculated for a specific supply chain. By entering location and stand data, specific cases can be mapped, and their environmental impacts assessed. This allows a comparison with alternative scenarios and the selection of the most environmentally friendly harvesting system. The so-called “balance calculator” enables the calculation of the global warming potential for a forest district, a forest enterprise, or another defined administrative unit. By entering the quantities for each timber harvesting and transport process, the total GHG emissions for the assortments of round wood, firewood, and forest chips can be easily determined for the respective unit under consideration. Since there is a legal requirement in Austria for larger companies to carry out measures to improve energy efficiency, these tools provide practical assistance. They can be used to make targeted strategic and operational improvements to reduce the global warming potential. The tools have been tested by forest managers and found to be very user-friendly.
Nave et al. [55] conducted a review based on over 400 individual studies and found that there is an average loss of 20% of the soil organic carbon from the forest floor (O horizon) on Spodosols (Podzols) in temperate forests as a result of harvesting while the mineral soil was not significantly influenced. Their results also showed that it will take about 50–70 years to recover this loss [18]. There are also more recent studies that indicate that biogenic CO2 from forest residues that are used for energetic purposes should not be viewed as climate-neutral [18].

5. Conclusions

Greenhouse gas emissions from the wood production chain in Austria were calculated for 1 m3 of wood harvested, extracted, and delivered to plant gate for the reference year 2018. Chainsaw and tractor and trailer were shown to be the most climate-friendly harvesting systems. Nevertheless, this system will be used for less than 20% of the Austrian timber supply. This can be explained by the difficult terrain conditions in Austria where this system is not applicable. Furthermore, this system shows a lack in efficiency and work safety compared to fully mechanized systems (harvester and forwarder). For almost all wood supply processes, the environmental impact was mainly caused by combustion processes of fuel (diesel) from transport vehicles and from heavy forest machines for felling and extracting. The results of the study provide an overview of the environmental impacts of harvesting systems and should motivate forest managers to select more climate-friendly solutions.
The knowledge gained shows that wood is already being provided in a climate-friendly manner and that the desirable goal of climate-neutral provision is getting closer. The results are positive for the forest industry and should at the same time provide even more motivation in order to achieve climate neutrality before all other industries. The road transport of timber had the highest impact on the climate change, and it is absolutely essential to find more climate-friendly solutions from a technical and organizational point of view.
The provision of the raw material wood can be described as climate friendly. Wood can replace fossil fuels or, in the case of material use, materials with a higher negative impact on climate change. However, these positive effects apply only if sustainable forest management is carried out and the carbon stocks in the biomass, organic layers, and mineral soils do not decrease significantly over a longer period of time [3].
An analysis of the real life of forest machines should be considered for future research. There are different opinions on the relevance of considering the forest infrastructure. For this reason, detailed studies on the environmental impacts of forest roads should be carried out considering the effect of terrain conditions and additional wood that can be harvested by opening up forests. Long-term losses of soil carbon after harvesting should be further investigated. A follow-up project will focus on the release of soil organic carbon and greenhouse gases as a result of harvesting and develop measures to improve forestry practices.

Author Contributions

Conceptualization, M.K., I.K. and C.K.; methodology, M.K. and I.K.; software, M.K. and I.K.; validation, M.K., I.K. and C.K.; data curation, M.K. and C.K.; writing—original draft preparation, M.K.; writing—review and editing, C.K. and I.K.; visualization, M.K.; project administration, M.K.; funding acquisition, M.K. and C.K. All authors have read and agreed to the published version of the manuscript.

Funding

This research was funded by Federal Ministry of Agriculture, Regions and Tourism, Austrian Federal Forests PLC and forest enterprise Mayr-Melnhof, grant number 101206.

Institutional Review Board Statement

Not applicable.

Informed Consent Statement

Not applicable.

Data Availability Statement

Most of the data presented in this study are available in: https://dafne.at/projekte/timber-eco-balance (accessed on 29 July 2021). Further data about specific wood supply processes are available on request from the corresponding author.

Acknowledgments

The authors would like to thank the following researchers and master’s students at the Institute of Forest Engineering for their support in data acquisition and data analysis: Albrecht, P., Argnani, A., Eckert, D., Galovits, M., Gruber, P., Holzfeind, T., Kirnbauer, A., Kornberger, M., Meißl, A., Messner, S., Rauscher, S.

Conflicts of Interest

The authors declare no conflict of interest.

Abbreviations

FWCFuel wood for chipping
FWSFuel wood solid
GHGGreenhouse gas
ILCDInternational Life Cycle Data system
IPCCIntergovernmental Panel on Climate Change
LCALife cycle assessment
RWRound wood
CTLCut-to-length method
TLTree-length method
WTWhole-tree method

Appendix A. Input Data for the Inventory Analysis

Appendix A.1. Establishment of Forest Stands

The assumptions for the life cycle inventory for P 1.1 are: According to the Austrian Federal Forests PLC, 10% of the forest area planting was performed and for the rest, which is 90% of the area, natural regeneration was preferred. For planting Norway spruce, plant densities of 2500 plants × ha−1 were suggested. If we consider that only on 10% of the total area planting was necessary, an average plant density of 250 plants × ha−1 was used as input data. The harvested wood during the rotation period was about 1200 m3 × ha−1 [56] which means that for the production of 1 m3 wood 0.2 plants were used from the planting process. The seedlings had a weight of 0.2 kg and were transported over a distance of 200 km twice by car. As it is mainly manual planting, only the production and transport of the plants (two-year-old saplings from the nursery) were taken into account. The LCA values for seedling production in the nursery were derived from [57].
It was assumed that clearing of weed was carried out with a brush cutter before afforestation (P 1.2). The assumptions for the life cycle inventory are: According to the Austrian Federal Forests PLC, on 10% of the total forest area clearing was performed. The productivity for the clearing process was 0.04 ha × h−1. If we consider that only on 7% of the total area clearing was necessary, an average productivity of 0.57 ha × h−1 was used as input data. The harvested wood during the rotation period was 1200 m3 × ha−1 which means that for the production of 684 m3 wood 1 h of clearing was necessary. LCA values for the production and consumption of fuel and lubricants of the brush cutter were derived from [58,59].
Other site preparation processes, for example soil scarification or fertilizing, are not very common in Austrian forests and thus not included for the analysis. In case of natural regeneration, no LCA-relevant forest processes arose.

Appendix A.2. Site Tending

Tending of young stands can be summarized as all measures that are necessary from the time of guaranteed regeneration to the end of thickening at approx. 2 m upper height to raise a high-quality stand. According to Austrian Federal Forests PLC, on 30% of the forest area tending of young stands with brush cutter was performed. The productivity for the process was 0.05 ha × h−1. If we consider that only on 30% of the total area tending of young stands was necessary but has to be performed 2–3 times per year, an average productivity of 0.06 ha × h−1 was used as input data. The harvested wood during the rotation period was 1200 m3 × ha−1 which means that for the production of 72 m3 wood 1 h of tending of young stands was necessary. LCA values for the production and consumption of fuel and lubricants were derived from [58,59].
According to Austrian Federal Forests PLC, on 40% of the forest area tending of thickets stands with chainsaw was performed. The productivity for the process was 0.05 ha × h−1. If we consider that only on 40% of the total area tending of thickets was necessary, an average productivity of 0.125 ha × h−1 was used as input data. For the production of 150 m3 wood 1 h of tending of thickets was necessary. LCA values for the production and consumption of fuel and lubricants were derived from [58,59].
Fencing, fertilization, pesticide, and herbicide application were not relevant for this study, as these procedures are only used in exceptional cases in Austrian forest management and they were expected to have a neglectable impact on the environment for this study. According to [60], road building and maintenance also have a small influence on the environmental impacts and were therefore not included.

Appendix A.3. Harvesting

For the chainsaw, a service life of 2500 h, a fuel consumption of 0.97 L × h−1 and lubricant consumption of 0.39 L × h−1 were assumed [61]. The productivity for chainsaw operations was calculated according to the models developed by [61] and was in average 12.5 m3 × h−1 for felling (P 3.1), 8 m3 × h−1 for felling and delimbing (P 3.2), 5.5 m3 × h−1 for felling, delimbing and crosscutting (P 3.3), and 16 m3 × h−1 for crosscutting only (P 3.18).
For harvester operations (P 3.4), a 200-kW harvester with a service life of 17,600 h, a weight of 22,900 kg, and a fuel consumption of 40 L × h−1 was modeled [62]. According to Austrian Federal Forests PLC, the consumption of hydraulic and motor oil amounts to 0.35 L × h−1, the consumption of chain oil to 0.41 L × h−1. For the transfer of harvesters by trailer a value of 38.7 t × km × h−1 and 0.035 h × h−1 if moving on its own was assumed, respectively. Harvester productivity was calculated using the model by [62] and was on average 27 m3 × h−1.
For winch-assisted harvester operations (P 3.5), a 145-kW harvester with a service life of 17,600 h, a weight of 20,000 kg, and a fuel consumption of 19.8 L × h−1 was considered. According to Austrian Federal Forests PLC, the consumption of hydraulic and motor oil sums up to 0.35 L × h−1, the consumption of chain oil to 0.41 L × h−1, the transfer of the winch-assisted harvester to 33.8 t × km × h−1 by trailer, and 0.035 h × h−1 by its own, respectively. Harvester productivity was calculated using the model by [63] and was on average 14 m3 × h−1.
For the extraction of round wood with tractor and forest trailer (P 3.6), a 77-kW tractor with a service life of 7000 h and a weight of 3000 kg was modeled. According to [64], the tractor and trailer had a fuel consumption of 0.31 L × m−3. Productivity was calculated using the model by [64] and reached on average 7.59 m3 × h−1. For the extraction of harvesting residues (P 3.7), the same tractor and trailer was used. The productivity of the extraction process was much lower due to a lower bulk density with a value of 1.08 m3 × h−1.
For the extraction of round wood with skidder (P 3.8), a skidder with a service life of 17,600 h, a weight of 10,000 kg, and a fuel consumption of 8 L × h−1 was assumed. According to Austrian Federal Forests PLC, the consumption of hydraulic and motor oil accounted for 0.38 L × h−1, the transfer of the machine 14.7 t × km × h−1 by trailer, and 0.008 h × h−1 by its own, respectively. Skidder productivity was calculated using data of the Austrian Federal Forests PLC and was on average 4.3 m3 × h−1. The same data were used when modeling extraction of trees with skidder (P 3.9).
For the extraction of trees with tractor and winch (P 3.10), a 73-kW tractor with a service life of 7000 h and a weight of 12,000 kg was considered. According to [65], the tractor and winch had a fuel consumption of 0.51 L × m−3. Productivity was calculated using the model by [65] and was on average 4.96 m3 × h−1. The same dataset was used when modeling extraction of round wood (P 3.11).
For the extraction of trees with a cable yarder and delimbing and crosscutting with processor (P 3.12), a cable yarder and processor mounted on a 324-kW truck with a service life of 25,000 h and a weight of 30,000 kg was assumed. According to the company Mayr-Melnhof and Austrian Federal Forests PLC, the consumption of hydraulic and motor oil amounted to 0.37 L × h−1, the consumption of chain oil 0.33 L × h−1, the transfer on its own 0.042 h × h−1. Productivity was calculated using data of forest enterprise Mayr-Melnhof and was on average 11.6 m3 × h−1.
For the extraction of round wood with a forwarder (P 3.14), a 136-kW forwarder with a service life of 17,600 h, a weight of 18,100 kg, and a fuel consumption of 11.6 L × h−1 was modeled. According to Austrian Federal Forests PLC, the transfer of the machine added up to 28.2 t × km × h−1 by trailer and 0.02 h × h−1 when moving on its own, respectively. Productivity was calculated using the model by [65] and amounts in average to 16.15 m3 × h−1. For the extraction of harvesting residues (P 3.15), the same forwarder was used. The productivity of the extraction process was much lower with a value of 7.5 m3 × h−1.
For the extraction of round wood with a winch-assisted forwarder (P 3.16), a 145-kW winch-assisted forwarder with a service life of 17,600 h, a weight of 12,500 kg, and a fuel consumption of 11.6 L × h−1 was calculated. According to Austrian Federal Forests PLC, the transfer of the machine amounted to 19.5 t × km × h−1 by trailer and 0.02 h × h−1 on its own, respectively. Productivity was calculated using the model by [66] and was on average 12.4 m3 × h−1.
For the extraction of round wood with a cable yarder (P 3.17), a 175-kW cable yarder with a service life of 25,000 h, a weight of 13,500 kg, and a fuel consumption of 12 L × h−1 was modeled. According to Austrian Federal Forests PLC, the consumption of hydraulic and motor oil averaged out at 0.25 L × h−1 and the transfer of the machine on its own 0.02 h × h−1. Productivity was calculated using the model by [67] and added up on average to 8.3 m3 × h−1.
For delimbing and crosscutting with processor (P 3.19), a 120-kW excavator with a service life of 17,600 h, a weight of 20,000 kg, and a fuel consumption of 18.7 L × h−1 was modeled. According to Austrian Federal Forests PLC, the consumption of hydraulic and motor oil averaged out at 0.37 L × h−1, the consumption of chain oil 0.33 L × h−1, the transfer of the machine 47.4 t × km × h−1 by trailer, and 0.096 h × h−1 on its own, respectively. Productivity was calculated using data of Austrian Federal Forests PLC and was on average 13 m3 × h−1.
For chipping energy wood (P 3.20), a chipper mounted on a 353-kW truck with a service life of 15,000 h, a weight of 22,000 kg, and a fuel consumption of 40.5 L × h−1 was assumed. According to [68], the consumption of hydraulic and motor oil sums up to 0.92 L × h−1 and to 137.5 t × km × h−1 when assuming a self-driven transfer. Productivity was calculated using the model by [69] and was on average 26.8 m3 × h−1.

Appendix A.4. Transport

For the transport of round wood with tractor and trailer (P 4.1), a 77-kW tractor with a service life of 7000 h and a weight of 3000 kg and a small agricultural trailer with a service life of 1200 h and a weight of 1500 kg was assumed. The payload was 10 t, and the average fuel consumption was 1.25 L × h−1. Average transportation distance was 2 × 15 km which considers a utilization rate of 50% based on a full trailer from the forest to the mill gate and empty on the way back [70]. For the transport of round wood with round wood truck (P 4.2), a 350-kW truck with a service life of 540,000 km, a payload of 22 t, and an average fuel consumption of 77 L × 100 km−1 [71] was used. Average transportation distance was 2 × 80 km which considers a utilization rate of 50%. For the transport by railway (P 4.3), a payload of 60 t per wagon and a transportation distance of 227 km was considered.
For the transport of wood chips with tractor and trailer (P 4.4), the same tractor as in P 4.1 and a trailer with a payload of 16 loose m3 (6.4 solid m3) was used. The average transportation distance was also 2 × 15 km. For the transport of wood chips with truck (P 4.2), a 350-kW truck with a service life of 540,000 km, a payload of 25 t, and an average fuel consumption of 50 L × 100 km−1 [69] was used. Average transportation distance was 2 × 54 km which considers a utilization rate of 50%.
According to Austrian Federal Forests PLC, for the harvesting of 70,000 m3 of wood, transportation of staff by car (P 4.6) of 21,879 km is necessary. For the utilization of 1 m3 of wood, a distance of 0.313 km is necessary.

References

  1. Santos, A.; Carvalho, A.; Barbosa-Póvoa, A.P.; Marques, A.; Amorim, P. Assessment and optimization of sustainable forest wood supply chains—A systematic literature review. For. Policy Econ. 2019, 105, 112–135. [Google Scholar] [CrossRef]
  2. Simons-Legaard, E.; Legaard, K.; Weiskittel, A. Projecting complex interactions between forest harvest and succession in the northern Acadian Forest Region. Ecol. Model. 2021, 456, 109657. [Google Scholar] [CrossRef]
  3. Michelsen, O.; Cherubini, F.; Hammer Strømman, A. Impact Assessment of Biodiversity and Carbon Pools from Land Use and Land Use Changes in Life Cycle Assessment, Exemplified with Forestry Operations in Norway. J. Ind. Ecol. 2021, 16, 231–242. [Google Scholar] [CrossRef]
  4. Stott, T.A. Do riparian buffer zones and new forest management practices reduce stream suspended sediment loads?: Re-visiting the Afon Tanllwyth in Hafren Forest, Plynlimon, 20 years on. Soil Use Manag. 2021, 37, 921–935. [Google Scholar] [CrossRef]
  5. Allen, A.; Chapman, D. Impacts of afforestation on groundwater resources and quality. Hydrogeol. J. 2001, 9, 390–400. [Google Scholar] [CrossRef]
  6. Piirainen, S.; Finér, L.; Starr, M. Changes in forest floor and mineral soil carbon and nitrogen stocks in a boreal forest after clear-cutting and mechanical site preparation. Eur. J. Soil Sci. 2015, 66, 735–743. [Google Scholar] [CrossRef]
  7. Hayat, W.; Khan, S.; Hayat, M.T.; Pervez, R.; Ahmad, S.; Iqbal, A. The effect of deforestation on soil quality in Lesser-Himalayan community forests of Abbottabad, Pakistan. Arab. J. Geosci. 2021, 14, 1919. [Google Scholar] [CrossRef]
  8. Xie, S.H.; Kurz, W.A.; McFarlane, P.N. Inward- versus outward-focused bioeconomy strategies for British Columbia’s forest products industry: A harvested wood products carbon storage and emission perspective. Carbon Balance Manag. 2021, 16, 30. [Google Scholar] [CrossRef]
  9. Gan, K.S.; Zairul, A.R.; Geetha, R.; Khairul, M. Life cycle assessment on log harvesting from natural forest in peninsular Malaysia. J. Trop. For. Sci. 2021, 33, 213–223. [Google Scholar] [CrossRef]
  10. Stocker, T.; Qin, D.; Plattner, G.; Tignor, M.; Allen, S.; Boschung, J.; Nauels, A.; Xia, Y.; Bex, V.; Midgley, P. IPCC, 2013: Summary for Policymakers in Climate Change 2013: The Physical Science Basis, Contribution of Working Group I to the Fifth Assessment Report of The Intergovernmental Panel on Climate Change; Cambridge University Press: Cambridge, UK; New York, NY, USA, 2013. [Google Scholar]
  11. Federal Ministry of Agriculture, Regions and Tourism. Long-Term Strategy 2050—Austria; Federal Ministry of Agriculture, Regions and Tourism: Vienna, Austria, 2019; p. 140.
  12. Klein, D.; Wolf, C.; Schukz, C.; Weber-Blaschke, G. Environmental impacts of various biomass supply chains for the provision of raw wood in Bavaria, Germany, with focus on climate change. Sci. Total Environ. 2016, 539, 45–60. [Google Scholar] [CrossRef] [PubMed]
  13. Berg, S.; Lindholm, E.L. Energy use and environmental impacts of forest operations in Sweden. J. Clean. Prod. 2005, 13, 33–42. [Google Scholar] [CrossRef]
  14. Klein, D.; Wolf, C.; Weber-Blaschke, G.; Schulz, C. 20 years of life cycle assessment (LCA) in the forestry sector: State of the art and a methodical proposal for the LCA of forest production. Int. J. Life Cycle Assess. 2015, 20, 556–575. [Google Scholar] [CrossRef]
  15. EN ISO 14040; Environmental Management—Life Cycle Assessment—Principles and Framework. European Committee for Standardization: Brussels, Belgium, 2009; p. 40.
  16. Laschi, A.; Marchi, E.; González-García, S. Forest operations in coppice: Environmental assessment of two different logging methods. Sci. Total Environ. 2016, 562, 493–503. [Google Scholar] [CrossRef]
  17. Heinimann, H.R. Life Cycle Assessment (LCA) in forestry—state and perspectives. Croat. J. For. Eng. 2012, 33, 357–372. [Google Scholar]
  18. Timmermann, H.; Dibdiakova, J. Greenhouse gas emissions from forestry in East Norway. Int. J. Life Cycle Assess. 2014, 19, 1593–1606. [Google Scholar] [CrossRef]
  19. Iordan, C.M.; Verones, F.; Cherubini, F. Integrating impacts on climate change and biodiversity from forest harvest in Norway. Ecol. Indic. 2018, 89, 411–421. [Google Scholar] [CrossRef]
  20. Michelsen, O.; Solli, C.; Strømman, A.H. Environmental impact and added value in forestry operations in Norway. J. Ind. Ecol. 2008, 12, 69–81. [Google Scholar] [CrossRef]
  21. Dias, C.A. Life cycle assessment of fuel chip production from eucalypt forest residues. Int. J. Life Cycle Assess. 2014, 19, 705–717. [Google Scholar] [CrossRef]
  22. González-García, S.; Dias, A.C.; Feijoo, G.; Moreira, M.T.; Arroja, L. Divergences on the environmental impact associated to the production of maritime pine wood in Europe: French and Portuguese case studies. Sci. Total Environ. 2014, 472, 324–337. [Google Scholar] [CrossRef] [PubMed]
  23. González-García, S.; Dias, A.C.; Arroja, L. Life-cycle assessment of typical Portuguese cork oak woodlands. Sci. Total Environ. 2013, 452–453, 355–364. [Google Scholar] [CrossRef]
  24. Murphy, F.; Delvin, G.; McDonnell, K. Forest biomass supply chains in Ireland: A life cycle assessment of GHG emissions and primary energy balances. Appl. Energy 2014, 116, 1–8. [Google Scholar] [CrossRef] [Green Version]
  25. Routa, J.; Kellomäki, S.; Kilpeläinen, A.; Peltola, H.; Strandman, H. Effects of forest management on the carbon dioxide emissions of wood energy in integrated production of timber and energy biomass. Glob. Chang. Biol. Bioenergy 2011, 3, 483–497. [Google Scholar] [CrossRef]
  26. Berg, S.; Karjalainen, T. Comparison of greenhouse gas emissions from forest operations in Finland and Sweden. Forestry 2003, 76, 271–284. [Google Scholar] [CrossRef]
  27. Mirabella, N.; Castellani, V.; Sala, S. Forestry operations in the alpine context. Life cycle assessment to support the integrated assessment of forest wood short supply chain. Int. J. Life Cycle Assess. 2014, 19, 1524–1535. [Google Scholar] [CrossRef]
  28. Valente, C.; Spinelli, R.; Hillring, B.G. LCA of environmental and socio-economic impacts related to wood energy production in alpine conditions: Valle di Fiemme (Italy). J. Clean. Prod. 2011, 19, 1931–1938. [Google Scholar] [CrossRef]
  29. González-García, S.; Bacenetti, J.; Murphy, R.J.; Fiala, M. Present and future environmental impact of poplar cultivation in the Po Valley (Italy) under different crop management systems. J. Clean. Prod. 2012, 26, 56–66. [Google Scholar] [CrossRef]
  30. Pierobon, F.; Zanetti, M.; Grigolato, S.; Sgarbossa, A.; Anfodillo, T.; Cavalli, R. Life cycle environmental impact of firewood production—A case study in Italy. Appl. Energy 2015, 150, 185–195. [Google Scholar] [CrossRef]
  31. San Miguel, G.; Corona, B.; Ruiz, D.; Landholm, D.; Laina, R.; Tolosana, E.; Sixto, H.; Cañellas, I. Environmental, energy and economic analysis of a biomass supply chain based on a poplar short rotation coppice in Spain. J. Clean. Prod. 2015, 94, 93–101. [Google Scholar] [CrossRef]
  32. Labelle, E.R.; Lemmer, K.J. Selected Environmental Impacts of Forest Harvesting Operations with Varying Degree of Mechanization. Croat. J. For. Eng. 2019, 40, 239–257. [Google Scholar] [CrossRef]
  33. González-García, S.; Krowas, I.; Becker, G.; Feijoo, G.; Moreira, M.T. Cradle-to-gate life cycle inventory and environmental performance of Douglas-fir roundwood production in Germany. J. Clean. Prod. 2013, 54, 244–252. [Google Scholar] [CrossRef]
  34. White, M.K.; Gower, S.T.; Ahl, D.E. Life cycle inventories of roundwood production in northern Wisconsin: Inputs into an industrial forest carbon budget. For. Ecol. Manag. 2005, 219, 13–28. [Google Scholar] [CrossRef] [Green Version]
  35. Sonne, E. Greenhouse gas emissions from forestry operations: A life cycle assessment. J. Environ. Qual. 2006, 35, 1439–1450. [Google Scholar] [CrossRef]
  36. Quinn, R.J.; Ha, H.; Volk, T.A.; Brown, T.R.; Bick, S.; Malmsheimer, R.W.; Fortier, M.-O.P. Life cycle assessment of forest biomass energy feedstock in the Northeast United States. GCB Bioenergy 2020, 12, 728–741. [Google Scholar] [CrossRef]
  37. Oneil, E.E.; Johnson, L.R.; Lippke, B.R.; McCarter, J.B.; McDill, M.E.; Roth, P.A.; Finley, J.C. Life-cycle impacts of inland northwest and northeast/north central forest resources. Wood Fiber Sci. 2010, 42, 29–51. [Google Scholar]
  38. Saud, P.; Wang, J.; Lin, W.; Sharma, B.D.; Hartley, D.S. A life cycle analysis of forest carbon balance and carbon emissions of timber harvesting in West Virginia. Wood Fiber Sci. 2013, 45, 19. [Google Scholar]
  39. Abbas, D.; Handler, R.M. Life-cycle assessment of forest harvesting and transportation operations in Tennessee. J. Clean. Prod. 2018, 176, 512–520. [Google Scholar] [CrossRef]
  40. Eshun, J.F.; Potting, J.; Leemans, R. Inventory analysis of the timber industry in Ghana. Int. J. Life Cycle Assess. 2010, 15, 715–725. [Google Scholar] [CrossRef] [Green Version]
  41. Kinjo, M.; Ohuchi, T.; KII, H.; Murase, Y. Studies on Life Cycle Assessment of Sugi Lumber. J. Fac. Agric. 2005, 50, 343–351. [Google Scholar] [CrossRef]
  42. Morales, M.; Aroca, G.; Rubilar, R.; Acuña, E.; Mola-Yudego, B.; González-García, S. Cradle-to-gate life cycle assessment of Eucalyptus globulus short rotation plantations in Chile. J. Clean. Prod. 2015, 99, 239–249. [Google Scholar] [CrossRef]
  43. Bacenetti, J.; Pessina, D.; Fiala, M. Environmental assessment of different harvesting solutions for short rotation coppice plantations. Sci. Total Environ. 2016, 541, 210–217. [Google Scholar] [CrossRef]
  44. González-García, S.; Dias, A.C.; Clermidy, S.; Benoist, A.; Bellon Maurel, V.; Gasol, C.M.; Gabarrell, X.; Arroja, L. Comparative environmental and energy profiles of potential bioenergy production chains in Southern Europe. J. Clean. Prod. 2014, 76, 42–54. [Google Scholar] [CrossRef]
  45. Weiss, P.; Braschel, N.; Braun, M.; Büchsenmeister, R.; Freudenschuß, A.; Fritz, D.; Gschwantner, T.; Jandl, R.; Ledermann, T.; Neumann, M.; et al. Greenhouse Gas Emissions of the Austrian Wood Value Chain [Treibhausgasbilanz der Österreichischen Wertschöpfungskette Holz]; CCCA Fact Sheet #15; Climate Change Centre Austria: Graz, Austria, 2016. [Google Scholar] [CrossRef]
  46. Federal Ministry of Agriculture, Regions and Tourism. Annual Timber Volumes 2018 [Holzeinschlagsmeldung 2018]. 2021. Available online: https://info.bmlrt.gv.at/themen/wald/wald-in-oesterreich/wald-und-zahlen/holzeinschlag2018.html (accessed on 26 July 2021).
  47. European Commission. Recommendations for Life Cycle Impact Assessment in the European context-based on existing environmental impact assessment models and factors. In International Reference Life Cycle Data System (ILCD) Handbook; Publications Office of the European Union: Luxembourg, 2011; p. 159. [Google Scholar] [CrossRef]
  48. Intergovernmental Panel on Climate Change (IPCC). Contribution of Working Group I to the Fourth Assessment Report of the Intergovernmental Panel on Climate Change. In The Physical Science Basis; Cambridge University: Cambridge, UK, 2007; p. 996. [Google Scholar]
  49. EN ISO 14044; Environmental Management—Life Cycle Assessment—Requirements and Guidelines. European Committee for Standardization: Brussels, Belgium, 2006; p. 80.
  50. Kühmaier, M.; Stampfer, K. Development of a Multi-Attribute Spatial Decision Support System in Selecting Timber Harvesting Systems. Croat. J. For. Eng. 2010, 31, 75–88. [Google Scholar]
  51. Palander, T.; Haavikko, H.; Kortelainen, E.; Kärhä, K. Comparison of Energy Efficiency Indicators of Road Transportation for Modeling Environmental Sustainability in “Green” Circular Industry. Sustainability 2020, 12, 2740. [Google Scholar] [CrossRef] [Green Version]
  52. Palander, T.; Haavikko, H.; Kortelainen, E.; Kärhä, K.; Borz, S.A. Improving Environmental and Energy Efficiency in Wood Transportation for a Carbon-Neutral Forest Industry. Forests 2020, 11, 1194. [Google Scholar] [CrossRef]
  53. Proto, A.; Bacenetti, J.; Macri, G.; Fiala, M.; Zimbalatti, G. Mechanisation of Different Logging Operations: Environmental Impact Assessment using Life Cycle Assessment (LCA) Approach. Chem. Eng. Trans. 2017, 58, 229–234. [Google Scholar] [CrossRef]
  54. Haavikko, H.; Kärhä, K.; Poikela, A.; Korvenranta, M.; Palander, T. Fuel Consumption, Greenhouse Gas Emissions, and Energy Efficiency of Wood-Harvesting Operations: A Case Study of Stora Enso in Finland. Croat. J. For. Eng. 2022, 43, 79–97. [Google Scholar] [CrossRef]
  55. Nave, L.E.; Vance, E.D.; Swanston, C.W.; Curtis, P.S. Harvest impacts on soil carbon storage in temperate forests. For. Ecol. Manag. 2010, 259, 857–866. [Google Scholar] [CrossRef]
  56. Dressler, D.; Engelmann, K.; Bosch, F.; Böswirth, T.; Bryzinski, T.; Effenberger, M.; Haas, R.; Hijazi, O.; Hülsbergen, K.J.; Jorissen, T.; et al. ExpRessBio—Results, Analysis and Evaluation of Selected Ecological and Economic Impacts of Product Systems from Agricultural and Forestry Raw Materials [ExpRessBio—Ergebnisse, Analyse und Bewertung Ausgewählter Ökologischer und Ökonomischer Wirkungen von Produktsystemen aus Land- und Forstwirtschaftlichen Rohstoffen]; Final Report 2016; Technologie- und Förderzentrum im Kompetenzzentrum für Nachwachsende Rohstoffe (TFZ): Straubing, Germany, 2016; p. 722. [Google Scholar]
  57. Aldentum, Y. Life cycle inventory of forest seedling production—From seed to regeneration site. J. Clean. Prod. 2002, 10, 47–55. [Google Scholar] [CrossRef]
  58. Nonroad Database. Available online: https://www.bafu.admin.ch/bafu/en/home/topics/air/state/non-road-datenbank.html (accessed on 29 July 2021).
  59. Forstmaschinen Database. Available online: https://bfw.ac.at/fmdb (accessed on 29 July 2021).
  60. Whittaker, C.; Mortimer, N.; Murphy, R.; Matthews, R. Energy and greenhouse gas balance of the use of forest residues for bioenergy production in the UK. Biomass Bioenergy 2011, 35, 4581–4594. [Google Scholar] [CrossRef] [Green Version]
  61. Albrecht, P. Chainsaw 4.0—From the Classic Productivity Study to Electronic Fuel and Runtime Analysis [Motorsäge 4.0—von der Klassischen Produktivitätsstudie zur Elektronischen Treibstoff- und Laufzeitenanalyse]. Master’s Thesis, University of Natural Resources and Life Sciences Vienna, Wien, Austria, 2018; p. 72. [Google Scholar]
  62. Messner, S. Debarking with the Harvester Head in Spruce Thinnings [Entrindung mit dem Harvesteraggregat in Fichten Durchforstungsbeständen]. Master’s Thesis, University of Natural Resources and Life Sciences Vienna, Wien, Austria, 2019; p. 82. [Google Scholar]
  63. Brandtner, N. Productivity Study of the John Deere 1170E Winch-Assisted Harvester [Produktivitätsevaluierung des seilgestützten Harvesters John Deere 1170E]. Master’s Thesis, University of Natural Resources and Life Sciences Vienna, Wien, Austria, 2018; p. 49. [Google Scholar]
  64. Gruber, P. Development of a Productivity and Fuel Consumption Model for Extracting with a Tractor and Trailer [Erstellung eines Produktivitäts- und Treibstoffverbrauchsmodell für die Rückung mittels Traktorkrananhänger]. Master’s Thesis, University of Natural Resources and Life Sciences Vienna, Wien, Austria, 2018; p. 62. [Google Scholar]
  65. Kirnbauer, A. Extracting with a Tractor and Winch—Productivity and Fuel Consumption [Rückung mit Traktor und Seilwinde —Produktivität und Treibstoffverbrauch]. Master’s Thesis, University of Natural Resources and Life Sciences Vienna, Wien, Austria, 2018; p. 73. [Google Scholar]
  66. Gruber, P. Productivity and Fuel Consumption of the John Deere 1210E Winch-Assisted Forwarder [Produktivität und Treibstoffverbrauch des Seilforwarders John Deere 1210E]; University of Natural Resources and Life Sciences Vienna: Wien, Austria, 2018. [Google Scholar]
  67. Stampfer, K.; Limbeck-Lilienau, B. CONES—Computer-Aided Decision Support for Timber Harvesting in Steep Terrain—Models for Cable Yarding in Mountain Forests [CONES—Computergestützte Entscheidungshilfe für Nutzungseingriffe im Seilgelände—Modelle für die Seilrückung im Gebirge]; University of Natural Resources and Life Sciences Vienna: Wien, Austria, 2003; p. 5. [Google Scholar]
  68. Klvac, R.; Ward, S.; Owende, P.M.O.; Lyons, J. Energy audit of wood harvesting systems. Scand. J. For. Res. 2003, 18, 176–183. [Google Scholar] [CrossRef]
  69. Holzleitner, F.; Kanzian, C.; Höller, N. Monitoring the chipping and transportation of wood fuels with a fleet management system. Silva Fenn. 2003, 47, 11. [Google Scholar] [CrossRef] [Green Version]
  70. Obkirchner, C.; Lengwenat, E.; Ohnesorge, D. Greenhouse Gas Emissions of Timber Trucking in Germany Considering an Increase of the Gross Vehicle Weight [Treibhausgasbilanz von Lkw-Rohholztransporten in Deutschland unter Berücksichtigung einer Erhöhung des zulässigen Gesamtgewichts]; Working Reports of the Chair for Forest Economics at the Technical University of Munich; Technical University of Munich: Munich, Germany, 2013; p. 63. [Google Scholar]
  71. Holzleitner, F.; Kanzian, C.; Stampfer, K. Analyzing time and fuel consumption in road transport of round wood with an onboard fleet manager. Eur. J. For. Res. 2011, 130, 293–301. [Google Scholar] [CrossRef]
Figure 1. The wood supply chain including all relevant production processes from seedling production to plant gate.
Sustainability 14 00792 g001
Figure 2. Average GHG emissions of most common harvesting systems in Austria.
Sustainability 14 00792 g002
Figure 3. Share of GHG emissions of the most common timber supply chains in Austria.
Sustainability 14 00792 g003
Table 1. Harvested timber volumes and harvesting systems in Austria in the year 2018. Codes represent the harvesting and transport processes visualized in Figure 1, whereas codes starting with 3 represent harvesting and 4 represent transport.
CodeHarvesting SystemAmount [m3]Assortments
3.1Felling with chainsaw6,554,789RW, FWS
3.2Felling and delimbing with chainsaw3,473,843RW, FWS
3.3Felling, delimbing, and crosscutting with chainsaw2,523,909RW, FWS
3.4Felling, delimbing, and crosscutting with harvester3,282,239RW, FWS
3.5Felling, delimbing, and crosscutting with cable harvester435,729RW, FWS
3.6Extracting round wood with tractor and forest trailer1,584,551RW, FWS
3.7Extracting harvesting residues with tractor and forest trailer155,820FWC
3.8Extracting round wood with skidder874,994RW, FWS
3.9Extracting trees with skidder1,166,659RW, FWS
3.10Extracting trees with tractor and winch583,329RW, FWS
3.11Extracting round wood with tractor and winch3,208,312RW, FWS
3.12Extracting trees with cable yarder and processing trees with processor2,754,633RW, FWS
3.13Extracting round wood with wood pick298,668RW, FWS
3.14Extracting round wood with forwarder4,436,743RW, FWS
3.15Extracting harvesting residues with forwarder1,912,506FWC
3.16Extracting round wood with winch-assisted forwarder316,910RW, FWS
3.17Extracting round wood with cable yarder306,070RW, FWS
3.18Crosscutting with chainsaw3,587,265RW, FWS
3.19Delimbing and crosscutting with excavator-processor1,339,546RW, FWS
3.20Chipping fuel wood with chipper mounted on truck2,921,548FWC
4.1Transporting round wood with tractor and trailer2,440,576RW, FWS
4.2Transporting round wood with round wood truck10,575,832RW, FWS
4.3Transporting round wood with railway3,254,102RW, FWS
4.4Transporting chips with tractor and trailer438,232FWC
4.5Transporting chips with truck2,483,315FWC
Table 2. Average GHG emissions of site preparation and tending.
CodeWood Supply Process—Site Preparation and TendingGHG Emissions [kg CO2 eq. m3]
1.1Production of seedlings, transport to forest, and planting0.01
1.2Clearing of weed with brush cutter0.004
2.1Tending of young stands with brush cutter0.03
2.2Tending of thickets with chainsaw0.09
Table 3. Average GHG emissions of felling, delimbing, and crosscutting processes.
CodeWood Supply Process—Felling, Delimbing and CrosscuttingGHG Emissions [kg CO2 eq. m3]
3.1Felling with chainsaw0.11
3.2Felling and delimbing with chainsaw0.15
3.3Felling, delimbing, and crosscutting with chainsaw0.26
3.4Felling, delimbing, and crosscutting with harvester3.40
3.5Felling, delimbing, and crosscutting with winch-assisted harvester5.27
3.18Crosscutting with chainsaw0.11
3.19Delimbing and crosscutting with excavator-processor5.53
Table 4. Average GHG emissions of extracting processes.
CodeWood Supply Process—Extracting ProcessesGHG [kg CO2 eq. m3]
3.6Extracting round wood with tractor and forest trailer2.04
3.8Extracting round wood with skidder (CTL)7.91
3.9Extracting trees with skidder7.91
3.10Extracting trees with tractor and winch2.40
3.11Extracting round wood with tractor and winch2.40
3.12Extracting trees with cable yarder and processing trees with processor4.17
3.13Extracting round wood with wood pick0.00
3.14Extracting round wood with forwarder3.07
3.16Extracting round wood with winch-assisted forwarder3.68
3.17Extracting round wood with cable yarder (CTL)5.20
Table 5. Average GHG emissions of fuel wood supply processes.
CodeWood Supply Process—Fuel Wood SupplyGHG Emissions [kg CO2 eq. m3]
3.7Extracting harvesting residues with tractor and forest trailer14.28
3.15Extracting harvesting residues with forwarder6.60
3.20Chipping fuel wood with chipper mounted on truck6.42
4.4Transporting chips with tractor and trailer16.63
4.5Transporting chips with truck17.46
Table 6. Average GHG emissions of timber transport.
CodeWood Supply Process—Timber TransportGHG Emissions [kg CO2 eq. m3]
4.1Transporting round wood with tractor and trailer9.50
4.2Transporting round wood with round wood truck26.95
4.3Transporting round wood with railway9.39
Publisher’s Note: MDPI stays neutral with regard to jurisdictional claims in published maps and institutional affiliations.

