
Application of Value Stream Mapping in E-Commerce: A Case Study on an Amazon Retailer


Abstract
1. Introduction
2. Literature Review
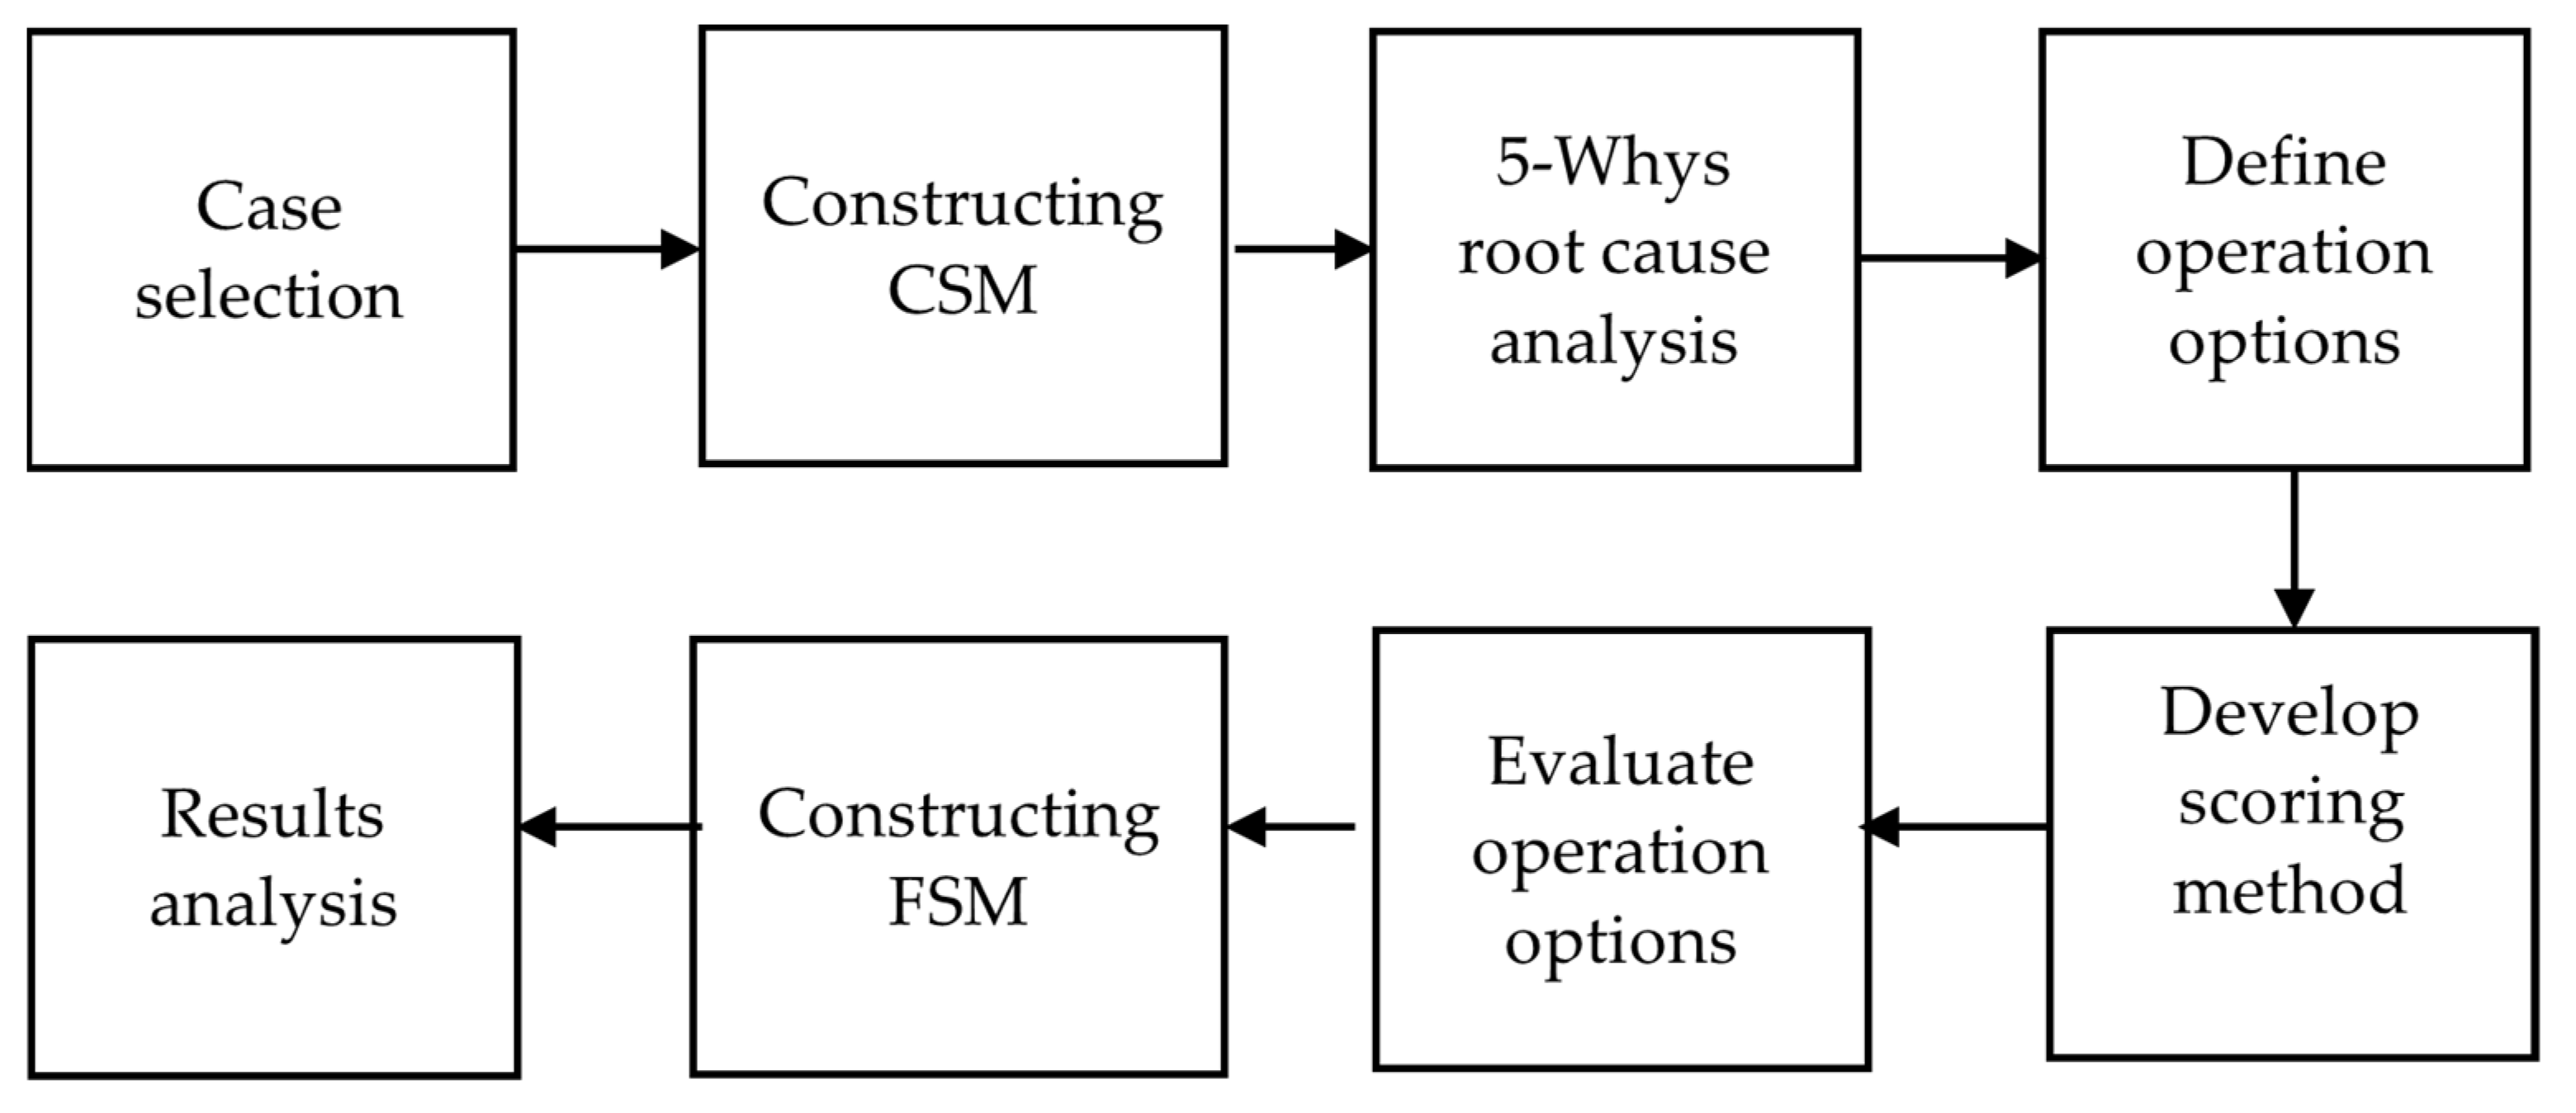
3. Methodology
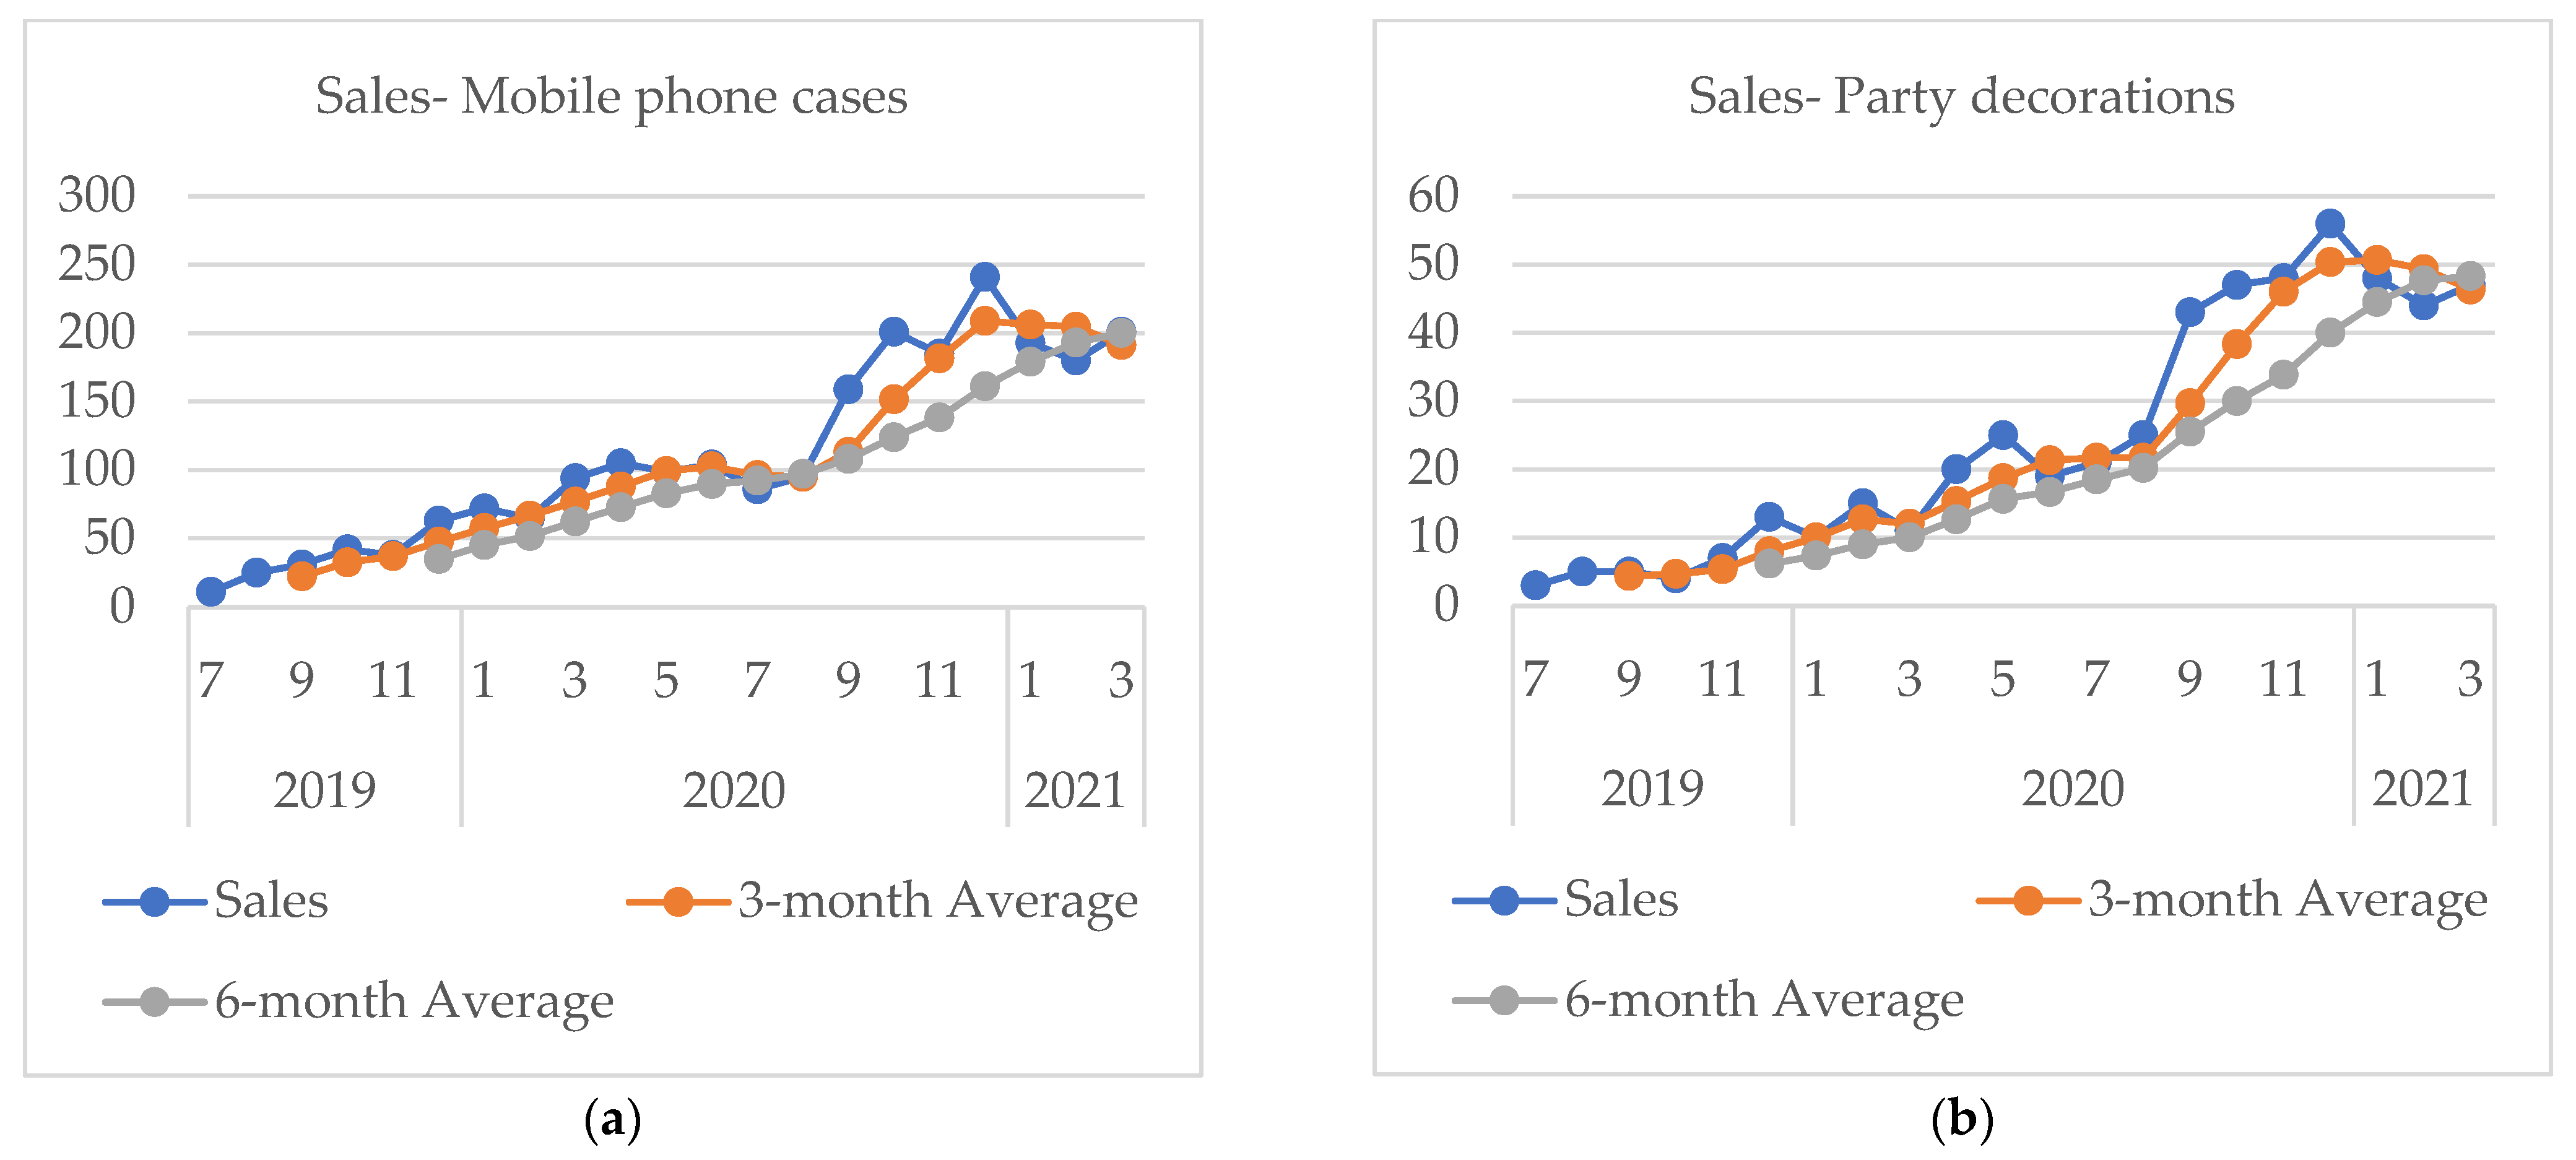
3.1. Case Selection
3.2. Value Stream Mapping
4. Case Study
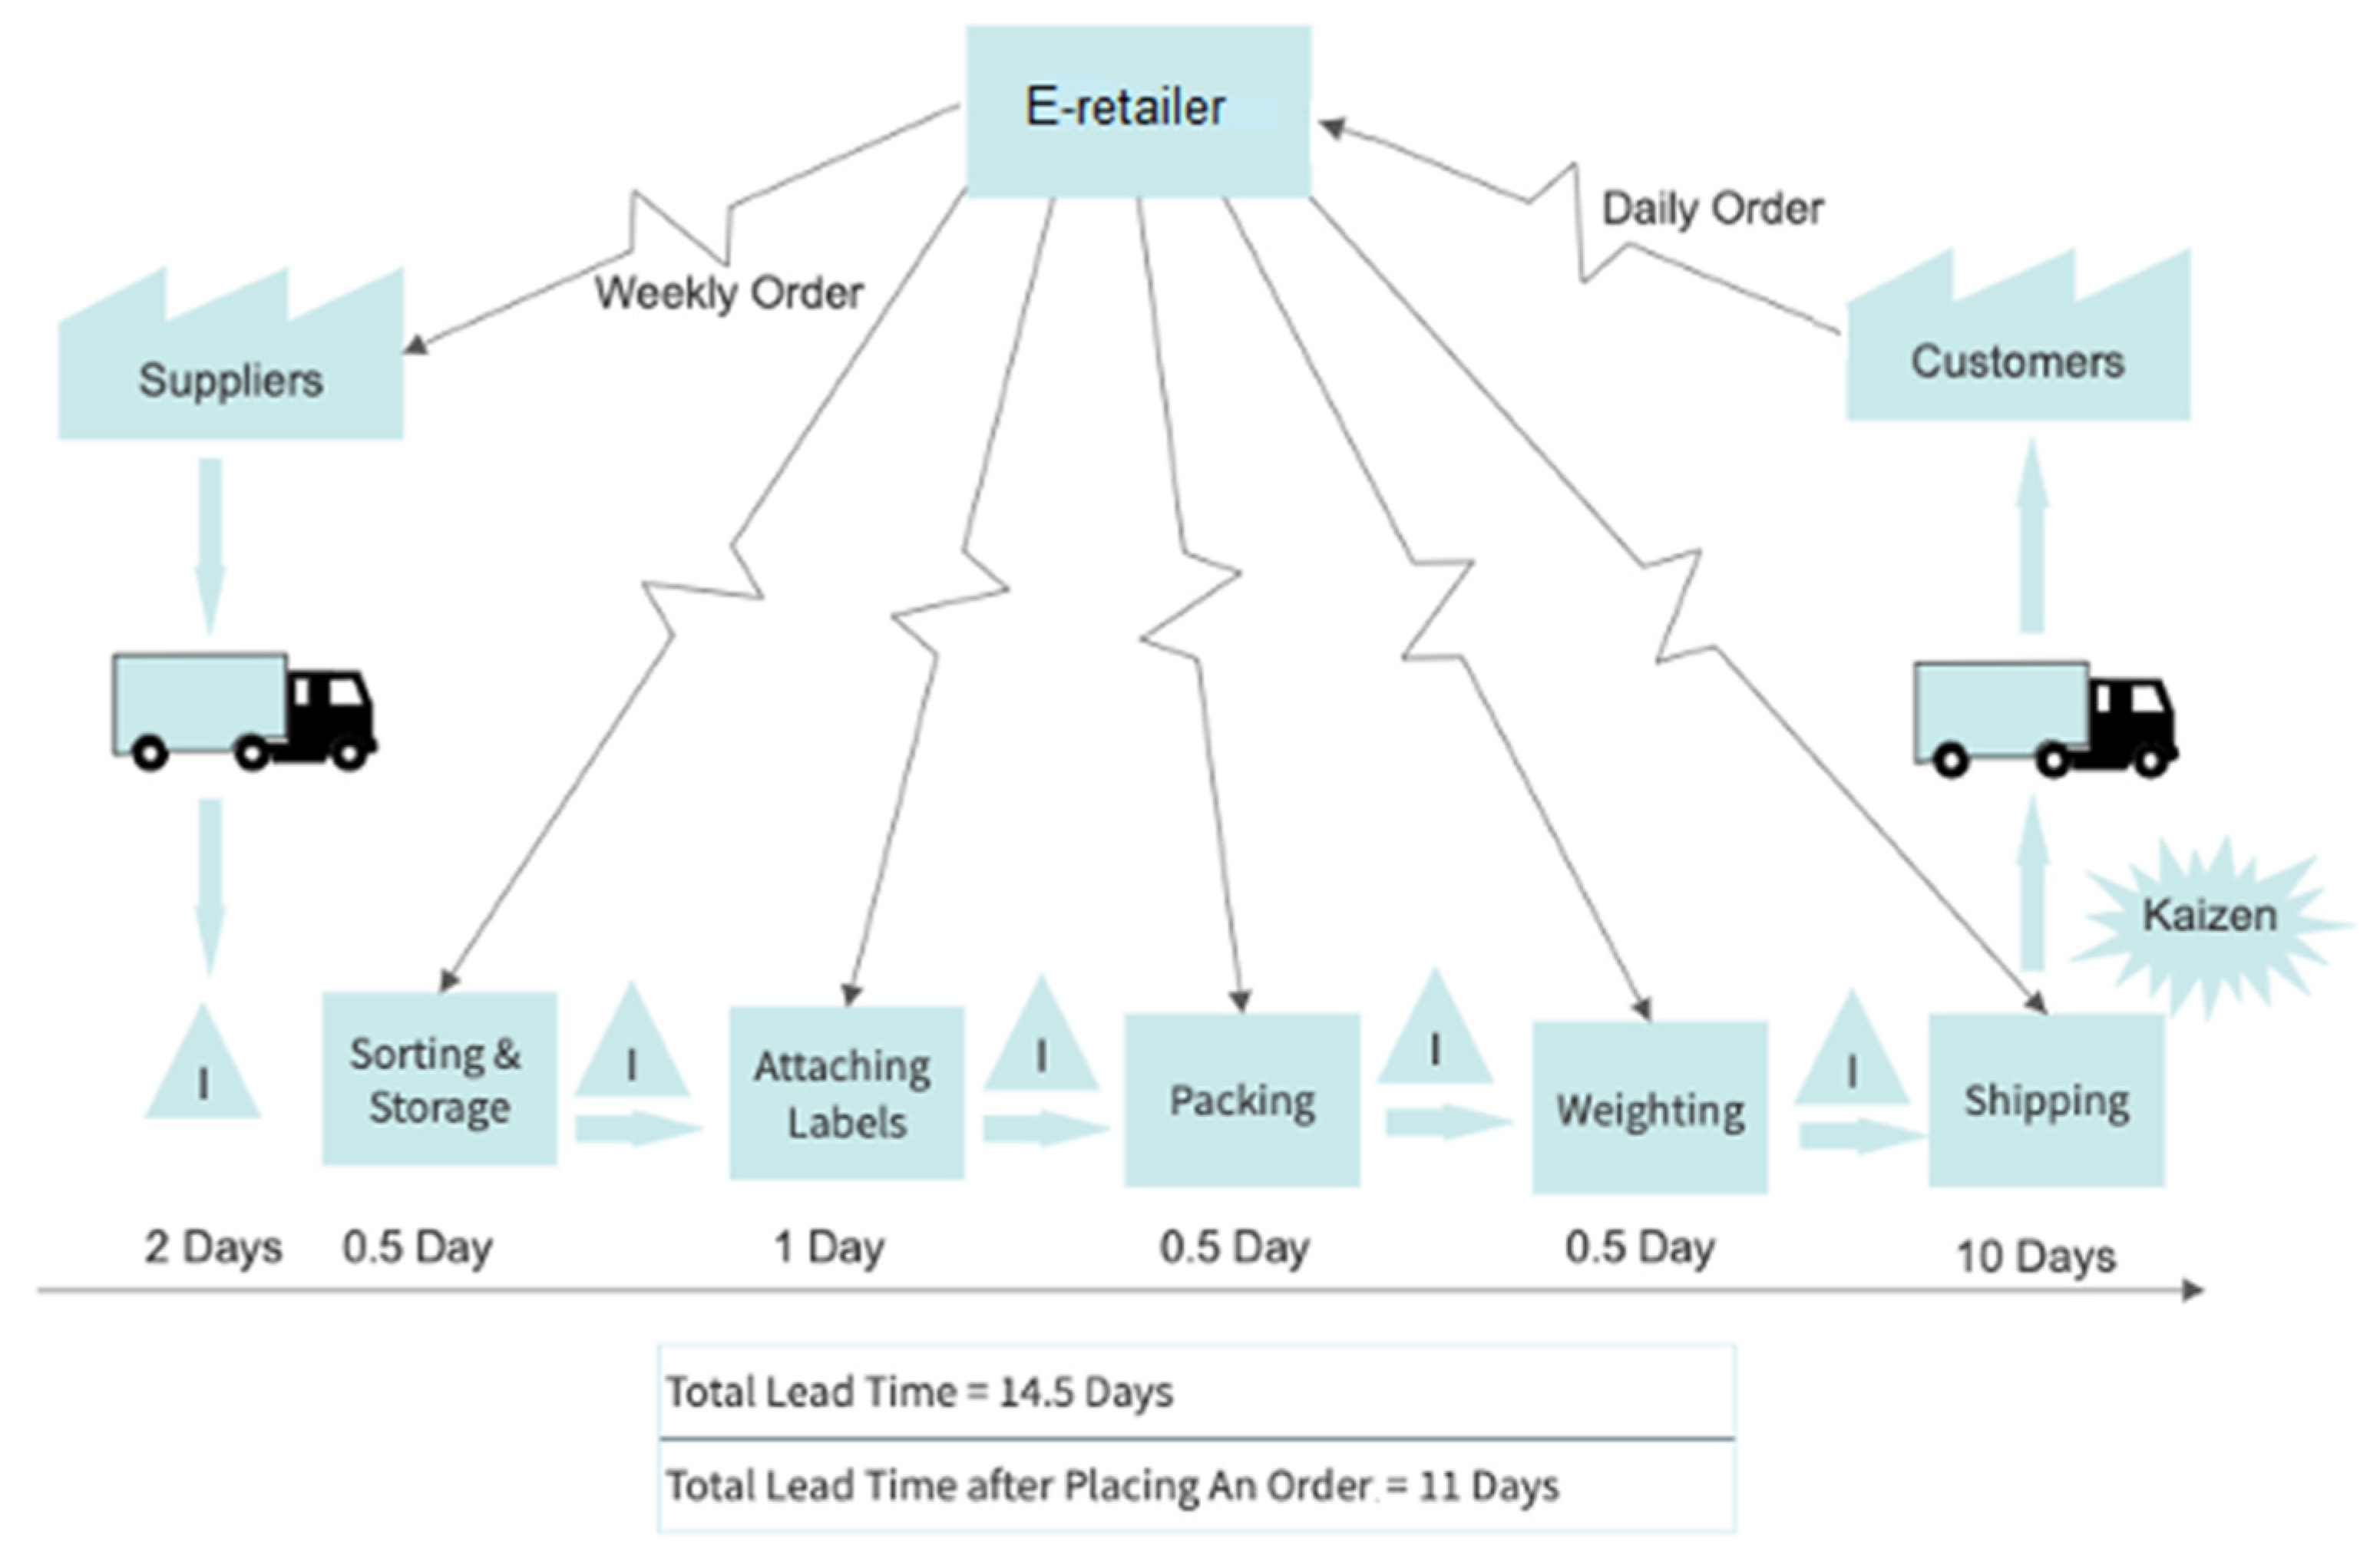
4.1. Current Stream Mapping (CSM)
4.2. Five-Whys Root Cause Analysis
4.3. Scoring Method for Logistic Model Selection
4.3.1. Stage I—Determination of the Key Logistic Factors
- Propose potential important logistic factors to be considered, as shown in Table 3. Other than the common important logistic factors such as cost, on-time delivery, etc., warehouse location was included, as the distance between the warehouse and customer has a direct impact on delivery time. Sales growth indicates whether a partner can help the e-retailer to increase sales. Responsiveness refers to the adaptivity to the changes of industry-related policies, rules, and terms.
- Assign linguistic terms that indicate the importance level of the proposed logistic factors with their associated reference fuzzy numbers, as shown in Table 4. Fuzzy numbers were introduced by Zadeh in order to deal with imprecise numerical quantities in a practical way [74]. Rather than assigning an exact importance number to each logistic factor, the fuzzy number allows the importance of the logistic factors to be expressed as a range between 0 and 1, which is more practical. For example, the importance of a logistic factor can be given a triangular fuzzy number of (0.4, 0.6, 0.8), with 0.6 being assigned to indicate that the factor is important in an ordinary situation, with 0.4 or 0.8 representing the most conservative or optimistic consideration, respectively. The proposed logistic factors along with Table 4 were sent to eight experts as questionnaires to collect the scores for each logistic factor. All of the experts have been in supply chain management positions in the e-retail industry for at least 4 years.
- Calculate fuzzy weight/importance score for each logistic factor based on the scores received from the experts. The calculation process is as follows: The importance score of factor j evaluated by expert i is denoted as for i = 1,2, …, 8; j = 1,2, … 10. The fuzzy weight of factor j is denoted as , where , , . The extreme values that fall outside two standard deviations are removed.
- Compare the fuzzy weight score of each factor with a threshold to identify key logistic factors, where , the average values of the weight of all factors. A factor j with will be selected, while a factor with will be rejected. The fuzzy weight/importance score for each logistic factor, the threshold , and the decision for each logistic factor are shown in Table 5. By comparing the Fuzzy weight with the threshold, six out of ten logistic factors are identified as key logistic factors and are selected.
4.3.2. Stage II: Scoring Logistic Operation Models
4.4. Future Stream Mapping (FSM)
4.5. Cost Analysis
5. Results and Discussion
6. Conclusions
Author Contributions
Funding
Institutional Review Board Statement
Informed Consent Statement
Data Availability Statement
Conflicts of Interest
References
- Gregory, G.D.; Ngo, L.V.; Karavdic, M. Developing e-commerce marketing capabilities and efficiencies for enhanced performance in business-to-business export ventures. Ind. Mark. Manag. 2019, 78, 146–157. [Google Scholar] [CrossRef]
- Forbes. Available online: https://www.forbes.com/sites/michelleevans1/2021/03/25/global-e-commerce-market-to-expand-by-us1-trillion-by-2025/?sh=13ef9bd76cc0 (accessed on 28 November 2021).
- Lim, W.M. History, lessons, and ways forward from the COVID-19 pandemic. Int. J. Qual. Innov. 2021, 5, 101–108. [Google Scholar]
- Forbes. Available online: https://www.forbes.com/sites/michelleevans1/2021/01/19/five-e-commerce-trends-that-will-change-retail-in-2021/?sh=6d7b24e81435 (accessed on 28 November 2021).
- Rahimzadeh, F.; Heydari, M. A review of ecommerce competitive advantages in international trade. UJMAS 2017, 5, 79–85. [Google Scholar] [CrossRef]
- Sabou, S.; Avram-Pop, B.; Zima, L.A. The impact of the problems faced by online customers on ecommerce. Stud. Univ. Babes-Bolyai Oecon. 2016, 62, 77–88. [Google Scholar] [CrossRef]
- Bradlow, E.T.; Gangwar, M.; Kopalle, P.; Voleti, S. The role of big data and predictive analytics in retailing. J. Retail. 2017, 93, 79–95. [Google Scholar] [CrossRef]
- Xu, X.; Munson, C.L.; Zeng, S. The impact of e-service offerings on the demand of online customers. Int. J. Prod. Econ. 2017, 184, 231–244. [Google Scholar] [CrossRef]
- Sharma, A.; Liu, H.; Liu, H. Best Seller Rank (BSR) to Sales: An empirical look at Amazon. com. In Proceedings of the 2020 IEEE 20th International Conference on Software Quality, Reliability and Security, Macau, China, 11–14 December 2020. [Google Scholar] [CrossRef]
- Varoutsa, E.; Scapens, R.W. The governance of inter-organisational relationships during different supply chain maturity phases. Ind. Mark. Manag. 2015, 46, 68–82. [Google Scholar] [CrossRef]
- Tang, X.; Wang, G. Design and analysis of e-commerce and modern logistics for regional economic integration in wireless networks. EURASIP J. Wirel. Commun. Netw. 2020, 2020, 208. [Google Scholar] [CrossRef]
- Mentzer, J.T.; DeWitt, W.; Keebler, J.S.; Min, S.; Nix, N.W.; Smith, C.D.; Zacharia, Z.G. Defining supply chain management. J. Bus. Logist. 2011, 22, 1–25. [Google Scholar] [CrossRef]
- Chopra, S.; Meindl, P. Supply Chain Management: Strategy, Planning, and Operation, 6th ed.; Pearson: New York, NY, USA, 2014. [Google Scholar]
- Christopher, M. Logistics & Supply Chain Management: Logistics & Supply Chain Management, 5th ed.; FT Press: Upper Saddle River, NJ, USA, 2016. [Google Scholar]
- Ricker, F.; Kalakota, R. Order fulfillment: The hidden key to e-commerce success. Supply Chain Manag. Rev. 1999, 11, 60–70. [Google Scholar]
- Lambert, D.M.; Cooper, M.C. Issues in supply chain management. Ind. Mark. Manag. 2000, 29, 65–83. [Google Scholar] [CrossRef]
- Rashid, K.; Aslam, M.M.H. Business excellence through total supply chain quality management. Asian J. Qual. 2012, 13, 309–324. [Google Scholar] [CrossRef]
- Forno, A.J.D.; Pereira, F.A.; Forcellini, F.A.; Kipper, L.M. Value stream mapping: A study about the problems and challenges found in the literature from the past 15 years about application of Lean tools. Int. J. Adv. Manuf. Syst. 2014, 72, 779–790. [Google Scholar] [CrossRef]
- Krafcik, J.F. Triumph of the Lean Production System. MIT Sloan Manag. Rev. 1988, 30, 41–52. [Google Scholar]
- Womack, J.P.; Jones, D.T.; Roos, D. The Machine That Changed the World; Rawson Associate: New York, NY, USA, 1990. [Google Scholar]
- Womack, J.P.; Jones, D.T. Lean Thinking: Banish Waste and Create Wealth in your Corporation, 2nd ed.; Free Press: New York, NY, USA, 2003. [Google Scholar]
- Alukal, G. Lean kaizen in the 21st century. Qual. Prog. 2007, 40, 69–70. [Google Scholar]
- Shah, R.; Ward, P.T. Defining and developing measures of lean production. J. Oper. Manag. 2007, 25, 785–805. [Google Scholar] [CrossRef]
- Shararah, M.A. A value stream map in motion. Ind. Engi. 2013, 45, 46–50. [Google Scholar]
- Martin, K.; Osterling, M. Value Stream Mapping: How to Visualize Work and Align Leadership for Organizational Transformation, 1st ed.; McGraw-Hill Education: New York, NY, USA, 2013. [Google Scholar]
- Council for Six Sigma Certification; Setter, C.J. Six Sigma: A Complete Step-by-Step Guide: A Complete Training & Reference Guide for White Belts, Yellow Belts, Green Belts, and Black Belts; The Council for Six Sigma Certification: Buffalo, NY, USA, 2018. [Google Scholar]
- Dos Santos, V.F.; Sabino, L.R.; Morais, G.M.; Gonçalves, C.A. E-commerce: A short history follow-up on possible trends. Int. J. Bus. 2017, 8, 130–138. [Google Scholar] [CrossRef][Green Version]
- Pant, S.; Sethi, R.; Bhandari, M. Making sense of the e-supply chain landscape: An implementation framework. J. Inf. Manag. 2003, 23, 201–221. [Google Scholar] [CrossRef]
- Sherer, S.A. From supply-chain management to value network advocacy: Implications for e-supply chains. J. Supply Chain Manag. 2005, 10, 77–83. [Google Scholar] [CrossRef]
- Chiang, W.K.; Monahan, G.E. Managing inventories in a two-echelon dual-channel supply chain. Eur. J. Oper. Res. 2005, 162, 325–341. [Google Scholar] [CrossRef]
- Boone, T.; Ganeshan, R. Exploratory analysis of free shipping policies of online retailers. Int. J. Prod. Econ. 2013, 143, 627–632. [Google Scholar] [CrossRef]
- Shao, X.F. Free or calculated shipping: Impact of delivery cost on supply chains moving to online retailing. Int. J. Prod. Econ. 2017, 191, 267–277. [Google Scholar] [CrossRef]
- Piera, C.; Roberto, C.; Giuseppe, C.; Teresa, M. E-procurement and e-supply chain: Features and development of e-collaboration. IERI Procedia 2014, 6, 8–14. [Google Scholar] [CrossRef]
- Li, J.; Ghadge, A.; Tiwari, M.K. Impact of replenishment strategies on supply chain performance under e-shopping scenario. Comput. Ind. Eng. 2016, 102, 78–87. [Google Scholar] [CrossRef]
- Xu, S.X.; Cheng, M.; Huang, G.Q. Efficient intermodal transportation auctions for b2b e-commerce logistics with transaction costs. Transport. Res. B-Meth. 2015, 80, 322–337. [Google Scholar] [CrossRef]
- Wang, W.; Li, G.; Cheng, T.C.E. Channel Selection in a Supply Chain with a Multi-Channel Retailer: The Role of Channel Operating Costs. Int. J. Prod. Econ. 2016, 173, 54–65. [Google Scholar] [CrossRef]
- Zhang, J.; Wang, X.; Huang, K. Integrated on-line scheduling of order batching and delivery under b2c ecommerce. Comput. Ind. Eng. 2016, 94, 280–289. [Google Scholar] [CrossRef]
- Zhao, J.; Hou, X.; Guo, Y.; Wei, J. Pricing policies for complementary products in a dual-channel supply chain. Appl. Math. Model. 2017, 49, 437–451. [Google Scholar] [CrossRef]
- Byukusenge, E.; Munene, J.C. Knowledge management and business performance: Does innovation matter? Cogent Bus. Manag. 2017, 4, 1368434. [Google Scholar] [CrossRef]
- Lestari, S.D.; Putra, A.H.P.K.; Muhdaliha, E. E-commerce performance based on knowledge management and organizational innovativeness. Distr. Sci. Res. 2020, 18, 49–58. [Google Scholar] [CrossRef]
- Wang, Y.; Yu, Z.; Shen, L. Study on the decision-making and coordination of an e-commerce supply chain with manufacturer fairness concerns. Int. J. Prod. Res. 2019, 57, 2788–2808. [Google Scholar] [CrossRef]
- Fedushko, S.; Shevchuk, L.; Poritska, A.; Kravets, R.; Tymovchak-Maksymets, O. E-Commerce and E-Health Strategies and Implementation Activities in the United Kingdom: Review Study. In Proceedings of the CEUR Workshop Proceedings. Vol-2647: Proceedings of the International Conference on Rural and Elderly Health Informatics (IREHI 2019), Dakar, Senegal, 4–6 December 2019. [Google Scholar] [CrossRef]
- Syerov, Y.; Somych, N.; Ortynskyy, V.; Zakharchenko, A.; Lozynska, I. E-banking: Commerce and Legal Aspects. In Proceedings of the CEUR Workshop Proceedings. Vol-2824: Proceedings of the Symposium on Information Technologies & Applied Sciences (IT&AS 2021), Bratislava, Slovak Republic, 5 March 2021. [Google Scholar]
- Kumar, S.; Lim, W.M.; Pandey, N.; Westland, J.C. 20 years of Electronic Commerce Research. Electron. Commer. Res. 2021, 21, 1–40. [Google Scholar] [CrossRef]
- Rother, M.; Shook, J. Learning to See: Value Stream Mapping to Add Value and Eliminate Muda, 1st ed.; Lean Enterprise Institute: Boston, MA, USA, 1999. [Google Scholar]
- Singh, B.; Garg, S.K.; Sharma, S.K. Value stream mapping: Literature review and implications for Indian industry. Int. J. Adv. Manuf. Syst. 2011, 53, 799–809. [Google Scholar] [CrossRef]
- Klimecka-Tatar, D. Analysis and improvement of business processes management–based on value stream mapping (vsm) in manufacturing companies. Pol. J. Manag. Stud. 2021, 23, 213. [Google Scholar] [CrossRef]
- Shou, W.; Wang, J.; Wu, P.; Wang, X.; Chong, H. A cross-sector review on the use of value stream mapping. Int. J. Prod. Res. 2017, 55, 3906–3928. [Google Scholar] [CrossRef]
- Tyagi, S.; Choudhary, A.; Cai, X.; Yang, K. Value stream mapping to reduce the lead-time of a product development process. Int. J. Prod. Econ. 2015, 160, 202–212. [Google Scholar] [CrossRef]
- Rosenbaum, S.; Toledo, M.; González, V. Improving environmental and production performance in construction projects using value-stream mapping: Case study. J. Constr. Eng. Manag. 2013, 140, 04013045. [Google Scholar] [CrossRef]
- Muñoz-Villamizar, A.; Santos, J.; Garcia-Sabater, J.J.; Lleo, A.; Grau, P. Green value stream mapping approach to improving productivity and environmental performance. Int. J. Product. Perform. Manag. 2019, 68, 608–625. [Google Scholar] [CrossRef]
- Schoeman, Y.; Oberholster, P.; Somerset, V. Value stream mapping as a supporting management tool to identify the flow of industrial waste: A case study. Sustainability 2021, 13, 91. [Google Scholar] [CrossRef]
- Santos, A.C.S.G.D.; Reis, A.D.C.; Souza, C.G.; Santos, C.; Ferreria, I.L.; Figueiredo, L.A. The first evidence about conceptual vs analytical lean healthcare research studies. J. Health Organ. Manag. 2020, 34, 789–806. [Google Scholar] [CrossRef]
- Marin-Garcia, J.A.; Vidal-Carreras, P.I.; Garcia-Sabater, J.J. The role of value stream mapping in healthcare services: A scoping review. Int. J. Environ. Res. Public Health 2021, 18, 951. [Google Scholar] [CrossRef]
- Barber, C.S.; Tietje, B.C. A Research Agenda for Value Stream Mapping the Sales Process. J. Pers. Sell. Sales Manag. 2008, 28, 155–165. [Google Scholar] [CrossRef]
- The Innovation Tools Handbook, Volume 1: Organizational and Operational Tools, Methods, and Techniques That Every Innovator Must Know; CRC Press: London, UK, 2016.
- Serrat, O. Knowledge Solutions: Tools, Methods, and Approaches to Drive, 1st ed.; Springer Nature: Singapore, 2017. [Google Scholar]
- Card, A.J. The problem with ‘5 whys’. BMJ Qual. Saf. 2017, 26, 671–677. [Google Scholar] [CrossRef] [PubMed]
- Murugaiah, U.; Benjamin, J.; Marathamuthu, M.S.; Muthaiyah, S. Scrap loss reduction using the 5-whys analysis. Int. J. Qual. Reliab. 2010, 27, 527–540. [Google Scholar] [CrossRef]
- Ding, S.H.; Muhammad, N.A.; Zulkurnaini, N.H.; Khaider, A.N.; Kamaruddin, S. Production system improvement by integration of fmea with 5-whys analysis. Adv. Mat. Res. 2013, 748, 1203–1207. [Google Scholar] [CrossRef]
- Benjamin, S.J.; Marathamuthu, M.S.; Murugaiah, U. The use of 5-WHYs technique to eliminate OEE’s speed loss in a manufacturing firm. J. Qual. Maint. Eng. 2015, 21, 419–435. [Google Scholar] [CrossRef]
- Braglia, M.; Frosolini, M.; Gallo, M. SMED enhanced with 5-Whys analysis to improve set-up reduction programs: The SWAN approach. Int. J. Adv. Manuf. Techno. 2017, 90, 1845–1855. [Google Scholar] [CrossRef]
- George, A.; Ranjha, S.; Kulkarni, A. Enhanced problem solving through redefined 8D step completion criteria. Qual. Eng. 2021, 33, 695–711. [Google Scholar] [CrossRef]
- Zhu, F.; Liu, Q. Competing with complementors: An empirical look at Amazon.com. Strateg. Manag. J. 2018, 39, 2618–2642. [Google Scholar] [CrossRef]
- Culpepper, P.D.; Thelen, K. Are we all Amazon primed? consumers and the politics of platform Power. Comp. Political Stud. 2020, 53, 288–318. [Google Scholar] [CrossRef]
- Amazon. Available online: https://www.aboutamazon.com/impact/empowerment/small-businesses (accessed on 28 November 2021).
- Yin, R.K. Case Study Research and Applications: Design and Methods, 6th ed.; SAGE Publications: Los Angeles, CA, USA, 2017. [Google Scholar]
- Gerring, J. What Is a Case Study and What Is It Good for? Am. Political Sci. Rev. 2004, 98, 341–354. [Google Scholar] [CrossRef]
- Suarez-Barraza, M.F.; Miguel-Davila, J.-Á.; Vasquez-García, C.F. Supply chain value stream mapping: A new tool of operation management. Int. J. Qual. Reliab. Manag. 2016, 33, 518–534. [Google Scholar] [CrossRef]
- Reid, H. FBA vs. 3PL–Which Is the Best Amazon Fulfillment Option for You? 2020. Available online: https://dclcorp.com/blog/amazon-fulfillment/amazon-fba-vs-3pl (accessed on 1 April 2021).
- Fulfillment by Amazon (FBA)|How It Works. 2021. Available online: https://sell.amazon.com/fulfillment-by-amazon.html?ref_=asus_soa_rd& (accessed on 1 April 2021).
- Connolly, B. Top Fulfillment Alternatives to Amazon FBA for 2021. 2021. Available online: https://www.junglescout.com/blog/amazon-fulfillment-alternatives (accessed on 1 April 2021).
- Ishikawa, A.; Amagasa, M.; Shiga, T.; Tomizawa, G.; Tatsuta, R.; Mieno, H. The max-min Delphi method and fuzzy Delphi method via fuzzy integration. Fuzzy Sets Syst. 1993, 55, 241–253. [Google Scholar] [CrossRef]
- Liu, H.T.; Wang, W.K. An integrated fuzzy approach for provider evaluation and selection in third-party logistics. Expert Syst. Appl. 2009, 36, 4387–4398. [Google Scholar] [CrossRef]
- Amazon Seller Central. 2021. Available online: https://sellercentral.amazon.com/ (accessed on 1 April 2021).
- Exchange Rates-X-Rates. 2021. Available online: https://www.x-rates.com/ (accessed on 22 April 2021).
- Neboha, E. E-commerce as a form of economic relationships of entrepreneurship subjects in the network economy. Econ. Ecol. Socium 2018, 2, 43–51. [Google Scholar] [CrossRef]


| No. | Symbol | Meaning |
|---|---|---|
| 1 |  | Supplier or Customer |
| 2 |  | Process Control or Process |
| 3 |  | Inventory |
| 4 |  | External Shipping |
| 5 |  | Material Flow |
| 6 |  | Electronic Information Flow |
| Question | Cause | Solution |
|---|---|---|
| Why is the sales volume low? | The customers are not happy with the long response time | Reduce response time |
| Why is the response time long? | The delivery time is long | Reduce delivery time |
| Why is the delivery time long? | The inventory is kept too far from the customer | Reduce the distance between the warehouses and the customers |
| Why is the inventory kept far from the customers? | The warehouse is in China, and the customers are in the USA. | Change the location of the inventory to be closer to the customers |
| Why is the warehouse in China? | The company does not have a warehouse or any partners in the USA. | Find a partner in USA |
| Factors | |
|---|---|
| Cost | Logistics information system |
| Warehouse location | Customer service |
| Sales growth | Capability to fill emergency orders |
| Logistics equipment | Responsiveness |
| Optimization capabilities | On time delivery |
| Linguistic Term | Fuzzy Number |
|---|---|
| Very Unimportant | (0, 0, 0.2) |
| Moderately Unimportant | (0, 0.2, 0.4) |
| Unimportant | (0.2, 0.4, 0.6) |
| Important | (0.4, 0.6, 0.8) |
| Moderately Important | (0.6, 0.8, 1) |
| Very Important | (0.8, 1, 1) |
| Factors | Fuzzy Weight | Decision |
|---|---|---|
| Price | (0.4, 0.765542, 1) | Selected |
| Warehouse location | (0, 0.391595, 0.8) | Rejected |
| Sales growth | (0.6, 0.919727, 1) | Selected |
| Logistics equipment | (0, 0.259368, 0.6) | Rejected |
| Optimization capabilities | (0, 0.224492, 0.6) | Rejected |
| Logistics information system | (0.4, 0.621969, 1) | Selected |
| Customer service quality | (0.6, 0.862835, 1) | Selected |
| Capability to fill emergency orders | (0, 0.297548, 0.6) | Rejected |
| Responsiveness | (0.2, 0.626034, 1) | Selected |
| On-time delivery | (0.4, 0.787196, 1) | Selected |
| Threshold | (0.272727, 0.588590, 0.872727) |
| Score | Urgent | Not Urgent |
|---|---|---|
| Very important | 5 | 3 |
| Important | 3 | 1 |
| FBA | ||
|---|---|---|
| Advantages | Relative Factors | Score |
| Fast order fulfillment: 2-day delivery for Prime members | Customer service quality, sales growth, responsiveness, on-time delivery | 5 |
| Direct access to prime customers | Sales growth | 3 |
| Customer support: 7 × 24 h customer service, complaints, and returns | Customer service quality, sales growth, responsiveness | 3 |
| Transparent and simple fee structure: providing a handy calculator for sellers calculating their fees | Logistics information system | 1 |
| High purchase rate: customers trust Amazon and are more willing to buy product fulfilled by Amazon | Sales growth | 5 |
| Prime promotion and other Amazon boosts: Improving product listing rank | Sales growth | 5 |
| Total score | 22 | |
| FBA | ||
|---|---|---|
| Disadvantages | Relative Factors | Score |
| Little order customization: must follow existing Amazon processes, poor flexibility | Responsiveness | 1 |
| Higher overall fees: higher long-term storage fee, order handling fee | Price | 3 |
| Low company brand exposure: products packed in Amazon-branded box | Responsiveness | 3 |
| Returns and exchanges are biased towards customers: products waste | Price | 1 |
| Little customer interaction: | Customer service quality | 3 |
| Total score | 11 | |
| 3PL | ||
|---|---|---|
| Advantages | Relative Factors | Score |
| B2B and B2C fulfillment, supporting different sales channels | Sales growth, responsiveness | 3 |
| Customization for customers: value added services | Customer service quality, responsiveness | 3 |
| Customization for sellers: customized seller branded packing | Customer service quality, responsiveness | 3 |
| Low overall fees: low storage fee, order handling fee | Price | 3 |
| Various options: a wide variety of 3PLs | Price | 3 |
| Customs clearance service | Customer service quality, responsiveness | 1 |
| Total score | 16 | |
| 3PL | ||
|---|---|---|
| Disadvantages | Relative Factors | Score |
| Not friendly for unstable or small order volume | Price | 3 |
| Initial fees: setup fee, receiving fee | Price, logistics information system | 3 |
| Not easy to find a trustworthy 3PL company | Customer service quality | 3 |
| No impact on sales | Sales growth | 5 |
| Slower delivery speeds: no 2-day shipping guarantee | Customer service quality, on-time delivery, responsiveness | 5 |
| Customs clearance service | Logistics information system | 1 |
| Total score | 20 | |
| FBA | 3PL | |||
|---|---|---|---|---|
| Score | Proportion | Score | Proportion | |
| Advantages | 22 | 67% | 16 | 44% |
| Disadvantages | 11 | 33% | 20 | 56% |
| Total | 33 | 100% | 36 | 100% |
| Part 1: From Supplier to e-Retailer | |||||||
| Product | Unit weight | Weekly quantity | Packing weight | Total weight | Charges (CNY/kg) | Shipping cost | |
| (kg/unit) | (unit) | (kg) | (kg) | First 1kg | Rest kgs | (CNY/week) | |
| a | b | c | d = a × b + c | e | f | g = e + (d − 1) × f | |
| Phone case | 0.11 | 50 | 0.5 | 6 | 10 | 7 | 45 |
| Party decorations | 0.27 | 12 | 0.5 | 3.74 | 10 | 7 | 29.18 |
| Part 2: From E-retailer to Customer | |||||||
| Unit weight (kg/unit) | Charges (CNY/unit) | ||||||
| Product | Product weight | Packing weight | Total weight | Option 1 | Option 2 | Option 3 | Average (¥/unit) |
| a | b | c = a + b | d | e | f | g = (d + e + f)/3 | |
| Phone case | 0.11 | 0.01 | 0.12 | 25.30 | 27.60 | 28.48 | 27.13 |
| Party decorations | 0.27 | 0.02 | 0.29 | 38.78 | 41.81 | 41.81 | 40.80 |
| Part 3: From Supplier to FBA Warehouse | ||||||||
| Weight | Charges (CNY) | |||||||
| Product | Unit product weight | Monthly quantity | Packing weight | Total weight | Option 1 | Option 2 | Option 3 | Average |
| (kg/unit) | (unit) | (kg) | (kg) | |||||
| a | b | c | d = a × b + c | e | f | g | h = (e + f + g)/3 | |
| Phone case | 0.11 | 200 | 1.5 | 23.50 | 1251.03 | 1434.90 | 1483.00 | 1389.63 |
| Party decorations | 0.27 | 48 | 2 | 14.96 | 1040.35 | 1238.43 | 1410.00 | 1229.59 |
| Product | Phone Case QTY = 200 | Party Decorations QTY = 48 | |||
|---|---|---|---|---|---|
| Model | FBR | FBA | FBR | FBA | |
| Shipping cost (USD) | Supplier to e-retailer | 27.65 | / | 17.93 | / |
| E-retailer to Customer | 833.49 | / | 300.83 | / | |
| Supplier to FBA | / | 213.46 | / | 188.88 | |
| Fulfillment cost (USD) | Labor cost | 460.83 | / | 230.41 | / |
| FBA fee | / | 662.00 | / | 167.04 | |
| Inventory cost (USD) | / | 1.00 | / | 0.96 | |
| Total cost (USD) | 1321.97 | 876.46 | 549.17 | 356.88 | |
Publisher’s Note: MDPI stays neutral with regard to jurisdictional claims in published maps and institutional affiliations. |
© 2022 by the authors. Licensee MDPI, Basel, Switzerland. This article is an open access article distributed under the terms and conditions of the Creative Commons Attribution (CC BY) license (https://creativecommons.org/licenses/by/4.0/).
Share and Cite
Qin, Y.; Liu, H. Application of Value Stream Mapping in E-Commerce: A Case Study on an Amazon Retailer. Sustainability 2022, 14, 713. https://doi.org/10.3390/su14020713
Qin Y, Liu H. Application of Value Stream Mapping in E-Commerce: A Case Study on an Amazon Retailer. Sustainability. 2022; 14(2):713. https://doi.org/10.3390/su14020713
Chicago/Turabian StyleQin, Yanfang, and Hongrui Liu. 2022. "Application of Value Stream Mapping in E-Commerce: A Case Study on an Amazon Retailer" Sustainability 14, no. 2: 713. https://doi.org/10.3390/su14020713
APA StyleQin, Y., & Liu, H. (2022). Application of Value Stream Mapping in E-Commerce: A Case Study on an Amazon Retailer. Sustainability, 14(2), 713. https://doi.org/10.3390/su14020713