Article

A Comparative Study of Unbalanced Production Lines Using Simulation Modeling: A Case Study for Solar Silicon Manufacturing

1
Department of Industrial Engineering and Management, National Taipei University of Technology, Taipei 10608, Taiwan
2
Department of Industrial Engineering and Management, National Chin-Yi University of Technology, Taichung 407224, Taiwan
3
Department of Industrial Engineering and Enterprise Information, Tunghai University, Taichung 411030, Taiwan
4
Department of Industrial Engineering, School of Engineering, King Mongkut’s Institute of Technology Ladkrabang, Bangkok 10520, Thailand
*
Author to whom correspondence should be addressed.
Sustainability 2022, 14(2), 697; https://doi.org/10.3390/su14020697
Submission received: 16 November 2021 / Revised: 20 December 2021 / Accepted: 20 December 2021 / Published: 9 January 2022

Abstract

:
In the solar silicon manufacturing industry, the production time for crystal growth is ten times longer than at other workstations. The pre-processing time at the ingot-cutting station causes work-in-process (WIP) accumulation and an excessively long cycle time. This study aimed to find the most effective production system for reducing WIP accumulation and shortening the cycle time. The proposed approach considered pull production systems, and the response surface methodology was adopted for performance optimization. A simulation-based optimization technique was used for determining the optimal pull production system. The comparison between the results of various simulated pull production systems and those of the existing solar silicon manufacturing system showed that a hybrid production system in which a kanban station was installed before the bottleneck station with a CONWIP system incorporated for the rest of the production line could reduce the WIP volume by 26% and shorten the cycle time by 16% under the same throughput conditions.

1. Introduction

Silicon is the most common material used in the production of solar energy products. The key production steps for photovoltaic products, from upstream to downstream, are obtaining silicon as raw material; producing silicon crystals; and producing batteries, systems, and other equipment. The silicon wafers produced from silicon crystals are a critical raw material, not only for photovoltaic batteries but also for the entire semiconductor industry. Because more than 90% of the solar cell is based on silicon wafers, the increased demand for solar products has increased the demand for silicon wafers [1]. In such an environment, it is necessary for the industry to respond rapidly to market demand to maintain and increase profits. The production of solar silicon crystals primarily involves push production systems, although flow shop production lines are an important element in the manufacturing system. Because each workstation in the production line has a different cycle time, the scheduler must consider whether a push production environment can facilitate a smooth flow between workstations and a similar production capacity across all the workstations. When either or both of these conditions cannot be ensured, unbalanced production lines and work-in-process (WIP) accumulation are likely to result [2,3].
The kanban production system adopted by lean production advocates is based on pull demand such that it is also referred to as a pull production system [4]. The differences between push production systems and pull production systems are as follows: In push systems, replenishment is based on forecasting and planned mass production, and a large inventory is required to meet consumer demand. However, unbalanced production time across the workstations results in dissimilar production capacity and unbalanced production lines, with WIP accumulating at each bottleneck workstation. High WIP levels result in excessive inventory cost, and accumulated WIP results in an extensive cycle time [5]. In pull production systems, production is based on customer demand. Such systems emphasize just-in-time (JIT) production and rapid response to customer demand [6,7]. Thus, WIP levels can be regulated effectively and waste from overproduction can be reduced, thereby lowering inventory costs.
The original kanban production system was the basis for other pull production systems, such as constant work-in-process (CONWIP) production systems, which incorporate both push and pull production systems, and other hybrid production systems [8,9,10,11]. In the present study, we examined a solar silicon crystal manufacturer with uneven workstation production capacities and an unbalanced production line. We present a lean production analysis, which we performed to evaluate site improvement processes, thereby providing a way to eliminate unnecessary waste and shorten the production time to increase productivity. For example, the production time for crystal-growing and ingot-cutting stations was long. The preproduction time at the ingot-cutting station caused WIP accumulation and an excessively long cycle time. The objective of this study was to find the most effective production system for reducing WIP accumulation and shortening the cycle time. We adopted the response surface methodology (RSM) to optimize the performance of various pull production systems and obtained results that were verified through system simulations.
The remainder of this paper is organized as follows. In Section 2, we review the related work on pull production systems. We describe the case study in Section 3. We report and analyze the simulation results in Section 4 and offer a conclusion in Section 5.

2. Related Work

Proposed by Japan’s Toyota Motor Corporation as a means of implementing JIT production, the kanban production system is considered the prototypical pull production system [12]. Hopp and Spearman [13] explained that in a kanban production system, the flow of information is transferred through kanban cards, the number of which is used to regulate the WIP levels in the system. Products leave the production system only on demand. Each workstation in the production line uses a kanban card to transmit its demand to the preceding station in order to obtain parts or products as necessary. To control costs and eliminate production waste, each workstation regulates its own resources and product quantity to ensure that the WIP level does not exceed a predetermined threshold [14].
Williams et al. [15] asserted that the kanban system is representative of JIT production systems. It is a critical method for defining production quantity and is often considered the key component of lean production systems. The kanban system possesses the following three characteristics: First, it employs a pull production system to avoid WIP accumulation in the production line. Second, it employs a fast exchange mode method to enable the transformation of a single-product production line into a multi-product hybrid production line. Third, it reduces WIP accumulation by dividing large-quantity production orders into repeated manufacturing processes involving smaller quantities.
With the purpose of limiting WIP levels in a production line, Spearman et al. [16] proposed the CONWIP system, which is based on pull production systems. The basic concepts of this system were adopted from the kanban production system, where the philosophy of regulating WIP levels was extended to facilitate better control over the WIP volume in the production line. CONWIP production systems retain the high production and equipment utilization rate of push production systems, but incorporate the WIP control of the kanban system, and can be considered an improved kanban control system.
CONWIP production systems also use kanban cards to regulate the WIP level in the production line. In CONWIP systems, the entire production line is regarded as a single workstation. When a customer places an order, information regarding the finished product is transmitted using kanban cards to the beginning of the production line, and feeding and operations commence according to the kanban card. If no demand exists, no kanban information is generated. Accordingly, a predefined number of kanban cards are used to ensure that the WIP levels in the production line do not exceed the preset range.
Bonvik and Gershwin [17] agreed that CONWIP production systems could ensure that WIP levels in the production lines do not exceed predefined thresholds by defining the number of kanban cards and enabling easy control over WIP levels at each workstation. However, the researchers asserted that when the production line is long and there are equipment malfunctions or bottleneck stations with a longer production time than the other workstations have, high WIP levels accumulate at the malfunctioning machine or before the bottleneck station. This situation makes it impossible to determine the distribution of the WIP at each station in the system. To resolve this issue, they proposed a pull production system called the hybrid control system. This system integrates the kanban production system with independent kanban cards, which control the materials fed into the bottleneck workstations.
Gaury et al. [18] optimized the kanban, CONWIP, and hybrid systems by using a genetic algorithm and compared the performance of each in order to select the most efficient system at a service level of 99%. For each system, the genetic algorithm determined the optimal number of kanban cards and whether segmentation was necessary. When segmentation was deemed necessary, the workstation at which segmentation should occur and the number of kanban cards were determined. Simulation experiments showed that when the service level remained constant, the performance of the hybrid system was more optimal than that of either of the other two systems. Geraghty and Heavey [19] used simulations to determine which of the eight hybrid control architectures proposed by Hodgson and Wang [20] attained the most efficient performance when inventory levels and optimal safety stock conditions were considered.
Abdulmalek and Rajgopal [21] incorporated pull production systems at a steel manufacturer and applied lean value streams through simulations to compare the systems. Yang et al. [22] employed a genetic algorithm to solve pull production system problems in semiconductor integrated circuit packaging factories. Lu et al. [23] employed value stream maps and the multiple criteria decision-making method to design a lean pull system for semiconductor manufacturing. Their proposed pull production system combined a CONWIP with a kanban system, and the performance was verified through simulations. Yang et al. [24] demonstrated the effectiveness of the CONWIP pull system and proposed that multi-CONWIP can reduce the production lead time and WIP in bike chain production. Onyeocha et al. [25] evaluated the hybrid kanban CONWIP control strategy and basestock kanban CONWIP control strategy in a multi-product serial flow line. It was shown that an increase in the number of product types increases the amount of WIP inventory. Romagnoli [26] showed that CONWIP is a very useful tool for planning and controlling a complex flexible job shop. Pursuing a similar approach, we examined the case of a solar silicon crystal manufacturer. We applied the pull production systems proposed in previous studies to this case and used the response surface methodology (RSM) to determine the optimal system. Finally, system simulations were performed to verify the system performance.

3. Problem Statement

In this study, we examined the production environment of a solar silicon crystal manufacturer. There were ten main manufacturing processes—sandblast, etching, resistance measuring, allocation, crucible making, feeding, growing, preparing for ingot cutting, ingot cutting, and electrical inspection—after which, cutting, testing, and packaging operations took place. The production times varied widely between the workstations in the factory, resulting in WIP accumulation, which, in turn, gave rise to high inventory costs. Information on the existing conditions was gathered and applied to construct a current-state value stream map. Because the obtained information involves real data from the case company, the values were modified, but in such a way that the changes would not affect the study results. We examined the current-state value stream map (Figure 1) to determine the WIP levels in the production line and the ratio of waste to value. Opportunities to make improvements were identified using the value-stream map by analyzing the current production line balance.
From the value stream map, opportunities for improvement were identified and their objectives and scope were clearly defined. The takt time was also calculated (Equation (1)) to further elucidate the current production conditions and areas requiring improvement [27]. The Takt time (tt) indicates the production rate at which the customer requires the product. tp is the available production time and d is the quantity required by the customer. The line balance ratio (LBR) is calculated to determine the production capacity of each workstation, tc is the sum of the production cycle time, tb is the longest operation, and Wn is the number of workstations (Equation (2)). For the LBR, the closer the ratio is to 100%, the better the line balance is. The Takt time was used to identify unbalanced operations in the production line:
T a k t   t i m e ( t t ) = t p d
LBR = t c t b × W n × 100 %
The Takt time was calculated by dividing the effective available time per day by the daily consumer demand. In this case, we studied the takt time of nine main processes, except for the sandblasting material preparation since the daily production quantities depend on the stock level of recycling material. This study set the daily utilization time for the machines to 1440 min and the daily consumer demand was 16 silicon crystal ingots. Thus, the takt time of the solar silicon wafer production line was 90 min. The cycle time was calculated according to each station’s production capacity to compare the differences in production times between stations. In this case, compared with the cycle times of the other stations, the ingot-cutting workstation’s cycle time was relatively long and the closest to the takt time. Therefore, the ingot-cutting station was identified as the bottleneck station (Figure 2). The x-axis represents nine stations and the y-axis indicates the processing time at each station. The LBR was calculated to be 49.86%, which was lower than the accepted standard of 70%, indicating that the production line was unbalanced. This also showed the difference in the cycle times of the feeding and crystal-growing stations, as well as the substantial difference between preproduction for the ingot-cutting station and the cycle time of the ingot-cutting station. Thus, the WIP tended to accumulate before the crystal-growing and ingot-cutting stations. In this production environment, simulations were conducted to incorporate the pull production systems to reduce the WIP levels and cycle time. Thus, the research problem was how to reduce the WIP level and shorten the cycle time. Various pull production systems were incorporated and RSM was applied to determine optimal factor configurations, which were verified through system simulations.

4. Evaluation

4.1. Simulation Setting and Kanban Models

A simulation model schematic, shown in Figure 3, was constructed based on the current value stream map of the whole production processes in this case company, as well as two after-processes: wafer sawing and packing. The demand data were generated according to historical data from the case company. The ramp-up time for the workstations was set to 30 days and the simulation time to 12 months. To minimize the simulation errors, the experiment was repeated 10 times. Line balance analysis identified the ingot-cutting station as the bottleneck station. Data on the production time of each machine are presented in Table 1. To determine whether the simulation model was reasonable, the analysis results were both verified and validated (Table 2). The equation for the percentage error is expressed in Equation (3):
simulation   error = | Simulation   systems Production   systems | Production   systems × 100 %
Three primary types of pull production systems were incorporated in this study: kanban, CONWIP, and hybrid. The characteristics and parameters of each type of system are described in detail as follows.
In the kanban production system, when the last workstation in the production line receives an order and the finished product is removed, a kanban card transmits a demand request (WIP) from a given station to the immediately preceding station, whereupon the preceding station begins production. Similarly, the preceding station, from which the WIP was taken, receives WIP from its immediately preceding station for further production [4]. During the implementation, the kanban production system designates a specific kind of kanban card for each type of component. Using kanban cards ensures that the WIP levels at each station do not exceed a predetermined threshold. The purpose of maintaining a certain WIP level is to reduce the impact of an equipment malfunction or an unforeseen stoppage in the production process and to ensure smooth production overall. In this study, kanban stations were installed before each station. In the first type of kanban installation, the number of cards was determined based on the station’s production capacity. Figure 4 illustrates six workstations denoted A to E, with C as the bottleneck station.
Developed by Spearman et al. [16], the CONWIP production system is a combination of a push production system and a pull production system. It also uses kanban cards as a tool for regulating WIP levels in the production line, which is regarded as one workstation. When a demand request arrives at the end of the line, the finished product information is transmitted to the front of the production line. Feeding is based on the kanban card information and continues until production is finished. Defining the number of kanban cards ensures that WIP levels in the production line do not exceed a predetermined threshold.
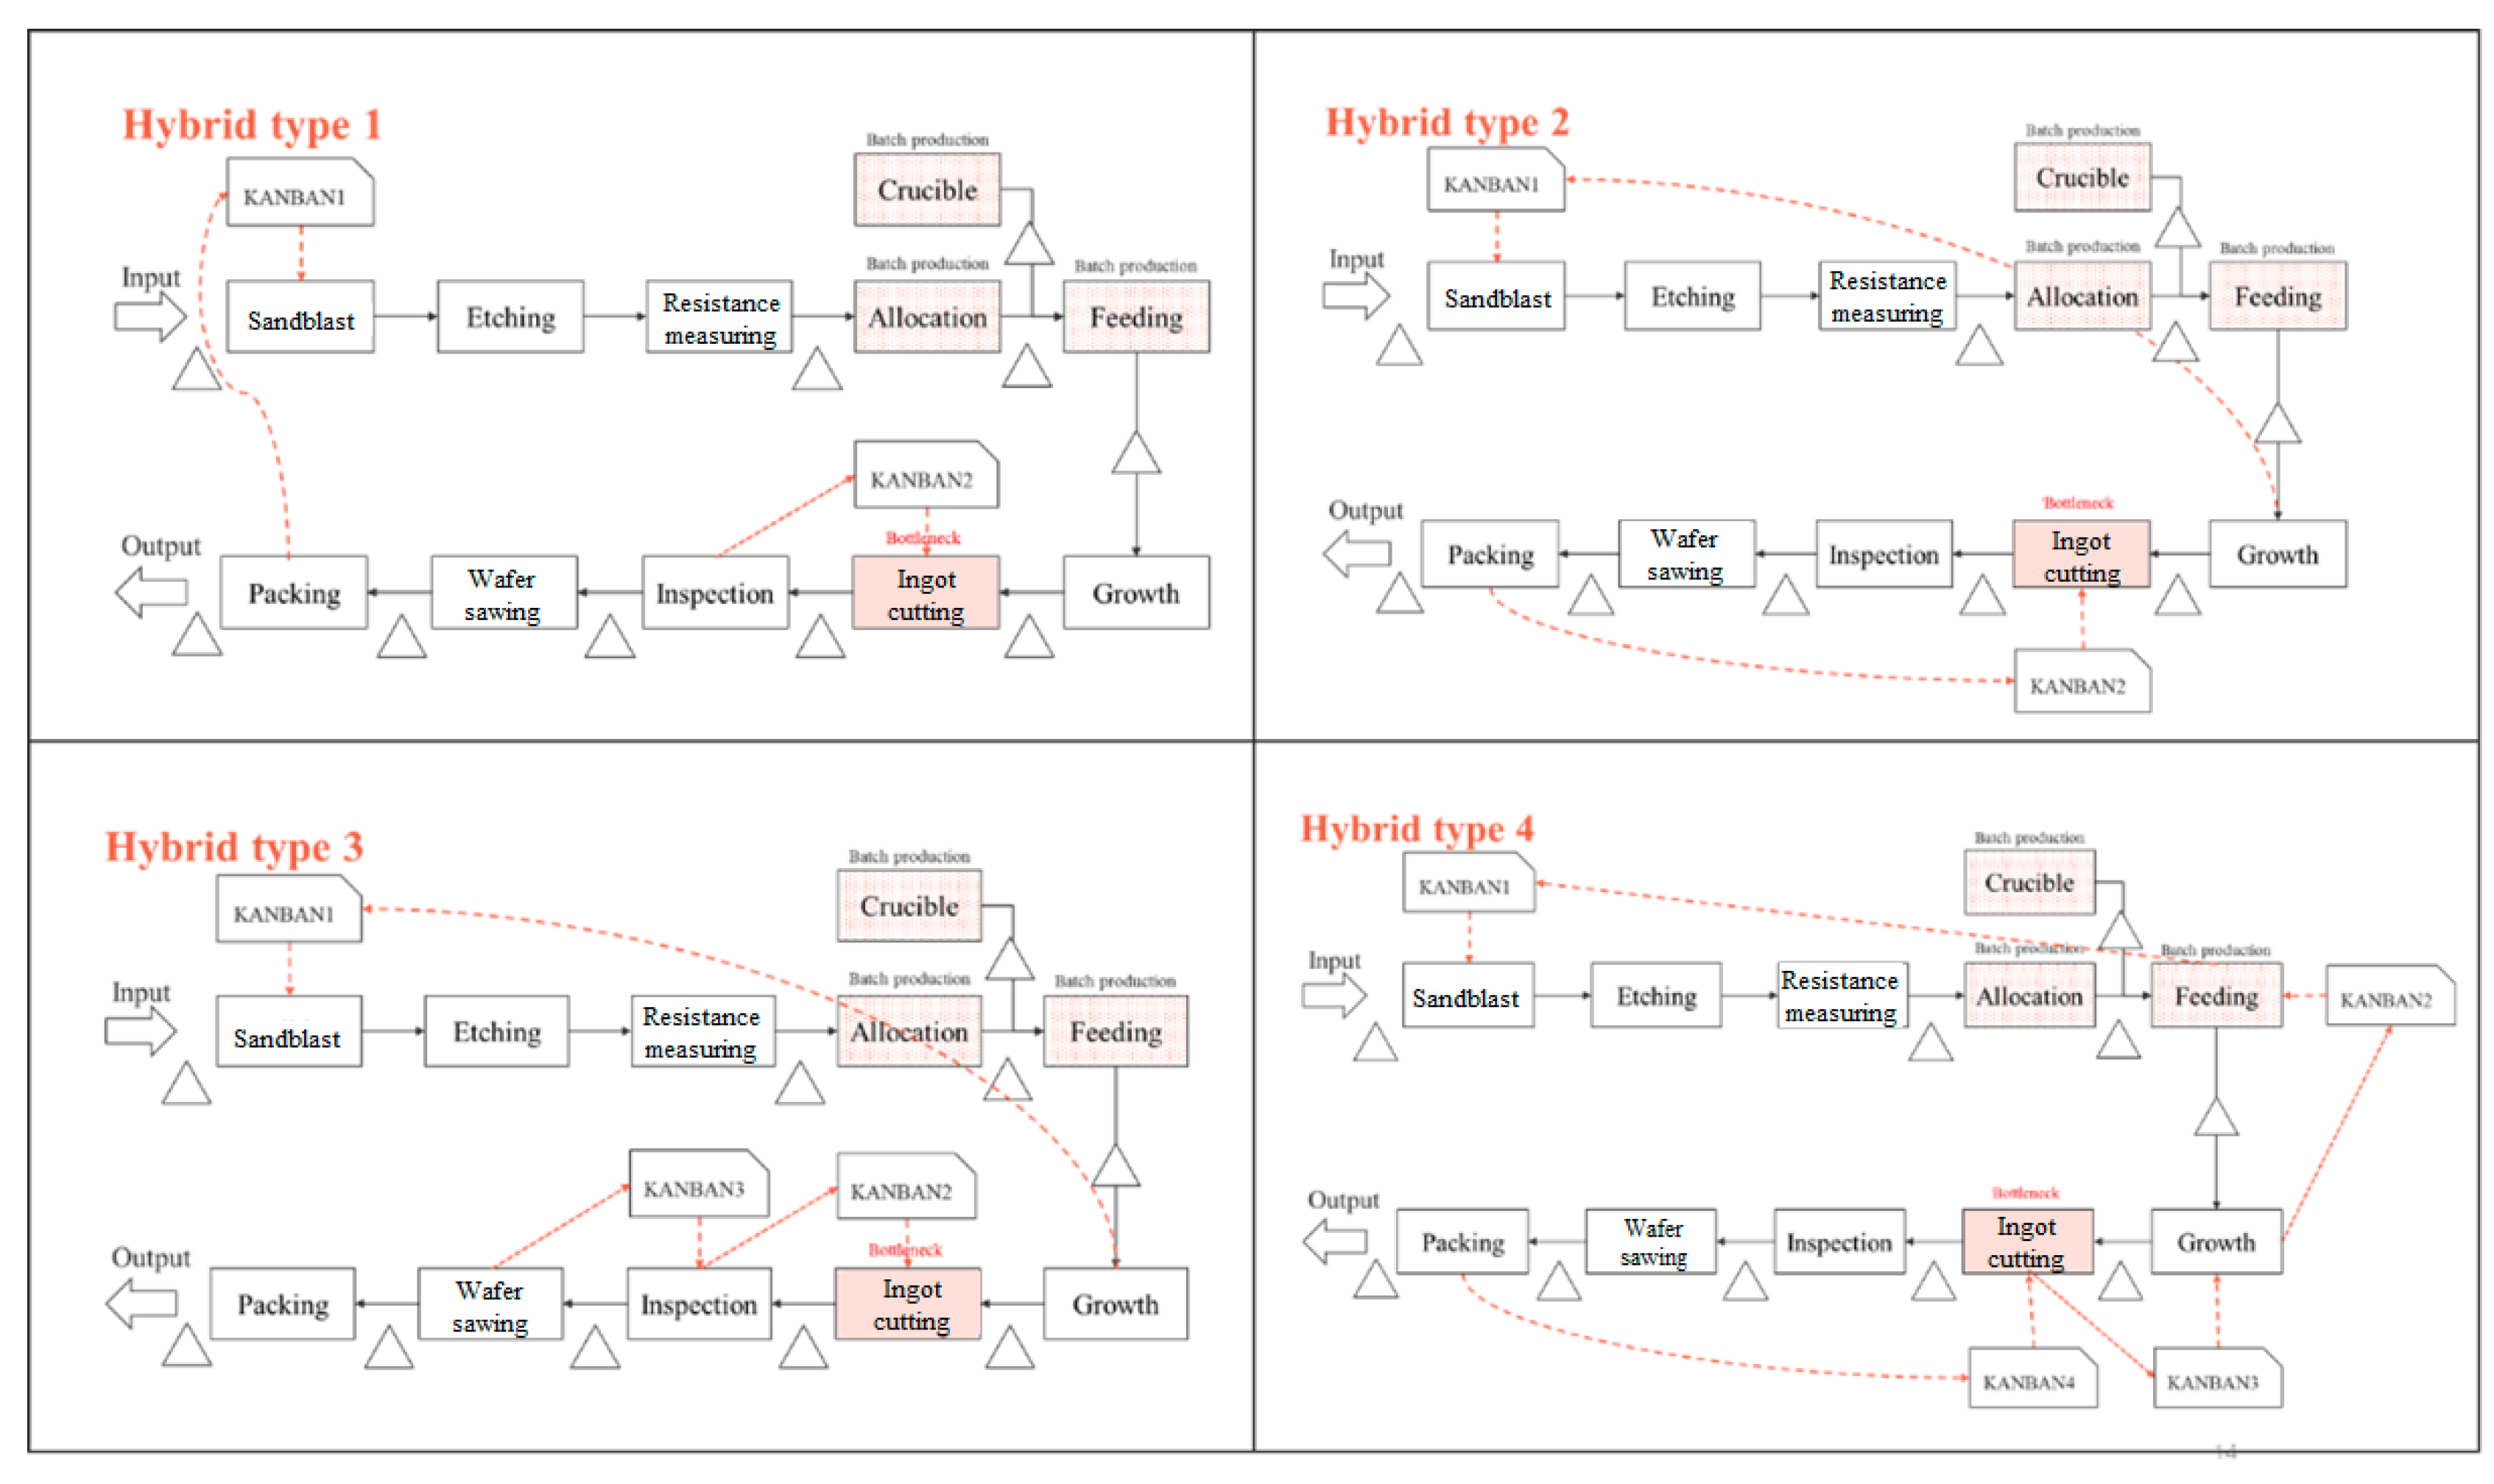
The hybrid production system integrates both kanban and CONWIP systems. Bottleneck stations were determined through a line balance analysis. Four distinct hybrid production systems were analyzed [28,29]. The four systems shown in Figure 3 are briefly described as follows: hybrid type 1—a kanban station was installed before the bottleneck station and a CONWIP system was incorporated for the rest of the production line; hybrid type 2—the bottleneck station was the dividing point for two CONWIP systems; hybrid type 3—a CONWIP system was incorporated before the bottleneck station and a kanban system was incorporated after the bottleneck station; and hybrid type 4—a kanban system was incorporated before the bottleneck station and a CONWIP system was incorporated after the bottleneck station.
For the kanban production system, kanban stations were installed at each workstation. Because the processes from the sandblasting station to the batching station required only manual labor, this section was considered a single workstation, and a kanban station was implemented only at the sandblasting station to pull production. Kanban stations were installed at all the other workstations (Figure 5). The CONWIP production system involved installing one kanban station at the foremost end, which pulled production for the entire system (Figure 6). The hybrid type 1 production system involved installing one kanban station before the bottleneck station and implementing the CONWIP system for the rest of the production line. Figure 7 shows a process flow of the hybrid type 1 simulated system. KANBAN2 was established before the ingot-cutting station. The electrical-property-testing station transmits production information to KANBAN2, and production at the ingot-cutting station does not begin until it receives information from KANBAN2. The rest of the system is pulled using CONWIP. When the final workstation transmits kanban information to KANBAN1, the sandblasting station initiates production. The hybrid type 2 production system involved implementing two CONWIP sections divided by the bottleneck station. As shown in Figure 7, the sandblasting station was the dividing point for the two CONWIP sections. In the front section, the crystal-growing station transmits kanban information to KANBAN1, which was installed at the sandblasting station. In the back section, the packaging station transmits kanban information to KANBAN2. The hybrid type 3 production system involved a simulation divided by the bottleneck station, in which the CONWIP system was implemented before the bottleneck station and the kanban system is implemented after the bottleneck, as shown in Figure 7. The ingot-cutting station was the bottleneck station. Production from the crystal-growing station transmits kanban information to KANBAN1, which was located at the sandblasting station. Each station after the ingot-cutting station had a kanban station, forming a pull production system. The hybrid type 4 production system is the reverse of the hybrid type 3 system. Kanban stations were installed at each station before the bottleneck station. After the bottleneck station, the CONWIP system was implemented by installing one kanban station for pull production.

4.2. Optimal Configuration

Because each of the pull production systems requires its own specific kanban configurations and the number of kanban cards affects the system output, the number of kanban cards was identified as a factor in each pull production system that must be accounted for when attempting to obtain the best performance from that system. In this section, RSM was employed to determine the optimal combination of factor levels. The measurable objectives were defined as the WIP level and cycle time. Based on an annual production of 5840 ingots, the production system yielding the lowest WIP level and the shortest cycle time was identified.
Using the hybrid type 1 production system as an example, the two primary goals were to reduce both the WIP level and the cycle time. The experimental procedure solved for an optimal WIP level as an example and performed sensitivity analysis on the optimal pull production system determined is as follows:
(1) Define the initial value for each of the factors
Two kanban stations were installed in the hybrid type 1 production system, one at the etching station and the other at the ingot-cutting station. The parameters KANBAN1 and KANBAN2 were initially set at 90 and 11, respectively. The combination of an initial experimental range of 70–110 for KANBAN1 and 9–13 for KANBAN2 was chosen.
(2) Fit a first-order regression model
To fit the WIP data to the first-order regression model, the least-squares method was adopted with the level of significance set at α = 0.05. The relationship between the WIP level and all the other variables was obtained. Minitab software was employed to determine the first-order regression model that fit the WIP level and all the other variables (Equation (4)). The WIP target value was set at Y ^ 1 . Among all the regression coefficients, only X 1 was smaller than 0.05 such that this model contained only one variable: X 1 . The adjusted coefficient of determination R-sq(adj) was high, indicating a significant linear correlation between the variable and response values:
Y ^ 1 = 86.279 + 19.310 X 1  
(3) Fit a second-order regression model
To fit an appropriate second-order model, central composite design (CCD) was adopted. The CCD was an experimental design that included a 2 k   factorial or partial factorial design, 2k axial points, the distance from the axial points to the central point determined by α = ( n f ) 1 / 4 (where nf is the number of experiments), and a center point nc. This example included 22 experiments, with α set at 1.414. Five center point experiments were added for a total of 13 experiments.
Regression analysis was performed on the results of the experimental designs of the second-order models. The fit of these second-order models was calculated using Equation (5). These results (Table 3) showed that the adjusted coefficient of determination R-sq(adj) was high, indicating a strong relationship between the response values and the variables:
Y ^ 1 = 85.925 + 19.378 X 1 + 0.419 X 2 + 0.782 X 2 2  
(4) Multi-objective optimization
Although the experiment described above resulted in models that fit the WIP level and cycle time regressions, the obtained solutions were individual target response values because different response values have different target values. The maximum daily demand was approximately 16 ingots, and the yearly output was 5860 ingots. Output within a margin of error of 5% was deemed acceptable. Thus, the objectives were defined as a minimum output of 5700 ingots, a maximum WIP level of 90 ingots, and a maximum cycle time of 9000 min. Accordingly, a solution satisfying these parameter requirements was sought.
First, the WIP and cycle time models in the aforementioned experiment were rewritten in equation form, each with its own target values: Y ^ 1     90 for the WIP level, Y ^ 2     9000 for the cycle time, and Y ^ 3     5700 for the output. Targets were set for the contour maps of models that fit the various response values. The overlapping regions on these contour maps were the regions containing the optimal solution. Minitab software was used to overlay the contour plot tool to solve for the optimal overlapping region (Figure 8). CT is the cycle time and OT is the output. The blank region in Figure 8 contains the optimal parameter settings for this study, and the optimal solution was solved using the simultaneous optimization method.
This study used Minitab software to solve the focal functions (i.e., parameter settings that could satisfy the target values for Y 1 , Y 2 , and Y 3 ). This yielded the coded variables of X 1 = 0.8714 and X 2 = 1.4142 and the predictive values of Y 1 = 84.28, Y 2 = 8562.35, and Y 3 = 5796.31.
Transforming the factors to natural variables yielded KANBAN1 ≈ 92.4 and KANBAN2 ≈ 13.828. Using these data in the system simulation yielded WIP = 81.75, cycle time = 8729.29, and output = 5711. These values matched the anticipated targets set in this study. The kanban stations for the hybrid type 1 production system were, therefore, set to KANBAN1 = 92 and KANBAN2 = 13.
When RSM is used, the needed target can be quickly obtained at a lower experimental cost and less time. Six different pull production systems and optimal kanban configuration combinations were examined, and the results are shown in Table 4. A comparison of the six pull production systems showed that all outputs were similar, but the hybrid type 1 showed the best performance with the lowest WIP level and the shortest cycle time.
In the simulations, the degree of improvement was compared by incorporating the pull production systems into the existing conditions. Table 5 shows that hybrid type 1 showed the highest percentage of improvement: its WIP decreased from 110 ingots to 81 ingots, an improvement of approximately 25.68%, and its cycle time decreased from 10,448.36 min to 8729.29 min, an improvement of approximately 16.45%. These results indicate that the hybrid type 1 system outperformed the other systems in this environment. The sensitivity analysis of this system is described in the following section.
The line balance analysis results showed that the bottleneck station was at the back end of the production line. The number of machines at the bottleneck station was reduced to increase the workstation load and exacerbate the production line imbalance. These changes were input into the system to analyze their effect on the bottleneck station load in the existing system and all the pull production systems. Four levels of bottleneck station loads were defined based on increasing the load by a specific percentage, and the resulting output was compared with that of the current system and each of the pull production systems. Results that differed from each other by less than 5% were deemed to be equivalent. Table 6 shows changes in WIP levels and cycle times resulting from changes to the bottleneck station load. In the existing system, an increase in WIP levels was observed when an increase in the bottleneck station load occurred. WIP levels in the pull production systems were lower than those in the existing system. Figure 9 shows a comparison of the changes observed in the pull production systems resulting from an increase in the bottleneck station load. The cycle time and WIP levels were lower in the hybrid type 1 system than in the other systems.
The sensitivity analysis of the bottleneck station load described above revealed that in the existing production system, an increase in the bottleneck station load led to increases in both the WIP level and the cycle time. However, the hybrid type 1 production system was unaffected by the increase in the bottleneck station load. Thus, this system outperformed the existing production system.
Further analysis of customer demand was performed in this study based on the pull production system with the best performance (i.e., the hybrid type 1 system). The configuration of factors obtained through this study was examined at various levels of demand to determine how this would affect both the hybrid type 1 system and the current system. First, customer demand levels were defined as high, intermediate, and low. A high level of demand was defined as the current annual demand (5840 ingots), an intermediate level of demand was defined as 75% of high demand (5840 × 0.75 = 4380), and a low level of demand was defined as 50% of high demand (5840 × 0.5 = 2920). Table 7 shows the results based on these three levels of demand and the optimal configuration of the factor levels for the hybrid type 1 system, as determined by the system simulation and RSM. Table 8 shows the results of the system simulations of the current system and the hybrid type 1 system. Figure 10 was produced based on the results in Table 8. Both the WIP level and the cycle time were lower in the hybrid type 1 system than in the current system. The sensitivity analysis results showed that the hybrid type 1 system was suitable for this production environment and that it effectively improved the WIP level and the cycle time.

5. Conclusions

Solar silicon manufacturers operate in a flow shop production environment. Production times differ greatly between workstations, resulting in unequal production capacity and unbalanced production lines. WIP accumulation at the bottleneck station results in an excessively long cycle time. A case study was undertaken that relied on an analysis of current conditions based on lean production methods. Optimal kanban card configurations for various pull production systems were obtained through RSM. To decrease the WIP level and shorten the production time, RSM was employed in the design of several pull production systems to optimize the number of kanban cards and to determine the optimal pull production system.
A comparison of the existing system and a pull production system showed that implementing a pull production system reduced the WIP level from 110 to 80 ingots (an improvement of approximately 25.68%) and reduced the cycle time from 10,448.36 to 8729.29 min (an improvement of approximately 16.45%). The study results showed that the hybrid type 1 pull production system achieved the highest performance for the case company and that implementing this system would effectively regulate the WIP level and shorten the cycle time, thereby reducing system waste. In future studies, it would be beneficial to use different research designs to determine the optimal solution and/or to consider whether other research designs produce different results in response to the production environment. In addition, in future studies, researchers could pursue the direction of comparing how pull production systems compare in different production environments or multi-product environments.

Author Contributions

Conceptualization, C.-Y.C., C.-L.L. and C.Y.; Data curation, C.-L.L.; Formal analysis, C.-L.L. and S.-F.L.; Methodology, C.-Y.C. and S.-F.L.; Project administration, S.-F.L.; Software, C.-L.L. and C.Y.; Writing—original draft, C.-L.L. and S.-F.L.; Supervision, C.-Y.C. and C.Y.; Writing—review and editing, C.-Y.C., R.J. and C.Y; Funding acquisition, C.-Y.C. and C.Y. All authors have read and agreed to the published version of the manuscript.

Funding

This research was supported by the National Taipei University of Technology, King Mongkut’s Institute of Technology Ladkrabang Joint Research Program grant numbers NTUT-KMITL-108-03 and KMITL-2564-02-01-028.

Conflicts of Interest

The authors declare no conflict of interest.

References

  1. Müller, A.; Ghosh, M.; Sonnenschein, R.; Woditsch, P. Silicon for photovoltaic applications. Mater. Sci. Eng. B 2006, 134, 257–262. [Google Scholar] [CrossRef]
  2. Conway, R.; Maxwell, W.; McClain, J.O.; Thomas, L.J. The role of work-in-process inventory in serial production lines. Oper. Res. 1988, 36, 229–241. [Google Scholar] [CrossRef]
  3. Meyers, F.E.; Stewart, J.R. Motion and Time Study for Lean Manufacturing; Pearson College Division: Victoria, Canada, 2002. [Google Scholar]
  4. Sugimori, Y.; Kusunoki, K.; Cho, F.; Uchikawa, S. Toyota production system and kanban system materialization of just-in-time and respect-for-human system. Int. J. Prod. Res. 1977, 15, 553–564. [Google Scholar] [CrossRef] [Green Version]
  5. Deleersnyder, J.-L.; Hodgson, T.J.; Muller-Malek, H.; O’Grady, P.J. Kanban controlled pull systems: An analytic approach. Manag. Sci. 1989, 35, 1079–1091. [Google Scholar] [CrossRef]
  6. Seth, D.; Gupta, V. Application of value stream mapping for lean operations and cycle time reduction: An Indian case study. Prod. Plan. Control. 2005, 16, 44–59. [Google Scholar] [CrossRef]
  7. Shah, R.; Ward, P.T. Defining and developing measures of lean production. J. Oper. Manag. 2007, 25, 785–805. [Google Scholar] [CrossRef]
  8. Gstettner, S.; Kuhn, H. Analysis of production control systems kanban and CONWIP. Int. J. Prod. Res. 1996, 34, 3253–3273. [Google Scholar] [CrossRef]
  9. Leonardo, D.G.; Sereno, B.; da Silva, D.S.A.; Sampaio, M.; Massote, A.A.; Simões, J.C. Implementation of hybrid Kanban-CONWIP system: A case study. J. Manuf. Technol. Manag. 2017, 28, 714–736. [Google Scholar] [CrossRef]
  10. Pettersen, J.A.; Segerstedt, A. Restricted work-in-process: A study of differences between Kanban and CONWIP. Int. J. Prod. Econ. 2009, 118, 199–207. [Google Scholar] [CrossRef]
  11. Khojasteh-Ghamari, Y. A performance comparison between Kanban and CONWIP controlled assembly systems. J. Intell. Manuf. 2009, 20, 751–760. [Google Scholar] [CrossRef]
  12. Ōno, T.; Mito, S. Just-In-Time for Today and Tomorrow; Productivity Press: Woodland Hills, CA, USA, 1988. [Google Scholar]
  13. Hopp, W.J.; Spearman, M.L. Factory Physics: Foundations of Manufacturing Management, 2nd ed.; Irwin/McGraw-Hill: Boston, MA, USA, 2001. [Google Scholar]
  14. Womack, J.P.; Jones, D.T. Lean Thinking: Banish Waste and Create Wealth in Your Corporation; Simon and Schuster: New Work, NY, USA, 2010. [Google Scholar]
  15. Williams, E.J.; Ulgen, O.M.; DeWitt, C. Manufacturing modeling methods: An approach and interface for building generic manufacturing kanban-systems models. In Proceedings of the 34th conference on Winter simulation: Exploring new frontiers, San Diego, CA, USA, 8–11 December 2002; pp. 1138–1141. [Google Scholar]
  16. Spearman, M.L.; Woodruff, D.L.; Hopp, W.J. CONWIP: A pull alternative to kanban. Int. J. Prod. Res. 1990, 28, 879–894. [Google Scholar] [CrossRef]
  17. Bonvik, A.M.; Gershwin, S.B. Beyond Kanban: Creating and analyzing lean shop floor control policies. In Proceedings of the Manufacturing and Service Operations Management Conference Proceeding, Hanover, NH, USA, 28 June 1996; pp. 46–51. [Google Scholar]
  18. Gaury, E.; Pierreval, H.; Kleijnen, J.P. An evolutionary approach to select a pull system among Kanban, Conwip and Hybrid. J. Intell. Manuf. 2000, 11, 157–167. [Google Scholar] [CrossRef]
  19. Geraghty, J.; Heavey, C. A comparison of hybrid push/pull and CONWIP/pull production inventory control policies. Int. J. Prod. Econ. 2004, 91, 75–90. [Google Scholar] [CrossRef]
  20. Hodgson, T.J.; Wang, D. Optimal hybrid push/pull control strategies for a parallel multistage system: Part I. Int. J. Prod. Res. 1991, 29, 1279–1287. [Google Scholar] [CrossRef]
  21. Abdulmalek, F.A.; Rajgopal, J. Analyzing the benefits of lean manufacturing and value stream mapping via simulation: A process sector case study. Int. J. Prod. Econ. 2007, 107, 223–236. [Google Scholar] [CrossRef]
  22. Yang, T.; Fu, H.-P.; Yang, K.-Y. An evolutionary-simulation approach for the optimization of multi-constant work-in-process strategy—A case study. Int. J. Prod. Econ. 2007, 107, 104–114. [Google Scholar] [CrossRef]
  23. Lu, J.-C.; Yang, T.; Wang, C.-Y. A lean pull system design analysed by value stream mapping and multiple criteria decision-making method under demand uncertainty. Int. J. Comput. Integr. Manuf. 2011, 24, 211–228. [Google Scholar] [CrossRef]
  24. Yang, T.; Hung, Y.H.; Huang, K.C. A simulation study on CONWIP system design for bicycle chain manufacturing. IFAC-PapersOnLine 2019, 52, 2477–2481. [Google Scholar] [CrossRef]
  25. Onyeocha, C.E.; Wang, J.; Khoury, J.; Geraghty, J. A comparison of HK-CONWIP and BK-CONWIP control strategies in a multi-product manufacturing system. Oper. Res. Perspect. 2015, 2, 137–149. [Google Scholar] [CrossRef] [Green Version]
  26. Romagnoli, G. Design and simulation of CONWIP in the complex flexible job shop of a Make-To-Order manufacturing firm. Int. J. Ind. Eng. Comput. 2015, 6, 117–134. [Google Scholar] [CrossRef] [Green Version]
  27. Rother, M.; Shook, J. Learning to See; Lean Enterprise Institute: Boston, MA, USA, 1999. [Google Scholar]
  28. Wang, Y.; Cao, J.; Kong, L. Hybrid Kanban/Conwip control system simulation and optimization based on theory of constraints. In Proceedings of the 2009 IEEE International Conference on Intelligent Computing and Intelligent Systems, Shanghai, China, 20–22 November 2009; IEEE: Manhattan, NY, USA, 2009; Volume 2, pp. 666–670. [Google Scholar]
  29. Khojasteh-Ghamari, Y. Developing a framework for performance analysis of a production process controlled by Kanban and CONWIP. J. Intell. Manuf. 2012, 23, 61–71. [Google Scholar] [CrossRef]
Figure 1. Value stream map for the manufacturing process.
Sustainability 14 00697 g001
Figure 2. Production line balance analysis in the case company.
Sustainability 14 00697 g002
Figure 3. As-is manufacturing process simulation.
Sustainability 14 00697 g003
Figure 4. Six types of pull production systems.
Sustainability 14 00697 g004
Figure 5. Kanban simulation model.
Sustainability 14 00697 g005
Figure 6. CONWIP simulation model.
Sustainability 14 00697 g006
Figure 7. Hybrid-type simulation models.
Sustainability 14 00697 g007
Figure 8. Multi-response optimization scope.
Sustainability 14 00697 g008
Figure 9. Cycle time and WIP trends under various bottleneck loads.
Sustainability 14 00697 g009
Figure 10. WIP quantity and cycle time at various levels of demand.
Sustainability 14 00697 g010
Table 1. Machine production time.
No.ProcessMachineAverage Production Time (min)
1Etching154.06
2Resistance measuring 130
3Allocation137.5
4Crucible172.57
5Feeding5139
6Growth635030
7Ingot cutting 171228
8Ingot cutting 22633
9Ingot cutting 32706
10Inspection242.3
Table 2. Simulation difference rate.
ItemProduction SystemSimulation SystemDifference Rate
Output (ingots/day)1615.970.17%
Cycle time (ingots/day)9645.2310,448.368.33%
WIP (ingots/day)107110.002.80%
Notes: The parameter values of the simulation model: one year period, 30-day warm-up, and 10 replications.
Table 3. Regression analysis results.
TermCoefSE Coeft-Valuep-Value
Constant86.2790.251344<0.000
X 1 19.310.37651.33<0.000
X 2 0.750.3761.990.093
SR-sqR-sq(adj)
0.7524280.99770.997
Table 4. Comparison of the pull production systems and industrial practice.
Production TypeKanban Stations No. of KanbanOutputWIPCycle Time
(Ingots)(Ingots)(min)
Kanban(Etching, feeding, growth, cutting, inspection)(16, 6, 58, 22, 5)5724.0089.99281.97
CONWIP(Etching)−895790.6085.28787.68
Hybrid 1(Etching, cutting)(92, 13)5711.0081.758729.29
Hybrid 2(Etching, cutting)(75, 22)5766.3383.338926.74
Hybrid 3(Etching, cutting, inspection)(73, 18, 6)5743.8085.48891.64
Hybrid 4(Etching, feeding, growth, cutting)(21, 5, 59, 19)5784.2084.99713.12
Industry practice 5829.90111.710,163.13
Table 5. Improvement ratio between pull production systems and industrial practice.
Pull Production SystemWIP Improvement RatioCycle Time Improvement Ratio
Kanban18.27%11.16%
CONWIP22.55%15.89%
Hybrid 125.68%16.45%
Hybrid 224.25%14.56%
Hybrid 322.36%14.90%
Hybrid 422.82%7.04%
Table 6. Comparison of the cycle time and WIP at various levels of bottleneck loading.
Bottleneck Loading0%7.50%15.60%34.50%48.30%
Cycle TimeWIPCycle TimeWIPCycle TimeWIPCycle TimeWIPCycle TimeWIP
Kanban9281.9789.99726.6582.3310,527.3090.3312,209.638413,320.3285
CONWIP8787.6885.29302.1487.1310,077.0087.3811,796.2786.2512,984.4986.88
Hybrid18729.2981.759121.9280.49858.1180.811,526.5082.512,683.2279
Hybrid28926.7483.339389.8682.6710,165.508511,773.8382.6712,830.0779.33
Hybrid38891.6485.49214.4282.679960.9979.3311,532.7182.3312,555.8679.33
Hybrid49713.1284.910,257.448611,101.1088.6712,848.2486.6714,005.9387.33
Industry practice10,163.13111.726,532.32474.548,526.70931.286,078.401716.9105,765.212138.3
Table 7. Hybrid type 1 at various levels of customer demand and various kanban configurations.
Customer DemandKanban ConfigurationOutput (Ingots)WIP (Ingots)Cycle Time (min)
EtchingCutting
100%92135818808657.24
75%67154416.6361.258705.83
50%488299441.889429.97
Table 8. Comparison of WIP and cycle time at various levels of customer demand.
Customer DemandIndustrial PracticeHybrid Type 1
WIP (Ingots)Cycle Time (min)WIP (Ingots)Cycle Time (min)
100%1109159.26808657.24
75%63.758737.4661.258705.83
50%43.639613.0241.889429.97
Publisher’s Note: MDPI stays neutral with regard to jurisdictional claims in published maps and institutional affiliations.

