Abstract
The present work examines the standard of living among the Polish municipalities of the Euroregion Baltic—an institution engaged in cross-border cooperation which is striving to improve the standard of living in border areas. The time span of the study extended to the first full year after Poland’s EU accession (2004), and to the 15th anniversary of the accession and the 20th anniversary of the establishment of the Euroregion Baltic (2019 in both cases). All 38 Polish municipalities (NUTS 5) of the Euroregion were covered by the study. Using a synthetic index of standard of living based on Hellwig’s development pattern method, the municipalities were grouped into four classes according to their index value. Hierarchical methods were used to identify which municipalities had the most similar standards of living. The highest standard of living was recorded for the small, tourism-oriented town of Jastarnia and for strong urban centers (Gdańsk, Gdynia, Olsztyn, and Elbląg). Rural municipalities, especially those situated near the Polish-Russian border (Kaliningrad Oblast), had lower standards of living. The results show a progressing polarization in the standard of living, manifested by a widening gap between first-class municipalities and the other classes. This stratification was attributed to multiple factors, including the endogenous potential of the communities.
1. Introduction
There have been many different approaches to the idea of promoting social/economic development, and they have been actualized at multiple levels (micro-, macro-, and meso-economic). It was in light of this concept that supporting regional development became an important keystone of EU economic policy. Among member states, the national cohesion policy was mostly implemented at the regional level (NUTS 2), as it was (and is) not uncommon for living conditions to be strongly polarized across different regions. This differentiation has often been much more pronounced in border regions, especially in cases where the neighboring region was part of a non-EU country. Cross-border cooperation built around Euroregions was created as a tool of supporting economic development. The development of cross-border cooperation dates back to the 1950s [1], and is believed to have been first formally defined by the Madrid Convention of 1980 [2]. Of course, this form of cooperation was not a novel idea in itself, but EU programs did lay the groundwork for institutionalized development of these entities. Notably, the term of “Euroregion” is not an official designation, meaning that it is not used in official EU documents and international cross-border cooperation agreements between states (unlike the term cross-border cooperation (or CBC) [3] (p. 28). Therefore, it is an informal designation, though commonly used in the literature on the subject [4] (p. 115), [5] (p. 192), [6] (p. 14), [7] (p. 269). In Polish documents, the “Euroregion” is described in reference to the Linkage Assistance and Cooperation for the European Border Regions (LACE), wherein it is considered to be a formal framework for cross-border cooperation that includes local/regional actors and, in many cases, economic and social partners [8]. Its organizational structure usually consists of an elected council, an executive board, thematic working groups and a secretariat [9]. A period of increased interest in cross-border cooperation and its formalization in Poland started in the early 1990s (i.e., after Poland’s political transition) [10] (p. 49). Pursuing this form of cooperation was intended to support bilateral relationships between local communities and to be a vital component of socio-economic convergence. The first Euroregion that included Polish administrative units was established in 1991 on the south-western border of Poland—Euroregion Neisse, which also encompassed German and Czech municipalities [11] (p. 105).
The most important drivers for the establishment of cross-border regions, first at the western border and then in other parts of Poland, include:
- (1)
- The new political topography of Poland’s western border, with the Polish-German border also becoming the outer EU border;
- (2)
- the conclusion of the Poland-EU Association Agreement, which meant that the cross-border cooperation between Poland and Germany was the first of its kind across Central and Eastern Europe;
- (3)
- the pursuit of cross-border cooperation by local and regional communities [12].
- (4)
- After Poland acceded to the European Union in 2004, the Polish eastern border became the outer EU border, thus enhancing its role (especially with regard to the 2007 enlargement of the Schengen area) [13] (p. 3).
2. Theoretical Overview
The literature on the subject includes a wide variety of publications dealing with regional development and cross-border cooperation in Euroregions [1,14,15,16,17,18,19,20,21,22,23,24,25,26,27,28,29,30,31,32], acknowledging its importance while also delineating the benefits and limitations of this form of international cooperation.
European Commission pointed the priorities for cross-border cooperation [14]. Perkmann [15], Scott [16], Yoder [17], Passi [18] and Lepik [19] outlined the potential of euroregions including regional point of view. Telle [20], Medeiros [21] and Jeřábek [22] came with the refreshed attempt after almost two decades of its functioning. From polish perspective, with hopes and expectations, it was well-described by Malendowski [23,24] and Palmowski [25], especially before polish accession to the EU. In subsequent years variety of topic were taking into account, including, among others, cultural potential [26,27], good-governance [28,29], and socio-economic potential of Euroregions [30]. Lately, discussion about the usefulness and activity has occurred [31,32].
The Euroregion examined in the present paper was established in 1998 in Malbork (PL) under the Agreement on Establishing the Euroregion “Baltic” [12] and encompasses areas of five countries: Denmark, Sweden, Poland, Russia, and Lithuania (Figure 1). This Euroregion is one of the biggest of its kind in Europe in terms of the number of countries included, its area, and its population. The unique nature of the agreement is highlighted by the participation of Russia (Kaliningrad Oblast), a key partner in economic and political relations of Member States [33,34,35]. Cooperation under Euroregion Baltic also furthers the intention to develop the Baltic Sea region under the European Union strategy for the Baltic Sea region (EUSBSR) put forward by the EU [36].
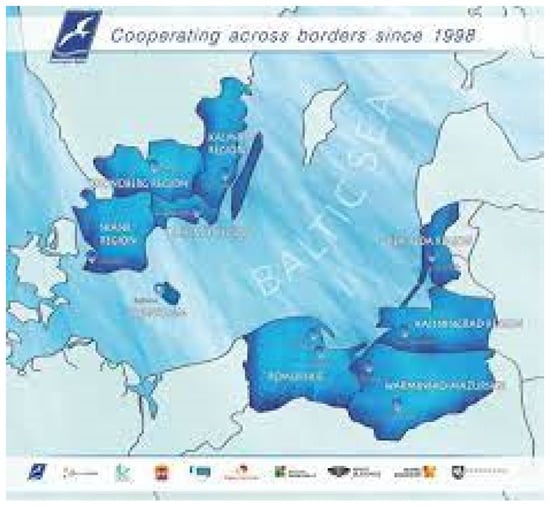
Figure 1.
Members of the Euroregion Baltic.
The Euroregion Baltic is a local-national initiative, meaning that it is managed by both local and national authorities. A Euroregion does not have legal personality, which was addressed by incorporating the Association of Polish Communes Euroregion Baltic in Poland as a legal entity. The Association was thus able to act as a signatory to the Euroregion founding agreement. As of 2020, the Euroregion consisted of 38 municipalities (NUTS 5) of two Polish voivodeships (provinces): the Pomorze voivodeship and the Warmińsko-Mazurskie voivodeship [37] (Figure 2). The newly established association had its key objective defined as: civic betterment for the region’s population in general and for the border territories in particular [38] (p. 2). The organization mainly executes its specific objectives through aid programs, both as a managing body and as a beneficiary.
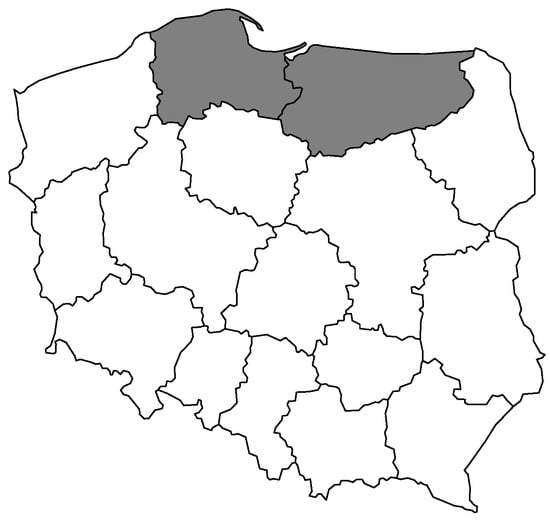
Figure 2.
Polish voivodeships as a members of the Euroregion Baltic.
The notion of living standard is interpreted very liberally in social sciences. There is no single accepted definition of the term, which is why researchers contend that interchangeable use of different designations (level of living, standard of living) is justified [39] (pp. 13–29). However, it is held that the level of living should be expressed using comparable, objective metrics. The first synthetic measurements of the standard of living arose from the concept put forward by a community of UN experts led by J. Drewnowski and W. Scott [40]. Over time, standard of living came to be associated with welfare [41]. However, as research progressed, it became clear that quantifying welfare purely on the basis of measurable factors is not without its problems [42,43,44,45], facilitating a shift towards the notion of well-being [46,47,48].
After an initial outpouring of research on the Euroregion Baltic (in the 1990s and the turn of the century which focused mainly on the social and political implications of its establishment [49,50,51,52,53,54,55,56] the interest gradually waned. As duly noted by Howaniec and Lis [8] (p. 5), the Euroregion Baltic is currently the least popular subject of works on Polish Euroregions. Given this decrease in economic research work, and keeping in mind the objectives set out in the Statute of the Association of Polish Communes Euroregion Baltic (improving living standards), the noted dearth of research work on the subject is all of the more striking.
In view of this, the aim set out for the present study was to examine the standard of living in the Polish municipalities of the Euroregion Baltic in 2005 (the first full year after Poland’s EU accession) and 2019 (which marked 15 years of EU membership and the 20th anniversary of the establishment of the Euroregion Baltic). The following hypothesis was put forward for the purpose of this analysis:
Hypothesis 1 (H1).
While the standard of living in Polish municipalities of the Euroregion Baltic has improved, the ranking of the assorted municipalities did not change between 2004 and 2019 due to their intrinsic endogenous potentials.
The research questions posed in the paper were addressed by employing a multidimensional analysis to derive a synthetic living standard index. The Euroregion Baltic municipalities were then ranked according to the value of this measure. Additionally, hierarchical methods were used to identify which municipalities were the most similar in terms of standards of living.
3. Materials and Methods
The level of living was assessed with the so-called synthetic measure of development, which allows presenting a situation of regional differentiation in the level of living, considering numerous socio-economic categories, in an easily accessible manner (i.e., through just one numerical value). This is achieved via the transformation of a multi-dimensional set of data to a single numerical value, typically from a predefined range of values. In the case of taxonomic methods, the selection of indicators will always be influenced by the author’s subjective evaluation. The literature of the subject emphasizes that the study of the same phenomenon conducted with another set of diagnostic features could bring different results. Thus, the analyzed phenomenon can be described with the utmost clarity. Next, the rearrangement of these numerical values enables scrutinizing the situation in particular areas and detect mutual relationships. However, the procedure is rather complex as it comprises several steps, which will be described in greater detail underneath.
What is fundamental for the reliability of the achieved results is selecting diagnostic variables (partial factors). They must fulfill the formal and statistical requirements, but above all, they must pertain to the subject of an analysis. Variables submitted to the final analysis were distinguished by: general approval, measurability, accessibility of numerical data, relatively high quality, and very strong connection to the subject matter [57] (pp. 36–37). One of the attributes of the variables proposed in this study was their realness, which in turn arose from the data being made relative to the population size and from the inclusion of their importance expressed as a percent contribution of each phenomenon. This approach enabled excluding the impact of the size of a rural municipality (measured by the size of its population or in other absolute numbers) on generated values of the diagnostic variables (and consequently, on the subsequent classification of municipalities). Given the above, the empirical research included only these variables which met the requirements established in connection with the formal and statistical criteria. The following were treated as necessary conditions [58] (p. 95):
- (a)
- Completeness of data in the entire analyzed time series;
- (b)
- Sufficient spatial variability, measured with the variability coefficient (dividing standard deviation by mean average; vj > 10 per cent);
- (c)
- Absence of excessive mutual correlation of variables (the Pearson correlation coefficient < 0.85).
The occurrence of strongly correlated characteristics in the set of diagnostic variables means that these characteristics assign greater importance to the data, which are replicated in the performed analysis (similar data are entered into the analysis via correlated variables). This may lead to a situation where the taxonomic analysis would yield an unreliable description of the analyzed reality due to excessive weight of excessively correlated variables. Although the range of Pearson correlation coefficient in most papers is restricted to over 0.9 [56], to increase the level of elimination strongly correlated variables the level was established to 0.85.
Once the diagnostic properties had been chosen, the subsequent stage of the study was undertaken, which consisted of unitarization. Unitarization (next to standardization and normalization) is one of the normalizing formulas which bring variables to a certain range (to a state of comparability) while removing units of measure. This procedure helps avoiding situations in which variables with high absolute values (by an order of magnitude compared to other variables) would have a decisive contribution to the construction of the synthetic indicator of the level of living. This would mean, in other words, that the results of classification might be distorted by these variables, by accentuating their impact relative to the other ones. Compared to standardization, unitarization allows avoiding a situation where extreme values of certain variables would bias the final results of the synthetic indicator calculations. Unlike standardization, unitarization enables eliminating such situations, as it brings all data down to an interval from 0 to 1, both left- and right-bounded [59] (p. 18). This stage enabled transforming variables (often expressed in different units) to a state of comparability (in our case, to express them in a range from 0 to 1), using the following formula:
:
—unitarized value of the jth variable for the ith object,
—value of the jth variable for the ith object.
Once the character of each of the variables included in the research had been evaluated (which meant that they were identified as stimulants or destimulants), the destimulants had to be submitted to the process of stimulation (i.e., to the process of a destimulant transformation into a stimulant) in order to ensure that the direction of impact for all of the variables was the same and that higher values of the synthetic measure represented a higher level of living. The following stimulation formula was employed to this end [60] (p. 18):
where:
j—a variable,
i—the research object (municipality),
a, b—arbitrary constants: b = 1, a =,
—value of the jth destimulant in the ith object.
The consecutive step in our analysis involved the derivation of coordinates of the template composed of the most advantageous values scored by the individual variables in the municipalities analyzed:
Afterwards, distances were calculated between individual municipalities and the template, using the Euclidean metric in the following form [61] (p. 69):
where:
di0—distance of the object to the template
zij—value of normalized variable j for the ith of this object
z0j—coordinates of the template object for the jth variable.
The penultimate step in the research was to determine the value of the synthetic indicator, which served to arrange municipalities with respect to their inhabitants’ level of living. The calculations were based on the following formulas [61] (p. 69):
where:
Si—synthetic measure of development,
di0—distance of the object from the template, —arithmetic mean d0,
S(d0)—standard deviation d0
Once the municipalities had been arranged in terms of the value of the living standard measure, the final stage of analysis was to classify individual territorial units into four clusters, depending on the synthetic indicator value. The classification was made in the following intervals:
where:
wi—synthetic indicator,
—mean value of the synthetic indicator,
—standard deviation of the synthetic indicator.
Based on the selected variables, differences in the level of living were analyzed using the Hellwig’s method [62], (pp. 304–320), one of the popular multidimensional methods (methods of linear ordering), similar to the TOPSIS method [63] (pp. 153–158). The synthetic values of development measure achieved allowed for the linear arrangement of municipalities in terms of the intensity of the scrutinized phenomenon.
The above analysis was complemented with the determination of similarities in the level of living of inhabitants of the discussed territorial units. The municipalities were grouped using the hierarchical cluster analysis methods aimed at distinguishing possibly the most homogenous clusters of objects considering the similarity in terms of the structure of individual observations. In this study, these were the synthetic measures of the level of living. The distinguished groups of objects should be strongly differentiated between groups but homogenous within them as much as possible [58] (p. 66). In brief, this method aims to minimize the sum of squares of standard deviations of two clusters, that can be formed at each stage, and employs the analysis of variance approach to estimate distances between the clusters.
Ultimately, the Ward’s method was chosen to achieve a hierarchy of agglomerations, in which the starting point is the number of clusters equal to the number of objects of a study. The criterion applied to group the units into higher-order clusters (groups) was the minimum differentiation in the values of the traits [64] (p. 122) that served as the criteria for the segmentation regarding the values of the clusters created at the consecutive steps [65] (p. 6). As a result, objects included into particular groups were characterized by the highest possible similarity of the analyzed traits. In turn, the subsequent iterations are defined by the distance (dip) between a newly created cluster and the remaining ones, derived from the following formula [66] (p. 278):
where:
ni—number of items in cluster i,
nj—number of items in cluster j,
nk—number of items in cluster k,
dik—distance from the original cluster i to cluster k,
djk—distance from the original cluster j to cluster k,
dij—distance between the original clusters i and j.
The Ward’s method is widely accepted owing to its theoretical properties and satisfying results of simulation studies. By completing a series of simulations, T. Grabiński and A. Sokołowski proved that the effectiveness of finding the true structure of data with this method is by around 40% higher than obtained with the second most common method, one of the farthest neighbor clustering. Cf. [67], [after:] [68]. Its application allows achieving excellent results of clustering, where clusters are very homogeneous. Its other advantage is the clarity of presentation via dendrograms.
In an attempt to create a synthetic measure of development that would describe the spatial differentiation in the level of living, the first step of the taxonomic stage of the research was to select diagnostic traits. Worthy of emphasizing is the highest subjectivity of this step of the research. A scientist needs to design such a range of characteristics that would best represent the analyzed phenomenon. Our choice of diagnostic variables to calculate the synthetic measure of development was based on criteria connected with the subject matter and the formal and statistic aspects. The selected variables were characterized by the following properties [57] (pp. 37–38). They were commonly approved, highly relevant for the subject matter, measurable, supported by available numerical data, relatively high in quality, and were derived from a thorough review of the literature. The variables were transformed relative to the populations of rural municipalities to minimize the influence of the size of a given municipality on the achieved values of the variables.
The research sample consisted of statistical data connected with the standard of living in 38 municipalities of the Association of Polish Communes Euroregion Baltic (Figure 3 and Figure 4). The parameters chosen for the study are measurable and reliable, as they were derived from the official publications issued by the GUS Polish Statistical Office (Bank of Local Data) [69]. A comparative analysis was performed for the years 2005 and 2019 to verify the hypothesis that the level of living in the Euroregion increased after Poland accessed to the European Union.
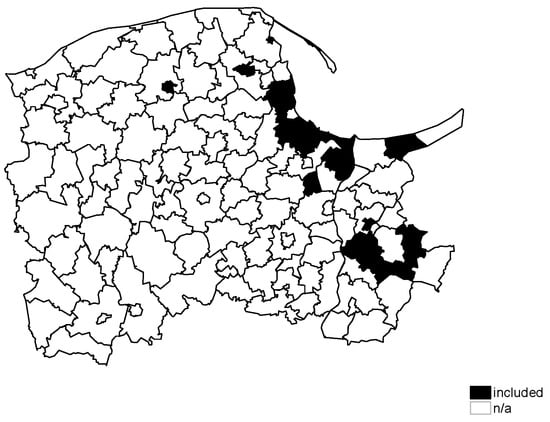
Figure 3.
Municipalities from Pomorskie.
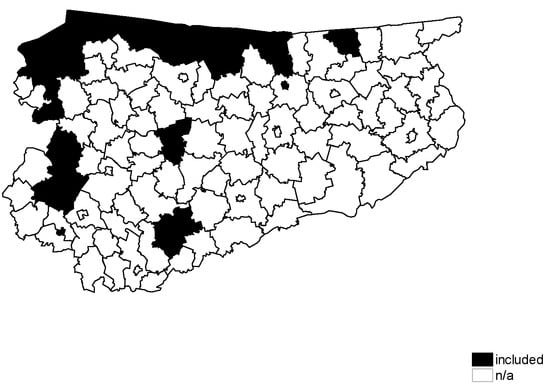
Figure 4.
Municipalities from Warmińsko-Mazurskie.
The assorted municipalities of Euroregion Baltic are highly heterogeneous. The Polish administrative division classifies municipalities (NUTS 5) by type, including: strictly rural municipalities with highly dispersed populations and small communities (referred to as ‘rural municipalities’ in the nomenclature and designated as ‘R’ herein); diversified municipalities that include a principal urban center as their seat, as well as surrounding communities (categorized as urban-rural municipalities, designated ‘U-R’ herein) and, finally, strictly urban municipalities (designated ‘U’ herein). The last category is in itself multifarious. Urban municipalities include large, often metropolitan cities, and regional urban centers that serve as reference points for the surrounding, highly rural communities. This is important in terms of the social and economic potential of the municipality, as well as the endogeneity of its growth drivers. In the case of the Euroregion Baltic municipalities, this distinction becomes apparent in two scenarios in particular. First, when two kinds of municipalities (i.e., urban and rural) from the same region benefit from their Euroregional status (these being: Bartoszyce, Braniewo, Elbląg, Górowo Iławeckie, and Iława). The second refers to a collection of large urban centers, often near regional capital cities (Gdańsk, Gdynia, Olsztyn, and Elbląg) with local population centers and hubs of economic activity (e.g., Bartoszyce, Górowo Iławeckie, Iława, and Kętrzyn). In the second case, the endogenous potential of the unit will favor strong urban centers.
The variables included in the analysis pertain to several fields of life (e.g., demography, housing, labor market, social and cultural infrastructure, environmental protection, and financial indicators of the local government bodies). Some of the potential variables were eliminated at the early selection stage, mostly due to the incompleteness of data or, in some cases, since the aggregation of data at this level of the administrative division was impeded by organizational and formal considerations. The formal and statistical tests made it possible to collate a final set of variables describing spatial differentiation in the level of living in municipalities of Association of Polish Communes Euroregion Baltic (Table 1).

Table 1.
Diagnostic variables considered in the synthetic indicator of the standard of living.
The list of variables is original, however not so far away from Zeliaś’s way of thinking about the list of standard of living’s indicators [56]. Later, similar variables were used in research conducted by Johann about standard of living in the EU countries [70], Sompolska-Rzechuła [71] about polish voivodships, Cheba [72] about cities, Malinowski about entrepreneurship [73], and developed lately by, among others, Miłek [74] and Brambert and Kiniorska [75]. However, there are also wider attempts to describe those issues [76,77]. Majority of the mentioned researchers chose taxonomic method for their studies.
4. Results and Discussion
The results of the analysis produced some interesting insights. Firstly, a comparison between the diagnostic values from 2005 and 2019 by municipality shows that the values have increased significantly, a finding somewhat indicative of improvements in the standard of living in these areas. There was also a substantial rise in expenditures by local government authorities, attributable to their increased wealth. All of the municipalities increased their total expenditures per capita several times within the examined 15-year period. The additional spend extended to municipal services and environment protection, as well as municipality expenditures on culture, resulting, no doubt, from the increase in own income of the municipalities per capita. The increased spending was matched by severalfold increases in revenues. Over the period, the municipalities (especially in rural areas) made great strides towards furnishing housing units with basic mechanical & plumbing installations and improving municipal infrastructure coverage. New housing stock was constructed in the municipalities as well, a trend driven mainly by private actors (companies and households). Newly commissioned dwellings were usually larger than existing stock (again, mainly in suburban and rural areas), thus contributing to better availability of housing and improving opportunities for residents to leave parental households. With a larger number of residential properties on the regional level, housing overcrowding indicators showed improvement (the set of diagnostic variables included number of people per room). The same 15-year period also saw progress in terms of entrepreneurship and social engagement [78,79].
Poland was beset by social and economic problems during its political transition and the turn of the century [80] (pp. 322–332), [81] (pp. 3–13), [82] (pp. 453–470), [83]. Unemployment was certainly one of them, especially in rural areas, with unemployment rates hovering around 30% of working-age population in extreme cases (35.3% in the municipality of Lelkowo in 2005). In contrast, the share of unemployed persons in working-age population held under 10% in 2019, even oscillating around the natural rate of unemployment in some municipalities. However, the analysis also showed a prevailing negative trend for dependency ratios, though this was, of course, a function of global trends in demographic ageing and other factors [84], procrastination in marital and reproductive decisions [85] as well as changing life styles and priorities [86]. The trend is mostly noted in large urban centers, meaning that in 2019 every third resident of Gdańsk, Gdynia, Olsztyn and Elbląg (the largest population centers within Euroregion Baltic) was post-working age.
Due to the considerable changes in local government expenditures and incomes [87] (p. 83), [88] (pp. 124–127), [89] and the growing Polish economy during the examined period [90] (p. 149), the reference points for the highest values of diagnostic variables remained the same. This would appear reasonable given the model-based nature of the synthetic index of standard of living. Higher index values were mainly noted for communities that moved up in the rank lists. In contrast, those that ranked higher in 2005 than in 2019 showed higher synthetic index values for the first year. The results of the study and the placement of municipalities in the index within the examined time interval are presented in Table 2.
Table 2.
Ranking of municipalities based on the synthetic measure of the standard of living in 2005 and 2019.
The synthetic measure created to determine the standard of living in municipalities produced the highest value for Jastarnia, a relatively small town (approx. 3700 residents in 2019) situated in the Hel peninsula and one of the leading seaside recreational tourism centers in Poland. With tourism as its primary source of income, Jastarnia has placed in Polish municipality wealth indexes, and the findings of the present study seem to affirm this distinction [91] (pp. 93–101), [92] (p. 16). The next few ranks were occupied by the largest cities of the two voivodeships included in the Euroregion Baltic. In 2005, the municipalities with top standards of living were limited to the largest cities: Gdańsk, Gdynia, Olsztyn, Elbląg, with Jastarnia as the sole exception to the rule. Conversely, the set of municipalities with top standards of living expanded in 2019 to include two smaller communities (Table 2), namely the municipality of Puck (situated near Jastarnia, with shared focus on tourism) and the rural municipality of Dywity. The latter, located in the immediate vicinity of Olsztyn (Warmińsko, Mazurskie’s capital city) benefited the most from urban sprawl (i.e., a process that manifests most notably in the immigration of working-age households and increased attractiveness as a place for doing business) [93] (p. 129), [94] (pp. 57–65). Dywity also boasted one of the highest standards of living in the entire Warmińsko-Mazurskie Voivodeship [95]. Urban sprawl accounted for the most pronounced positive developments evidenced by the index of municipalities created for this study [96]. Comparing the results for the two marginal years, the most drastic improvement was noted in the rural municipality of Elbląg and the rural municipalities situated near local urban centers (i.e., Iława and Bartoszyce (Table 2)).
The highest placements were similar across both years, corroborating the hypothesis of the present paper (i.e., that the spatial differentiation in the standard of living between the Polish municipalities of Euroregion Baltic has been a fixed factor). The hierarchy of municipalities proved to be fairly stable, with only sporadic and relatively small shifts in classification noted (Table 3). The values followed a normal (Gaussian) distribution.
Table 3.
Classification of the Polish municipalities of Euroregion Baltic into four types, by the synthetic value of the standard of living.
The results also corroborated the assumption regarding endogenous potential, which is the cornerstone of social and economic development [97] (pp. 25–30). Rural municipalities, with limited demographic, social and economic potential, ranked last in all cases, which further speaks to a fixed ranking hierarchy (Figure 5 and Figure 6). The rural municipalities of Warmińsko-Mazurskie Voivodeship were found to have the lowest standard of living among the Polish municipalities of Euroregion Baltic, according to the synthetic index created for this study (Figure 5b and Figure 6b). This group showed a high proportion of municipalities situated along the border with the Kaliningrad Oblast [95] (p. 220), [98] (p. 54). Despite efforts towards stimulating the economy and standard of living within these territories [99,100,101] (p. 575), it seems that mostly larger urban centers (Figure 5a and Figure 6a) have benefited from advantages such as the “local border traffic regime” [102,103] (p. 1422). The municipality of Lelkowo suffered the greatest drop in the rank list among the units (Table 2). In both sets, the rural municipality of Braniewo was found to rank last in terms of the synthetic index of the standard of living (Table 3). Lelkowo, Braniewo, and the Polish municipalities of the Russian Federation border belt can be assumed to suffer from long-term repercussions of centrally planned economy and insufficient siting of economic activity, which is the lynchpin of local community development [104] (p. 237), [105] (p. 87).
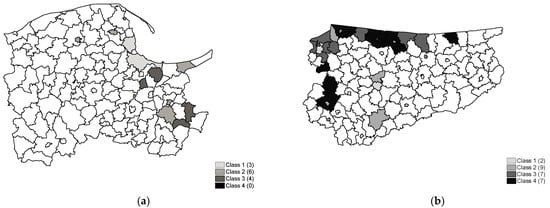
Figure 5.
Standard of living in the municipalities of Pomorskie (a) and Warmińsko-Mazurskie (b) in 2005.
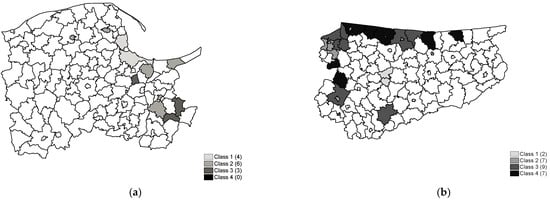
Figure 6.
Standard of living in the municipalities of Pomorskie (a) and Warmińsko-Mazurskie (b) in 2019.
This spatial differentiation of living standards made it possible to identify municipalities with high living standards and problem areas. The last step of the study was to use Ward’s method to group the municipalities most similar in terms of standards of living. The highest possible homogeneity of living standard values was targeted, producing five clusters for 2005 (Figure 7). Jastarnia, having the highest synthetic standard of living index, was the sole municipality in its cluster. The second cluster consisted of the major cities of Euroregion Baltic: Gdańsk, Gdynia, Olsztyn, and Elbląg. The synthetic index value for the Braniewo urban municipality (ranking 19th at 0.2886) demarcated this main grouping of municipalities in the set. All municipalities that placed lower in the list had poorer standards of living, and were thus grouped in the third and fourth clusters of 6 and 13 units, respectively. Each such cluster exhibited maximum internal homogeneity. In 2019, Jastarnia remained a cluster of one, but the second cluster of municipalities expanded to include four more units (Figure 8). There was a high discrepancy in the synthetic standard of living index between the first two clusters and other municipalities, speaking to a high polarization of living standards that results, in practice, in regional divergence. The third, largest cluster, demarcated by the urban municipality of Elbląg (0.2946) encompassed 18 units whereas the fourth cluster consisted of the eleven municipalities most similar in terms of living standards. Mikołajki Pomorskie, Bartoszyce, Milejewo, and Sępopol were incorporated into the fourth class, which initially only covered the rural municipalities of Barciany, Zalewo, Budry, Rychliki, Górowo Iławeckie, Lelkowo, and Braniewo.
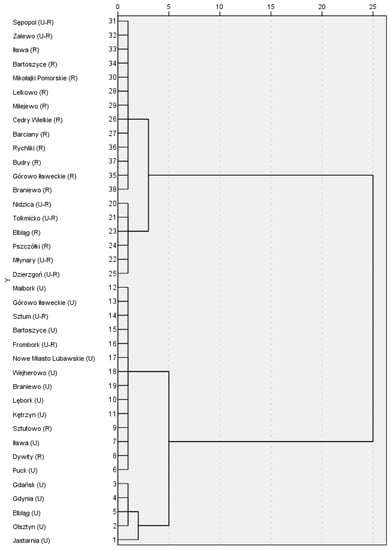
Figure 7.
Dendrogram of similarity of the standard of living (dendrogram based on Ward’s connections: square of Euclidean distance; scaled distances; ranking in 2005) among Polish municipalities of the Euroregion Baltic.
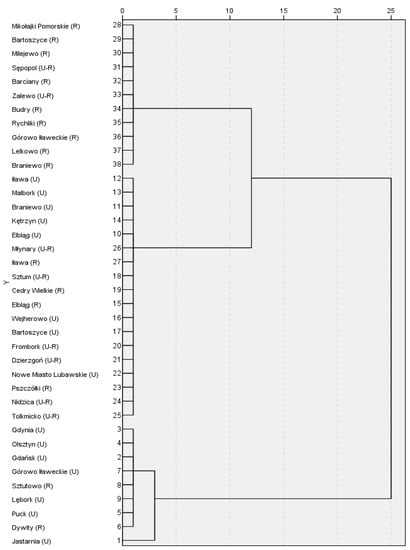
Figure 8.
Dendrogram of similarity of the standard of living (dendrogram based on Ward’s connections: square of Euclidean distance; scaled distances; ranking in 2019) among Polish municipalities of the Euroregion Baltic.
This means that the four-group classification of municipalities according to their synthetic value of the standard of living for 2019 (Table 3) differs from their hierarchical grouping (Figure 8). The main distinguishing factors were the creation of a separate cluster for the highest-ranked municipality and the relatively higher homogeneity of living standard in municipalities classified as second or third class by index value. The lowest variance in the standard of living is thus exhibited by those municipalities where this standard is average (18 in 2019).
The second major finding of this analysis was the demonstrated polarization of living standards, demonstrated by the small size of the first and second clusters and the abundance of municipalities in the last, fourth cluster. It appears that this state of affairs will be difficult to change: rural municipalities, situated away from the main urban centers due to limited endogenous potential are at risk of experiencing a widening regional gap [106] (p. 191), [107] (p. 77). Conversely, the municipalities that ranked the highest due to their advantageous social and economic standing, seem to have the capacity to grow even further and outpace the other communities covered by this study. Moreover, objectively speaking, rural municipalities had to compare unfavorably against large, strong urban centers. This illustrates the multitude of challenges that lie before local governments and social organization such as the Association of Polish Communes Euroregion Baltic. The principal objective of this entity (improving living standards, especially in border areas) has not been fully attained and requires considerable effort. However, it is important to note that this remains so in large part due to the limited endogenous potential of these areas, as indicated in this paper.
5. Conclusions
The present study examined the standard of living in the municipalities of the Association of Polish Communes Euroregion Baltic, an organization that groups Polish local government authorities that operate within this Euroregion. However, the literature offers no comprehensive and uniform definition of “standard of living” due to the holistic approach to the subject. The standard of living is ultimately shaped by many factors, most of them social and economic in nature. The intrinsic potential of the examined municipalities plays a part as well. A multidimensional comparative analysis was used to quantify the standard of living in the Polish municipalities of Euroregion Baltic in 2005 (the first year of Poland’s full-fledged membership in the European Union) and 2019 (15th anniversary of Poland’s accession to the EU and 20 full years since Euroregion Baltic was established).
The hypothesis underlying the present study is centered around the intention to determine changes in the standard of living (as expressed by a synthetic index), as well as its spatial differentiation. The pertinent calculations have shown that the placement of municipalities in the rank lists for 2005 and 2019 remained relatively stable and followed certain trends. Firstly, the standard of living was shown to be significantly higher in strong urban centers of supra-regional importance. Apart from the largest cities of Euroregion Baltic, the highest standard of living was observed in relatively small towns (Jastarnia, Puck) situated directly along the Polish coastline. Their status as centers of tourism provided them with large own incomes and, in the long run, ensured prudent expenditure of these resources [108] (p. 89). The second conclusion of the study was that rural municipalities had a considerably lower standard of living, especially those located within the Polish-Russian border area. The combination of peripheral siting and insufficient growth drivers impaired their ranking [109] (p. 297). Of note is the progressing urban sprawl at multiple levels, including local [110]. The analysis showed that growth was most pronounced in rural municipalities that border medium-size towns (the two tourist towns of Bartoszyce and Iława), which function as growth poles for the local areas [98] (p. 52). Secondly, the findings confirmed that the Polish territories incorporated into Euroregion Baltic are undergoing strong polarization of living conditions, and may even be considered polar extremes that have grown progressively further apart over the years. There was increasing heterogeneity between big cities and peripheral rural municipalities. It seems that reversing this trend will require intense efforts, both on the part of local authorities and civic organizations. Finally, it is worth taking note of the average performers, which formed the largest group in the set. Stimulation of social and economic development will be crucial to combating social exclusion and economic divergence in these areas.
In the closing remarks of this paper, it bears noting that the difficulties in defining standards or levels of living translate into difficulties in operationalizing these concepts. It should be borne in mind that diagnostic variables are selected arbitrarily in taxonomic methods, which means that a different set of variables could produce different results. At the same time, however, the findings seem to fall in line with the public perception of living standards in this particular selection of local administrative units. Such analyses, in turn, serve as a starting point for discussions on the effectiveness the cohesion policy implemented by local, regional, national, and international institutions. It is also useful for preparing all type of rankings, starting from municipalities and ending by regions and countries. This kind of research could be used in all type of investigation. Hence, in future it’s possible to enlarge both the size of the research and the numbers of variables.
Funding
No external funding.
Institutional Review Board Statement
Not applicable.
Informed Consent Statement
Not applicable.
Data Availability Statement
The analyses were made based on the public dataset available at bdl.stat.gov.pl (accessed on 14 October 2021).
Acknowledgments
The author would like to thank the National Bank of Poland (PL: NBP—contract no. WPE-AB-0662-0204-2021) for fruitful cooperation. The present study was used in the implementation of the contract.
Conflicts of Interest
The author declares no conflict of interest.
References
- Haselsberger, B.; Benneworth, P. Do Euroregions Have a Future? Strategy-Making and Policy Delivery in Multi-Area Euroregions. disP 2010, 138, 80–94. [Google Scholar] [CrossRef]
- Council of Europe. European Outline Convention on Transfrontier Co-Operation between Territorial Communities or Authorities; European Treaty Series No. 106; Council of Europe: Strasbourg, France, 1980; Available online: https://www.coe.int/en/web/conventions/full-list/-/conventions/treaty/106 (accessed on 30 November 2021).
- Lewkowicz, Ł. Euroregiony na Pograniczu Polsko-Słowackim. Geneza i Funkcjonowanie; UMCS Lublin: Lublin, Poland, 2013. [Google Scholar]
- Perkmann, M. Euroregions: Institutional entrepreneurship in the European Union. In Globalization, Regionalization, and Cross-Border Regions; Perkmann, M., Sum, N., Eds.; Palgrave MacMillan: London, UK, 2002. [Google Scholar]
- Grzela, J. Wpływ Regionalizacji na Przełamywanie Stereotypów i Łagodzenie Konfliktów na Przykładzie Euroregionu Bałtyk, Konflikt Cywilizacji czy Cywilizacja Konfliktów; University of Jan Kochanowski in Kielce: Kielce, Poland, 2012; pp. 192–219. Available online: https://www.academia.edu/9677927/Wp%C5%82yw_euroregionalizacji_na_prze%C5%82amywanie_stereotyp%C3%B3w_i_%C5%82agodzenie_konflikt%C3%B3w_na_przyk%C5%82adzie_Euroregionu_Ba%C5%82tyk (accessed on 30 November 2021).
- Gorzym-Wilkowski, W. Euroregions in Poland. Morav. Geogr. Rep. 2007, 15, 14–19. [Google Scholar]
- Belof, M. Quo Vadis Euroregion? In The Role of Regions? Networks, Scale, Territory; Herrschel, T., Tallberg, P., Eds.; Kristianstads Boktryckeri: Kristianstad, Sweden, 2011; pp. 265–281. [Google Scholar]
- Howaniec, H.; Lis, M. Euroregions and Local and Regional Development—Local Perceptions of Cross-Border Cooperation and Euroregions Based on the Euroregion Beskydy. Sustainability 2020, 12, 7834. [Google Scholar] [CrossRef]
- Stowarzyszenie Europejskich Obszarów Granicznych. Praktyczny Przewodnik Współpracy Transgranicznej LACE, 2nd ed.; Stowarzyszenie Europejskich Regionów Granicznych (SERG): Brussels-Gronau, Belgium, 1997. [Google Scholar]
- Greta, M. Euroregiony Polskie w Procesie Integracji Europejskiej Oraz Przezwyciężaniu Peryferyjności i Dysproporcji Regionalnych; UŁ Łódź: Łódź, Poland, 2013. [Google Scholar] [CrossRef]
- Wendt, J. Difference between eastern and western Polish Euroregions. In Poland and Romania before Enlargement of European Union and NATO; Wendt, J., Bodocan, V., Eds.; Carta Blanca: Warsaw, Poland, 2004; pp. 105–110. [Google Scholar]
- Eurobalt. Available online: http://eurobalt.org.pl/aktualnosci/5/o-euroregionie (accessed on 30 November 2021).
- Radzikowska-Kryśczak, B.; Sadownik, A. (Eds.) Polska w Strefie Schengen. Refleksje po Pierwszym Roku Członkowstwa; MotIaA: Warsaw, Poland, 2008. [Google Scholar]
- European Commission. Cross-Border Cooperation in the EU; Flash Eurobarometer 422: Brussles, Belgium, 2015. [Google Scholar] [CrossRef]
- Perkmann, M. The Rise of Euroregion. A Bird’s Eye Perspective on European Cross-Border Cooperation; Department of Sociology, Lancaster University: Lancaster, UK, 2003; Available online: https://www.lancaster.ac.uk/fass/resources/sociology-online-papers/papers/perkmann-rise-of-euroregion.pdf (accessed on 30 November 2021).
- Scott, J.W. Euroregions, Governance and Transborder Co-operation within the EU. In Borders, Regions and People; Pion: London, UK, 2000; Volume 10, pp. 104–115. [Google Scholar]
- Yoder, J.A. Bridging the European Union and Eastern Europe: Cross-border Cooperation and the Euroregions. Reg. Fed. Stud. 2003, 13, 90–106. [Google Scholar] [CrossRef]
- Paasi, P. Euroregions as micro-models of European integration. In Euroregions—The Alps—Adriatic Context; Langer, J., Ed.; Peter Lang: Frankfurt am Main, Germany, 2007; pp. 73–79. [Google Scholar]
- Lepik, K.-L. Euroregions as Mechanisms for Strengthening of Cross-Border Cooperation in the Baltic Sea Region. Trames J. Hum. Soc. 2009, 3, 265–284. [Google Scholar] [CrossRef]
- Telle, S. Euregions as soft spaces: Between consolidation and transformation. Eur. Spat. Res. Policy 2017, 24, 93–110. [Google Scholar] [CrossRef]
- Medeiros, E. (Re)defining the Euroregion Concept. Eur. Plan. Stud. 2011, 19, 141–158. [Google Scholar] [CrossRef]
- Jeřábek, M.; Havlíček, T.; Dokoupil, J. Euroregions as a Platform for Cross-Border Cooperation. In Borders in Central Europe after the Schengen Agreement; Havlíček, T., Jeřábek, M., Dokoupil, J., Eds.; Springer: Cham, Switzerland, 2018; pp. 67–91. [Google Scholar] [CrossRef]
- Malendowski, W.; Ratajczak, M. Euroregiony—Pierwszy Krok do Integracji Europejskiej; Alta 2: Wrocław, Poland, 1998; pp. 11–18. [Google Scholar]
- Malendowski, W.; Szczepaniak, M. The Role of the Euroregions in European Integration’s Process in Euroregions. The Bridges to the Non-Borders Europe; Elipsa: Warsaw, Poland, 2000. [Google Scholar]
- Palmowski, T. Współpraca transgraniczna obszarów nadmorskich na przykładzie Euroregionu Bałtyk. In Euroregiony Wschodniego Pogranicza-Założenia i Osiągnięcia; Palmowski, T., Ed.; Wydawnictwo Wyższej Szkoły Ekonomicznej w Białymstoku: Białystok, Poland, 2002; pp. 111–121. [Google Scholar]
- Grix, J.; Knowles, V. The Euroregion as a Social Capital Maximizer: The German-Polish Euroregion Pro-Europa Viadrina. Reg. Fed. Stud. 2002, 12, 154–176. [Google Scholar] [CrossRef]
- Wróblewski, Ł.; Kasperek, A. Euroregion as an Entity Stimulating the Sustainable Development of the Cross-Border Market for Cultural Services in a City Divided by a Border. Sustainability 2019, 11, 2232. [Google Scholar] [CrossRef]
- Noferini, A.; Berzi, M.; Camonita, F.; Durà, A. Cross-Border cooperation in the EU: Euroregions amid multilevel governance and re-territorialization. Eur. Plan. Stud. 2020, 28, 35–56. [Google Scholar] [CrossRef]
- Kurowska-Pysz, J.; Szczepańska-Woszczyna, K.; Štverková, H.; Kašík, J. The Catalyst of Cross-Border Cooperation Development in Euroregions. Pol. J. Manag. Stud. 2018, 18, 180–193. [Google Scholar] [CrossRef]
- Bufon, M. Geography of border landscapes, borderlands and Euroregions in the enlarged EU. Riv. Geogr. Ital. 2006, 113, 47–72. [Google Scholar] [CrossRef]
- Durà, A.; Camonita, F.; Berzi, M.; Noferini, A. Euroregions, Excellence and Innovation across EU borders. A Catalogue of Good Practices; Department of Geography, UAB: Barcelona, Spain, 2018; p. 254. Available online: https://ec.europa.eu/futurium/en/system/files/ged/recot_crii_catalogue_0.pdf (accessed on 30 November 2021).
- Berzi, M.; Durà, A.; Camonita, F.; Noferini, A. Active Euroregions in Europe: An overview. In Critical Dictionary on Borders, Cross-Border Cooperation and European Integration; Wassenberg, B., Reitel, B., Eds.; Peter Lang: Bern, Switzerland, 2020. [Google Scholar] [CrossRef]
- Zieliński, M. Cross-Border Co-Operation between the Kaliningrad Oblast and Poland in the Context of Polish-Russian Relations in 2004–2011. Lith. Foreign Policy Rev. 2012, 28, 11–42. [Google Scholar]
- Narbutienė, N. The Implementation of the aims of euroregions in cross-border cooperation: The Baltic case. Tiltai. Priedas 2003, 13, 330–337. [Google Scholar]
- Palmowski, T. Kaliningrad—Szansa czy Zagrożenia dla Europy Bałtyckiej? Studia Komitetu Przestrzennego Zagospodarowania Kraju PAN; PAS: Warsaw, Poland, 2010; pp. 177–186. [Google Scholar]
- Baltic Sea Region Programme. Available online: https://ec.europa.eu/regional_policy/en/atlas/programmes/2007-2013/crossborder/baltic-sea-region-programme-2007-2013 (accessed on 30 November 2021).
- Eurobalt. Available online: http://eurobalt.org.pl/gminy-czlonkowskie (accessed on 30 November 2021).
- Statut Stowarzyszenia Gmin Rzeczypospolitej Polskiej Euroregionu Baltyk; Euroregion Bałtyk: Elbląg, Poland, 2013; Available online: http://eurobalt.org.pl/media/pliki/4.pdf (accessed on 24 March 2021).
- Kalinowski, S. Poziom Życia Ludności o Niepewnych Dochodach; PWN: Warsaw, Poland, 2015. [Google Scholar]
- Drewnowski, J.; Scott, W. The Level of Living Index; UNRISD: Geneva, Switzerland, 1966. [Google Scholar]
- Drewnowski, J. Studies in the Measurement of Level of Living and Welfare; Report No. 70/3; United Nations Research Institute for Social Development: Geneva, Switzerland, 1970. [Google Scholar]
- Diener, E.; Saligman, E.P. Beyond Money. Toward an Economy of Well-being. Psychol. Sci. 2004, 5, 1–31. [Google Scholar]
- Flauerbaey, M. Beyond GDP: Is There Progress in the Measurement of Indyvidual Well-being and Social Welfare? IDEP: Paris, France, 2008. [Google Scholar]
- Stiglitz, J.E.; Sen, A.; Fitoussi, J.-P. Report by the Commision on the Measurement of Economic Performance and Social Progress. 2009. Available online: www.stiglitz-sen-fitoussi.fr (accessed on 24 March 2021).
- Stiglitz, J.E.; Fitoussi, J.-P.; Durand, M. Measuring What Counts for Economic and Social Performance; OECD Publishing: Paris, France, 2018. [Google Scholar] [CrossRef]
- Frank, R.H. Does Money Buy Happiness? In The Science of Well-Being; Huppert, F.A., Baylis, N., Keverne, B., Eds.; Oxford University Press: Oxford, UK, 2005. [Google Scholar]
- Gasper, D. Human Well-Being: Concepts and Conceptualisations; WIDER Discussion Paper 2004/6; World Institute for Development Economics Research: Helsinki, Finland, 2004. [Google Scholar]
- Drabsch, T. Measuring Wellbeing; Brefing Paper No. 4; NSW Parliamentary Research Service: Sydney, Australia, 2012. [Google Scholar]
- Palmowski, T.; Pacuk, M. Baltic Euro-Region: A stimulator of intercultural co-operation. In Multicultural Regions and Cities; Palmowski, T., Ed.; Instytut Śląski: Katowice, Poland, 1999; pp. 35–40. [Google Scholar]
- Koszyk-Białobrzeska, R.; Kisiel, R. Współpraca Transgraniczna Wschodnich Regionów Polski; Wydawnictwo Uniwersytetu Warmińsko-Mazurskiego: Olsztyn, Poland, 2003. [Google Scholar]
- Koszyk-Białobrzeska, R. Polityka informacyjna Euroregionu Bałtyk w opinii mieszkańców województwa warmińsko-mazurskiego. Stud. Reg. Lokalne 2005, 1, 109–128. [Google Scholar]
- Białobrzeska, R.; Marks-Bielska, R. Współpraca i integracja w regionie Morza Bałtyckiego w świetle badań empirycznych. Stud. Reg. Lokalne 2004, 1, 67–86. [Google Scholar]
- Greta, M.; Lewandowski, K. Euroregion Bałtyk wobec wyzwań aktywujących pogranicze. Zesz. Nauk. Ostrołęckiego Tow. Nauk. 2006, 20, 45–156. [Google Scholar]
- Greta, M.; Lewandowski, K. The significance of euroregions in the process of achieving social and economic cohesion in the European Union. In Structural Funds for the Socio-Economic Development of the Lodz Region in the Perspective of Experiences of Polish Regions; Stanisławski, R., Greta, M., Maciaszczyk, A., Eds.; Politechnika Łódzka: Łódź, Poland, 2008. [Google Scholar]
- Gomółka, K. Współpraca transgraniczna organizacji pozarządowych w Euroregionie Bałtyk . Zesz. Nauk. Inst. Politol. Uniw. Gdań. 2012, 10, 187–203. [Google Scholar]
- Zeliaś, A. Taksonomiczna Analiza Przestrzennego Zróżnicowania Poziomu Życia w Polsce w Ujęciu Dynamicznym; Wyd. Akademii Ekonomicznej w Krakowie: Kraków, Poland, 2000. [Google Scholar]
- Malina, A. Wielowymiarowa Analiza Przestrzennego Zróżnicowania Struktury Gospodarki Polski Według Województw; Monografie. Nr 162; Wyd. Akademii Ekonomicznej: Kraków, Poland, 2004. [Google Scholar]
- Młodak, A. Analiza Taksonomiczna w Statystyce Regionalnej; Difin: Warsaw, Poland, 2006. [Google Scholar]
- Nardo, N.; Saisana, M.; Saltelli, A.; Tarantola, S.; Hoffman, A.; Giovannini, E. Handbook on Constructing Composite Indicators: Methodology and User Guide; OECD, STD/DOC, nr 3; OECD: Paris, France, 2005. [Google Scholar]
- Walesiak, M. Uogólniona Miara Odległości w Statystycznej Analizie Wielowymiarowej; Wyd. Akademii Ekonomicznej: Wrocław, Poland, 2006. [Google Scholar]
- Panek, T. Statystyczne Metody Wielowymiarowej Analizy Porównawczej; Oficyna Wydawnicza SGH: Warsaw, Poland, 2009. [Google Scholar]
- Hellwig, Z. Zastosowanie metody taksonomicznej do typologicznego podziału krajów ze względu na poziom ich rozwoju oraz zasoby i strukturę wykwalifikowanych kadr. Przegląd Stat. 1968, 4, 302–327. [Google Scholar]
- Bielak, J.; Kowerski, M. Dynamics of economic development measure. Fiftieth anniversary of publication of the article by prof. Zdzisław Hellwig. Barom. Reg. Anal. Progn. 2018, 16, 153–165. [Google Scholar]
- Stanisz, A. Przystępny Kurs Statystyki z Zastosowaniem Statistica PL na Przykładzie Medycyny, T.3. Analizy Wielowymiarowe; Statsoft: Warsaw, Poland, 2007. [Google Scholar]
- Rószkiewicz, M. Identyfikacja Czynników Ryzyka—Metody Klasyfikacji Oraz Modele Zależności; Statsoft: Warsaw, Poland, 2010. [Google Scholar]
- Balicki, A. Statystyczna Analiza Wielowymiarowa i jej Zastosowanie Społeczno-Ekonomiczne; Wyd. Uniwersytetu Gdańskiego: Gdańsk, Poland, 2009. [Google Scholar]
- Grabiński, T.; Sokołowski, A. The Effectivness of Some Identification Procedures, Signal Processing: Theories and Applications; North-Holland Publishing Company, UERASIP: Amsterdam, The Netherlands, 1980. [Google Scholar]
- Berbeka, J. Poziom Życia Ludności a Wzrost Gospodarczy w Krajach Unii Europejskiej; Wydawnictwo Akademii Ekonomicznej w Krakowie: Kraków, Poland, 2006. [Google Scholar]
- Bank Danych Lokalnych. Available online: bdl.stat.gov.pl (accessed on 30 November 2021).
- Johann, M. Population Living Standards in Poland and the EU-15. GNPJE 2005, 11–12, 49–64. [Google Scholar] [CrossRef]
- Sompolska-Rzechuła, A. Przestrzenne zróżnicowanie poziomu życia w Polsce na podstawie wyników wielowymiarowej analizy porównawczej. In Statystyka w Praktyce Społeczno-Gospodarczej; Ostasiewicz, W., Ed.; Wydawnictwo Akademii Ekonomicznej: Wrocław, Poland, 2007. [Google Scholar]
- Cheba, K. Analysis of development trends of standard of living for medium-sized cities in Poland. Res. Pap. Wrocław Univ. Econ. Bus. 2011, 32, 137–146. [Google Scholar]
- Malinowski, M. Entrepreneurship vs. standard of living of the population in western Poland: A spatial analysis. Res. Pap. Wrocław Univ. Econ. Bus. 2020, 64, 127–145. [Google Scholar] [CrossRef]
- Miłek, D. Spatial differentiation in the social and economic development level in Poland. Equilib. Q. J. Econ. Econ. Policy 2018, 13, 487–507. [Google Scholar] [CrossRef]
- Brambert, P.; Kiniorska, I. Changes in the Standard of Living in Rural Population of Poland in the Period of the Eu Membership. Eur. Ctry. 2018, 10, 263–279. [Google Scholar] [CrossRef]
- Łuczak, A.; Kalinowski, S. Assessing the level of the material deprivation of European Union countries. PLoS ONE 2020, 15, e0238376. [Google Scholar] [CrossRef]
- Kharazishvili, Y.; Grishnova, O.; Kamioska, B. Standards of living in Ukraine, Georgia, and Poland: Identification and strategic planning. Virtual Econ. 2019, 2, 7–36. [Google Scholar] [CrossRef][Green Version]
- Jagódka, M.; Snarska, M. The State of Human Capital and Innovativeness of Polish Voivodships in 2004–2018. Sustainability 2021, 13, 12620. [Google Scholar] [CrossRef]
- Klein, M.; Gutowski, P.; Gerlitz, L.; Gutowska, E. Creative and Culture Industry in Baltic Sea Region Condition and Future. Sustainability 2021, 13, 4239. [Google Scholar] [CrossRef]
- Bielecki, J.K. Problems of the Polish Transformation. Communist Econ. Econ. Transform. 1992, 4, 321–332. [Google Scholar] [CrossRef]
- Brzezinski, Z. The Great Transformation. Natl. Interest 1993, 33, 3–13. Available online: http://www.jstor.org/stable/42894889 (accessed on 30 November 2021).
- Domański, H. The Polish Transformation: Structural Changes and New Tensions. Eur. J. Soc. Theory 2005, 8, 453–470. [Google Scholar] [CrossRef]
- Bąk, I.; Wawrzyniak, K.; Oesterreich, M. The Impact of Transformational Changes on the Socio-Economic Conditions of the Rural Population. An Example of Poland. Agriculture 2021, 11, 403. [Google Scholar] [CrossRef]
- Tinker, A. The Social implications of an ageing population. Mech. Ageing Dev. 2002, 123, 729–735. [Google Scholar] [CrossRef]
- Titkow, A.; Duch-Krzysztoszek, D. Intencje i decyzje prokreacyjne w społeczeństwie polskim a polityka przyjazna prokreacji. Studia Demogr. 2009, 1, 71–97, (Procreative intentions and decisions and procreation-friendly policies in Poland). [Google Scholar]
- Van de Kaa, D.J. Europe’s Second Demographic Transition. Popul. Bull. 1987, 42, 1–59. [Google Scholar]
- Wichowska, A.; Wierzejski, T. Revenue Autonomy and Enterpreneurhsip in the Municipalities of the Warmina-Masurian Voivodeship. Olszt. Econ. J. 2019, 14, 75–86. [Google Scholar] [CrossRef]
- Wichowska, A. Determinants of Debtin Rural Municipalities on the Example of the Warmińsko-Mazurskie Voivodeship. Acta Sci. Pol. Oeconom. 2019, 18, 121–130. [Google Scholar] [CrossRef]
- Paczoski, A.; Abebe, S.T.; Cirella, G.T. Debt and Deficit Growth Rate Reporting for Post-Communist European Union Member States. Soc. Sci. 2019, 8, 173. [Google Scholar] [CrossRef]
- Malina, A. Analiza przestrzennego zróżnicowania poziomu rozwoju społeczno-gospodarczego w województwach Polski w latach 2005–2017. Nierówności Społeczne Wzrost Gospod. 2020, 61, 138–155, (Analysis of spatial diversity int he socio-economic development of Polish voivodeships in 2005–2017). [Google Scholar] [CrossRef]
- Łyszkiewicz, M. Samodzielność finansowa gmin miejskich województwa pomorskiego. Pr. Nauk. Uniw. Ekon. Wroc. 2016, 432, 93–101, (Financial autonomy of the Pomeranian urban communes, Research Papers of Wrocław University of Economics). [Google Scholar] [CrossRef][Green Version]
- Derek, M. Funkcja Turystyczna Jako Czynnik Rozwoju Lokalnego w Polsce. Ph.D. Thesis, WGiSR UW, Warsaw, Poland, 2008. Available online: https://wgsr.uw.edu.pl/wgsr/wp-content/uploads/2018/11/1_pdfsam_doktorat-w-pdf.pdf (accessed on 30 November 2021).
- Źróbek-Różańska, A.; Zysk, E. Czy rozlewające się miasto odmładza podmiejską wieś? Studium podolsztyńskich gmin wiejskich. Wieś Rol. 2015, 4, 123–137. [Google Scholar]
- Źróbek-Różańska, A.; Zadworny, D. Can urban sprawl lead to urban people governing rural areas? Evidence from the Dywity Commune, Poland. Cities 2016, 59, 57–65. [Google Scholar] [CrossRef]
- Janusz, M. The standard of living and its spatial differentiation among rural municipalities in Warmia-Masuria province. Acta Sci. Pol. Adm. Locorum 2020, 19. [Google Scholar] [CrossRef]
- Rosner, A.; Wesołowska, M. Deagrarianisation of the Economic Structure and the Evolution of Rural Settlement Patterns in Poland. Land 2020, 9, 523. [Google Scholar] [CrossRef]
- Nazarczuk, J.M. Potencjał Rozwojowy a Aktywność Inwestycyjna Województw i Podregionów Polski; Wyd. Uniwersytetu Warmńsko-Mazurskiego w Olsztynie: Olsztyn, Poland, 2013. [Google Scholar]
- Senetra, A.; Szarek-Iwaniuk, P. The implementation of the Wroclaw taxonomic method for the identification and evaluation of problem areas in the Warmia and Mazury Region in Poland—A case study. Soc. Econ. Plan. Sci. 2019, 67, 43–57. [Google Scholar] [CrossRef]
- Komorowski, Ł.; Mróz, A.; Stanny, M. The Spatial Pattern of the Absorption of Cohesion Policy Funds in Polish Rural Areas. Land 2021, 10, 26. [Google Scholar] [CrossRef]
- Adamowicz, M. The Potential for Innovative and Smart Rural Development in the Peripheral Regions of Eastern Poland. Agriculture 2021, 11, 188. [Google Scholar] [CrossRef]
- Zabielska, I. Cooperation, partnership and integration in the cross-border area: The role of borders and cross-border cooperation. Ekon. Prawo Econ. Law 2020, 19, 569–583. [Google Scholar] [CrossRef]
- Kawałko, B. Granica Wschodnia Jako Czynnik Ożywienia i Rozwoju Społeczno-Ekonomicznego Regionów Przygranicznych. Synteza. Ekspertyza Przygotowana na Potrzeby Strategii Rozwoju Społeczno-Gospodarczego Polski Wschodniej do Roku 2020. Ministerstwo Rozwoju Regionalnego: Warsaw, Poland, 2006. Available online: http://www.mrr.gov.pl/polityka_regionalna/SRPW_2020/Dokumenty%20i%20ekspertyzy/Strony/dokumenty.aspx (accessed on 1 April 2021).
- Zabielska, I.; Zielińska-Szczepkowska, J. Cross-Border Relations in Rural Areas (Based on Local Border Traffic). In Proceedings of the 8th International Scientific Conference Rural Development, Jelgava, Riga, 27–28 April 2017. [Google Scholar] [CrossRef]
- Feltynowski, M.; Senetra, A.; Biegańska, J.; Grzelak-Kostulska, E.; Dymitrow, M.; Środa-Murawska, S. Some problems of local development. The example of former state agriculutral farms in Poland. Res. Rural Dev. 2015, 2, 237–243. [Google Scholar]
- Biegańska, J.; Dymitrow, M.; Grzelak-Kostulska, E.; Środa-Murawska, S. From policy to misery? The state agricultural farms vs. “the rural”. Quaest. Geogr. 2019, 38, 77–90. [Google Scholar] [CrossRef]
- Stanny, M.; Rosner, A.; Komorowski, Ł. Monitoring Rozwoju Obszarów Wiejskich. Etap III. Struktury Społeczno-Gospodarcze, ich Przestrzenne Zróżnicowanie i Dynamika. Fundusz Rozwoju Wsi Polskiej; Instytut Rozwoju Wsi i Rolnictwa PAN: Warsaw, Poland, 2018. [Google Scholar]
- Kalinowski, S. Poverty in Rural Areas: An Outline of the Problem. Acta Sci. Pol. Oecon. 2020, 19, 69–78. [Google Scholar] [CrossRef]
- Heller, J.; Farelnik, E. Finanse i samodzielność ekonomiczna a ustrój samorządów terytorialnych w Polsce. Stud. Reg. Lokalne 2013, 2, 81–94, (Finances and economic independence versus the political system of local government in Poland). [Google Scholar] [CrossRef]
- Janusz, M. The standard of living and it’s spatial differentiation in border districts of Eastern Poland. Econ. Environ. Stud. 2015, 15, 283–302. [Google Scholar]
- Renata, R.-C.; Barbara, C.; Andrzej, S. Which Polish Cities Sprawl the Most. Land 2021, 10, 1291. [Google Scholar] [CrossRef]
Publisher’s Note: MDPI stays neutral with regard to jurisdictional claims in published maps and institutional affiliations. |
© 2022 by the author. Licensee MDPI, Basel, Switzerland. This article is an open access article distributed under the terms and conditions of the Creative Commons Attribution (CC BY) license (https://creativecommons.org/licenses/by/4.0/).