
Pedestrian Safety in Compact and Mixed-Use Urban Environments: Evaluation of 5D Measures on Pedestrian Crashes


Abstract
:1. Introduction
2. Literature Review
3. Methodology
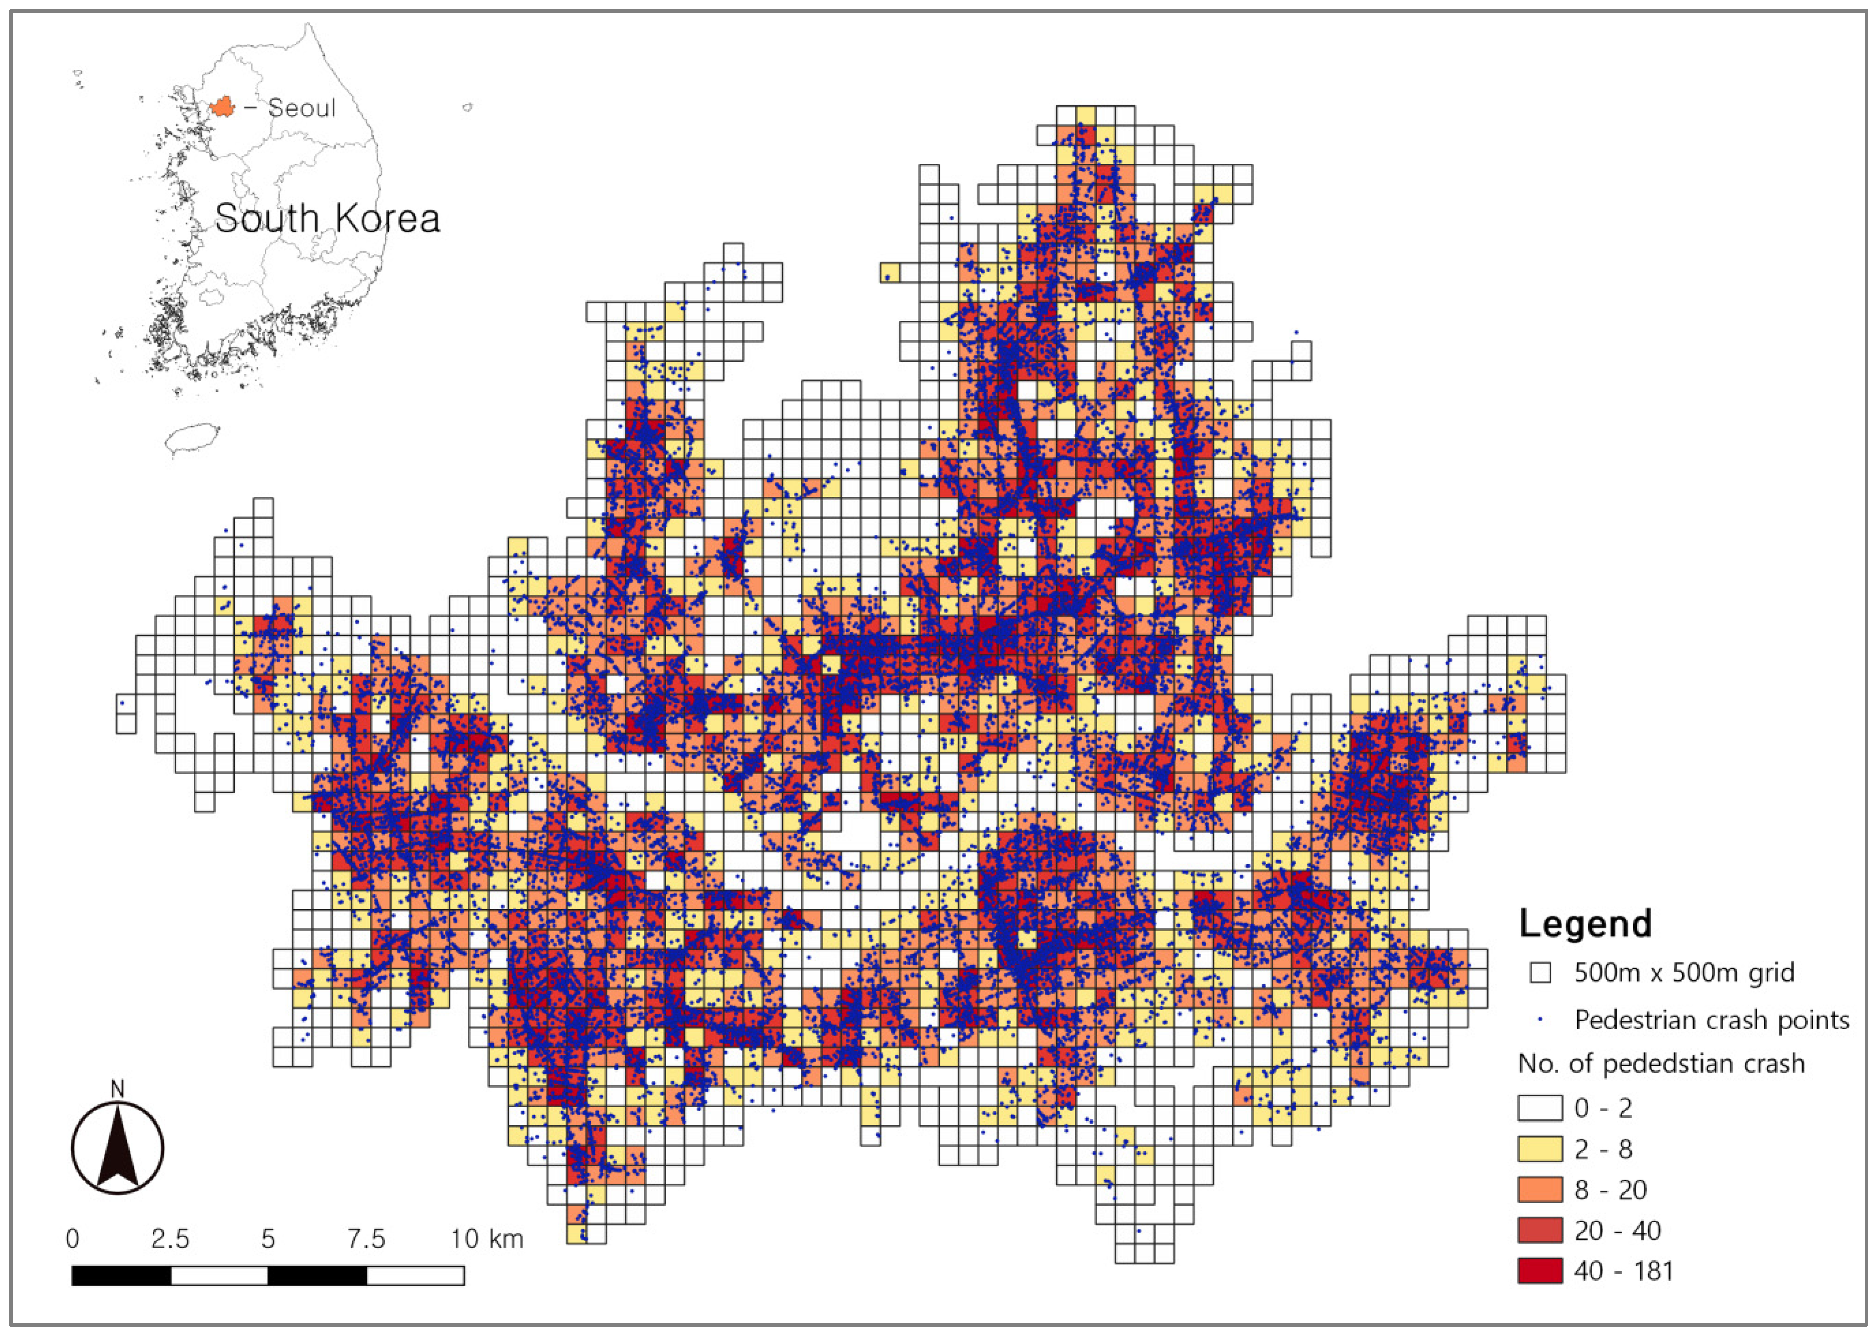
3.1. Study Area
3.2. Unit of Spatial Analysis
3.3. Variables and Models
4. Analysis Results
4.1. Density
4.2. Diversity
4.3. Design
4.4. Distance to Transit
4.5. Destination Accessibility
4.6. Topography and Exposure Variables
5. Discussion and Conclusions
5.1. Discussion
5.2. Conclusions
Author Contributions
Funding
Institutional Review Board Statement
Informed Consent Statement
Data Availability Statement
Conflicts of Interest
References
- Arku, G. Rapidly Growing African Cities Need to Adopt Smart Growth Policies to Solve Urban Development Concerns. Urban Forum 2009, 20, 253–270. [Google Scholar] [CrossRef]
- Bharti, M.; Mehrotra, S. Metropolitan Ahmedabad: Scaling up with Contiguous Replication of Town Planning Schemes; The World Bank: Washington, DC, USA, 2020. [Google Scholar]
- Bibri, S.E.; Krogstie, J.; Kärrholm, M. Compact city planning and development: Emerging practices and strategies for achieving the goals of sustainability. Dev. Built Environ. 2020, 4, 100021. [Google Scholar] [CrossRef]
- Lau, S.S.; Wang, J.; Giridharan, R. Smart and Sustainable City—A Case Study from Hong Kong. In Smart and Sustainable Built Environments; Blackwell Publishing Ltd.: Hoboken, NJ, USA, 2005; pp. 33–42. [Google Scholar]
- Cervero, R.; Murakami, J. Rail and property development in Hong Kong: Experiences and extensions. Urban Stud. 2009, 46, 2019–2043. [Google Scholar] [CrossRef]
- Kang, C.D. The S+ 5Ds: Spatial access to pedestrian environments and walking in Seoul, Korea. Cities 2018, 77, 130–141. [Google Scholar] [CrossRef]
- Ewing, R.; Dumbaugh, E. The built environment and traffic safety: A review of empirical evidence. J. Plan. Lit. 2009, 23, 347–367. [Google Scholar] [CrossRef]
- Wedagama, D.M.P.; Bird, R.N.; Metcalfe, A.V. The influence of urban land-use on non-motorised transport casualties. Accid. Anal. Prev. 2006, 38, 1049–1057. [Google Scholar] [CrossRef] [PubMed]
- Wier, M.; Weintraub, J.; Humphreys, E.H.; Seto, E.; Bhatia, R. An area-level model of vehicle-pedestrian injury collisions with implications for land use and transportation planning. Accident Anal. Prev. 2009, 41, 137–145. [Google Scholar] [CrossRef] [PubMed]
- Yeo, J.; Park, S.; Jang, K. Effects of urban sprawl and vehicle miles traveled on traffic fatalities. Traffic Inj. Prev. 2015, 16, 397–403. [Google Scholar] [CrossRef]
- Lee, J.S.; Christopher, Z.P.; Eran, B.J. Safely active mobility for urban baby boomers: The role of neighborhood design. Accid. Anal. Prev. 2013, 61, 153–166. [Google Scholar] [CrossRef]
- Merlin, L.A.; Guerra, E.; Dumbaugh, E. Crash risk, crash exposure, and the built environment: A conceptual review. Accid. Anal. Prev. 2020, 134, 105244. [Google Scholar] [CrossRef]
- Lee, J.; Abdel-Aty, M.; De Blasiis, M.R.; Wang, X.; Mattei, I. International transferability of macro-level safety performance functions: A case study of the United States and Italy. Transp. Saf. Environ. 2019, 1, 68–78. [Google Scholar] [CrossRef] [Green Version]
- Sebert Kuhlmann, A.K.; Brett, J.; Thomas, D.; Sain, S.R. Environmental characteristics associated with pedestrian–motor vehicle collisions in Denver, Colorado. Am. J. Public Health 2009, 99, 1632–1637. [Google Scholar] [CrossRef]
- Traynor, T.L. Regional economic conditions and crash fatality rates—A cross-county analysis. J. Saf. Res. 2008, 39, 33–39. [Google Scholar] [CrossRef] [PubMed]
- Schepers, P.; Lovegrove, G.; Helbich, M. Urban form and road safety: Public and active transport enable high levels of road safety. In Integrating Human Health into Urban and Transport Planning; Nieuwenhuijseon, M.J., Khreis, H., Eds.; Springer: Cham, Switzerland, 2019; pp. 383–408. [Google Scholar]
- Laddu, D.; Paluch, A.E.; LaMonte, M.J. The role of the built environment in promoting movement and physical activity across the lifespan: Implications for public health. Prog. Cardiovasc. Dis. 2021, 64, 33–40. [Google Scholar] [CrossRef] [PubMed]
- Calthrope, P. The Next American Metropolis: Ecology, Community, and the American Dream; Princeton Architectural Press: New York, NY, USA, 1993. [Google Scholar]
- Cervero, R.; Kockelman, K. Travel demand and the 3Ds density, diversity and design. Transp. Res. Part D Transp. Environ. 1997, 2, 199–219. [Google Scholar] [CrossRef]
- Handy, S. Regional versus local accessibility: Implications for non-work travel. Transp. Res. Rec. 1993, 1400, 58–66. [Google Scholar]
- Ewing, R.; Cervero, R. Travel and the built environment: A synthesis. Transp. Res. Rec. 2001, 1780, 87–114. [Google Scholar] [CrossRef] [Green Version]
- Frank, D.L.; Schmid, T.; Sallis, A.; Chapman, J.; Saelens, B. Linking objectively measured physical activity with objectively measured urban form: Findings from SMARTRAQ. Am. J. Prev. Med. 2005, 28, 117–125. [Google Scholar] [CrossRef]
- Cerin, E.; Leslie, E.; du Toitc, L.; Owen, N.; Frank, L.D. Destinations that matter: Associations with walking for transport. Health Place 2007, 13, 713–724. [Google Scholar] [CrossRef]
- Cervero, R.; Arrington, G.B. Vehicle trip reduction impacts of transit-oriented housing. J. Public Transp. 2008, 11, 1–18. [Google Scholar] [CrossRef] [Green Version]
- Ewing, R.; Bartholomew, K.; Winkelman, S.; Walters, J.; Chen, D. Growing Cooler: The Evidence on Urban Development and Climate Change; Urban Land Institute: Washington, DC, USA, 2008. [Google Scholar]
- Brown, B.; Yamada, I.; Smith, K.; Zick, C.; Kowaleski-Jones, L.; Fan, J. Mixed land use and walkability: Variations in land use measures and relationship with BMI, overweight, and obesity. Health Place 2009, 15, 1130–1141. [Google Scholar] [CrossRef] [PubMed] [Green Version]
- Sung, H.; Oh, J. Transit-oriented development in a high-density city: Identifying its association with transit ridership in Seoul, Korea. Cities 2011, 28, 70–82. [Google Scholar] [CrossRef]
- Park, J.; Sung, H.; Hwang, B.; Fabian, H.; Vichiensan, V. A Comparative Study on the Comprehensive Benefits of Transit-Oriented Development (TOD) in Asian Mega Cities; Korea Transport Research Institute, Policy Report, 2011. No. 2011-12; Korea Transport Research Institute, 2011; Available online: https://www.kiep.go.kr/gallery.es?mid=a20304000000&bid=0001&tag=&b_list=10&act=view&list_no=1652&nPage=91&vlist_no_npage=0&keyField=&keyWord=&orderby= (accessed on 7 November 2021).
- Grise, E.; Buliung, R.; Rothman, L.; Howard, A. A geography of child and elderly pedestrian injury in the City of Toronto, Canada. J. Transp. Geogr. 2018, 66, 321–329. [Google Scholar] [CrossRef]
- Brubacher, J.; Chan, H.; Erdelyi, S.; Zed, P.; Staples, J.; Etminan, M. Medications and risk of motor vehicle collision responsibility in British Columbia, Canada: A population-based case-control study. Lancet Public Health 2021, 6, e374–e385. [Google Scholar] [CrossRef]
- Ibraevaa, A.; Correia, G.; Silva, C.; Antunes, A. Transit-oriented development: A review of research achievements and challenges. Transp. Res. Part A 2020, 132, 110–130. [Google Scholar] [CrossRef]
- Kumar, P.; Parida, M.; Sekhar, R. Developing context sensitive planning criteria for transit oriented development (TOD): A fuzzy-group decision approach. Transp. Res. Procedia 2020, 48, 2421–2434. [Google Scholar] [CrossRef]
- Stoker, P.; Garfinkel-Castro, A.; Khayesi, M.; Odero, W.; Mwangi, M.N.; Peden, M.; Ewing, R. Pedestrian safety and the built environment: A review of the risk factors. J. Plan. Lit. 2015, 30, 377–392. [Google Scholar] [CrossRef]
- Rothman, L.; Buliung, R.; To, T.; Macarthur, C.; Macpherson, A.; Howard, A. Associations between parents’ perception of traffic danger, the built environment and walking to school. J. Transp. Health 2015, 2, 327–335. [Google Scholar] [CrossRef]
- Dong, N.; Meng, F.; Zhang, J.; Wong, S.C.; Xu, P. Towards activity-based exposure measures in spatial analysis of pedestrian–motor vehicle crashes. Accid. Anal. Prev. 2020, 148, 105777. [Google Scholar] [CrossRef]
- Levine, N.; Kim, K.E.; Nitz, L.H. Spatial analysis of Honolulu motor vehicle crashes: II. Zonal generators. Accid. Anal. Prev. 1995, 27, 675–685. [Google Scholar] [CrossRef]
- Fuller, D.; Morency, P. A population approach to transportation planning: Reducing exposure to motor-vehicles. J. Environ. Public Health 2013, 2013, 916460. [Google Scholar] [CrossRef]
- Congiu, T.; Sotgiu, G.; Castiglia, P.; Azara, A.; Piana, A.; Saderi, L.; Dettori, M. Built environment features and pedestrian accidents: An Italian retrospective study. Sustainability 2019, 11, 1064. [Google Scholar] [CrossRef] [Green Version]
- Guerra, E.; Dong, X.; Kondo, M. Do denser neighborhoods have safer streets? Population density and traffic safety in the Philadelphia region. J. Plan. Educ. Res. 2019, 0739456X19845043. [Google Scholar] [CrossRef]
- Mansfield, T.J.; Peck, D.; Morgan, D.; McCann, B.; Teicher, P. The effects of roadway and built environment characteristics on pedestrian fatality risk: A national assessment at the neighborhood scale. Accid. Anal. Prev. 2018, 121, 166–176. [Google Scholar] [CrossRef]
- Yu, C.Y.; Zhu, X.; Lee, C. Income and racial disparity and the role of the built environment in pedestrian injuries. J. Plan. Educ. Res. 2018, 0739456X18807759. [Google Scholar] [CrossRef]
- Hanson, C.S.; Noland, R.B.; Brown, C. The severity of pedestrian crashes: An analysis using Google Street View imagery. J. Transp. Geogr. 2013, 33, 42–53. [Google Scholar] [CrossRef]
- Ewing, R.; Hamidi, S.; Grace, J.B. Urban sprawl as a risk factor in motor vehicle crashes. Urban Stud. 2016, 53, 247–266. [Google Scholar] [CrossRef] [Green Version]
- Loukaitou-Sideris, A.; Liggett, R.; Sung, H.G. Death on the crosswalk: A study of pedestrian-automobile collisions in Los Angeles. J. Plan. Educ. Res. 2007, 26, 338–351. [Google Scholar] [CrossRef]
- Chen, P.; Sun, F.; Wang, Z.; Gao, X.; Jiao, J.; Tao, Z. Built environment effects on bike crash frequency and risk in Beijing. J. Saf. Res. 2018, 64, 135–143. [Google Scholar] [CrossRef]
- Osama, A.; Sayed, T. Macro-spatial approach for evaluating the impact of socio-economics, land use, built environment, and road facility on pedestrian safety. Can. J. Civ. Eng. 2017, 44, 1036–1044. [Google Scholar] [CrossRef] [Green Version]
- Truong, L.T.; Currie, G. Macroscopic road safety impacts of public transport: A case study of Melbourne, Australia. Accid. Anal. Prev. 2019, 132, 105270. [Google Scholar] [CrossRef]
- Huang, Y.; Wang, X.; Patton, D. Examining spatial relationships between crashes and the built environment: A geographically weighted regression approach. J. Transp. Geogr. 2018, 69, 221–233. [Google Scholar] [CrossRef]
- Hwang, J.; Joh, K.; Woo, A. Social inequalities in child pedestrian traffic injuries: Differences in neighborhood built environments near schools in Austin, TX, US. J. Transp. Health 2017, 6, 40–49. [Google Scholar] [CrossRef]
- Barajas, J.M. Not all crashes are created equal: Associations between the built environment and disparities in bicycle collisions. J. Transp. Land Use 2018, 11, 865–882. [Google Scholar] [CrossRef]
- Lee, G.; Park, Y.; Kim, J.; Cho, G.-H. Association between intersection characteristics and perceived crash risk among school-aged children. Accid. Anal. Prev. 2016, 97, 111–121. [Google Scholar] [CrossRef] [PubMed]
- Quddus, M.A. Modelling area-wide count outcomes with spatial correlation and heterogeneity: An analysis of London crash data. Accid. Anal. Prev. 2008, 40, 1486–1497. [Google Scholar] [CrossRef] [Green Version]
- Miranda-Moreno, L.F.; Morency, P.; El-Geneidy, A.M. The link between built environment, pedestrian activity and pedestrian–vehicle collision occurrence at signalized intersections. Accid. Anal. Prev. 2011, 43, 1624–1634. [Google Scholar] [CrossRef]
- Yu, C.Y.; Zhu, X. Planning for safe schools: Impacts of school siting and surrounding environments on traffic safety. J. Plan. Educ. Res. 2016, 36, 476–486. [Google Scholar] [CrossRef]
- Jiao, J.; Moudon, A.V.; Li, Y. Locations with frequent pedestrian-vehicle collisions: Their transportation and neighborhood environment characteristics in Seattle and King County, Washington. In Planning Support Systems for Sustainable Urban Development; Springer: Berlin/Heidelberg, Germany, 2013; Volume 195, pp. 281–296. [Google Scholar]
- Noland, R.B.; Weiner, M.D.; DiPertrillo, S.; Kay, A.I. Attitudes towards transit-oriented development: Resident experiences and professional perspectives. J. Transp. Geogr. 2017, 60, 130–140. [Google Scholar] [CrossRef]
- Ziakopoulos, A.; Yannis, G. A review of spatial approaches in road safety. Accid. Anal. Prev. 2020, 135, 105323. [Google Scholar] [CrossRef]
- Tasic, I.; Elvik, R.; Brewer, S. Exploring the safety in numbers effect for vulnerable road users on a macroscopic scale. Accid. Anal. Prev. 2017, 109, 36–46. [Google Scholar] [CrossRef]
- Jun, M.J.; Kim, J.I.; Kwon, J.H.; Jeong, J.E. The effects of high-density suburban development on commuter mode choices in Seoul, Korea. Cities 2013, 31, 230–238. [Google Scholar] [CrossRef]
- Sung, H.; Mo, C. Evaluation on the Association of Urban Design with Traffic Safety and Regulatory Improvement; Policy Report; Korea Transport Institute: Sejong City, Korea, 2014; p. 7. [Google Scholar]
- Road Traffic Authority (RTA). Comparison of Traffic Accidents in OECD Member Countries, 2018th ed.; Road Traffic Authority: Wonju, Korea, 2021; Available online: http://taas.koroad.or.kr (accessed on 1 March 2021).
- Ewing, R.; Cervero, R. Travel and the built environment: A meta-analysis. J. Am. Plan. Assoc. 2010, 73, 265–294. [Google Scholar] [CrossRef]
- Clark, D.E.; Cushing, B.M. Rural and urban traffic fatalities, vehicle miles, and population density. Accid. Anal. Prev. 2004, 36, 967–972. [Google Scholar] [CrossRef] [PubMed]
- Ewing, R.; Schmid, T.; Killingsworth, R.; Zlot, A.; Raudenbush, S. Relationship between urban sprawl and physical activity, obesity, and morbidity. Am. J. Health Promot. 2003, 18, 47–57. [Google Scholar] [CrossRef] [PubMed]
- Lascala, E.A.; Gerber, D.; Gruenewald, P.J. Demographic and environmental correlates of pedestrian injury collisions: A spatial analysis. Accid. Anal. Prev. 2000, 32, 651–658. [Google Scholar] [CrossRef]
- Park, S.-H. The effect of the neighborhood built environment on pedestrian-vehicle collisions: Focused on the case of the city of Seattle, Washington, U.S. J. Korean Plan. Assoc. 2014, 49, 143–157. [Google Scholar] [CrossRef]
- Naderan, A.; Shahi, J. Aggregate crash prediction models: Introducing crash generation concept. Accid. Anal. Prev. 2010, 42, 339–346. [Google Scholar] [CrossRef] [PubMed]
- Graham, D.; Glaister, S. Spatial variation in road pedestrian casualties: The role of urban scale, density and land-use mix. Urban Stud. 2003, 40, 1591–1607. [Google Scholar] [CrossRef]
- Kim, K.; Brunner, I.M.; Yamashita, E.Y. Influence of land use, population, employment, and economic activity on accidents. Transp. Res. Rec. 2006, 1953, 56–64. [Google Scholar] [CrossRef]
- Ossenbruggen, P.J.; Linder, E.; Nguyen, B. Detecting unsafe roadways with spatial statistics: Point patterns and geostatistical models. J. Transp. Eng. 2009, 136, 457–464. [Google Scholar] [CrossRef]
- Cai, Q.; Abdel-Aty, M.; Sun, Y.; Lee, J.; Yuan, J. Applying a deep learning approach for transportation safety planning by using high-resolution transportation and land use data. Transp. Res. Part A Policy Pract. 2019, 127, 71–85. [Google Scholar] [CrossRef]
- Pulugurtha, S.S.; Sambhara, V.R. Pedestrian crash estimation models for signalized intersections. Accid. Anal. Prev. 2011, 43, 439–446. [Google Scholar] [CrossRef]
- Yoon, J.; Lee, S. Spatio-temporal patterns in pedestrian crashes and their determining factors: Application of a space-time cube analysis model. Accid. Anal. Prev. 2021, 161, 106291. [Google Scholar] [CrossRef]
- GLM’s for Spatial Data. Available online: https://rpubs.com/corey_sparks/111362 (accessed on 1 June 2019).
- Miranda-Moreno, L.F.; Fu, L. Traffic safety study: Empirical Bayes or hierarchical Bayes. In Transportation Statistics; Sloboda, B.W., Ed.; J. Ross Publishing, Inc.: Fort Lauderdale, FL, USA, 2009. [Google Scholar]
- Wang, Y.; Kockelman, K.M. A Poisson-lognormal conditional-autoregressive model for multivariate spatial analysis of pedestrian crash counts across neighborhoods. Accid. Anal. Prev. 2013, 60, 71–84. [Google Scholar] [CrossRef] [PubMed]
- Dai, D. Identifying clusters and risk factors of injuries in pedestrian-vehicle crashes in a GIS environment. J. Transp. Geogr. 2012, 24, 206–214. [Google Scholar] [CrossRef]
- Dai, D. Influence of built environment on pedestrian crashes: A network-based GIS analysis. Appl. Geogr. 2016, 73, 53–61. [Google Scholar] [CrossRef]
- Toran Pour, A.; Moridpour, S.; Tay, R.; Rajabifard, A. Influence of pedestrian age and gender on spatial and temporal distribution of pedestrian crashes. Traffic Inj. Prev. 2018, 19, 81–87. [Google Scholar] [CrossRef] [PubMed]
- Kang, S.; Jo, S.; Yoon, S. The Study of Designation and Operation Feasibility in Protected Areas for Transportation and Traffic Facilities of the Person with Disability; Road Traffic Authority: Wonju, Korea, 2013. [Google Scholar]
- Ukkusuri, S.; Miranda-Moreno, L.F.; Ramadurai, G.; Isa-Tavarez, J. The role of built environment on pedestrian crash frequency. Saf. Sci. 2012, 50, 1141–1151. [Google Scholar] [CrossRef]
- Lee, S.; Yoon, J.; Woo, A. Does elderly safety matter? Associations between built environments and pedestrian crashes in Seoul, Korea. Accid. Anal. Prev. 2020, 144, 105621. [Google Scholar] [CrossRef]


| Variables | Description | Mean | S. D. | Source | |
|---|---|---|---|---|---|
| Dependent variables | All | Number of total pedestrian crashes | 14.12 | 18.37 | Traffic Accident Analysis System |
| Death | Number of pedestrian crashes causing death | 0.26 | 0.57 | ||
| Major injury | Number of pedestrian crashes causing major injury | 5.89 | 7.23 | ||
| Minor injury | Number of pedestrian crashes causing minor injury | 8.22 | 11.90 | ||
| Density | SF_den | Total floor area of single-family housing (per 1000 m2) | 27.64 | 37.50 | NSDI * |
| MF_den | Total floor area of multi-family housing (per 1000 m2) | 101.63 | 118.70 | ||
| Comm_den | Total floor area of commercial use (per 1000 m2) | 29.07 | 38.94 | ||
| Office_den | Total floor area of office use (per 1000 m2) | 25.57 | 84.73 | ||
| Diversity | LUM | Entropy index of land-use mix: single-family housing, multi-family housing, commercial use, and office use | 0.45 | 0.33 | |
| RNR | Residential-non-residential mix index for all of the buildings, RNR=1 − |(res − non_res)/(res + non_res)| | 0.49 | 0.30 | ||
| Std_build_den | Standard deviation for all of the buildings (per 1000 m2) | 2.85 | 4.82 | ||
| Design | Intersect_3leg | Number of nodes of three-way intersections | 4.92 | 5.33 | Korea Trans. DB (KTDB) |
| Intersect_4leg | Number of nodes of four-way intersections | 1.23 | 1.75 | ||
| No_U_turns | Number of nodes of U-turns | 0.98 | 1.58 | ||
| Distance to transit | Dist_bus_stop | Average distance (m) from pedestrian crash points to closest bus stops | 199.55 | 282.95 | TOPIS ** |
| Dist_sub_stat | Average distance (m) from pedestrian crash points to closest subway stations | 778.29 | 594.68 | Seoul Metro | |
| No_bus_stop | Number of bus stops within a grid cell | 4.88 | 4.59 | TOPIS ** | |
| No_sub_stat | Number of subway stations within a grid cell | 0.17 | 0.48 | Seoul Metro | |
| Destination accessibility | No_school | Number of elementary, middle, and high schools | 0.57 | 0.93 | NSDI * |
| No_college | Number of colleges | 0.03 | 0.18 | ||
| No_retail | Number of retail stores | 1.63 | 3.00 | ||
| Hosp_area | Total floor area of hospitals | 3.56 | 14.30 | Seumteo (E-AIS) † | |
| Relig_area | Total floor area of religious facilities | 2.01 | 4.22 | ||
| No_trad_ market | Number of traditional markets | 0.15 | 0.60 | Seoul open data plaza | |
| Topography | Slope | Average slope based on land slope information (flat: below 7°, gentle: 7~15°, steep: above 15°) | 1.58 | 0.76 | NSDI |
| Exposure variables | Pop_den | Population number in the grid (per 1000 people) | 4.12 | 3.51 | SGIS †† |
| Road_length | Total length of road networks (per 1000 m) | 5.00 | 3.31 | Seoul open data plaza | |
| Green_area | Total area of green and open spaces (per 1000 m2) | 44.80 | 73.43 | ||
| SAC factor | Spatial autocorrelation correction (SAC) factor | - | - | ||
| Variables | Model 1 (All) | Model 2 (Death) | Model 3 (Major Injury) | Model 4 (Minor Injury) | ||||||
|---|---|---|---|---|---|---|---|---|---|---|
| Coef. | z | Coef. | z | Coef. | z | Coef. | z | |||
| Density | SF_den | −0.002 *** | −3.36 | −0.005 ** | −2.02 | −0.002 *** | −2.65 | −0.002 *** | −2.90 | |
| MF_den | 1.6 × 10⁻⁴ | −0.91 | −0.001 ** | −2.04 | 2.3 × 10⁻⁴ | −1.11 | −8.7 × 10⁻⁵ | −0.44 | ||
| Comm_den | 0.006 *** | 11.00 | 0.003 * | 1.73 | 0.005 *** | 8.56 | 0.006 *** | 10.84 | ||
| Office_den | 0.001 *** | 3.44 | 0.001 ** | 2.34 | 0.000 *** | 2.87 | 0.001 *** | 3.66 | ||
| Diversity | LUM | 0.511 *** | 7.15 | 0.655 ** | 2.42 | 0.564 *** | 6.70 | 0.483 *** | 5.83 | |
| RNR | 0.276 *** | 3.01 | 0.850 ** | 2.28 | 0.176 | 1.55 | 0.248 ** | 2.26 | ||
| Std_built_den | 0.017 *** | 5.49 | 0.008 | 0.65 | 0.016 *** | 4.46 | 0.016 *** | 4.60 | ||
| Design | Intersect_3leg | 0.013 *** | 4.96 | 0.028 *** | 3.28 | 0.012 *** | 3.96 | 0.012 *** | 3.84 | |
| Intersect_4leg | 0.029 *** | 3.61 | 0.008 | 0.30 | 0.038 *** | 4.29 | 0.022 ** | 2.42 | ||
| No_U_turns | 0.007 | 0.88 | 0.059 ** | 2.40 | 0.011 | 1.30 | −0.005 | −0.62 | ||
| Distance to transit | Dist_bus_stop | −0.003 *** | −17.07 | −0.004 *** | −3.86 | −0.004 *** | −14.07 | −0.003 *** | −12.64 | |
| Dist_sub_stat | −2.2 × 10⁻⁴ *** | −6.08 | −1.1 × 10⁻⁴ | −0.73 | −1.9 × 10⁻⁴ *** | −4.35 | −2.2 × 10⁻⁴ *** | −5.09 | ||
| No_bus_stop | 0.014 *** | 4.11 | 0.008 | 0.66 | 0.014 *** | 3.43 | 0.015 *** | 3.91 | ||
| No_sub_stat | 0.110 *** | 4.60 | 0.128 * | 1.78 | 0.116 *** | 4.45 | 0.107 *** | 4.03 | ||
| Destination accessibility | No_school | 0.018 | 1.46 | −0.125 ** | −2.53 | 0.002 | 0.17 | 0.028 ** | 1.97 | |
| No_college | 0.020 | 0.32 | −0.374 | −1.23 | −0.051 | −0.69 | 0.096 | 1.36 | ||
| No_retail | 0.016 *** | 3.08 | −0.019 | −1.15 | 0.003 | 0.52 | 0.024 *** | 4.19 | ||
| Hosp_area | 0.003 *** | 4.39 | −0.001 | −0.24 | 0.002 *** | 2.69 | 0.004 *** | 4.87 | ||
| Relig_area | 0.005 | 0.66 | 0.000 | −0.01 | 0.006 | 0.75 | 0.003 | 0.39 | ||
| No_trad_market | 0.106 *** | 6.17 | 0.079 * | 1.83 | 0.108 *** | 6.01 | 0.105 *** | 5.69 | ||
| Topography | Slope (flat) | gentle slope | −0.067 ** | −2.26 | −0.100 | −0.91 | −0.089 ** | −2.57 | −0.046 *** | −1.35 |
| steep slope | −0.158 *** | −2.98 | −0.255 | −1.08 | −0.148 ** | −2.26 | −0.166 | −2.67 | ||
| Exposure variables | Pop_den | 0.070 *** | 9.73 | 0.045 * | 1.68 | 0.069 *** | 8.35 | 0.070 *** | 8.72 | |
| Road_length | 0.061 *** | 6.76 | 0.072 ** | 2.37 | 0.053 *** | 5.22 | 0.067 *** | 6.65 | ||
| Green_area | −0.003 *** | −8.32 | −0.006 *** | −3.02 | −0.003 *** | −5.90 | −0.004 *** | −7.15 | ||
| SAC factor | 0.013 *** | 10.53 | 0.292 ** | 2.39 | 0.032 *** | 8.80 | 0.022 *** | 10.19 | ||
| Constant | 1.106 *** | 13.81 | −2.452 *** | −7.35 | 0.426 *** | 4.28 | 0.474 *** | 4.94 | ||
| No. obs. | 2267 | 2267 | 2267 | 2267 | ||||||
| Alpha (α) | 0.163 | 0.102 | 0.147 | 0.175 | ||||||
| Chibar2 | 2669.42 *** | 1.19 | 614.97 *** | 1604.15 *** | ||||||
| Variance to mean ratio (VMR) | 23.90 | 1.28 | 8.60 | 17.22 | ||||||
| Log-likelihood (null) | −8089.34 | −1443.20 | −6359.11 | −6931.94 | ||||||
| Log-likelihood (model) | −5997.64 | −1192.02 | −4567.09 | −5066.96 | ||||||
| Pseudo R2 | 0.259 | 0.174 | 0.270 | 0.269 | ||||||
| AIC | 12,051.28 | 2440.04 | 9190.18 | 10,189.92 | ||||||
| BIC | 12,211.62 | 2600.37 | 9350.51 | 10,350.25 | ||||||
Publisher’s Note: MDPI stays neutral with regard to jurisdictional claims in published maps and institutional affiliations. |
© 2022 by the authors. Licensee MDPI, Basel, Switzerland. This article is an open access article distributed under the terms and conditions of the Creative Commons Attribution (CC BY) license (https://creativecommons.org/licenses/by/4.0/).
Share and Cite
Sung, H.; Lee, S.; Cheon, S.; Yoon, J. Pedestrian Safety in Compact and Mixed-Use Urban Environments: Evaluation of 5D Measures on Pedestrian Crashes. Sustainability 2022, 14, 646. https://doi.org/10.3390/su14020646
Sung H, Lee S, Cheon S, Yoon J. Pedestrian Safety in Compact and Mixed-Use Urban Environments: Evaluation of 5D Measures on Pedestrian Crashes. Sustainability. 2022; 14(2):646. https://doi.org/10.3390/su14020646
Chicago/Turabian StyleSung, Hyungun, Sugie Lee, SangHyun Cheon, and Junho Yoon. 2022. "Pedestrian Safety in Compact and Mixed-Use Urban Environments: Evaluation of 5D Measures on Pedestrian Crashes" Sustainability 14, no. 2: 646. https://doi.org/10.3390/su14020646
APA StyleSung, H., Lee, S., Cheon, S., & Yoon, J. (2022). Pedestrian Safety in Compact and Mixed-Use Urban Environments: Evaluation of 5D Measures on Pedestrian Crashes. Sustainability, 14(2), 646. https://doi.org/10.3390/su14020646