Article

Investigating Business Potential and Users’ Acceptance of Circular Economy: A Survey and an Evaluation Model

RISE Laboratory, Department of Mechanical and Industrial Engineering, Università degli Studi di Brescia, Via Branze, 38, 25123 Brescia, Italy
*
Author to whom correspondence should be addressed.
Sustainability 2022, 14(2), 609; https://doi.org/10.3390/su14020609
Submission received: 30 November 2021 / Revised: 1 January 2022 / Accepted: 4 January 2022 / Published: 6 January 2022

Abstract

:
Circular economy is gaining attention in business and society to advance sustainability. This paradigm is particularly relevant for energy-consuming products such as washing machines, where alternatives to linear economy such as pay-per-use and refurbishment are gaining ground. To succeed, these business models should achieve consensus and acceptance among users. However, little attention has been paid to customers’ interest for circular economy business models so far. This paper aims to compare the economic and environmental impacts of pay-per wash and refurbishment business models, while investigating the degree of users’ acceptance and factors influencing it. A survey has been designed to collect users’ data regarding washing machine consumption patterns and acceptance rates of the circular business models. An evaluation model was developed to assess the economic and environmental impacts of pay-per-wash and refurbishment against a traditional linear model, fed with data from 279 Italian households collected through the survey. Finally, logistic regressions were carried out to investigate the influence of different customer, product, and usage factors on the acceptance rates of the two circular business models. Results show that, on average, pay-per-wash business models and washing machine refurbishment can guarantee environmental savings. However, only refurbishment generates economic savings for users. Moreover, only around half of the users’ sample shows a positive degree of acceptance of such alternatives. Respondent age has been found as a significant factor influencing the interest towards a refurbishment model, while the washing machine failures experienced by users and the relevance of the environmental gains achievable influence the acceptance rate of pay-per-wash models. Thus, when offering pay-per-wash schemes, suppliers should emphasize the information on the environmental benefits of this alternative, and that with such models they take over the responsibility and costs for maintenance and repair. On the other hand, providers of refurbished products should target younger consumers, who are less affected by a bias against second-hand goods.

1. Introduction

The circular economy (CE) is gaining attention among academia and managerial communities as a means to reach sustainability by decoupling economic growth from resource extraction and environmental losses [1,2]. According to the literature, CE can be analyzed at the micro, meso, and macro levels [3,4]. The micro-level is focused on the practices of CE applied at the single firm implementation level. The meso level is focused on industrial ecology, industrial symbiosis, and on the supply chain structure and relationships among firms [5]. The macro level is focused on general policies and plans at the level of cities, regions, and countries. From a more practical perspective, companies wishing to move towards CE may adopt many levers, and exploit several enabling factors [6,7]. First, products should be designed to enable circularity, by e.g., extending their lifespan through the upgrading of their components, improving their disassembly and recycling ability to ensure that products, parts, and materials will be separated and eventually reassembled or recycled easily at the end of life, through the adoption of Design-for-X techniques [8,9]. Second, companies should move towards the offering of servitized business models such as pay-per-use, retaining product ownership and putting the focus on product usage and functionality rather than on sales [10]. Third, reverse logistics and collaboration should be integrated into conventional supply chains, to collect products after use for creating value from them [11,12,13]. Fourth, the disruptive potential of digital 4.0 technologies should be exploited, to enable circular product design, servitized business models adoption and reverse logistics implementation [14,15,16,17]. Consequently, we define CE as an:
“economic system restorative and regenerative by design, implemented by one or more supply chain actors through one or more levers and enablers (circular product design, servitized business models, supply chain management and digital 4.0 technologies) to replace the end of life concept with reduce, reuse, remanufacture or recycle materials, components and products in production, distribution and consumption processes for both technical and biological cycles, with the aim to accomplish sustainable development”
[6,7,18,19,20].
As a result, several strategies can be pursued to enable a transition towards CE, such as durability and life-extension, the provision of pay-per-use business models, refurbishment, remanufacturing, recycling, and so forth [21]. Most of these CE strategies result in the extension of products lifetime, attempting to slow down the resource flow of products that otherwise would become waste. For energy consuming products (i.e., products that consume resources during their usage and become more and more inefficient due to technological progress) the extension of lifetime does not necessarily lead to positive results in terms of both economic and environmental gains. [22,23]. This applies to washing machines (WM), where CE alternatives to the business-as-usual scenario (linear economy) may unlock environmental gains and economic benefits [6,24,25,26,27,28]. Quantifying the economic and environmental potential savings that can be reached through each CE alternative can support households and other stakeholders in embracing a transition towards CE. In addition, each CE alternative should overcome challenges in order to succeed [18]. A major shortcoming concerns users’ acceptance and value perception of such offerings [29,30,31,32]. In fact, reshaping consumption habits is one of the main obstacles to the design of effective sustainable CE solutions [33]. Customer involvement has been acknowledged by previous literature as a necessary element for sustainable circular products and business models design [34]. In a CE, the nature of the transaction between producers and consumers should be fundamentally reconsidered [35]. Unfortunately, little attention has been paid to the customer’s side so far, to its engagement and involvement in CE value proposition [36,37,38].
Consequently, the purpose of this paper is twofold. First, it aims to provide a quantitative evaluation of the economic and environmental potential of CE alternatives—against the current linear economy scenario—in the WM sector. Second, it aims to investigate users’ interest and acceptance rate of such CE alternatives, linking these acceptance rates with a set of potentially influencing factors at the customer, product, and usage level.
To accomplish this twofold purpose, this research adopts a multi-method approach, coupling different research methodologies as suggested by the CE literature [20]. First, it develops an evaluation model to quantify the economic and environmental impacts in the current households’ setting and in two CE alternatives (pay-per-wash business model and refurbishment) for the WM industry, adopting the customer point of view and considering different habits. Then, a user survey is designed and administrated to collect users’ preferences and the main data related to WM usage such as the number of washing cycles carried out, the WM capacity, and so forth. Data from 279 Italian households were collected and used to feed the evaluation model. Lastly, statistical analyses are carried out on the collected data to investigate what parameters mainly affect users’ acceptance rates of CE alternatives in the WM industry.
Thus, the remainder of this paper is structured as follows. In Section 2 materials and methods are presented, including the development of the conceptual framework that guided this study and the design of the survey. In Section 3 the evaluation model is developed, grounded on the Life Cycle Assessment and Total Cost of Ownership methodologies, and covering the linear and CE scenarios (pay-per-wash and refurbishment). Then, Section 4 presents the results of the research, while Section 5 discusses the results in light of the research objectives. Finally, conclusions as well as limitations and future research directions are proposed in Section 6.

2. Materials and Methods

2.1. Literature Review: Users’ Interest and Involvement in CE Alternatives in the WM Industry

User acceptance of CE alternatives has been recognized by previous literature as a necessary element for successful sustainable circular business models [34]. A number of studies addressed the WM industry [24]. Gülserliler et al. assessed consumers’ preferences regarding leasing new or used WMs instead of buying them, by a survey that captured attitudes and behaviors of around 2000 users [35]. They found that a significant segment of consumers is reluctant to lease WMs, and consumers’ habits are driven by psychological parameters such as pride of ownership, hygiene, and economic convenience. Lieder et al. empirically explored market interest and users’ acceptance of WM leasing and pay-per-use in the city of Stockholm, by designing a choice-based conjoint analysis on almost 140 users, based on three parameters: price, service level, and environmental benefits [29]. They discovered a general interest in such CE alternatives, where service levels (such as free maintenance and upgrades) have the strongest impact on purchase probability. Bocken et al. through an action research approach investigated the positive environmental impact generated by the improvement of WM consumption patterns following the adoption of pay-per-use business models in a sample close to 50 Dutch households [39]. They found that WM pay-per-use business models stimulate sustainable consumption, given the fact that parameters like the washing temperature and the number of washing cycles carried out are optimized. Amasawa et al. investigated how to induce a consumers’ behavioral shift towards WM sharing, investigating the main parameters that affect consumers’ behavior by a web survey of around 600 respondent in Japan [25]. They identified as main determinants of such behavioral shift the demographic profile of potential customers (gender, age, and employment) and specific factors such as the accessibility to laundromat. Kruschwitz et al. investigated the washing practices and behavior of private households to determine the main parameters affecting sustainability and energy-saving, by collecting data on the WMs usage (loading rate, temperature, and detergent dosage) of almost 230 German households over a 30 day period [40]. They found that WMs tend to be underloaded, that consumers do not adjust the detergents dosage to textiles and load size, and that not all the washing cycles are run at the lowest possible washing temperature. Alborzi et al. collected information on washing behavior from almost 5000 participants through a semi-representative survey in eleven EU countries, to understand which socio-demographic factors impact consumers’ sustainability behavior [41]. They found that laundry processes differ among the eleven EU countries investigated, and that socio-demographic parameters such as the educational level, employment status, and age of respondents statistically affect the choice of temperature and thus the sustainability performance of laundry activities. Hennies et al. collected quantitative data about discarding and maintenance history of household appliances, including WMs, in private German households through an internet-based questionnaire with 1075 respondents [42]. They found that the WM lifespan depends on parameters such as the purchasing price and the number of washing cycles carried out. Lastly, Atlason et al. investigated users’ perception of the reuse, remanufacturing, and recycling of different household appliances using a quantitative Kano survey on a sample of 146 Danish users [30].

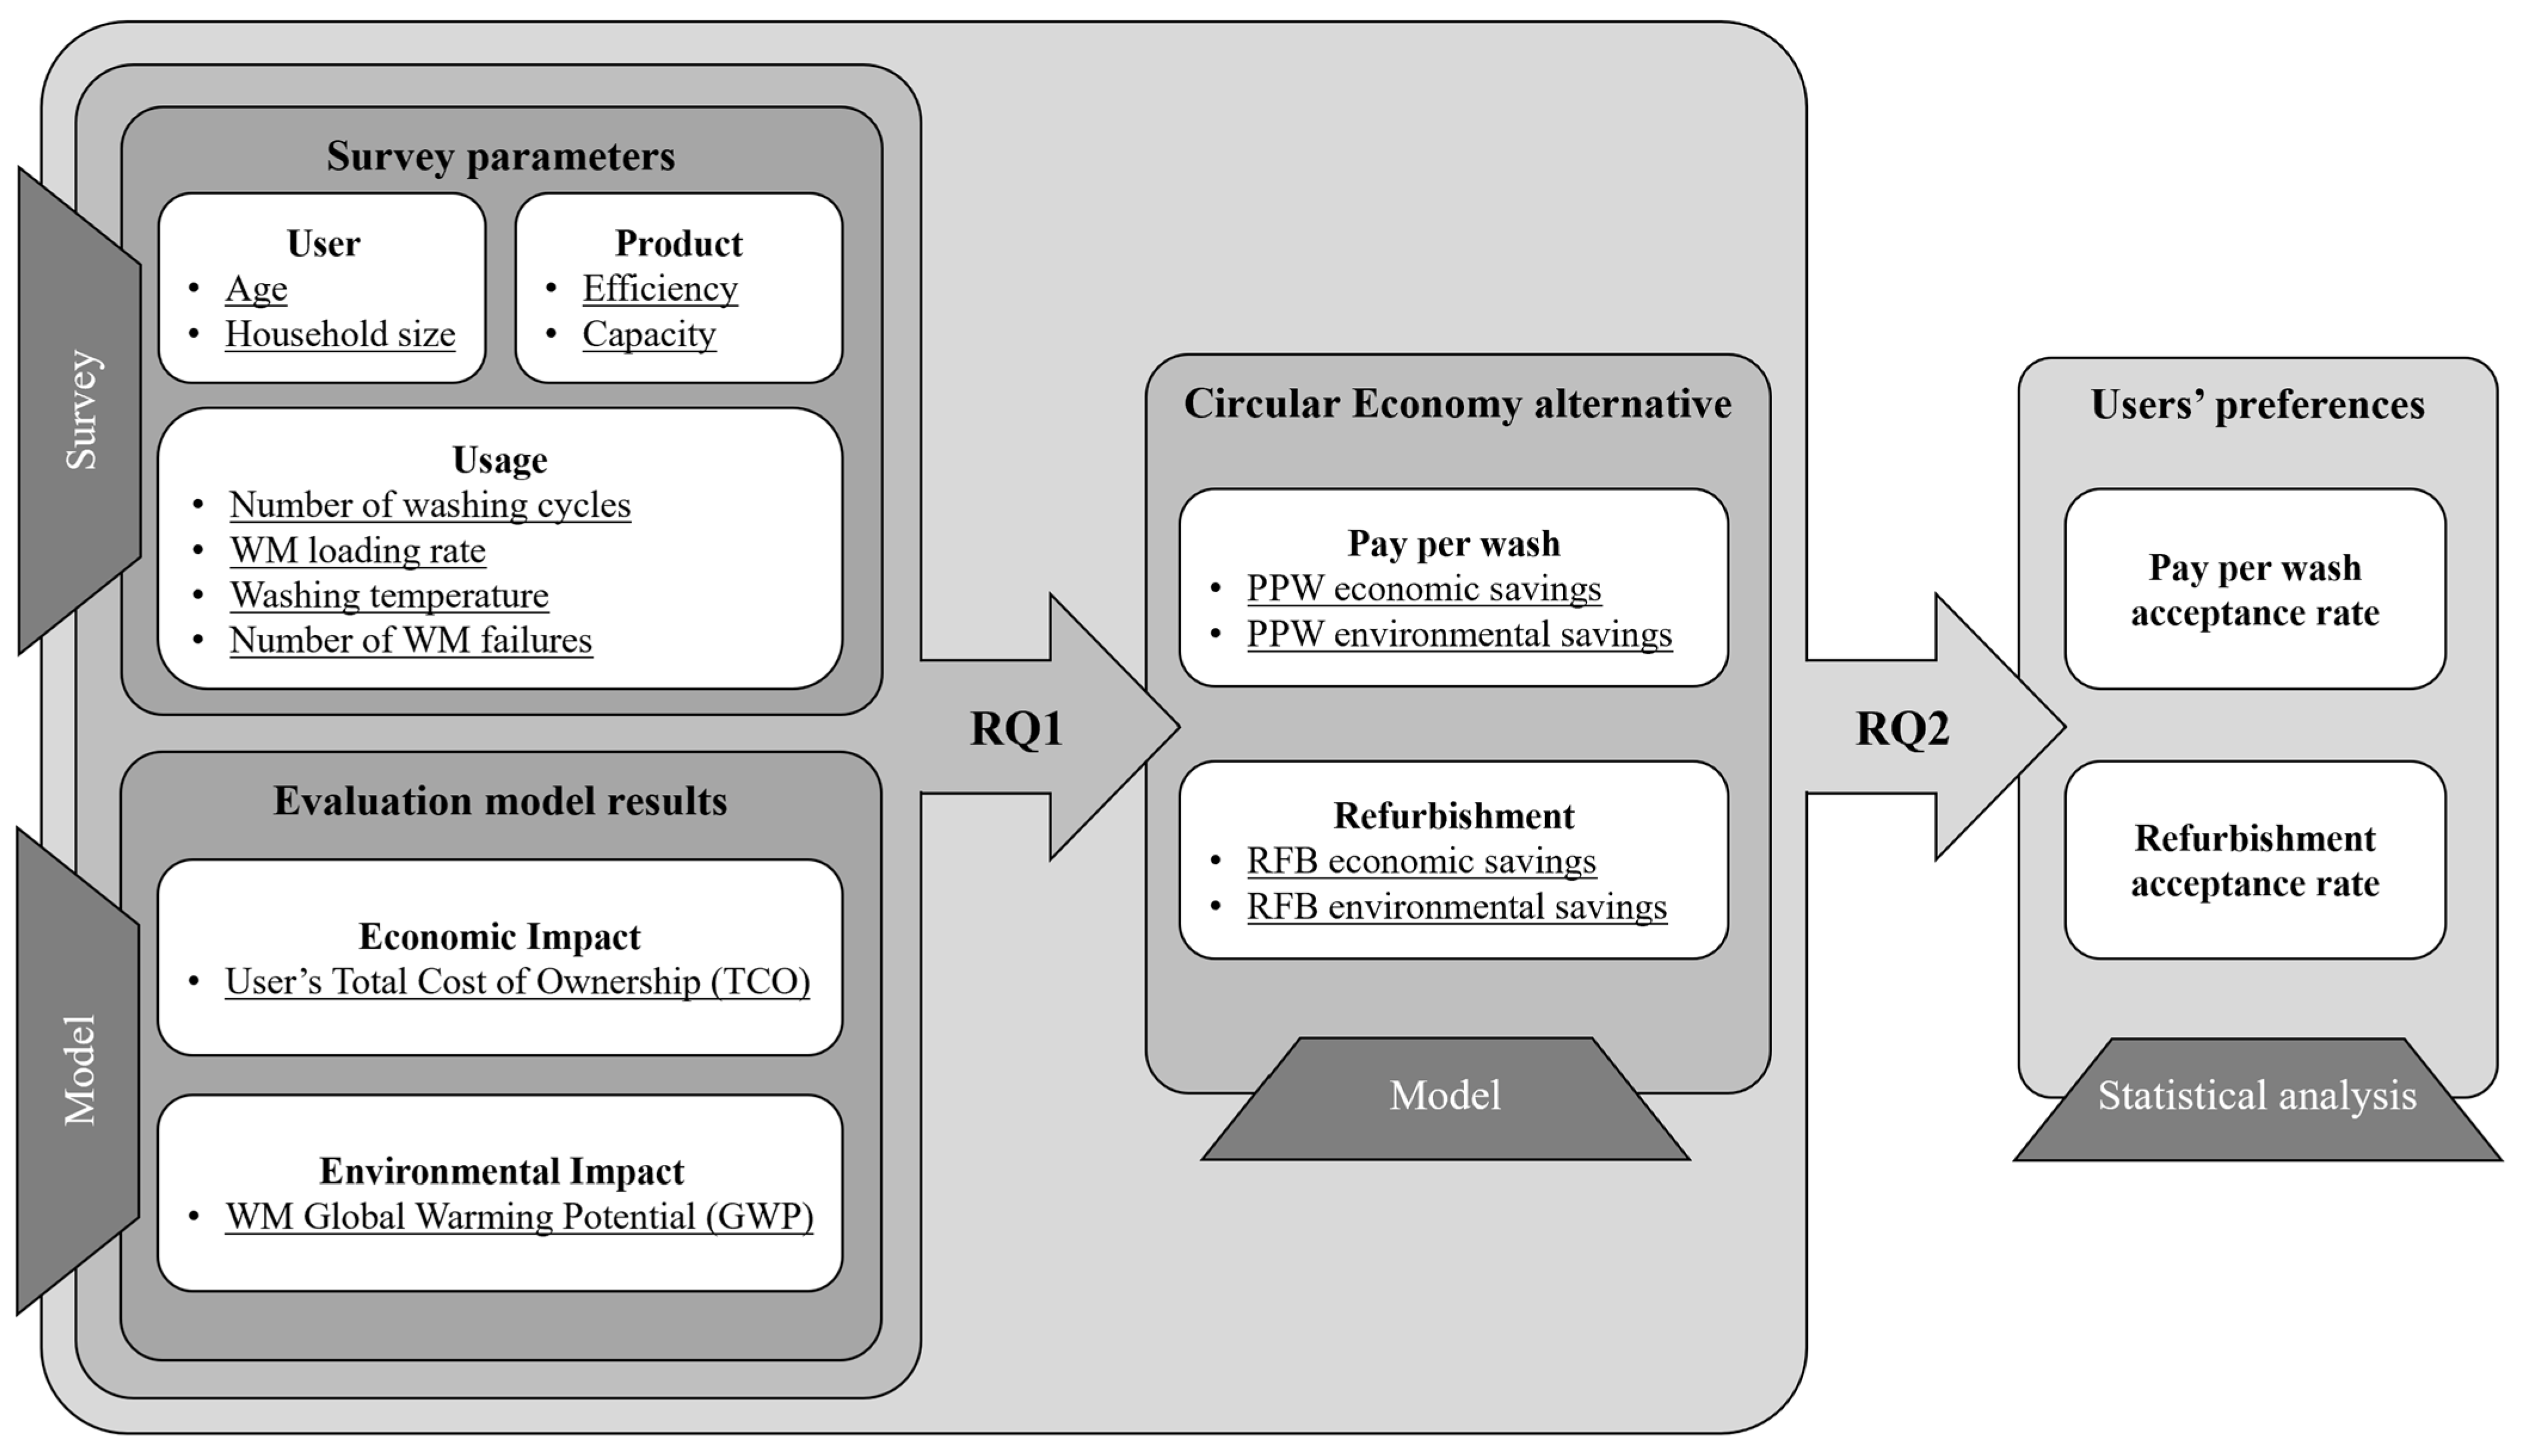
2.2. Research Motivation, Design and Conceptual Framework

Despite the abovementioned previous research in investigating users’ participation in CE alternatives for the WM industry, the literature still overlooks customers’ interest and acceptance of CE, and does not contrast users’ CE acceptance degree with their eco-environmental performance. For instance, Gülserliler et al. investigated the influence of only psychological antecedents on leasing feasibility, leaving out other parameters of the washing process [35]. The need to extend the scope of these studies to include other influential parameters such as the household size is explicitly recalled in Lieder et al. [29]. In addition, the economic and the environmental impact of these CE alternatives may drive customer decisions and influence their acceptance rates. Nevertheless, even recent studies still do not explicitly address the consumer side in the eco-environmental assessment [35,38], while the need to use primary data to quantitatively assess the eco-environmental impact of CE alternatives in the WM industry is stressed by Bocken et al. [39]. Addressing the user acceptance of CE alternatives such as pay-per-use has been recommended also in Atlason et al. [30].
Consequently, this paper aims to provide a quantitative evaluation of the economic and environmental potential of CE alternatives (pay-per-wash and refurbishment business models) in the WM sector, by investigating their eco-environmental impact and by addressing the users’ interest and acceptance rates. To better frame the research objective, the following Research Questions are formulated:
  • RQ1: Can pay-per-wash and refurbishment business models improve the economic and environmental performances, compared to the traditional linear model?
  • RQ2: Are users interested in pay-per-wash and refurbishment business models, and what aspects mainly influence their acceptance?
Figure 1 depicts the conceptual framework that guides the research process followed in this study. There are several parameters related to users, product, and usage that may affect the eco-environmental performances of the WM lifecycle, as recognized by previous research (See Section 2.1). Product characteristics such as the WM energy efficiency class and its capacity are directly linked with energy, water, and detergent consumption. The same holds for usage characteristics such as the number of washing cycles, the WM loading rate, the washing temperature, and the WM failures. Additionally, users’ characteristics such as age and household size may drive (or not) more sustainable usage processes. All these data can be collected from users through a survey and used as inputs to compute the economic and the environmental performances of laundry activities, by calculating the users’ Total Cost of Ownership and the WM Global Warming Potential. To shed light on RQ1, these metrics are assessed in the pay-per-wash and in the refurbishment CE scenarios, to compute the potential eco-environmental savings. To shed light on RQ2, users’ preferences and acceptance of pay-per-wash and refurbishment business models have been investigated. The following hypotheses have been statistically tested in this study (PPW: Hypothesis 1a–Hypothesis 1l):
Hypothesis 1a (H1a):
(PPW) Users at different ages have different pay-per-wash acceptance rates.
Hypothesis 1b (H1b):
(PPW) Users with different household size have different pay-per-wash acceptance rates.
Hypothesis 1c (H1c):
(PPW) Users with different WM efficiency class have different pay-per-wash acceptance rates.
Hypothesis 1d (H1d):
(PPW) Users with different WM capacity have different pay-per-wash acceptance rates.
Hypothesis 1e (H1e):
(PPW) Users who wash with different frequencies have different pay-per-wash acceptance rates.
Hypothesis 1f (H1f):
(PPW) Users who wash with different loading rates have different pay-per-wash acceptance rates.
Hypothesis 1g (H1g):
(PPW) Users who wash at different temperatures have different pay-per-wash acceptance rates.
Hypothesis 1h (H1h):
(PPW) Users who experienced different WM failure rates have different pay-per-wash acceptance rates.
Hypothesis 1i (H1i):
(PPW) Users experiencing higher-lower TCOs have different pay-per-wash acceptance rates.
Hypothesis 1j (H1j):
(PPW) Users experiencing higher-lower GWPs have different pay-per-wash acceptance rates.
Hypothesis 1k (H1k):
(PPW) Users experiencing higher-lower economic savings due to pay-per-wash have different pay-per-wash acceptance rates.
Hypothesis 1l (H1l):
(PPW) Users experiencing higher-lower environmental savings due to pay-per-wash have different pay-per-wash acceptance rates.
The same hypotheses have been formulated for WM refurbishment (RFB):
Hypothesis 2a (H2a):
(RFB) Users at different ages have different refurbishment acceptance rates.
Hypothesis 2b (H2b):
(RFB) Users with different household size have different refurbishment acceptance rates.
Hypothesis 2c (H2c):
(RFB) Users with different WM efficiency class have different refurbishment acceptance rates.
Hypothesis 2d (H2d):
(RFB) Users with different WM capacity have different refurbishment acceptance rates.
Hypothesis 2e (H2e):
(RFB) Users who wash with different frequencies have different refurbishment acceptance rates.
Hypothesis 2f (H2f):
(RFB) Users who wash with different loading rates have different refurbishment acceptance rates.
Hypothesis 2g (H2g):
(RFB) Users who wash at different temperatures have different refurbishment acceptance rates.
Hypothesis 2h (H2h):
(RFB) Users who experienced different WM failure rates have different refurbishment acceptance rates.
Hypothesis 2i (H2i):
(RFB) Users experiencing higher-lower TCOs have different refurbishment acceptance rates.
Hypothesis 2j (H2j):
(RFB) Users experiencing higher-lower GWPs have different refurbishment acceptance rates.
Hypothesis 2k (H2k):
(RFB) Users experiencing higher-lower economic savings due to refurbishment have different refurbishment acceptance rates.
Hypothesis 2l (H2l):
(RFB) Users experiencing higher-lower environmental savings due to refurbishment have different refurbishment acceptance rates.

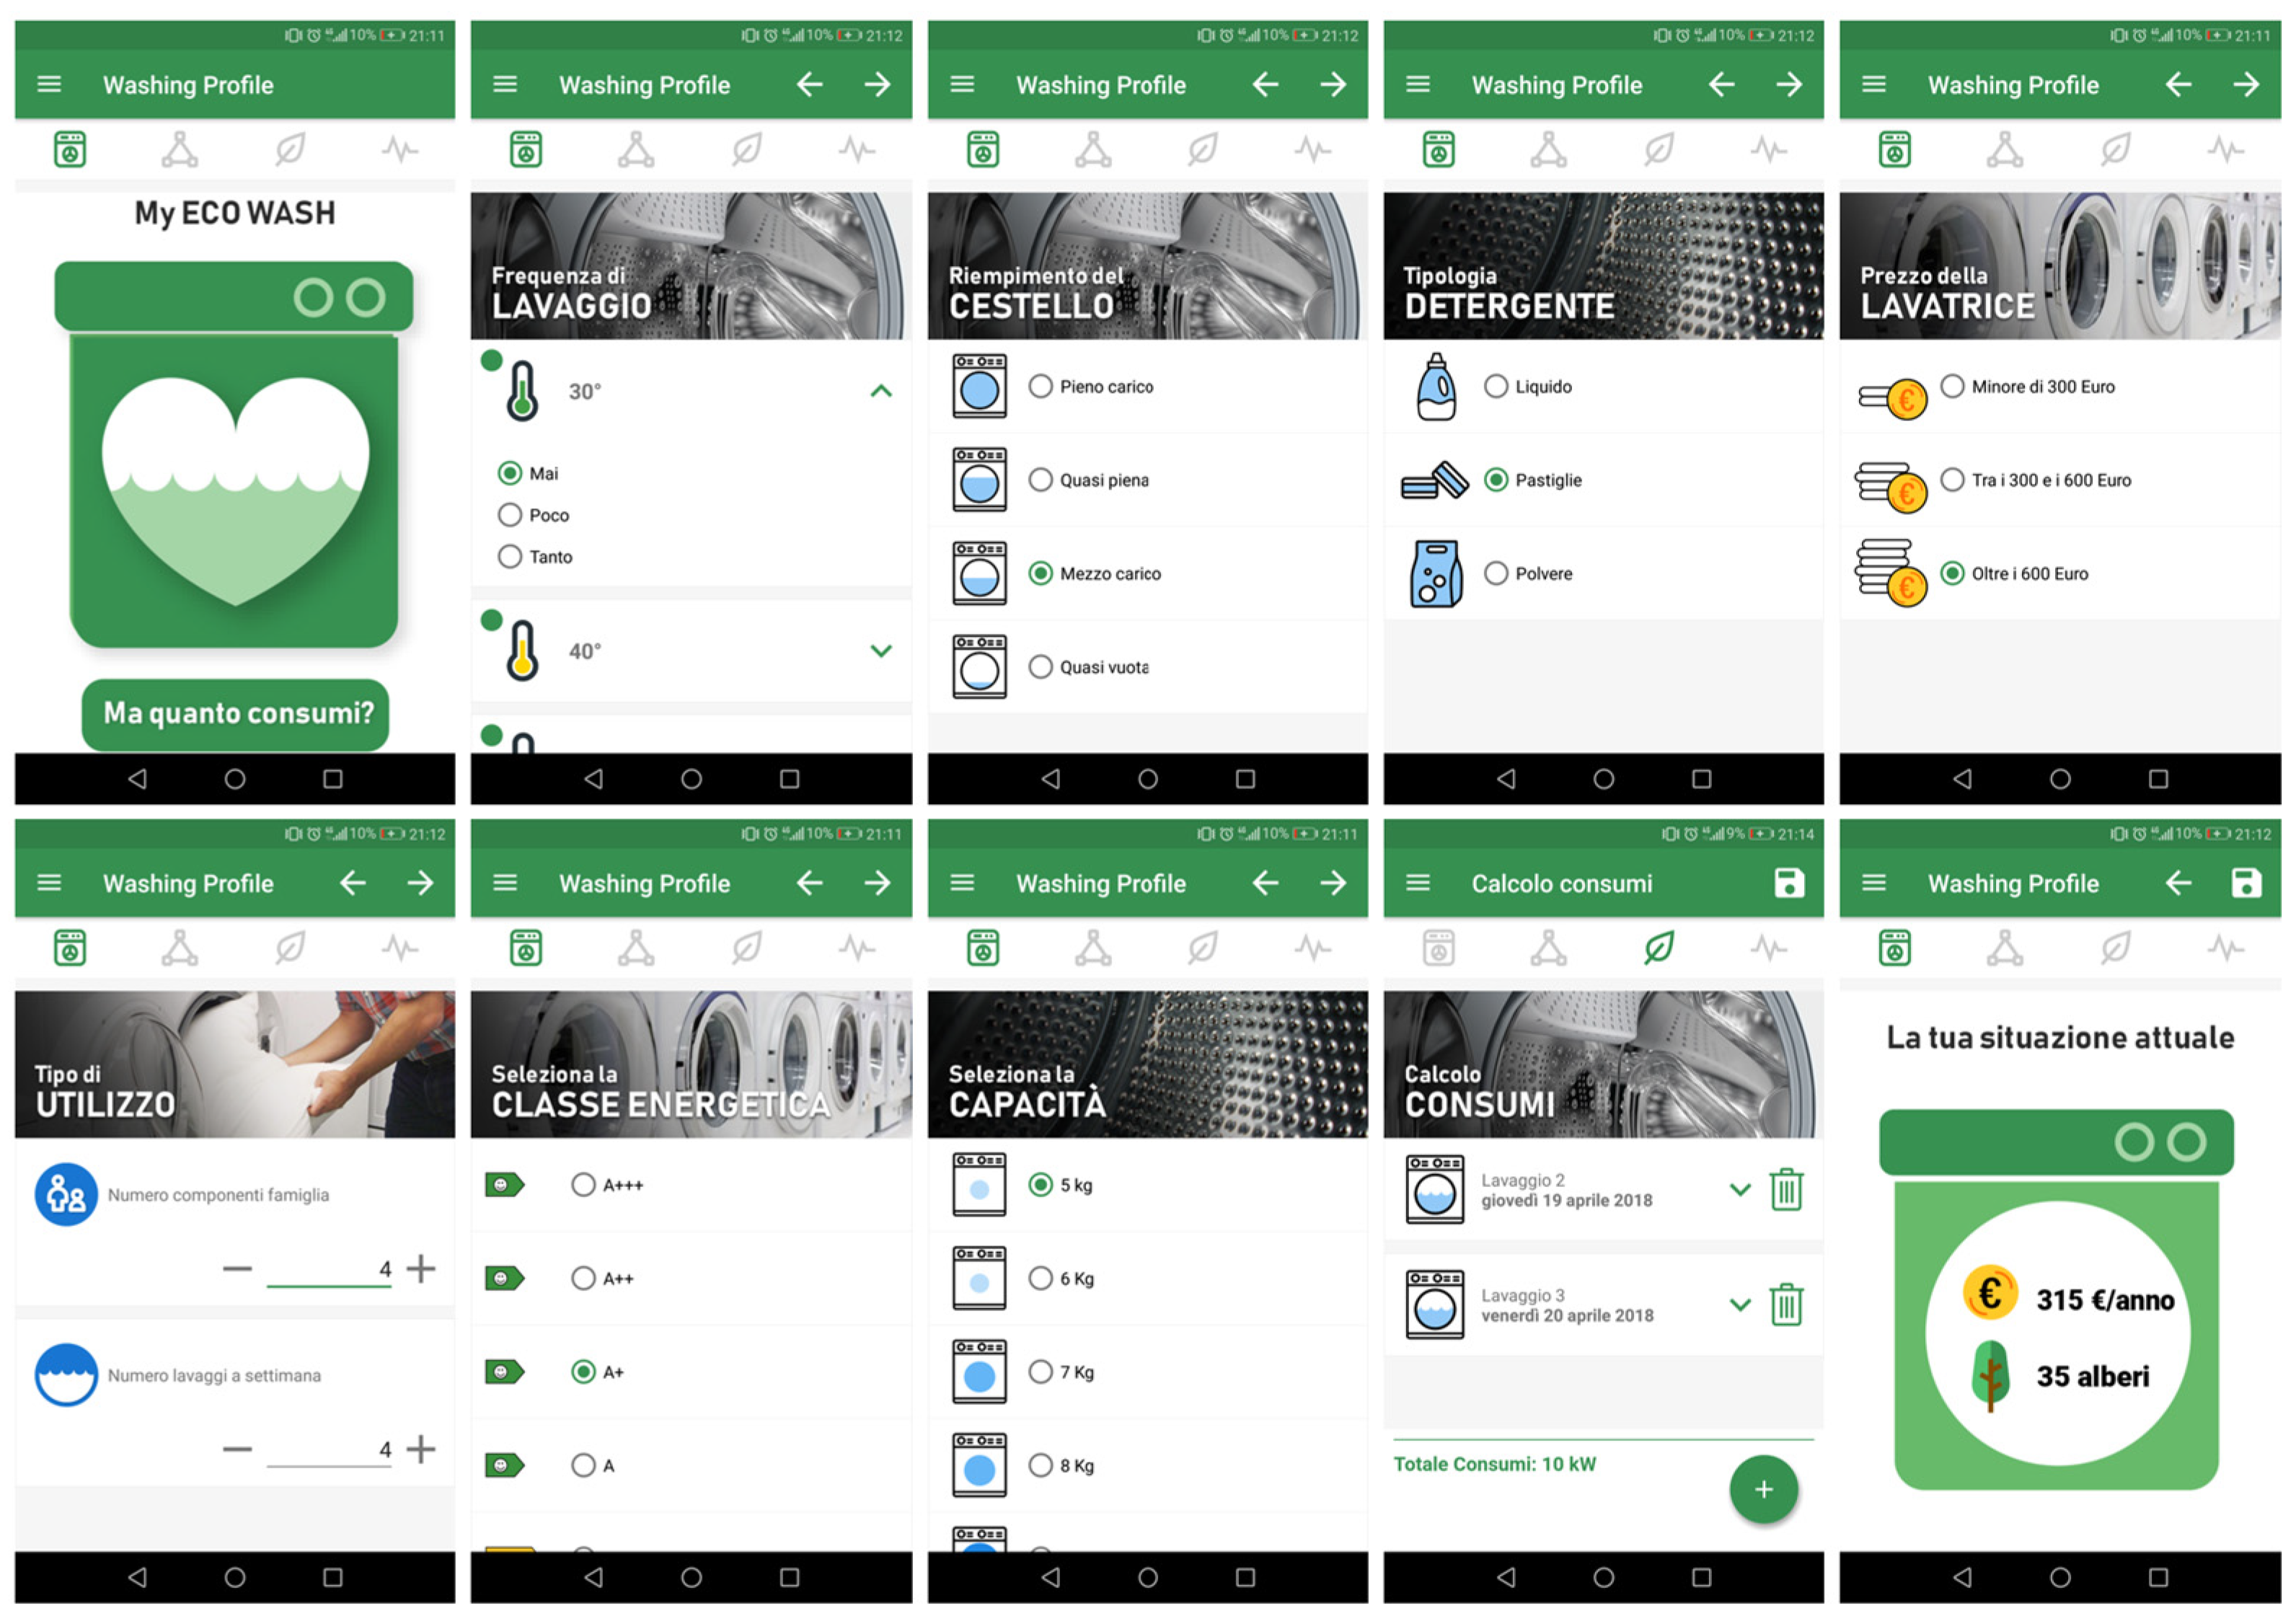
2.3. Research Method

To address the RQs, this paper adopts a multidisciplinary approach, coupling different research methodologies.
First, an evaluation model has been developed to quantify the economic and environmental impacts in the current households’ setting and in two CE alternatives (pay-per-wash business model and refurbishment). The model computes both economic and environmental impacts, adopting the user’s point of view in the first case and the WM viewpoint in the latter.
Second, a user survey is designed to collect users’ preferences and the main data related to their WM characteristics and usage habits, according to the conceptual framework of Figure 1. The survey was used also to collect the households’ preferences regarding CE alternatives to the linear scenario in the WM industry. More specifically, to each user an entry-level explanation of the CE concept was first presented. Then, it was asked whether he/she would be willing to access to a pay-per-wash scheme or to purchase a refurbished WM. The survey was launched online in 2019 and data from 279 Italian households were collected. Respondents were reached via internet by sharing the survey access link on popular social networks and by word of mouth. Data collected through the survey are listed in Table 1.
The survey and the evaluation model were also implemented in a Smartphone Mobile App (Figure 2), to ease data collection and results computation.
Third and last, statistical analyses were carried out with the aim to test the hypotheses formulated in Section 2.2 and to investigate what parameters mainly affect users’ acceptance rates of CE alternatives. Given the fact that the response variables (i.e., users’ acceptance of refurbishment and pay-per-wash business models) are binary (i.e., 0/1 coding), logistic regression is here applied [43]. Rather than directly modeling the response variable, logistic regression models the probability that the response belongs to a Yes/No category, through the logistic function. The R software package was used to run statistical analyses and compute logistic regression coefficients and significance levels [44].

3. Evaluation Model Development

3.1. User’s Total Cost of Ownership

The economic impact is assessed by adopting the user’s point of view through the evaluation of the Total Cost of Ownership (TCO) associated with the WM purchasing and usage phases. TCO can be defined as the sum of costs associated to the acquisition and use of a good or a service [45]. It is computed through Equation (1), which provides an estimation of the expenses, in euro per year, that a household usually bears
T C O   [ year ] = P L + M R + ( E C × e c ) + ( W C × w c ) + ( D C × d c )
More specifically, the user’s yearly TCO is given by the sum of two contributions: the purchasing and the usage cost. The first term is obtained by dividing the WM Price (P) for the WM lifespan (L). The latter, instead, is given by the sum of the Maintenance and Repair yearly expenditure (MR = 3.6 €/year [46]) and of the Energy (EC), Water (WC), and Detergent (DC) Consumption, multiplied by their specific costs. The energy specific cost (ec) has been set equal to 0.23 €/kWh [47]; the water specific cost (wc) has been set equal to 0.004 €/L [47]; the specific detergent cost (dc) has been set equal to 3.5 €/kg [46].
To determine the WM lifespan in year (L), the number of washing cycles that a WM can potentially perform (LWM) is divided by the number of washing cycles that a household does per year (Nwc). In doing so, an upper bound of 15 years has been considered, since usually, after that period, consumers discard their WM even though it is still working, mainly for aesthetic reasons [42]. This phenomenon, known as aesthetic obsolescence [48], is considered in Equation (2).
L = m a x ( L W M N w c   ; 15 )
To compute the yearly Energy Consumption (EC), the formula developed by Milani et al. (2015) has been adapted and included in the model. In their work, the authors have modelled the EC as a function of WM features such as the Energy Efficiency Class (EEC), the WM Capacity (C) and the Temperature (T) of the washing cycles [49]. Products’ Energy Efficiency Classes are standardized systems of energy efficiency ratings issued by the European Union for most domestic appliances, and are commonly used as a reference to compute the energy consumption of white goods [50]. The model proposes, in Equation (3), an adaptation of such formulation, where the electricity consumption of a single washing cycle is given by the sum of two contributions, i.e., a fixed (EFCEEC) and a capacity-dependent parameter (EVCEEC).
E C   [ kWh year ] = T = 30 ° C T = 90 ° C N w c × F T × K T × ( E F C E E C + E V C E E C × C )
Both EFCEEC and EVCEEC terms vary depending on the EEC (Table 2).
To include the effect of the washing temperature (T), Milani et al. (2015) have introduced a temperature coefficient (KT) that should be multiplied to the consumption of each washing cycle. Accordingly, a washing cycle done at a temperature of 90 °C consumes as much energy as 1.63 cycles done at a temperature of 60 °C. This is consistent with the specialized literature in the field, which usually suggests washing at low temperatures as a means to reduce energy consumption [51]. Table 3 shows the KT values for the main washing temperatures (i.e., 30, 40, 60, and 90 °C).
Consequently, the yearly EC is thus obtained through Equation (3) by multiplying the single washing cycle consumption with the number of washing cycles performed in a year (Nwc), in accordance with the usage frequency (FT) of each temperature. The latter is defined in a way that:
T = ( 30   ° C ;   40 ° C ;   60 ° C ;   90   ° C ) F T = 100 %
To compute the yearly Water Consumption (WC), the formula developed by Lasic et al. (2015) has been used and adapted here [52]. Through this formulation, the water usage of each washing cycle is given by the sum of a Water Fixed Consumption (WFC = 4.166) with two variable parameters (WVCC = 0.476 and WVCC;LR = 1.725) which, respectively, are directly proportional to the WM Capacity (C) and to the WM real load. To obtain the WM real load, the model multiplies the capacity C with the Loading Rate (LR). By multiplying the water usage of each main cycle by NRC—a factor that was adjusted to take into account the number of rinsing cycle per each laundry, and put equal to 2 according to [53]—and by the number of washing cycles performed in a year (Nwc), it is possible to determine WC through Equation (5):
W C   [ litre year ] = N w c × N R C × ( W F C + W V C C × C + W V C C ; L R × C × L R )
Lastly, to compute the yearly Detergent Consumption (DC), the model uses the formula developed by Boyano et al. (2017), as reported in Equation (6):
D C   [ kg year ] = N w c × ( D F C + D V C × C × L R )
Accordingly, the DC is affected by a detergent fixed consumption per each cycle (DFC = 0.04) and by a variable consumption (DVCC;LR = 0.012) that depends on the WM real load.

3.2. Product Life Cycle Assessment

The lifecycle model evaluates the environmental impact by adopting the WM point of view through a Life Cycle Assessment (LCA), according to the ISO standards [54] and encompassing raw materials extraction, manufacturing, assembly, distribution, and usage phases. Among the several LCA impact categories and indexes available [55,56], the model computes the Global Warming Potential (GWP), given its relevance for global warming and climate change. As in the case of the economic impact presented in Section 2.1, the usage phase is affected by the usage habits. The LCA is thus computed through Equation (7), which provides an estimation of the yearly GWP, in kg of CO2 equivalent per year, related to a WM lifecycle.
G W P   [ kgCO 2 eq year ] = R M E W M + M & A W M + D W M L + ( E C × e g w p ) + ( W C × w g w p ) + ( D C × d g w p )
More specifically, the GWP is given by the sum of two contributions: the supply and the usage phase. The first contribution is obtained by dividing the sum of the Raw Material Extraction (RMEWM), Manufacturing and Assembly (M&AWM), and Distribution (DWM) unitary impacts for the WM lifespan (L), where L is determined through Equation (2). The latter, instead, is given by the sum of the Energy (EC), Water (WC), and Detergent (DC) Consumptions, as determined in Equations (3)–(6), multiplied by their specific GWP impacts. The energy unitary global warming potential (egwp) has been set equal to 0.41 kg CO2-eq/kWh [53]; The water unitary global warming potential (wgwp) has been set equal to 0.0011 kg CO2-eq/L [53]; the detergent unitary global warming potential (dgwp) has been set equal to 1.89 kg CO2-eq/kg [46].
Generally, the values of the RMEWM, M&AWM, and DWM phases are computed starting from the collection of raw data such as the WM bill-of-materials or the manufacturing or distribution processes [57]. However, for the purpose of this paper, a simplified approach has been taken. In fact, it was decided to model the infinite WMs configurations into three classes, i.e., low-price, average-price, and high-price segments, according to the conditions of Table 4. The values reported in Table 4 have been collected from previous literature [58] and are consistent with more recent findings, which stated that the environmental impact of producing new WMs is comparable to that of old devices [59].

3.3. Pay-Per-Wash Circular Economy Scenario

In a pay-per-wash CE scenario, users no longer buy and own a WM. Instead, they access a high-efficient WM (with EEC = ‘A+++’) at home, without having to pay its retail price. Maintenance and repair costs are also included in the pay-per-wash fee. WMs typically have a large capacity (C = ‘8 kg’) and are equipped with an automatic-dosing detergent dispenser and with a capacity-recognition system, to both reduce detergent consumption and increase the loading rate. This kind of servitized business model usually works with an IoT kit to connect the WM to the internet, in a way to enable payments and remote monitoring [27].
To assess the economic and environmental impacts of this CE scenario, Equations (1) and (8) of the evaluation model are adjusted to compute the TCO and the GWP of the pay-per-wash scheme. More specifically, instead of considering the purchasing price, the pay-per-wash fee (Fppw = 1.3 € per washing cycle, according to [39]) is taken into account. Moreover, a 10% reduction in detergent consumption DC is assumed, due to the automatic detergent dosing system. The GWP values of the supply side are those referring to a high-price WM segment class (Table 4). Lastly, the number of washing cycle (Nwcppw) is determined by Equation (8), where the original total amount of laundry is now washed in a WM with a capacity (C) of 8 kg and a Loading Rate (LR) of 100%, due to the capacity recognition system installed.
N w c p p w = N w c × C × L R 8   k g × 100 %

3.4. Washing Machine Refurbishment Circular Economy Scenario

In a WM refurbishment CE scenario, users no longer buy a brand-new WM. Instead, they buy a refurbished one, i.e., a WM that have been previously used by another household, collected, refurbished, and then resold. Consequently, the main CE lever involved in this CE scenario is the reverse logistics supply chain management. To assess the economic and environmental impacts of this CE scenario, Equations (1) and (7) of the lifecycle model have been adjusted to compute the TCO and the GWP in a refurbishment scheme. More specifically, instead of considering the WM purchasing price, we consider an average refurbished WM price (PRfb) of 200 €. Moreover, instead of considering a single WM lifespan, we define L1 and L2 as respectively the first and the second WM life (after refurbishment). The average L1 (WM life before refurbishment) was assumed equal to 5 years [60]. Thus, according to the rationale underlying Equation (2), L2 is derived as in Equation (9):
L 2 = m a x ( L W M N w c   ; 10 )
It is worthwhile to stress that the TCO is based on L2, since it adopts the user viewpoint, while GWP is based on L1 + L2, since it adopts the WM perspective [45]. Furthermore, it was assumed an EEC equal to A++, while the GWP values of the supply side are those referring to an average-price segment class of WM (Table 4). No modifications in C, in FT, and in LR have been considered, since it was assumed that users buying a refurbished WM do not change their washing habits.

4. Results

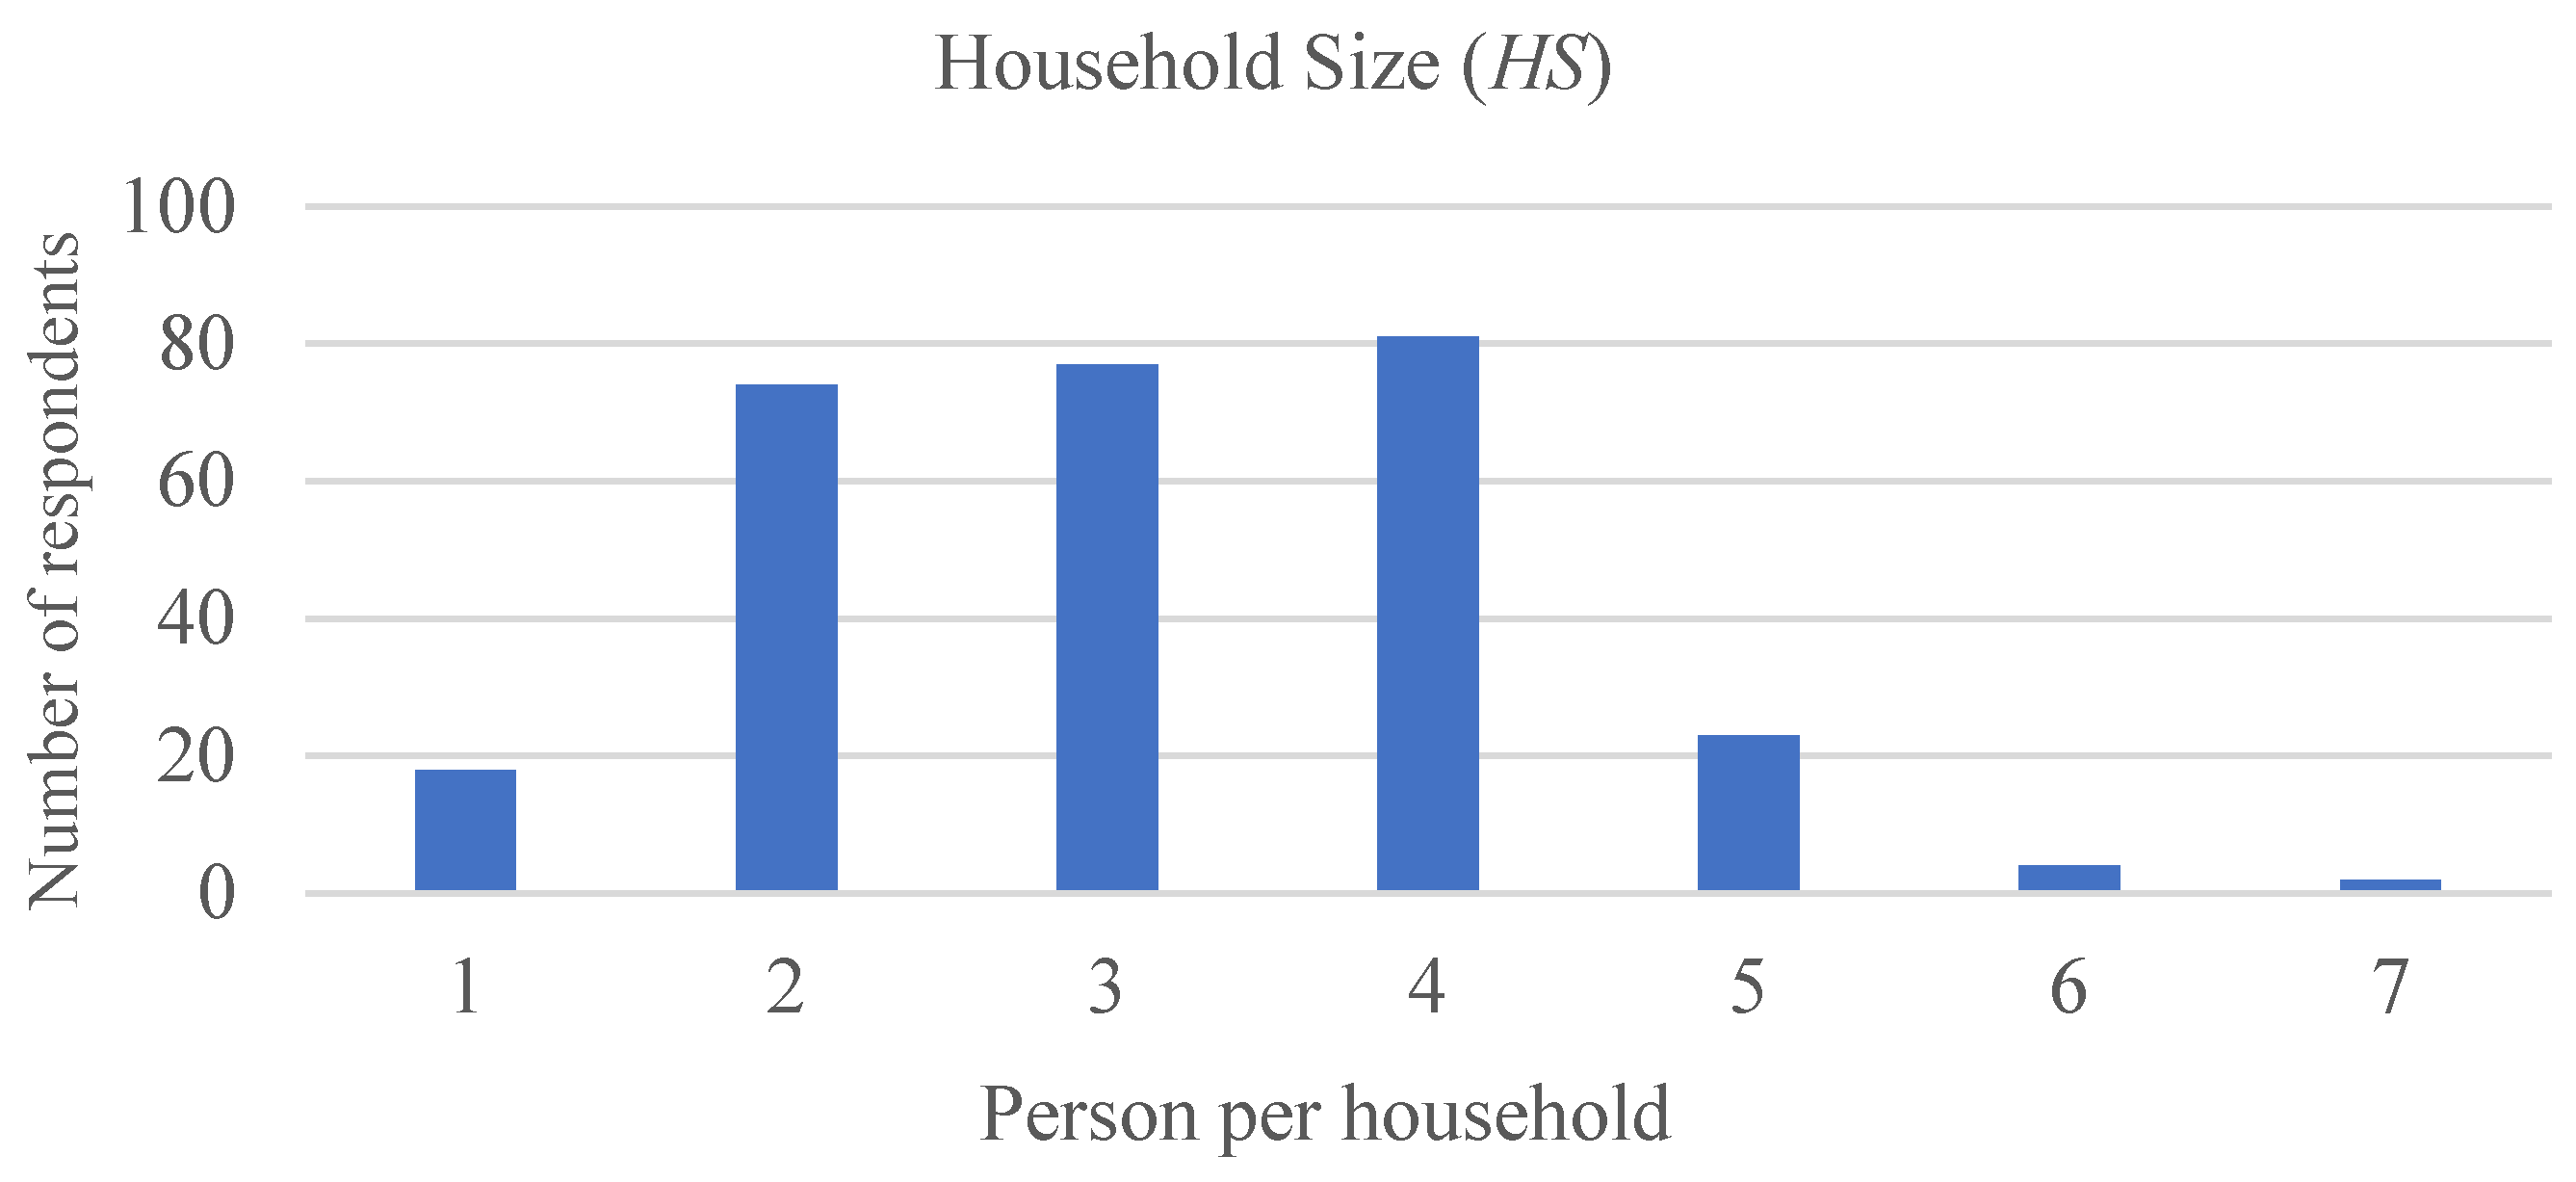
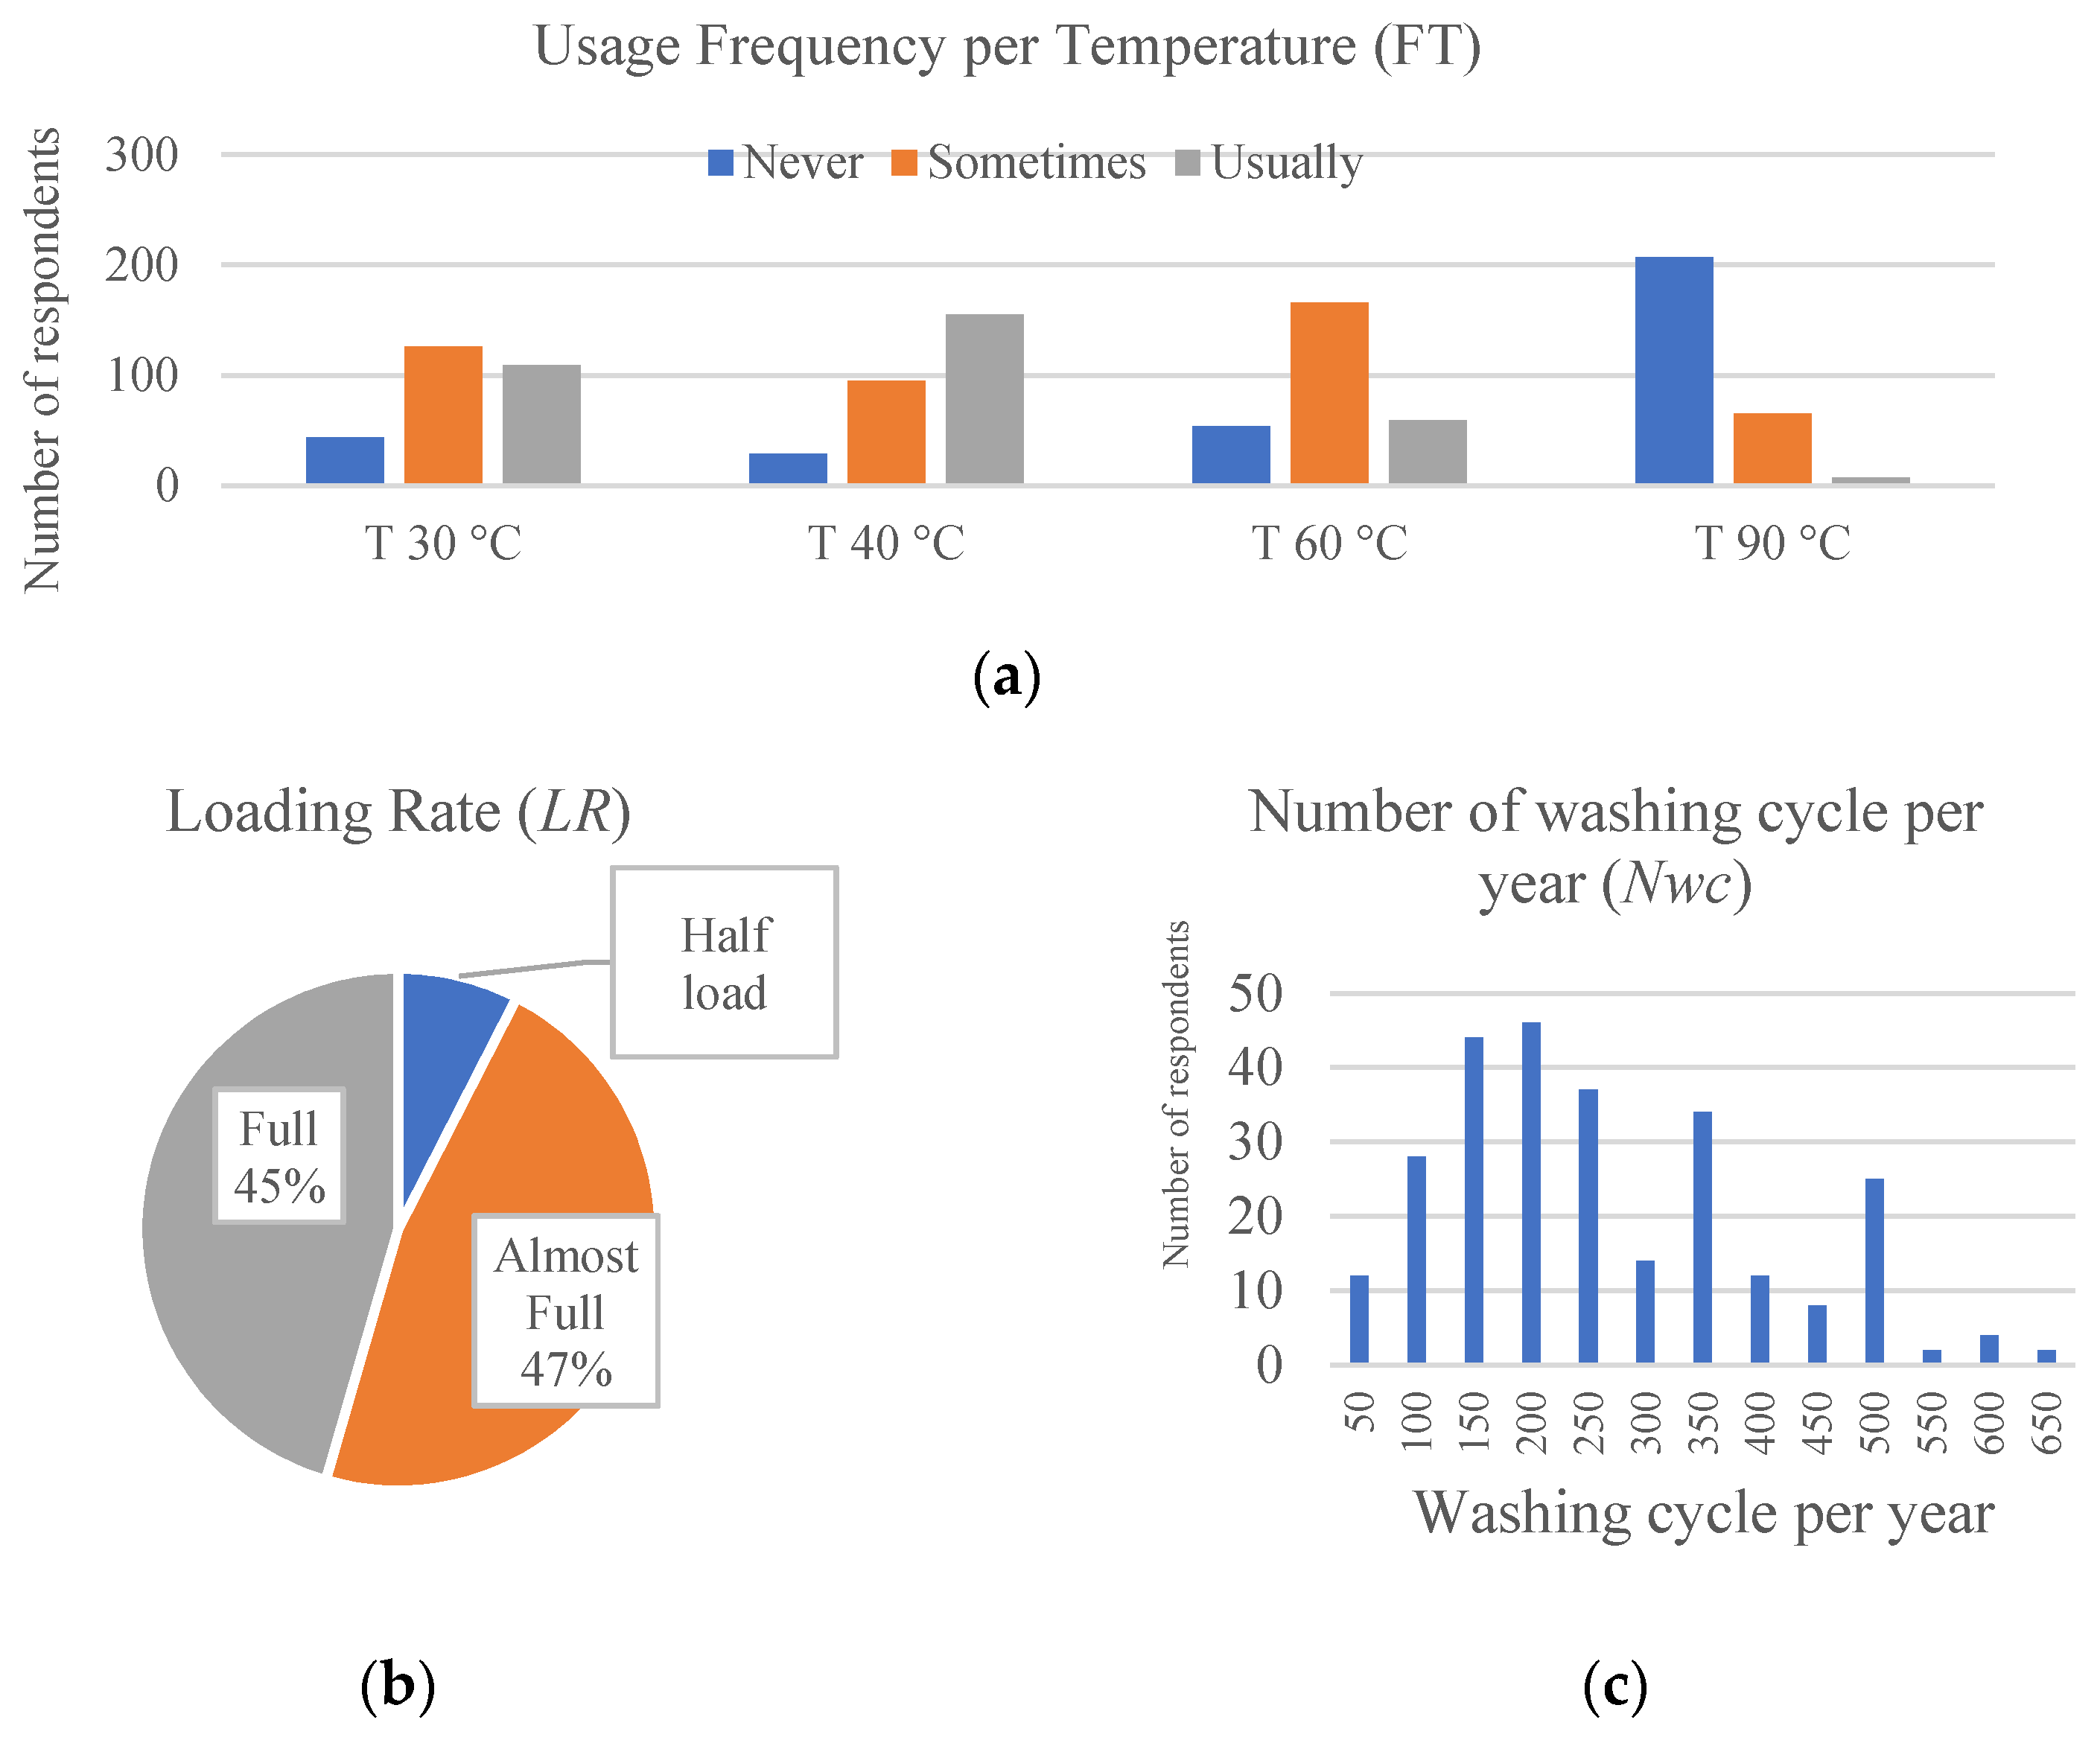
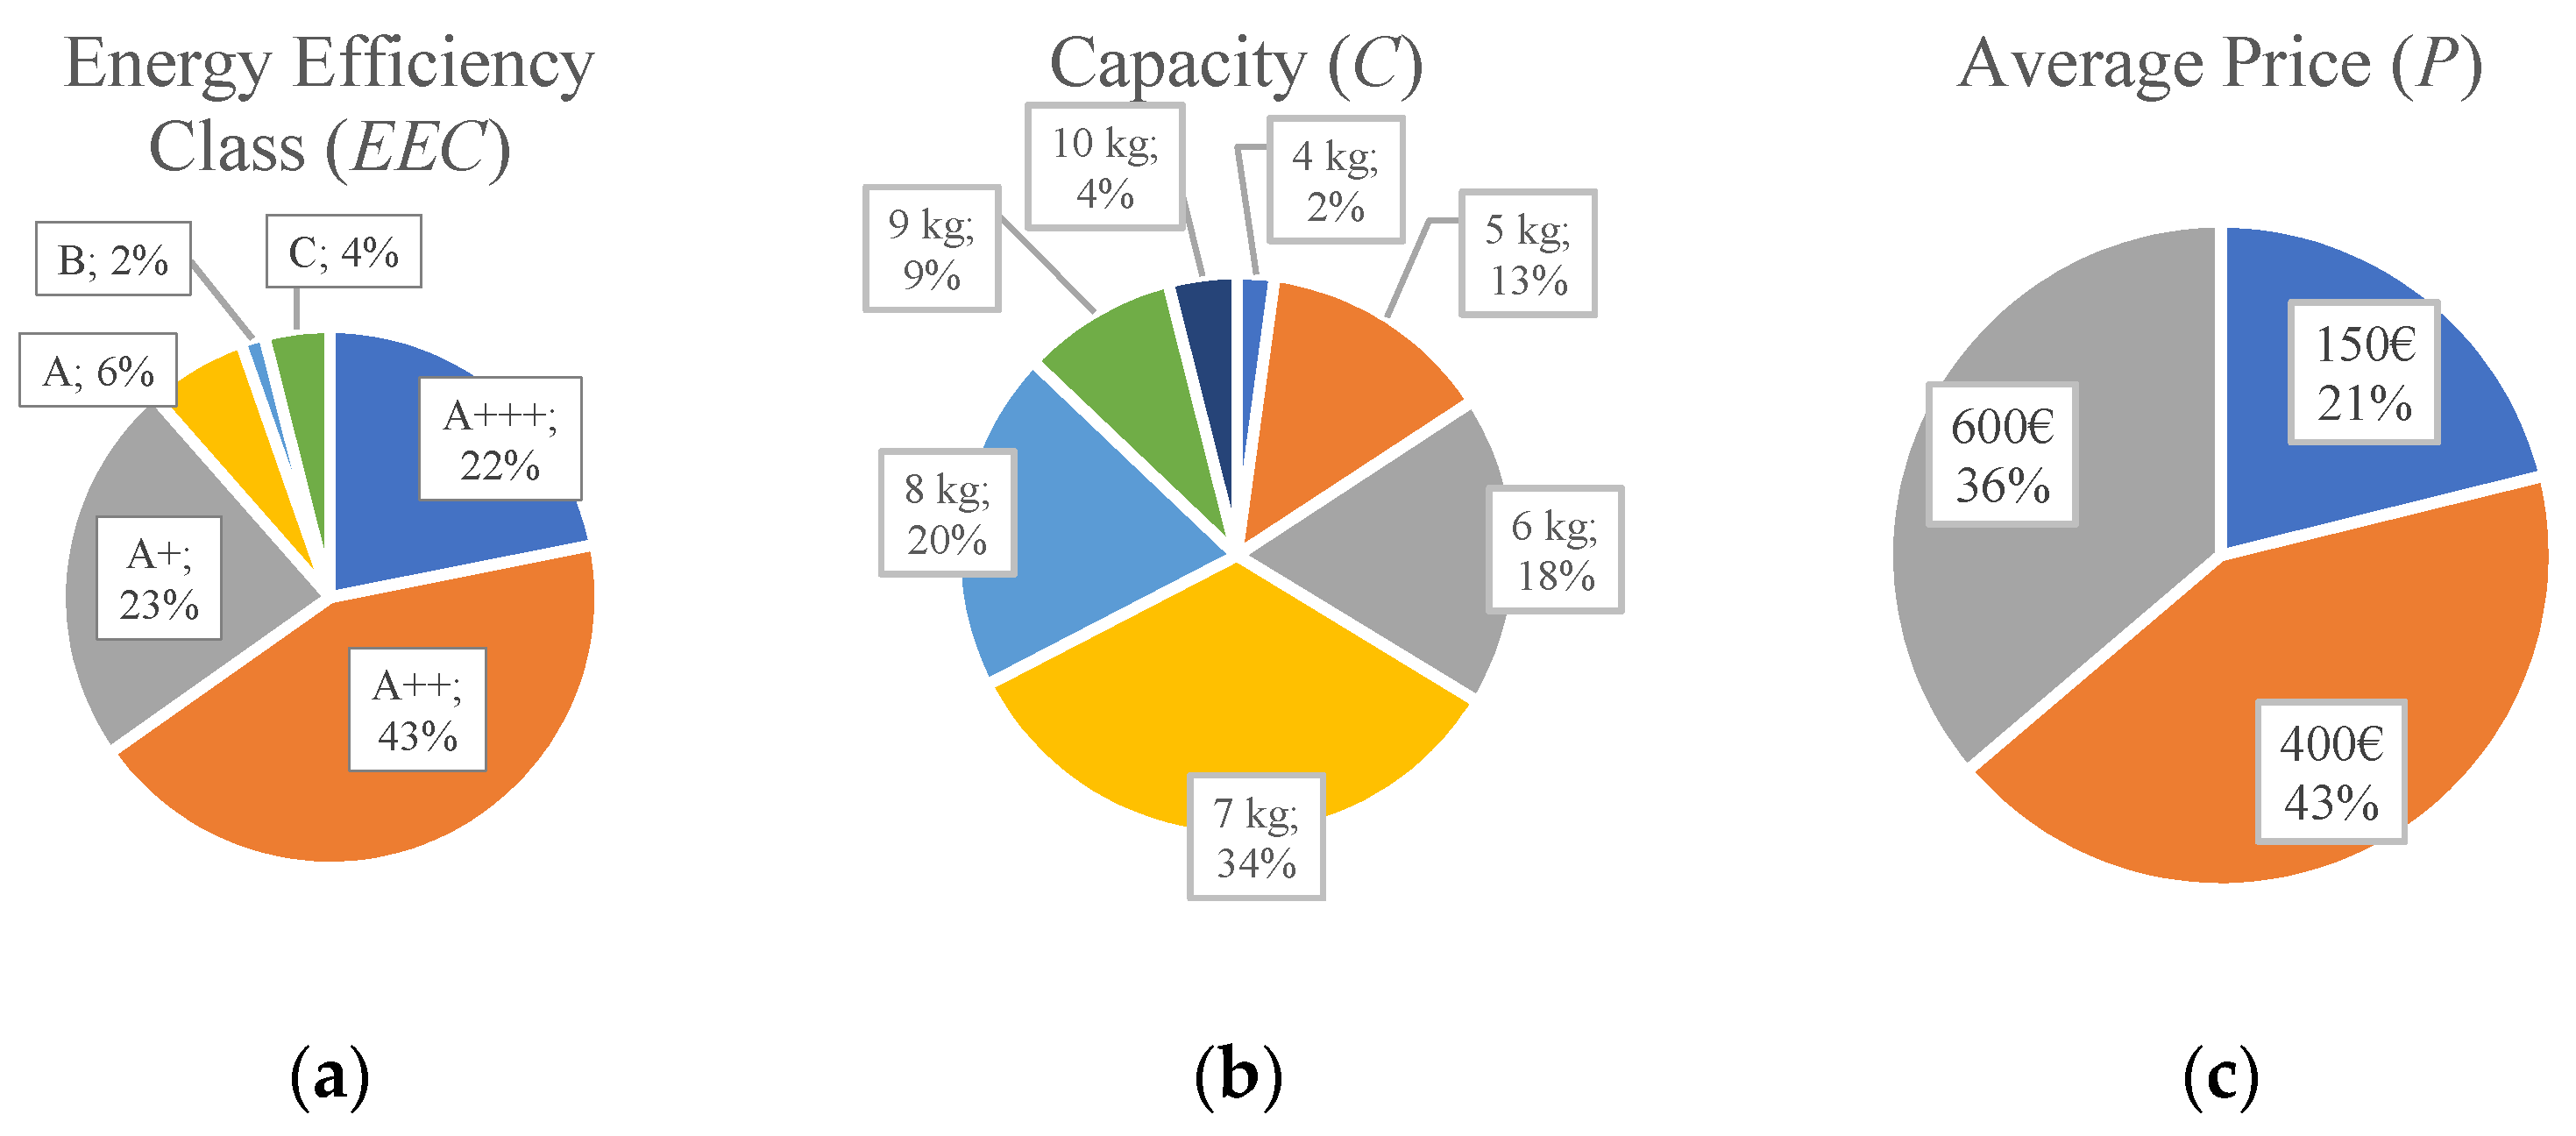
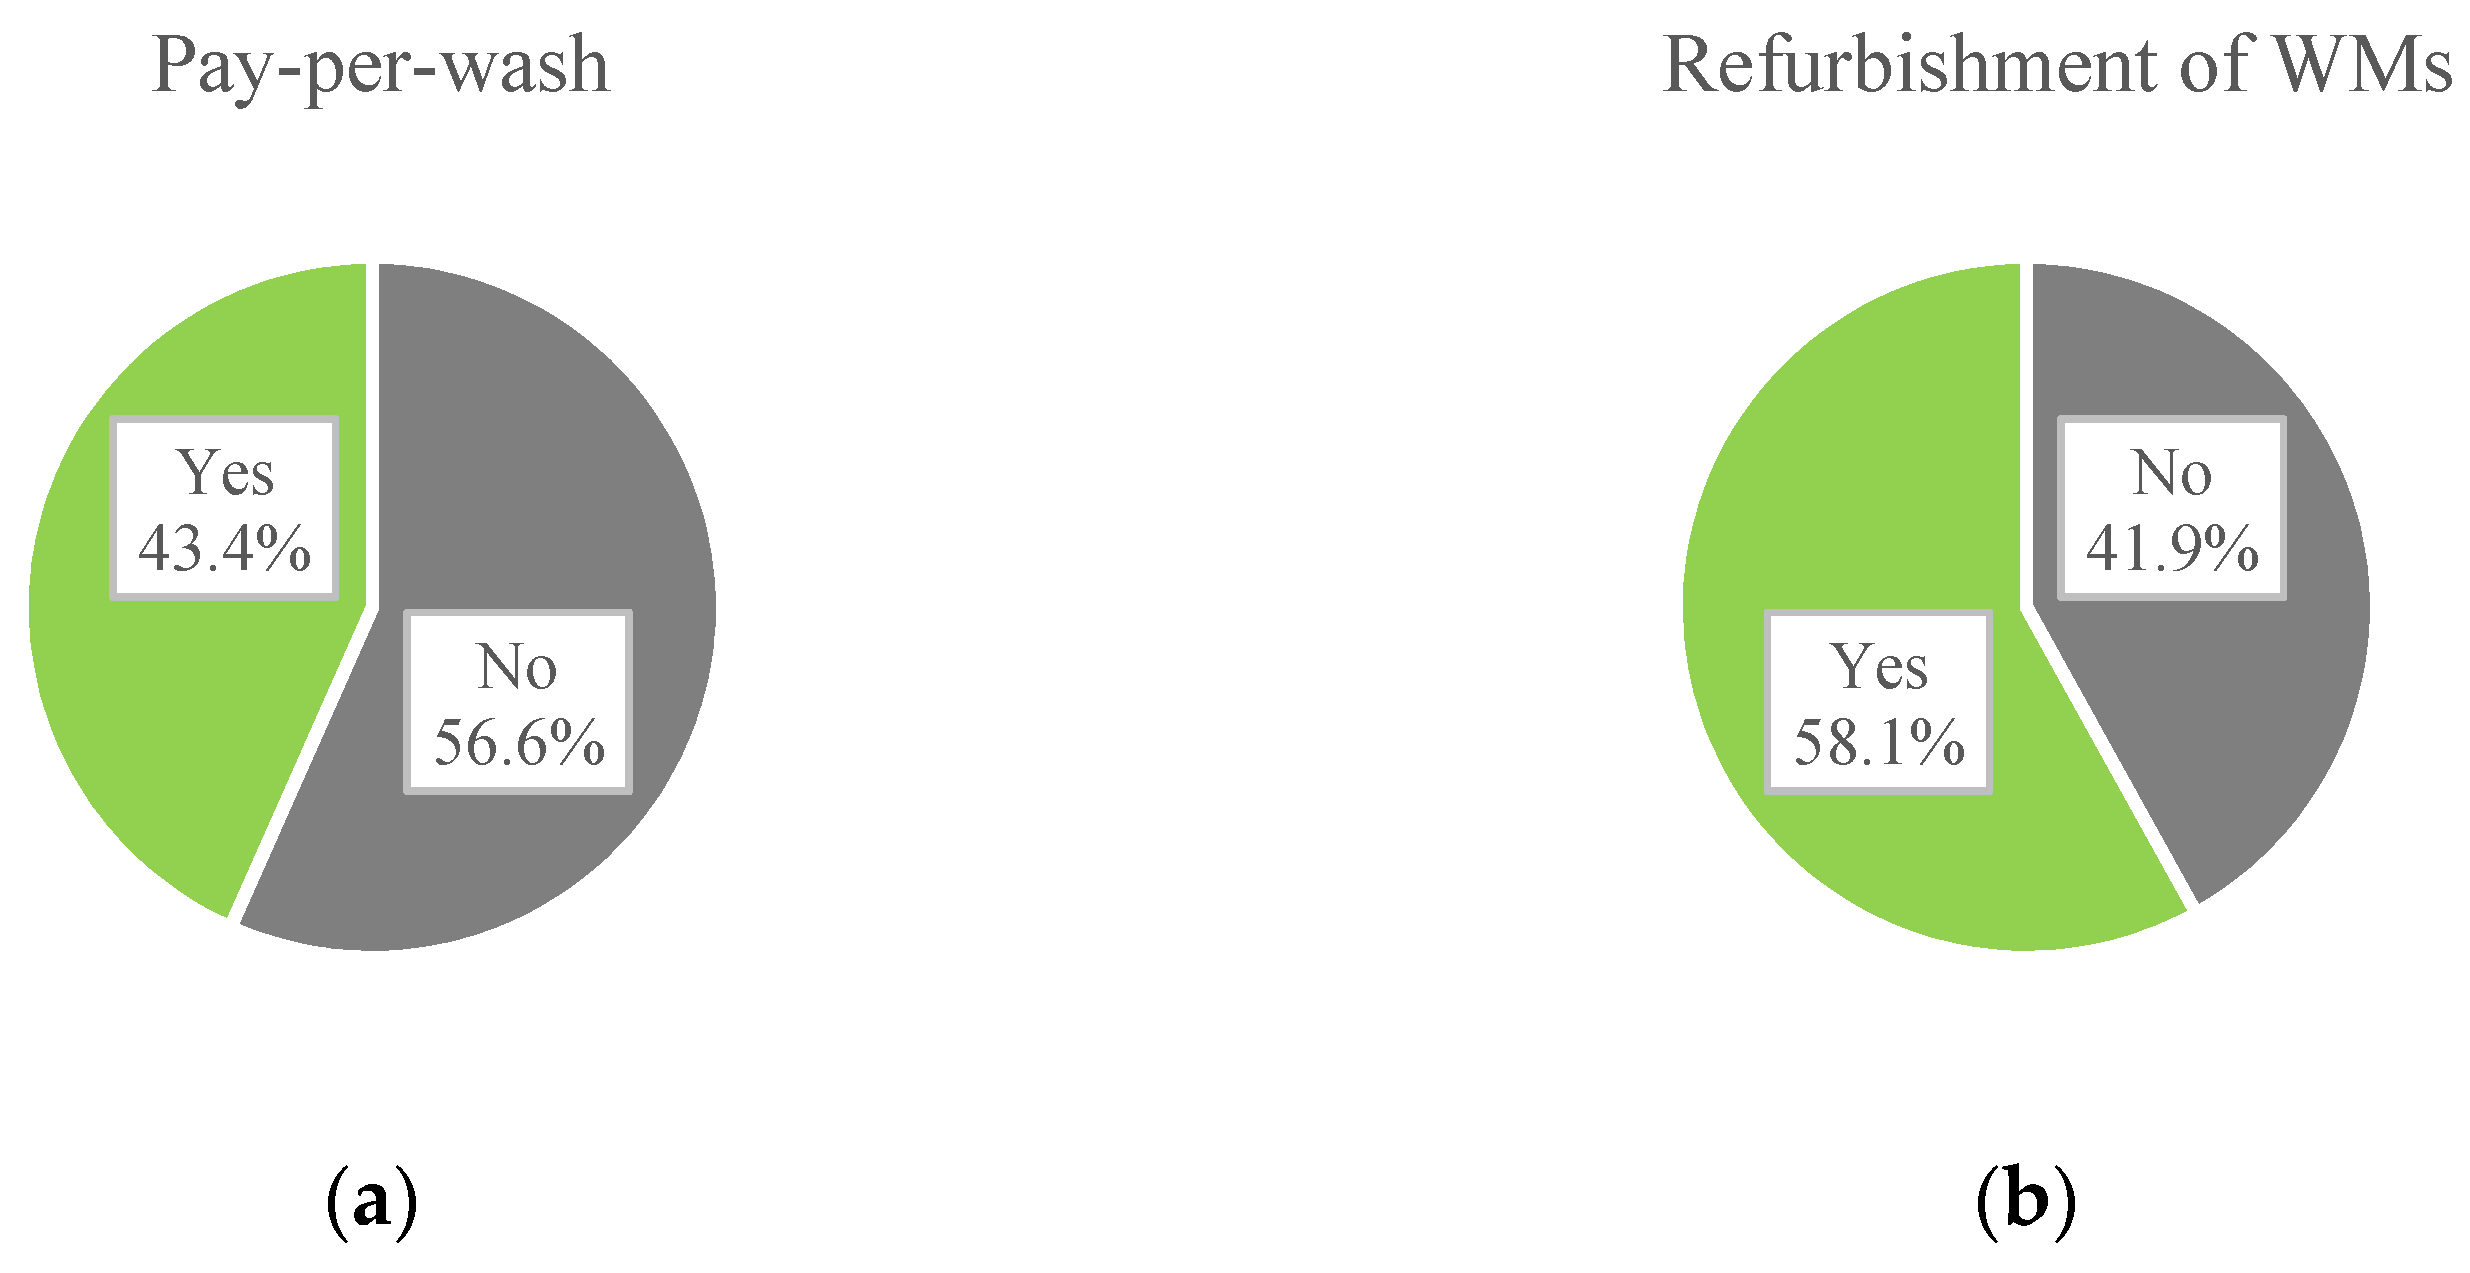
4.1. Users’ Survey Descriptive Analysis

Table 5 depicts the characteristics of the sample (n = 279), in terms of gender and age distribution. Most respondents were women (78%), while 72% of respondents were less than 50 years old. Although not representative of the entire Italian population, the sample of the survey is consistent with previous similar research [30,40,61], and large enough for its intended dual aim (feeding the evaluation model in a real environment and statistical exploration of the users’ acceptance of CE alternatives).
Figure 3 depicts the distribution of the Household Size (HS) of the sample, i.e., the number of people living in each household. Figure 4, instead, depicts the usage characteristics of the sample, in terms of frequency (FT), loading rate (LR), and number of washing cycles per year (Nwc). Lastly, Figure 5 depicts the WM characteristics in terms of EEC, capacity (C), and price (P), split into the three classes: low-, average-, and high-price.
From an environmental point of view, it is interesting to note that a large share of WMs have an EEC greater than ‘A’ (data were collected before 1 March 2021—i.e., before the new European Energy Label came into force), meaning that users keep in consideration this aspect in their purchasing decision. Moreover, the tendency to wash at low temperatures can be here confirmed, even though room for improvements still exists.

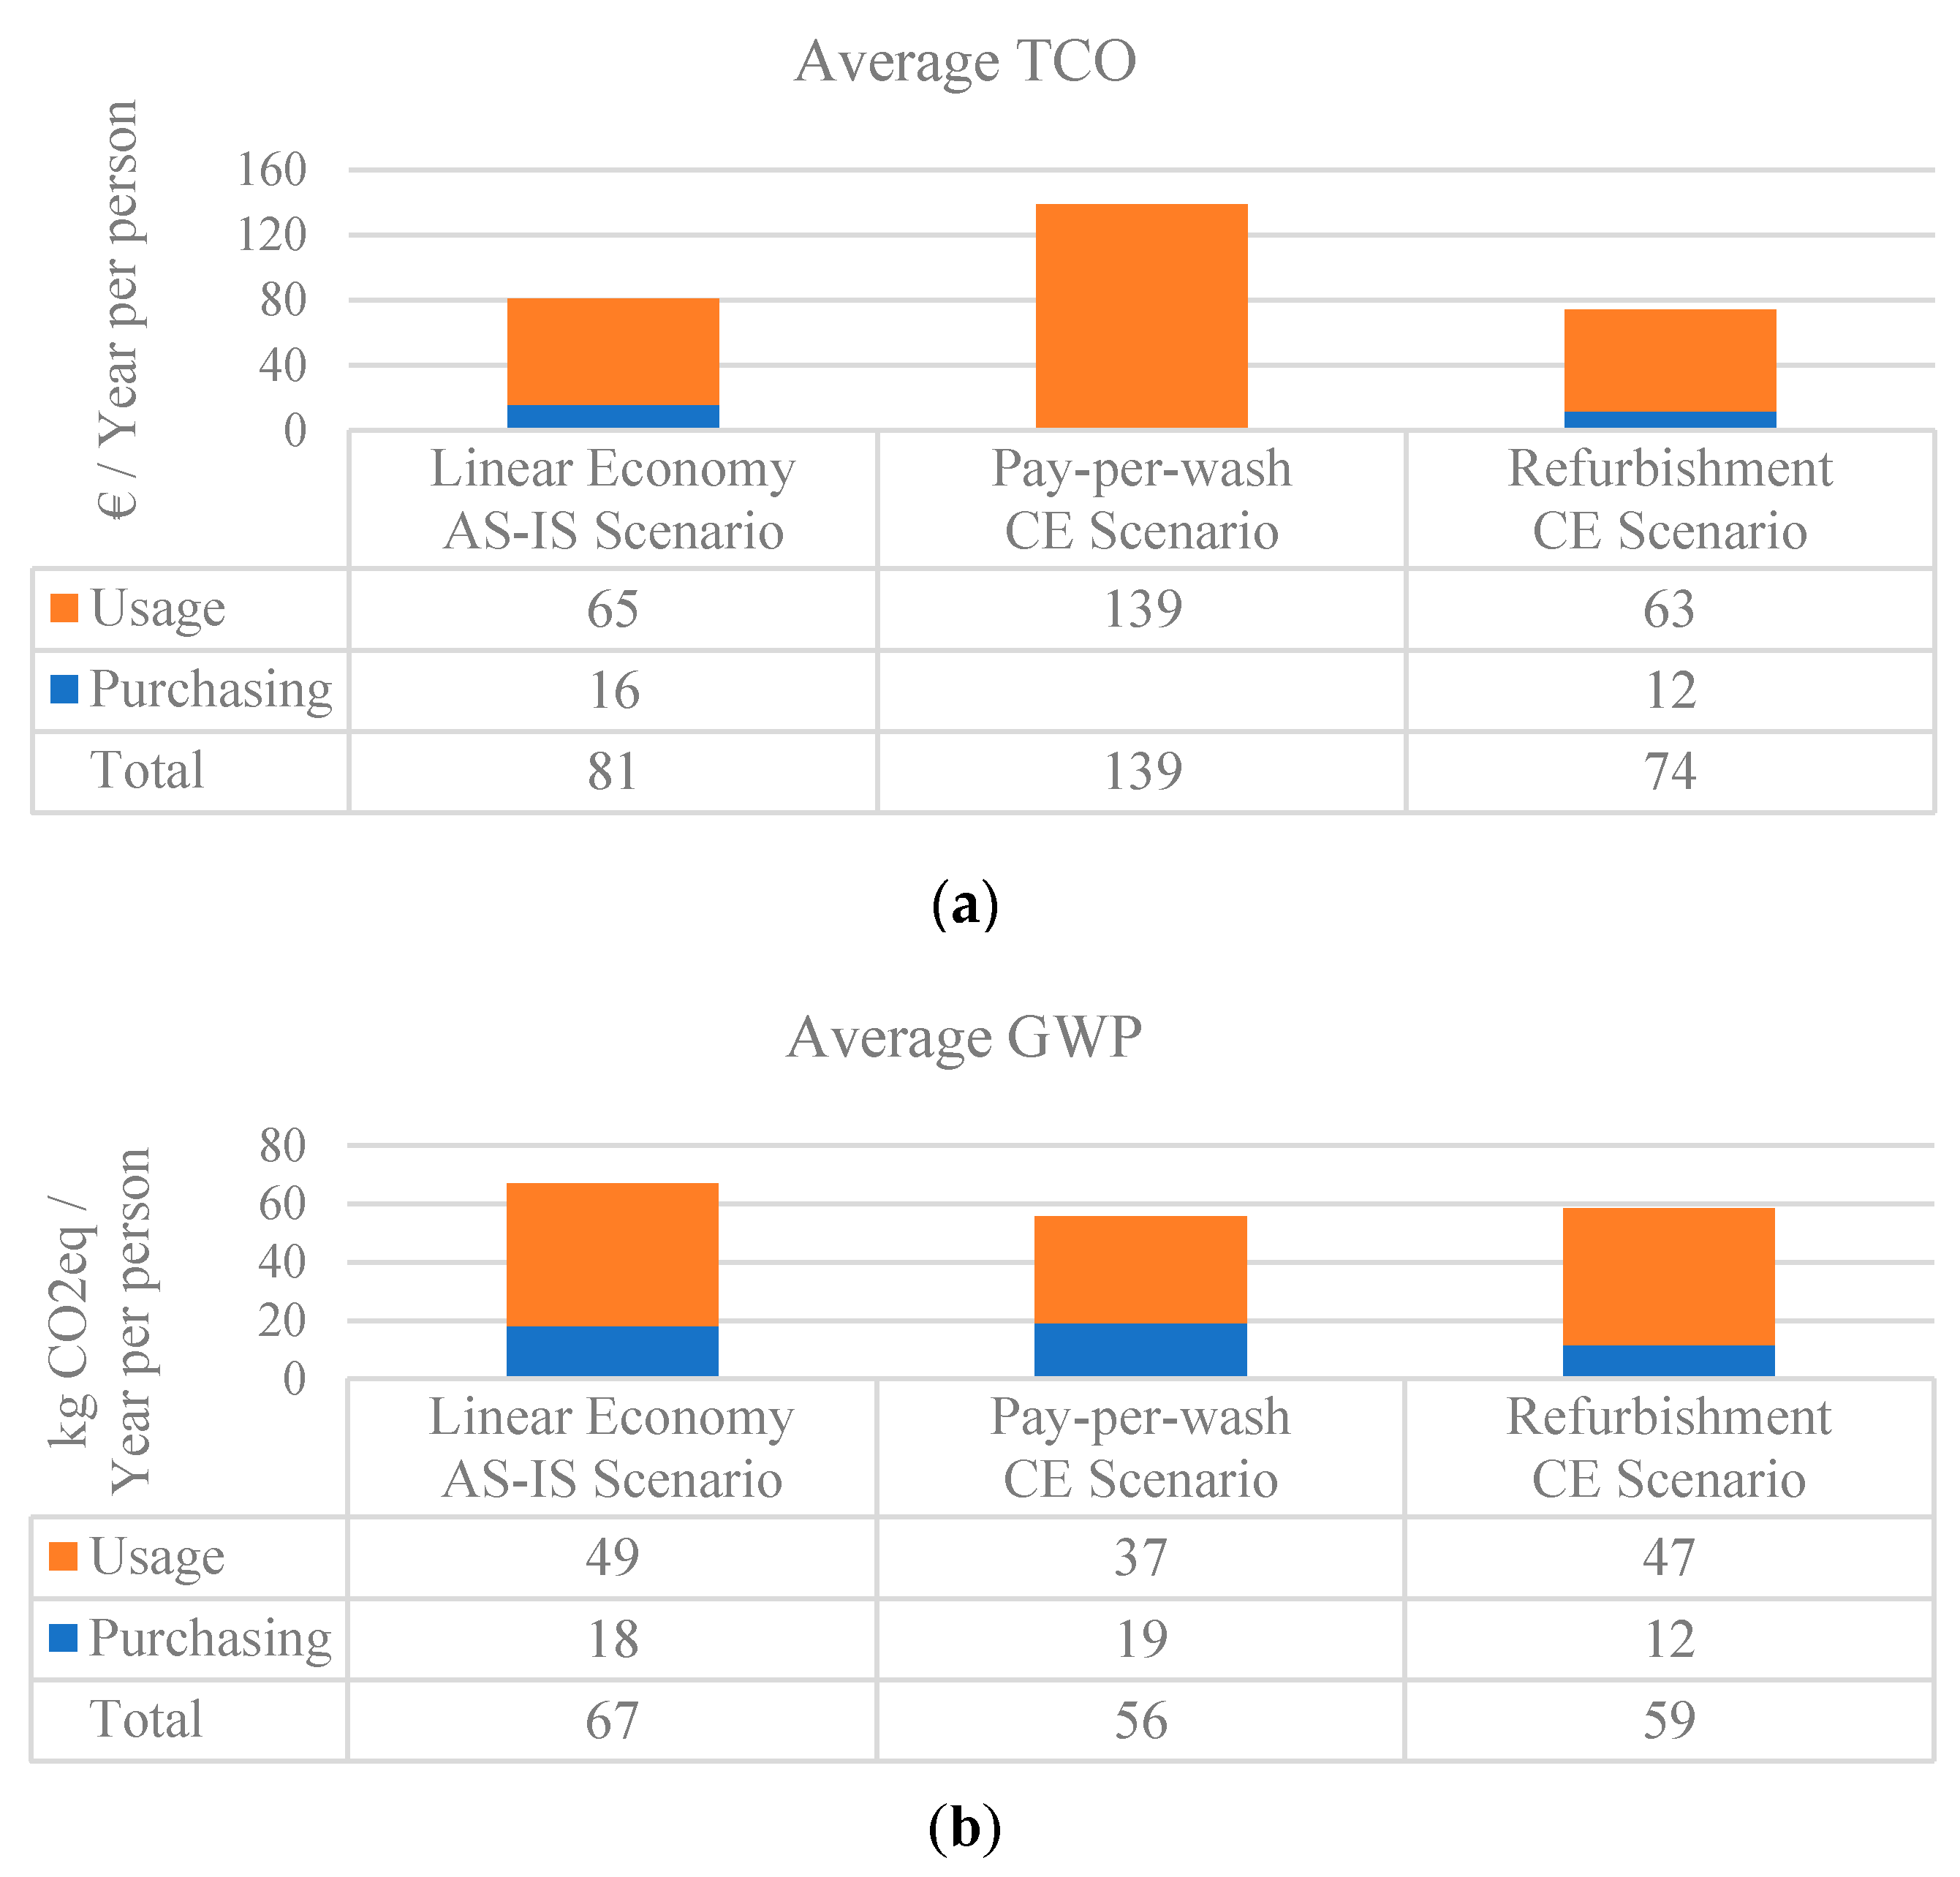
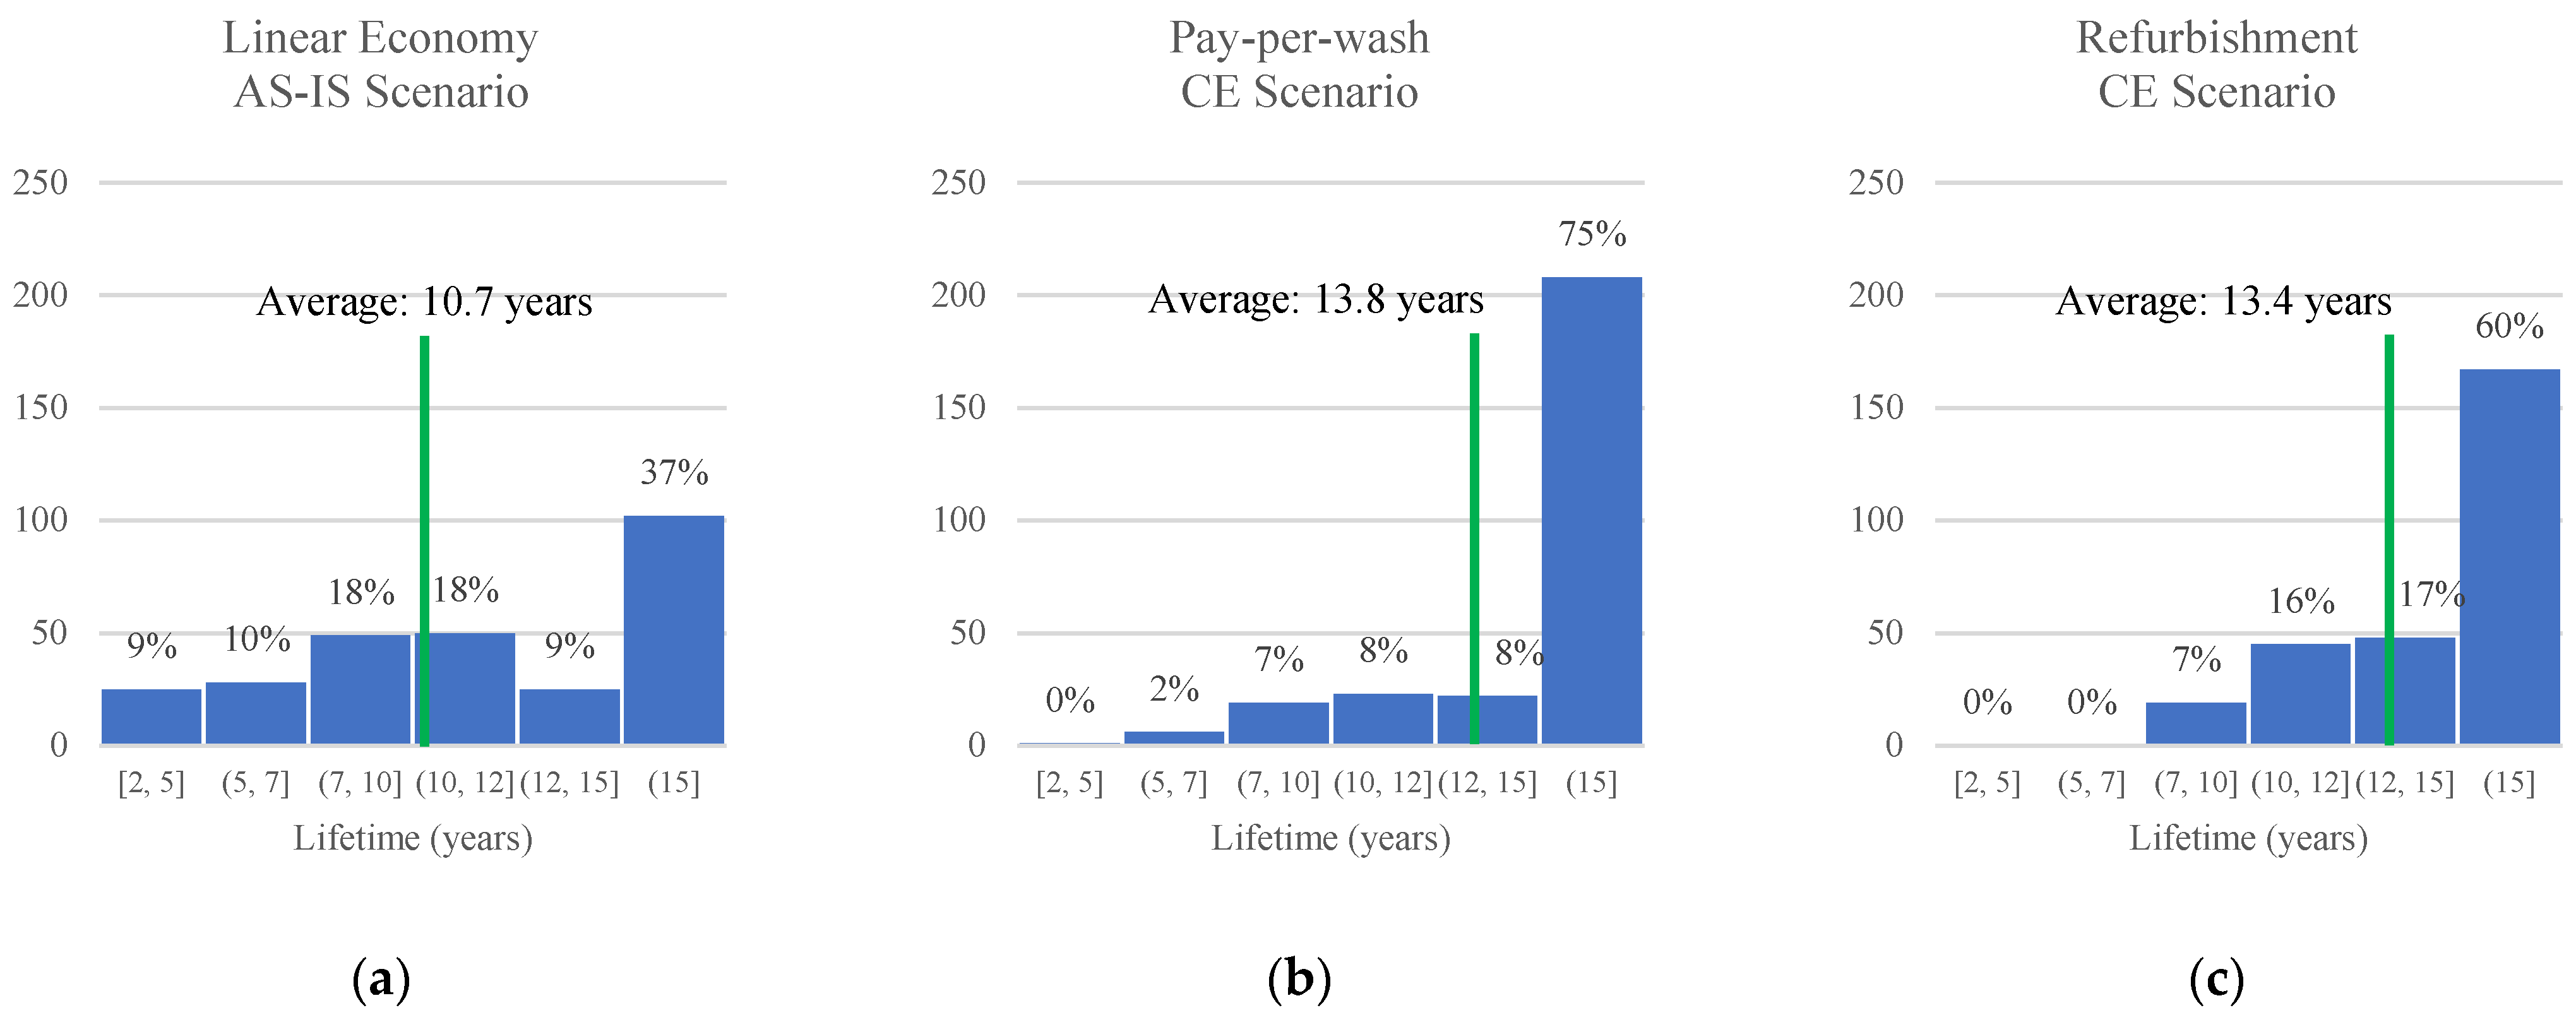
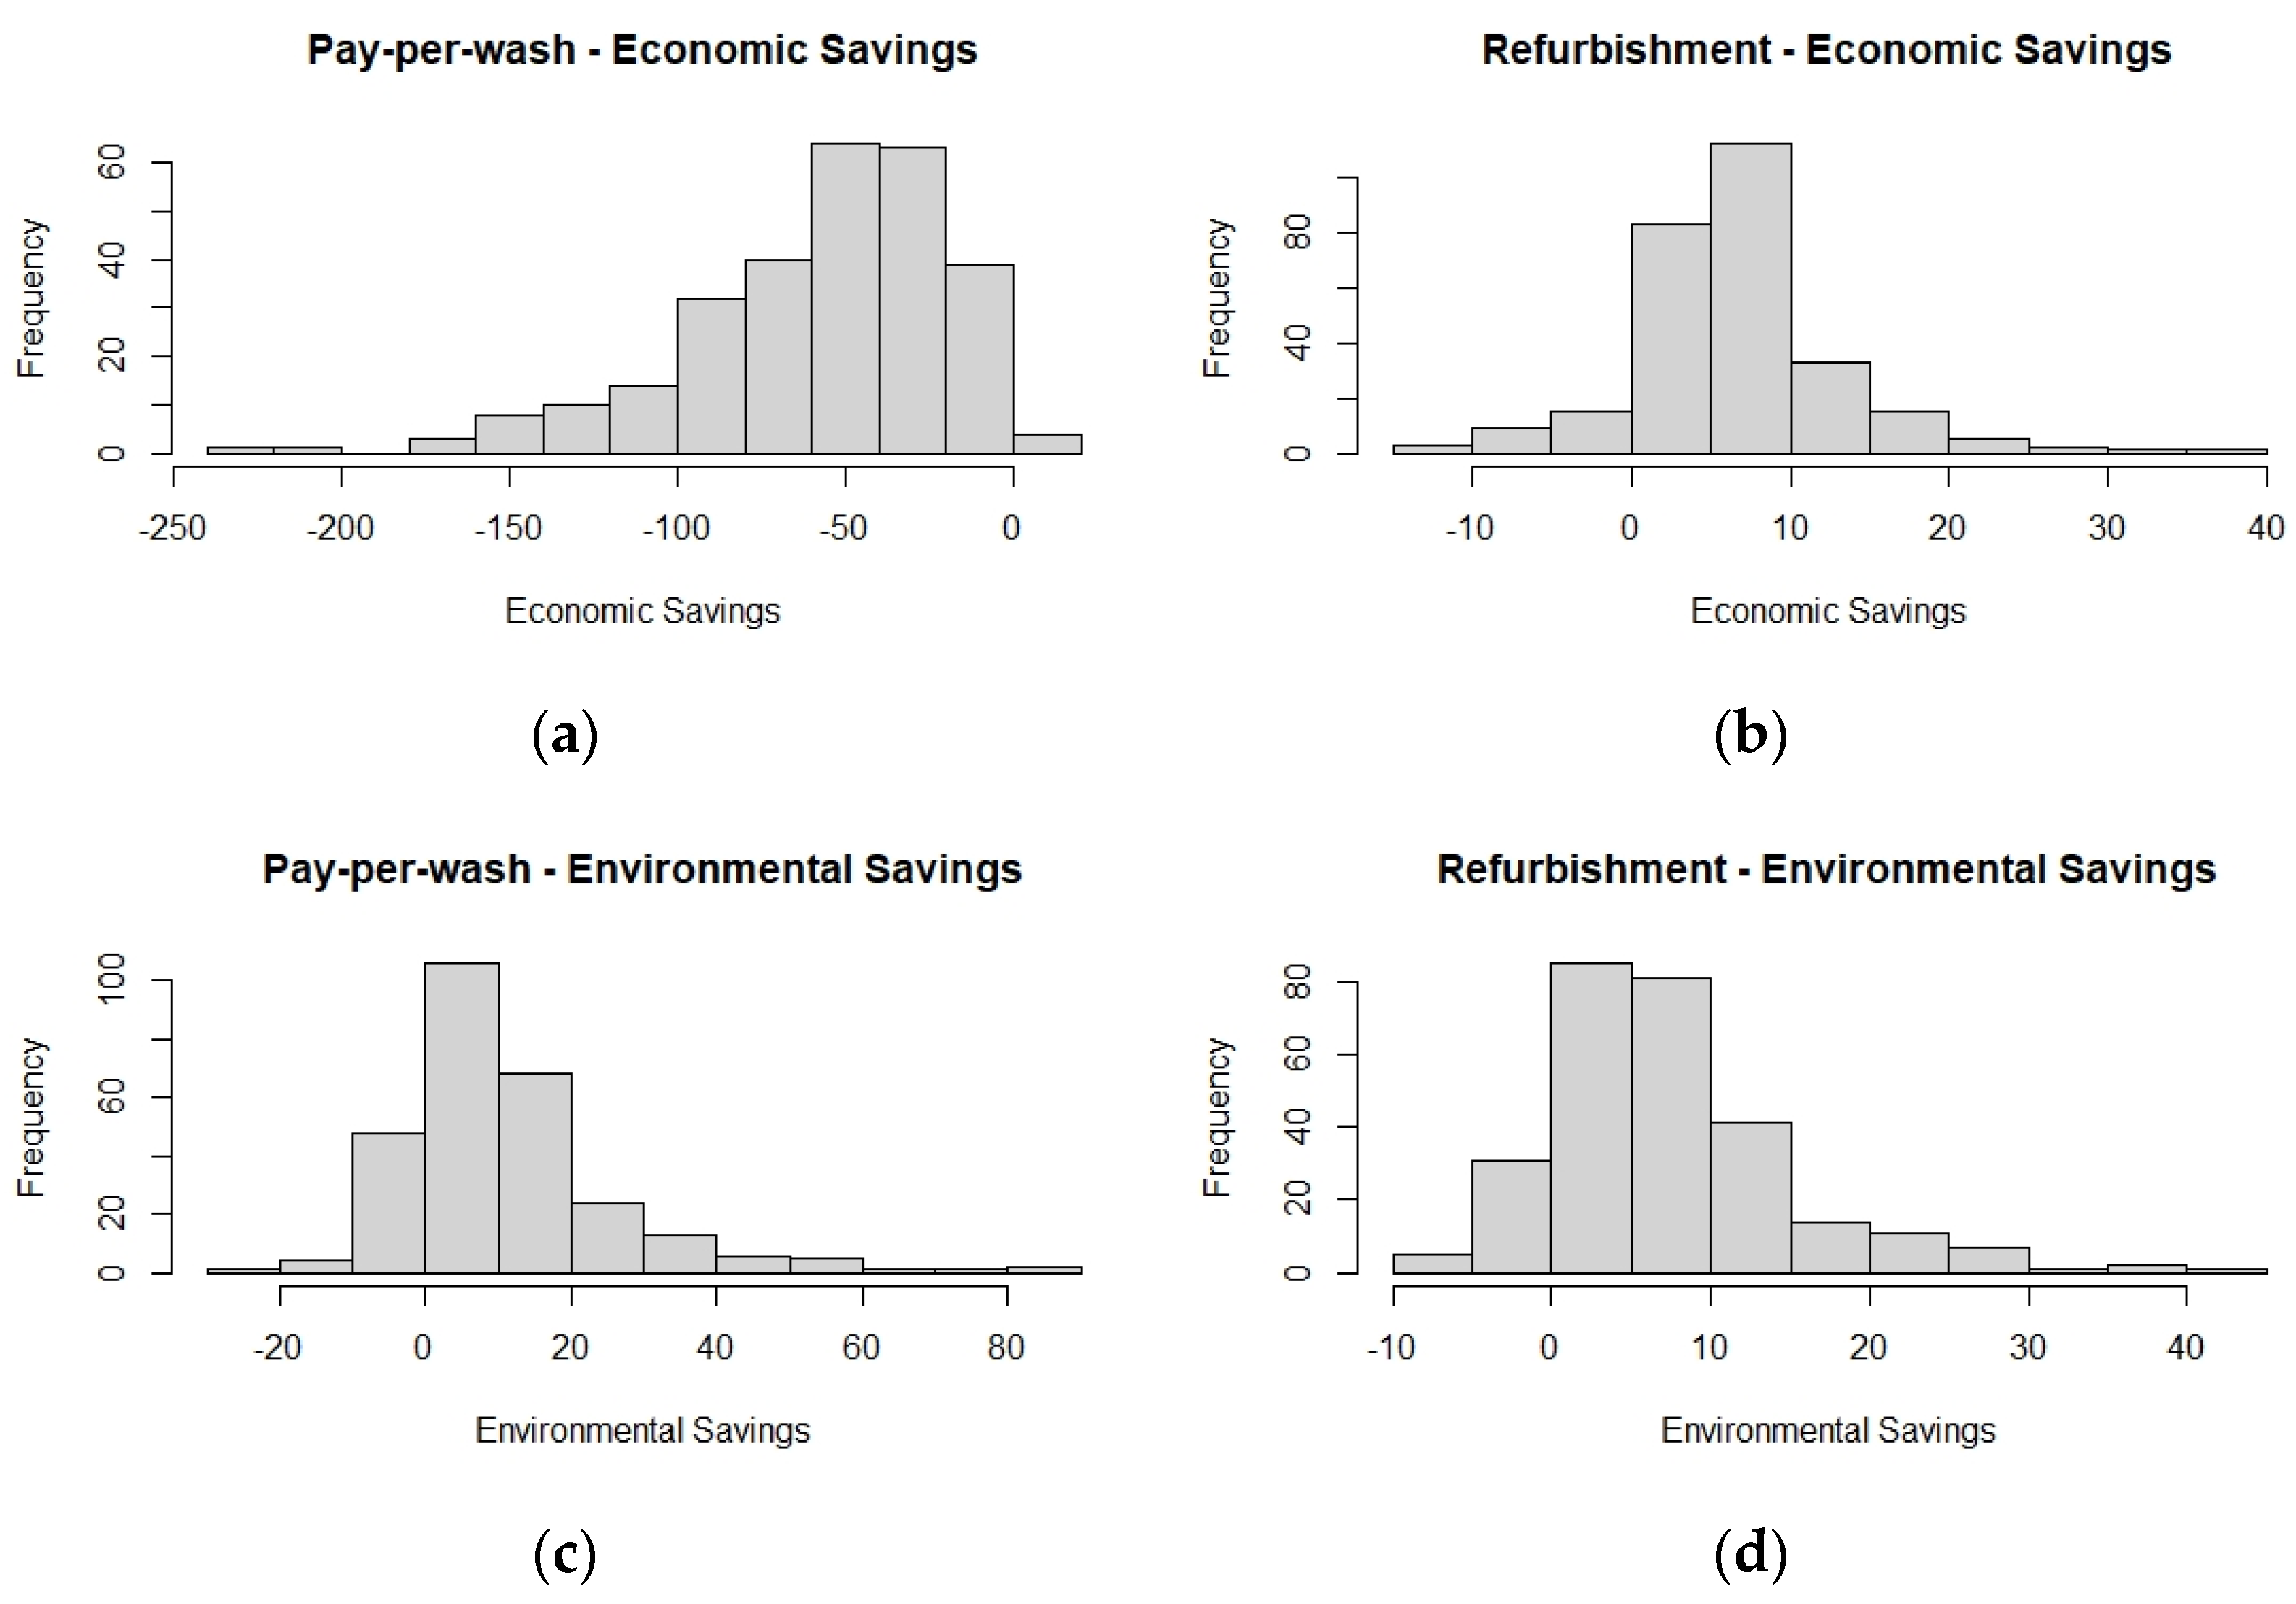
4.2. Evaluation Model Results

In this section, the results of the evaluation model fed with the data collected through the user survey are presented and discussed. An average TCO and an average GWP for each scenario is computed. To compare results from different households with different household size HS, the result for each household i has been divided by its number of components, as indicated in Equations (10) and (11), where 279 is the number of survey answers:
A v e r a g e   G W P   [ kg   CO 2 eq . year × person ] = i = 1 279 G W P i / H S i 279
A v e r a g e   T C O   [ year × person ] = i = 1 279 T C O i / H S i 279
Figure 6 depicts the results. From an economic point of view, the refurbishment of WMs allows achieving an average TCO lower than in the linear economy. As shown in the top part of Figure 6, the TCO is reduced from 81 to 74 € per person per year (−8.6%). Since the sample average HS is equal to 3.1 people, these savings amount to about 21.7 € per year per household. The refurbishment scenario is beneficial for the environment too, since it allows a reduction of about 25 kg CO2 eq. per year per household (bottom part of Figure 6, from 67 to 59 kg CO2 eq. per person per year, −11.9%). Thus, refurbishment appears therefore an effective CE solution. However, greater environmental savings can be achieved through pay-per-wash, as shown in the bottom of Figure 6: this CE business model allows reducing CO2 emissions from 67 to 56 kg CO2 eq. per person per year (−16.4%). Unfortunately, this alternative is not economically sound for the user, as shown in the upper side of Figure 6: with the assumed pay-per-wash fee, users’ costs increase from 81 to 139 € per person per year (+71.6%).
In other words, both CE alternatives allow reaching environmental savings compared to the AS-IS situation, but only the refurbishment scenario generates also economic savings for the users.
These results are compared with the lifetime distributions computed by the evaluation model per each scenario (Figure 7). While in the linear (AS-IS) scenario, the lifetime (computed through Equation (2)) is quite evenly distributed over the different time-classes (average WM lifetime equals to 10.7 years), both pay-per-wash, and refurbishment alternatives increase WM lifespan (average WM lifetimes equal to 13.8 and 13.4 years respectively, i.e., +28,9% and +25,2%). Consequently, both CE alternatives lead to a WM life extension: in the first case, lifetime is extended because pay-per-wash relies on a high-quality WM, able to perform 4000 washing cycles; in the latter, lifetime is extended because refurbishment gives a second life to WMs.
The histograms displayed in Figure 8 represent the potential eco-environmental savings that can be achieved through pay-per-wash and refurbishment for each of the 279 respondents who participated in the study. They show that pay-per-wash generates economic savings (i.e., a TCO lower than the initial situation) only in 1% of the 279 households. From an environmental point of view, pay-per-wash generates environmental savings (i.e., a GWP lower than the initial situation) in 81% of the 279 households. Refurbishment, on the other hand, performs better. In fact, it generates economic savings in 90% of cases, and environmental savings in 87%.

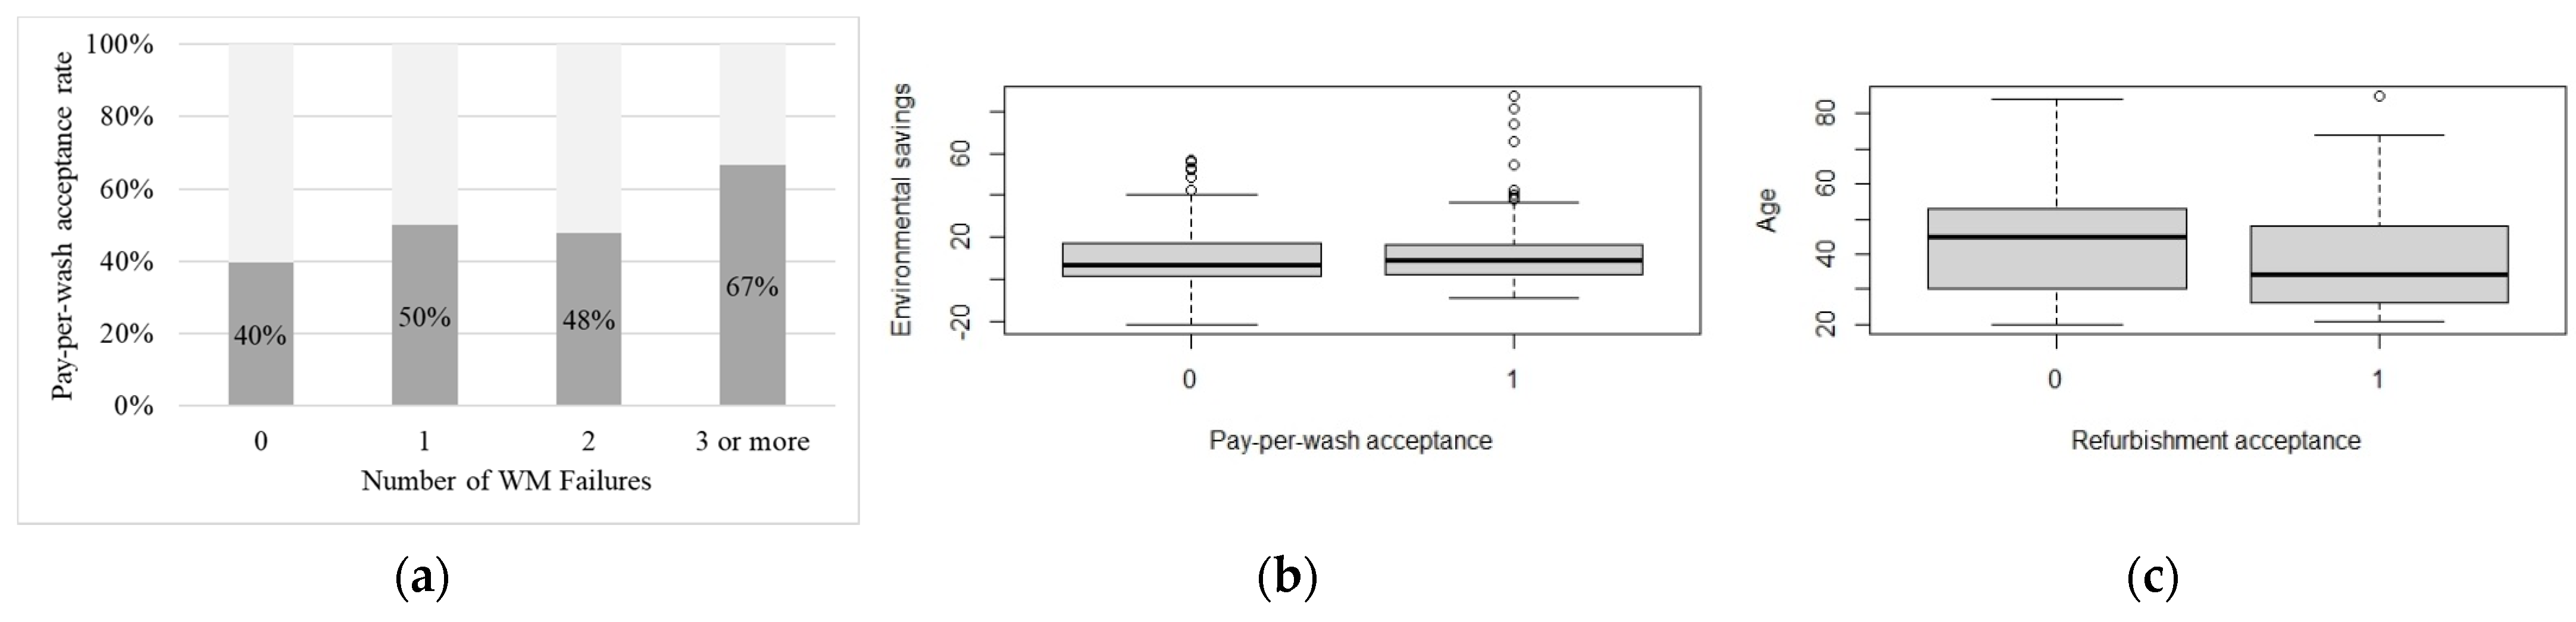
4.3. Statistical Analysis

Lastly, the previous findings have been contrasted with results about the users’ acceptance rates of the two CE alternatives, depicted in Figure 9. Unfortunately, the pay-per-wash alternative sounds interesting only for the 43.4% of respondents. The refurbishment alternative, instead, seems more promising, since more than the 58% of respondents are interested in buying a refurbished WM. A reason behind such limited interest may stand in the users’ low awareness towards CE and its environmental implications [18].
Through the conceptual framework of Figure 1, we have hypothesized that several parameters (age, household size, WM efficiency class, WM capacity, number of washing cycles, WM loading rate, washing temperature, WM failures, TCO, GWP, economic savings, and environmental savings) may affect pay-per-wash and refurbishment acceptance rates (PPWacc and RFBacc). Therefore, we regressed PPWacc (glm(formula = PPWacc ~ Age + HS + EEC + C + Nwc + LR + FT + NFailure + TCO + GWP + Eco_Sav_Ppw + Env_Sav_Ppw, family = binomial)) and RFBacc (glm(formula = RFBacc ~ Age + HS + EEC + C + Nwc + LR + FT + NFailure + TCO + GWP + Eco_Sav_Rfb + Env_Sav_Rfb, family = binomial)) for each parameter by using the logistic regression on the RStudio statistical software package.
For pay-per-wash (Table 6), the logistic regression analysis shows that the number of failures experienced by WM owners significantly influences their attitude towards pay-per-wash (coefficient = 0.293393, p-value = 0.0424 < 0.05). The positive coefficient means that the more WM failure experienced in the past by households, the higher is the customers’ propensity to accept a pay-per-wash business model. This can be explained by the fact that, in pay-per-wash business models, the provider keeps the WM ownership and is liable of maintenance and repair of the WM. In addition, the logistic regression analysis shows that the potential environmental savings generated by pay-per-wash significantly influences customers’ attitude towards pay-per-wash (coefficient = 0.05152, p-value = 0.0442 < 0.0500). The positive coefficient means that users with higher potential environmental savings (i.e., with a potential GWP lower than in the initial situation) are more interested in pay-per-wash business models.
For refurbishment (Table 7), the logistic regression analysis shows that users’ age significantly influences customers’ attitude towards refurbishment (coefficient = −0.030878, p-value = 0.000661 < 0.05). The negative coefficient means that the acceptance rates towards refurbishment decrease when the age of respondents increases.
These effects are depicted in Figure 10.
These findings thus support our hypotheses H8-PPW, H10-PPW, and H1-RFB. The other hypotheses are rejected.

5. Discussion

5.1. RQ1: Can Pay-Per-Wash and Refurbishment Business Models Improve the Economic and Environmental Performances, Compared to the Traditional Linear Model?

As shown in the previous section, we addressed this question for a specific product, the WM, and in real-world situations, collecting information about WM features and usage behavior of a sample of 279 respondents and their households. The results confirmed literature statements about the environmental benefits of the two CE alternatives (pay-per-wash and refurbishment). Significant benefits have been found on average, but also for the single users, with environmental gains for the large majority of the real cases investigated (over 80% for both scenarios). On the other hand, an economic improvement for the user is achieved only with the refurbishment scenario (on average, and in 90% of user cases), while pay-per-wash is associated to an increase in the household yearly cost.
In addition, pay-per-wash and refurbishment business models have been suggested as strategies to extend the useful life of products [35]. Our data confirm that both alternatives considerably increase WM lifespan (from an average WM lifetime of 10.7 years to 13.8 and 13.4 respectively), therefore contributing to reaching CE objectives. The relevance of these results is twofold. First, though most of the literature assumes that product-service systems in general, and use-oriented business models such as pay-per-use in particular, lead to environmental benefits, it has been pointed out that this is not true by definition [10]. Our results provide quantitative support to this claim and confirm that use-oriented business models may be environmentally effective for products that are durable, quite expensive, technically advanced, requiring maintenance and repair, with low usage frequency, and not heavily influenced by fashion [62]. More specifically, our study contributes to knowledge accumulation on the topic, since while a number of studies involved WMs, most of them did not provide quantitative environmental analyses, and even fewer based them on real consumers data (such as [29,30], and other studies mentioned in [63]). The same is found by this study on the role of refurbishment, which already received considerable attention in the literature as a circular economy strategy [22,64,65], and also specifically for WMs [66]. While several studies focused on product design [9,67], however, our study considers the potential of the current WM installed base to be cost- and environmentally effective with a refurbishment business model.
Therefore, this paper contributes in providing statistical evidence to support endeavors towards environmental-effective alternatives to the linear economy.

5.2. RQ2: Are Users Interested in Pay-Per-Wash and Refurbishment Business Models, and What Aspects Mainly Influence Their Acceptance?

Customers are key in the effective adoption of alternatives to linear business models for two main reasons: first, customer behavior affects the sustainability impact of pay-per-wash and refurbishment models [29,35,39], and second, to achieve environmental benefits on a large scale, these models require a high level of acceptance by customers, in order to reach a widespread diffusion. Obstacles to the adoption of circular and use oriented business models are well known in conceptual terms, and well summarized for instance in [10,68]. As well, factors such as fashion changes and willingness to pay may hamper the adoption of refurbishment and, more generally re-use business models [18,69].
A rather low degree of acceptance has been observed in previous studies. Our survey results confirm a limited acceptance of pay-per-wash and refurbishment alternatives, although the observed rates (58% of the sample is interested in purchasing refurbished WMs, and 43% in pay-per-wash) also show a significant potential for these businesses to scale up to aggregate business and environmental relevance.
In our study, we also analyzed the relationship among customers’ characteristics and behaviors, product features, and the declared acceptance rate of pay-per-wash and refurbishment. Users’ acceptance factors have been analyzed in other studies about consumer electronics [69] and WM alike, especially for leasing and sharing models [25,29,35], but a compelling picture has not been set to date.
Concerning pay-per-wash, we found that no customer characteristics (such as gender, age, or household size) influence the acceptance rate, in line with findings from [35]. Instead, the number of failures experienced with the current appliance influence the interest of consumer to shift to pay-per-use. This finding supports claims from previous literature: according to [29], when deciding between purchasing and renting, consumers highly value options such as free maintenance and warranty. More generally, customers having experienced the cost and hassles caused by failures attach more value to the transfer of operational risks and maintenance to the provider of servitized offerings [39,70]. A second significant factor that influences the acceptance rate is the actual environmental benefits that can be achieved by the circular alternative to WM ownership. Servitized business models do not automatically bring about environmental benefits [71], although they transfer the responsibility of product maintenance and end-of-life management to providers, and allow consumers to upgrade to more energy-efficient products [14]. Our study suggests that customers perceive that pay-per-wash is a more relevant option the more it can bring environmental benefits. On the other hand, users seem to have limited perception about the increase in the average yearly cost they may incur.
When investigating factors influencing the acceptance rate of refurbishment, we find only one significant aspect: the age of respondents. This finding confirms that younger generations are more environmentally conscious and more interested in circular, re-use oriented alternatives to traditional business models [29,35].
This picture also provides some managerial implications for the provider side of circular business models. When offering pay-per-wash schemes, suppliers should emphasize the information on the environmental benefits of this alternative, which is not familiar to all potential customers, and that with such models they take over the responsibility and costs for maintenance activities and ensure up-to-date products to end users at no additional cost. On the other hand, providers of refurbished products should target younger consumers, who are less affected by a bias against “second hand” goods. In addition, they should develop specific communication activities targeting older consumers to emphasize the benefits of this model and improve the image of refurbished products against fashion-change worries.

6. Conclusions

This study has investigated the economic and environmental potential of CE alternatives to the traditional linear business model in the WM sector. An evaluation model to compare the TCO and the GWP of two CE scenarios (pay-per-wash and refurbishment) with the traditional scenario has been developed. A user survey was designed to collect data, feed the model and to investigate the acceptance rate of such CE alternatives.
Results show that both the CE alternatives investigated allow reaching environmental savings compared to the linear situation, but only the refurbishment scenario generates also economic savings for the average user. However, pay-per-wash allows achieving greater environmental gains compared to refurbishment. Thus, combining pay-per-wash offerings with refurbishment seems to be a potential hotspot for the advancement of CE. Unfortunately, only 43% of surveyed users declared interest and positive acceptance of the pay-per-wash scheme. Even though this share increases to 58% in the case of refurbishment, more emphasis should be put on customer awareness and engagement. We found that the WM failures experienced by the users and the relevance of the environmental gains achievable influence the acceptance rate of pay-per-wash models, while user age has been found as a significant factor influencing the interest towards a refurbishment model.
To date, few studies have tried to quantify the economic and environmental potential of CE alternatives utilizing real user data. Few studies have also adopted the user perspective to assess their attitude towards the acceptance of CE alternatives. Even though some works have been conducted in the WM industry [25,39], the quantification of the economic and environmental potential of CE alternatives and the users’ interest in adopting these solutions is quite overlooked. This work attempts to shed more light on this aspect, at least for the WM case. The model, although built around the WM industry, can be also easily extended to other energy-consuming products.
This study also has practical implications. The findings contribute to reducing the uncertainties regarding the eco-environmental potential of CE alternatives, shedding light also on the users’ acceptance rate of these solutions. Thus, practitioners in the WM industry may use these results to design an effective CE solution and for their marketing strategies. When offering pay-per-wash schemes, suppliers should emphasize the information on the environmental benefits of this alternative, which is not familiar to all potential customers, and also the fact that with such models they take over the responsibility and costs for maintenance activities and ensure up-to-date products to end users at no additional cost. On the other hand, providers of refurbished products should target younger consumers, who are less affected by a bias against “second hand” goods. In addition, they should develop specific communication activities targeting older consumers to emphasize the benefits of this model and improve the image of refurbished products against fashion-change worries.
Finally, this study has some limitations. In the LCA evaluation model, an assumption was made (see Table 4), that the environmental impact of manufacturing a WM can be modeled based on its price category. Moreover, the end of life phase of the WM has not been fully considered in the evaluation model. Regarding the generalizability of results, Figure 6 only compares average TCO and GWP values, computed using average parameters taken from real-world cases (as in the case of the pay-per-wash fee). However, sensitivity analyses would add value to the research and provide insights to practitioners, e.g., on how to design a suitable pay-per-wash fee. Consequently, future research should aim to a greater generalization of the model and results, as a way to overcome these limitations.

Author Contributions

Conceptualization, G.B.; methodology, G.B.; validation, G.B. and N.S.; formal analysis, G.B.; investigation, G.B.; data curation, G.B.; writing—original draft preparation, G.B.; writing—review and editing, N.S.; visualization, G.B.; supervision, G.B., N.S. and M.P. All authors have read and agreed to the published version of the manuscript.

Funding

This research received no external funding.

Institutional Review Board Statement

Not applicable.

Informed Consent Statement

Informed consent was obtained from all subjects involved in the study.

Data Availability Statement

Data of the study are available upon request.

Acknowledgments

The authors wish to thank Adriano Mori and Mattia Alberti for their contribution to this research. The authors would also like to thank Gulliver s.r.l. for their contribution in the development of the mobile app.

Conflicts of Interest

The authors declare no conflict of interest.

References

  1. Merli, R.; Preziosi, M.; Acampora, A. How do scholars approach the circular economy? A systematic literature review. J. Clean. Prod. 2018, 178, 703–722. [Google Scholar] [CrossRef]
  2. Hofmann, F. Circular Business Models: Business approach as driver or obstructer of sustainability transitions? J. Clean. Prod. 2019, 224, 361–374. [Google Scholar] [CrossRef]
  3. Ghisellini, P.; Cialani, C.; Ulgiati, S. A review on circular economy: The expected transition to a balanced interplay of environmental and economic systems. J. Clean. Prod. 2016, 114, 11–32. [Google Scholar] [CrossRef]
  4. Nikolaou, I.E.; Tsagarakis, K.P. An introduction to circular economy and sustainability: Some existing lessons and future directions. Sustain. Prod. Consum. 2021, 28, 600–609. [Google Scholar] [CrossRef]
  5. Bressanelli, G.; Visintin, F.; Saccani, N. Circular Economy and the evolution of industrial districts: A supply chain perspective. Int. J. Prod. Econ. 2022, 243, 108348. [Google Scholar] [CrossRef]
  6. Ellen MacArthur Foundation. Towards a Circular Economy—Economic and Business Rationale for an Accelerated Transition. 2012. Available online: https://ellenmacarthurfoundation.org/towards-the-circular-economy-vol-1-an-economic-and-business-rationale-for-an (accessed on 1 October 2021).
  7. Bressanelli, G.; Pigosso, D.C.A.; Saccani, N.; Perona, M. Enablers, levers and benefits of Circular Economy in the Electrical and Electronic Equipment supply chain: A literature review. J. Clean. Prod. 2021, 298, 126819. [Google Scholar] [CrossRef]
  8. Khan, M.A.; Mittal, S.; West, S.; Wuest, T. Review on upgradability—A product lifetime extension strategy in the context of product service systems. J. Clean. Prod. 2018, 204, 1154–1168. [Google Scholar] [CrossRef]
  9. Bovea, M.D.; Pérez-Belis, V. Identifying design guidelines to meet the circular economy principles: A case study on electric and electronic equipment. J. Environ. Manag. 2018, 228, 483–494. [Google Scholar] [CrossRef]
  10. Tukker, A. Product services for a resource-efficient and circular economy—A review. J. Clean. Prod. 2015, 97, 76–91. [Google Scholar] [CrossRef]
  11. Batista, L.; Bourlakis, M.; Smart, P.; Maull, R. In search of a circular supply chain archetype—A content-analysis-based literature review. Prod. Plan. Control 2018, 29, 438–451. [Google Scholar] [CrossRef]
  12. De Angelis, R.; Howard, M.; Miemczyk, J. Supply chain management and the circular economy: Towards the circular supply chain. Prod. Plan. Control 2018, 29, 425–437. [Google Scholar] [CrossRef] [Green Version]
  13. Lüdeke-Freund, F.; Gold, S.; Bocken, N.M.P. A Review and Typology of Circular Economy Business Model Patterns. J. Ind. Ecol. 2018, 23, 36–61. [Google Scholar] [CrossRef] [Green Version]
  14. Bressanelli, G.; Adrodegari, F.; Perona, M.; Saccani, N. Exploring How Usage-Focused Business Models Enable Circular Economy through Digital Technologies. Sustainability 2018, 10, 639. [Google Scholar] [CrossRef] [Green Version]
  15. Nascimento, D.L.M.; Alencastro, V.; Quelhas, O.L.G.; Caiado, R.G.G.; Garza-Reyes, J.A.; Rocha-Lona, L.; Tortorella, G. Exploring Industry 4.0 technologies to enable circular economy practices in a manufacturing context. J. Manuf. Technol. Manag. 2019, 30, 607–627. [Google Scholar] [CrossRef]
  16. Alcayaga, A.; Wiener, M.; Hansen, E.G. Towards a framework of smart-circular systems: An integrative literature review. J. Clean. Prod. 2019, 221, 622–634. [Google Scholar] [CrossRef]
  17. Okorie, O.; Salonitis, K.; Charnley, F.; Moreno, M.; Turner, C.; Tiwari, A. Digitisation and the Circular Economy: A Review of Current Research and Future Trends. Energies 2018, 11, 3009. [Google Scholar] [CrossRef] [Green Version]
  18. Bressanelli, G.; Perona, M.; Saccani, N. Challenges in supply chain redesign for the Circular Economy: A literature review and a multiple case study. Int. J. Prod. Res. 2019, 57, 7395–7422. [Google Scholar] [CrossRef] [Green Version]
  19. Kirchherr, J.; Reike, D.; Hekkert, M. Conceptualizing the circular economy: An analysis of 114 definitions. Resour. Conserv. Recycl. 2017, 127, 221–232. [Google Scholar] [CrossRef]
  20. Bressanelli, G.; Saccani, N.; Pigosso, D.C.A.; Perona, M. Circular Economy in the WEEE industry: A systematic literature review and a research agenda. Sustain. Prod. Consum. 2020, 23, 174–188. [Google Scholar] [CrossRef]
  21. Bressanelli, G.; Saccani, N.; Perona, M.; Baccanelli, I. Towards Circular Economy in the Household Appliance Industry: An Overview of Cases. Resources 2020, 9, 128. [Google Scholar] [CrossRef]
  22. Bakker, C.; Wang, F.; Huisman, J.; den Hollander, M. Products that go round: Exploring product life extension through design. J. Clean. Prod. 2014, 69, 10–16. [Google Scholar] [CrossRef]
  23. Intlekofer, K.; Bras, B.; Ferguson, M. Energy Implications of Product Leasing. Environ. Sci. Technol. 2010, 44, 4409–4415. [Google Scholar] [CrossRef] [PubMed]
  24. Bressanelli, G.; Perona, M.; Saccani, N. Assessing the impacts of circular economy: A framework and an application to the washing machine industry. Int. J. Manag. Decis. Mak. 2019, 18, 282. [Google Scholar] [CrossRef]
  25. Amasawa, E.; Suzuki, Y.; Moon, D.; Nakatani, J.; Sugiyama, H.; Hirao, M. Designing Interventions for Behavioral Shifts toward Product Sharing: The Case of Laundry Activities in Japan. Sustainability 2018, 10, 2687. [Google Scholar] [CrossRef] [Green Version]
  26. Garcilaso, L.; Jordan, K.L.; Kumar, V.; Hutchins, M.J.; Sutherland, J.W. A Life-Cycle Comparison of Clothes Washing Alternatives. In Advances in Life Cycle Engineering for Sustainable Manufacturing Businesses; Springer: London, UK, 2007; pp. 423–428. ISBN 9781846289347. [Google Scholar]
  27. Bocken, N.; Ingemarsdotter, E.; Gonzalez, D. Designing Sustainable Business Models: Exploring IoT-Enabled Strategies to Drive Sustainable Consumption. In Sustainable Business Models; Palgrave Macmillan: Cham, Switzerland, 2019; pp. 61–88. ISBN 978-3-319-93274-3. [Google Scholar]
  28. Sakao, T.; Wasserbaur, R.; Mathieux, F. A methodological approach for manufacturers to enhance value-in-use of service-based offerings considering three dimensions of sustainability. CIRP Ann. 2019, 68, 33–36. [Google Scholar] [CrossRef]
  29. Lieder, M.; Asif, F.M.; Rashid, A.; Mihelič, A.; Kotnik, S. A conjoint analysis of circular economy value propositions for consumers: Using “washing machines in Stockholm” as a case study. J. Clean. Prod. 2018, 172, 264–273. [Google Scholar] [CrossRef]
  30. Atlason, R.S.; Giacalone, D.; Parajuly, K. Product design in the circular economy: Users’ perception of end-of-life scenarios for electrical and electronic appliances. J. Clean. Prod. 2017, 168, 1059–1069. [Google Scholar] [CrossRef]
  31. Maccioni, L.; Borgianni, Y.; Basso, D. Value Perception of Green Products: An Exploratory Study Combining Conscious Answers and Unconscious Behavioral Aspects. Sustainability 2019, 11, 1226. [Google Scholar] [CrossRef] [Green Version]
  32. Tunn, V.S.C.; Fokker, R.; Luijkx, K.A.; De Jong, S.A.M.; Schoormans, J.P.L. Making Ours Mine: Increasing Consumer Acceptance of Access-Based PSS through Temporary Product Customisation. Sustainability 2019, 11, 274. [Google Scholar] [CrossRef] [Green Version]
  33. Pinheiro, M.A.P.; Seles, B.M.R.P.; De Camargo Fiorini, P.; Jugend, D.; Lopes de Sousa Jabbour, A.B.; da Silva, H.M.R.; Latan, H. The role of new product development in underpinning the circular economy. Manag. Decis. 2019, 57, 840–862. [Google Scholar] [CrossRef]
  34. Agrawal, R.; Wankhede, V.A.; Kumar, A.; Upadhyay, A.; Garza-Reyes, J.A. Nexus of circular economy and sustainable business performance in the era of digitalization. Int. J. Product. Perform. Manag. 2021. [Google Scholar] [CrossRef]
  35. Gülserliler, E.G.; Blackburn, J.D.; Van Wassenhove, L.N. Consumer acceptance of circular business models and potential effects on economic performance: The case of washing machines. J. Ind. Ecol. 2021, 1–13. [Google Scholar] [CrossRef]
  36. Prieto-Sandoval, V.; Jaca, C.; Ormazabal, M. Towards a consensus on the circular economy. J. Clean. Prod. 2018, 179, 605–615. [Google Scholar] [CrossRef]
  37. Akbar, P.; Hoffmann, S. Under which circumstances do consumers choose a product service system (PSS)? Consumer benefits and costs of sharing in PSS. J. Clean. Prod. 2018, 201, 416–427. [Google Scholar] [CrossRef]
  38. Tunn, V.S.C.; van den Hende, E.A.; Bocken, N.M.P.; Schoormans, J.P.L. Digitalised product-service systems: Effects on consumers’ attitudes and experiences. Resour. Conserv. Recycl. 2020, 162, 105045. [Google Scholar] [CrossRef]
  39. Bocken, N.M.P.; Mugge, R.; Bom, C.A.; Lemstra, H.-J. Pay-per-use business models as a driver for sustainable consumption: Evidence from the case of HOMIE. J. Clean. Prod. 2018, 198, 498–510. [Google Scholar] [CrossRef]
  40. Kruschwitz, A.; Karle, A.; Schmitz, A.; Stamminger, R. Consumer laundry practices in Germany. Int. J. Consum. Stud. 2014, 38, 265–277. [Google Scholar] [CrossRef]
  41. Alborzi, F.; Schmitz, A.; Stamminger, R. Effects of socio-demographic factors on laundry behaviours in Europe and their implications on sustainability. Int. J. Consum. Stud. 2017, 41, 671–684. [Google Scholar] [CrossRef]
  42. Hennies, L.; Stamminger, R. An empirical survey on the obsolescence of appliances in German households. Resour. Conserv. Recycl. 2016, 112, 73–82. [Google Scholar] [CrossRef]
  43. James, G.; Witten, D.; Hastie, T.; Tibshirani, R. An Introduction to Statistical Learning; Springer Texts in Statistics; Springer: New York, NY, USA, 2021; ISBN 978-1-0716-1417-4. [Google Scholar]
  44. R Core Team. R: A Language and Environment for Statistical Computing; R Foundation for Statistical Computing: Vienna, Austria, 2021; Available online: http://www.R-project.org/ (accessed on 1 November 2021).
  45. Saccani, N.; Perona, M.; Bacchetti, A. The total cost of ownership of durable consumer goods: A conceptual model and an empirical application. Int. J. Prod. Econ. 2017, 183, 1–13. [Google Scholar] [CrossRef]
  46. Boyano, A.; Cordella, M.; Espinosa, N.; Villanueva, A.; Graulich, K.; Alborzi, F.; Hook, I.; Stamminger, R.; European Commission. Joint Research Centre. Ecodesign and Energy Label for Household Washing Machines and Washer Dryers: Preparatory Study—Final Report; EU Publications: Luxembourg, 2017; ISBN 9789279741838. [Google Scholar]
  47. YAECI Project. Appliance Energy Cost Indication; YAECI: Roermond, The Netherlands, 2013. [Google Scholar]
  48. den Hollander, M.C.; Bakker, C.A.; Hultink, E.J. Product Design in a Circular Economy: Development of a Typology of Key Concepts and Terms. J. Ind. Ecol. 2017, 21, 517–525. [Google Scholar] [CrossRef]
  49. Milani, A.; Camarda, C.; Savoldi, L. A simplified model for the electrical energy consumption of washing machines. J. Build. Eng. 2015, 2, 69–76. [Google Scholar] [CrossRef]
  50. Boldoczki, S.; Thorenz, A.; Tuma, A. The environmental impacts of preparation for reuse: A case study of WEEE reuse in Germany. J. Clean. Prod. 2020, 252, 119736. [Google Scholar] [CrossRef]
  51. Laitala, K.; Boks, C.; Klepp, I.G. Potential for environmental improvements in laundering. Int. J. Consum. Stud. 2011, 35, 254–264. [Google Scholar] [CrossRef]
  52. Lasic, E.; Stamminger, R.; Nitsch, C.; Kessler, A. Construction of a Virtual Washing Machine. Tenside Surfactants Deterg. 2015, 52, 193–200. [Google Scholar] [CrossRef] [Green Version]
  53. Kim, J.; Park, Y.; Yun, C.; Park, C.H. Comparison of environmental and economic impacts caused by the washing machine operation of various regions. Energy Effic. 2015, 8, 905–918. [Google Scholar] [CrossRef]
  54. Iso 14040; The International Standards Organisation Environmental Management—Life Cycle Assessment—Principles and Framework. International Standard Organization: Geneva, Switzerland, 2006.
  55. Elia, V.; Gnoni, M.G.; Tornese, F. Measuring circular economy strategies through index methods: A critical analysis. J. Clean. Prod. 2017, 142, 2741–2751. [Google Scholar] [CrossRef]
  56. Saidani, M.; Yannou, B.; Leroy, Y.; Cluzel, F.; Kendall, A. A taxonomy of circular economy indicators. J. Clean. Prod. 2019, 207, 542–559. [Google Scholar] [CrossRef] [Green Version]
  57. Yuan, Z.; Zhang, Y.; Liu, X. Life cycle assessment of horizontal-axis washing machines in China. Int. J. Life Cycle Assess. 2016, 21, 15–28. [Google Scholar] [CrossRef]
  58. Rüdenauer, I.; Gensch, C.-O.; Quack, D. Eco-Efficiency Analysis of Washing Machines. 2005. Available online: https://www.oeko.de/publikationen/p-details/eco-efficiency-analysis-of-washing-machines (accessed on 1 October 2021).
  59. Ardente, F.; Mathieux, F. Environmental assessment of the durability of energy-using products: Method and application. J. Clean. Prod. 2014, 74, 62–73. [Google Scholar] [CrossRef]
  60. WRAP. Environmental Life Cycle Assessment (LCA) Study of Replacement and Refurbishment Options for Domestic Washing Machines; Waste & Resources Action Programme: Banbury, UK, 2011. [Google Scholar]
  61. Abeliotis, K.; Nikolaou, N.; Sardianou, E. Attitudes of Cypriot consumers on the ownership of household appliances: The case of the city of Limassol. Int. J. Consum. Stud. 2011, 35, 132–137. [Google Scholar] [CrossRef]
  62. Tukker, A.; Tischner, U. Product-services as a research field: Past, present and future. Reflections from a decade of research. J. Clean. Prod. 2006, 14, 1552–1556. [Google Scholar] [CrossRef]
  63. Heiskanen, E.; Jalas, M. Can services lead to radical eco-efficiency improvements?—A review of the debate and evidence. Corp. Soc. Responsib. Environ. Manag. 2003, 10, 186–198. [Google Scholar] [CrossRef]
  64. Shahbazi, S.; Johansen, K.; Sundin, E. Product Design for Automated Remanufacturing—A Case Study of Electric and Electronic Equipment in Sweden. Sustainability 2021, 13, 9039. [Google Scholar] [CrossRef]
  65. Lindkvist Haziri; Sundin; Sakao Feedback from Remanufacturing: Its Unexploited Potential to Improve Future Product Design. Sustainability 2019, 11, 4037. [CrossRef] [Green Version]
  66. O’Connell, M.W.; Hickey, S.W.; Fitzpatrick, C. Evaluating the sustainability potential of a white goods refurbishment program. Sustain. Sci. 2013, 8, 529–541. [Google Scholar] [CrossRef]
  67. Sumter, D.; Bakker, C.; Balkenende, R. The role of product design in creating circular business models: A case study on the lease and refurbishment of baby strollers. Sustainability 2018, 10, 2415. [Google Scholar] [CrossRef] [Green Version]
  68. Jæger, B.; Menebo, M.M.; Upadhyay, A. Identification of environmental supply chain bottlenecks: A case study of the Ethiopian healthcare supply chain. Manag. Environ. Qual. An Int. J. 2021, 32, 1233–1254. [Google Scholar] [CrossRef]
  69. Van Weelden, E.; Mugge, R.; Bakker, C. Paving the way towards circular consumption: Exploring consumer acceptance of refurbished mobile phones in the Dutch market. J. Clean. Prod. 2016, 113, 743–754. [Google Scholar] [CrossRef] [Green Version]
  70. Adrodegari, F.; Saccani, N. A maturity model for the servitization of product-centric companies. J. Manuf. Technol. Manag. 2020, 31, 775–797. [Google Scholar] [CrossRef]
  71. Kjaer, L.L.; Pigosso, D.C.A.; Niero, M.; Bech, N.M.; McAloone, T.C. Product/Service-Systems for a Circular Economy: The Route to Decoupling Economic Growth from Resource Consumption? J. Ind. Ecol. 2019, 23, 22–35. [Google Scholar] [CrossRef] [Green Version]
Figure 1. Research Framework.
Sustainability 14 00609 g001
Figure 2. Smartphone Mobile App to collect data and compute results (Italian language only).
Sustainability 14 00609 g002
Figure 3. Household size of the sample (n = 279).
Sustainability 14 00609 g003
Figure 4. Usage characteristics of the sample (n = 279) in terms of (a) temperature usage frequency, (b) washing machines loading rate, and (c) number of washing cycle per year.
Sustainability 14 00609 g004
Figure 5. Washing Machines characteristics of the sample (n = 279) in terms of (a) energy efficiency class, (b) capacity, and (c) average price.
Sustainability 14 00609 g005
Figure 6. Results of the evaluation model: (a) Average TCO and (b) Average GWP for each scenario.
Sustainability 14 00609 g006
Figure 7. Washing Machines lifetime distribution for each scenario: (a) Linear Economy, (b) pay-per-wash Circular Economy business model, and (c) Washing Machine refurbishment.
Sustainability 14 00609 g007
Figure 8. Frequency distribution (n = 279 respondents) of: economic savings generated by pay-per-wash (a); economic savings generated by refurbishment (b); environmental savings generated by pay-per-wash (c); environmental savings generated by refurbishment (d).
Sustainability 14 00609 g008
Figure 9. Users’ acceptance rate of CE alternatives (n = 279) for (a) pay-per-wash, (b) washing machine refurbishment.
Sustainability 14 00609 g009
Figure 10. Statistically significant effects: WM number of failures on pay-per-wash acceptance rate (a); pay-per-wash potential environmental savings on pay-per-wash acceptance rate (b); respondents’ age on refurbishment acceptance rate (c).
Sustainability 14 00609 g010
Table 1. Data collected through the users’ survey.
AcronymDescriptionTypeUnit of Measure
AgeAge of respondentIndependent variableYear
HSHousehold Size, i.e., number of people living in a householdIndependent variablePersons
EECWashing Machine Energy Efficiency ClassIndependent variableDimensionless
CWashing Machine CapacityIndependent variablekg
PWashing Machine PriceIndependent variable
NwcNumber of washing cycles per yearIndependent variableNumber/year
LRWashing Machine Loading RateIndependent variable%
FTUsage frequency per temperature level
(Temperature = 30 °C; 40 °C; 60 °C; 90 °C)
Independent variable%
NFailureNumber of Washing Machine failuresIndependent variableNumber
PPWaccPay-per-wash acceptanceDependent variable
(Response)
Yes/No
RFBaccRefurbishment acceptanceDependent variable
(Response)
Yes/No
Table 2. Washing energy consumption per cycle (adapted from Milani et al., 2015 [49]).
WM Efficiency Class EECEFCEEC [kWh/Nwc]EVCEEC [kWh/(Nwc·kg)]
A+++0.1800.100
A++0.2200.110
A+0.1900.140
A0.1800.160
B0.0000.188
C0.0000.184
Table 3. Temperature coefficients (adapted from Milani et al. 2015 [49]).
Washing Temperature TKT (Dimensionless)
30 °C0.34
40 °C0.55
60 °C1.00
90 °C1.63
Table 4. GWP related to the three WM classes considered.
WM ClassLow-Price Segment
(Price < 300 €)
Average-Price Segment
(301 € < Price < 500 €)
High-Price Segment
(Price > 501 €)
Average Price
p [€]
150 €400 €600 €
LWM
[cycle]
150025004000
RMEWM
[kg CO2-eq]
235.5300.6581.5
M&AWM
[kg CO2-eq]
74.090.896.3
DWM
[kg CO2-eq]
8.48.48.4
Table 5. Users’ sample characteristics.
Age of RespondentsMaleFemaleTotal
Younger than 29 years old276996
Between 30 and 49 years old2480104
between 50 and 64 years old105868
Older than 65 years old11011
Total62217279
Table 6. Logistic Regression Results for pay-per-wash acceptance (* significance level p < 0.05).
CoefficientStd. Errorz-Statisticp-Value
(Intercept)−2.7149481.751889−1.5500.1212
Age−0.0018520.008886−0.2080.8349
HS0.0721680.2758200.2620.7936
EEC0.1799760.1394001.2910.1967
C−0.0378240.136705−0.2770.7820
Nwc−0.0023360.002376−0.9830.3255
LR2.0731841.3007621.5940.1110
FT0.3906131.0029680.3890.6969
NFailure0.2933930.1445402.0300.0424 *
TCO0.0096450.0242730.3970.6911
GWP−0.0199770.032351−0.6170.5369
Eco_Sav_Ppw−0.0063100.011066−0.5700.5686
Env_Sav_Ppw0.0515320.0256082.0120.0442 *
Table 7. Logistic Regression Results for refurbishment acceptance (* significance level p < 0.05).
CoefficientStd. Errorz-Statisticp-Value
(Intercept)1.8716231.2240381.5290.126250
Age−0.0308780.009067−3.4050.000661 *
HS−0.0984840.275390−0.3580.720629
EEC−0.0746950.151650−0.4930.622329
C−0.0761240.117111−0.6500.515682
Nwc0.0008330.0027530.3030.762239
LR2.0016061.1374501.7600.078454
FT−1.0176521.286137−0.7910.428800
NFailure0.0024690.1449640.0170.986412
TCO−0.0492160.046809−1.0510.293060
GWP0.0509110.0540410.9420.346151
Eco_Sav_Ppw0.0296900.0588170.5050.613711
Env_Sav_Ppw−0.0070860.063486−0.1120.911126
Publisher’s Note: MDPI stays neutral with regard to jurisdictional claims in published maps and institutional affiliations.

