1. Introduction
For the last several decades, the developed countries have been experiencing the so-called second demographic transition. The changes consist of, for instance, falling fertility, declining mortality, life expectancy becoming longer, marriages being contracted increasingly later, and the ageing of population [
1,
2,
3]. The falling birth rates in the European countries is resulting in the bottom-up ageing of their populations. In turn, the growing length of life is contributing to top-down ageing. The European countries differ in both the intensity of their demographic processes and their population structures by age. The division became visible in the 1960s and deepened in the 1990s. The incorporation of the post-communist countries into the EU structure began the process of change to their social policies, with a view of eliminating any differences between them [
4]. The transformation of the population structures has revealed the polarisation of demographic processes and disproportions in the population structure by age, as well as reducing the size of the continent’s and the Community’s population [
5]. The intensity of ageing is assessed by means of traditional or alternative measures [
6,
7]. The ageing concerns all age groups, especially that of the working age and the post-working age. The size of the working population has been decreasing significantly, which has reduced the demographic dividend [
8], economic growth, and competitiveness of many European regions [
9,
10]. By 2050, the ageing of Europe’s population will affect the Community’s territorial development [
11,
12]. Eurostat has projected a population decline in an overwhelming majority of the EU countries and losses in, and ageing of, labour resources by 2050.
The ageing of population is a multi-dimensional process, which creates new contexts in important areas: changes in financing public spending (retirement systems, health care), changes in consumption and investment models, human labour productivity, innovativeness, political preferences, shortages in human labour resources, changes in science and education [
13]. The ageing of populations poses a challenge to health, long-term care, and the welfare system [
14], which necessitates increased consumer spending on pharmaceuticals [
15]. As regards challenges to ageing populations, Lloyd-Sherlock made two important remarks [
16]. Firstly, health care needs to correspond to specific conditions; it cannot be copied from culturally and economically different contexts. Secondly, in order to be able to plan future health services, it is necessary to understand the internal relations between epidemiological and demographic changes. The other remark is of particular importance during the COVID-19 pandemic.
The ageing of population is significant to sustainable development, which was pointed out in the strategic documents of UNO [
17,
18] and the European Commission [
19]. It may be viewed from two perspectives: as an opportunity or a threat to sustainable development (in which case it calls for actions that limit its negative impact). In the Madrid International Plan of Action on Ageing [
17], from the beginning of the 21st century, the ageing of populations was perceived as an achievement, and the skills, abilities, and experience of the elderly were recognised as an advantage resulting from the development of mature societies. In the strategic EU document Europe 2020, the ageing of populations was primarily discussed in a labour market context [
19]. Promotion of health and elderly persons’ activity was regarded as an action aimed at achieving social cohesion and higher productivity. The strategy assumed an increase in the participation rate of people aged 20–64 years and a reduction in the number of people threatened with poverty and social exclusion. The European Union engaged in the achievement of the Sustainable Development Goals (SDGs) set out by the United Nations Organisation in its resolution called ‘The 2030 Agenda for Sustainable Development’ [
18]. In an analysis presenting the EU’s progress with achieving the SDGs by 2030, the ageing of societies was identified as a negative driver and a risk to reaching some of the goals. The threat applies to achieving six out of the seventeen goals: Goal 1—end poverty in all its forms everywhere; Goal 2—end hunger, achieve food security and improved nutrition and promote sustainable agriculture; Goal 3—ensure healthy lives and promote wellbeing for all ages; Goal 9—build resilient infrastructure, promote inclusive and sustainable industrialization, and foster innovation; Goal 10—reduce inequality within and among countries; Goal 11—make cities and human settlements inclusive, safe, resilient, and sustainable. Ageing is identified as one of the first threats to achieving these goals: 1 (No poverty), 2 (Zero hunger), 10 (Reduced inequalities), and 11 (Sustainable cities and communities) [
20].
A population’s size and structure are shaped by the processes of births, deaths, and migration. The results of the processes are reflected in the population structure by gender and age. In European countries, the changes lead to the ageing of the population as a result of a growing length of life and a decreasing number of young people. These changes mean that the ageing of population is manifesting itself in a declining share of young people in the population, a growing share of elderly people, and unfavourable proportions in the age groups. In the European countries, the intensity of the ageing is diverse and has been changing over time.
The aim of the study was to assess the stage of advancement and diversity of the ageing of populations in the European Union countries from the past to 2050. The following research hypothesis was subjected to verification: the European countries are becoming alike in terms of the ageing of their populations, while displaying different stages of advancement in the top-down and bottom-up ageing of their population structures. An approach taking account of the two ageing dimensions enables a broader assessment of the intensity of the process and its diversity.
The European countries are demographically old, with the countries of the southern and northern parts of the continent being very old. Although the European countries differ in the intensity of the ageing, the direction of the process is the same. The ageing is permanent and unidirectional—permanent because it is a result of the transformations of the population’s behaviours related to reproduction (i.e., fertility and mortality), initiated a few decades ago, and unidirectional because the transformations are extremely unlikely to be reversed. The inevitability, permanence, and long-term nature make this demographic change important to populations and challenge nations in a multitude of ways previously unknown to them. It is natural that the young should replace the old, and not vice versa. However, the deficit of the young is becoming more pronounced and the old are growing in numbers. This is because the ageing is occurring simultaneously from the bottom up and from the top down of the population structure, which is descriptively referred to as the population pyramid. What is more, the unfavourable proportions of the age groups are becoming more visible. Of particular concern is the growing percentage of the elderly while the population is decreasing in size. Spatial diversity means that similarities and differences in the ageing of populations are being sought, which makes the issue important from a learning point of view. One of the directions is the examination of the convergence and divergence of the ageing by territory. If any differences in the intensity of the ageing in individual countries exist, the countries with a relatively low intensity and a smaller tempo of the process may become models to be followed regarding: (1) Defining the goals of social policy, including those of the population, healthcare, or immigration policies; (2) Deciding what actions to take so that the ageing does not pose a threat to the labour market; (3) Introducing pro-natalist policy tools if the bottom-up ageing, i.e., a decrease in the number of children being born, proves to be faster.
2. Overview of Previous Studies
An overview of the literature and previous studies regarding the ageing of population enables two main research streams to be identified. The first explores the internal characteristics and dynamics of the ageing process and looks for the sources of change in demographic structures and the differing dynamics of the fundamental processes and their impact on the demographic situation now and in the future [
21,
22,
23,
24,
25]. In the other, the ageing is examined in relation to economic issues, living conditions, the welfare state, old-age pension provision, consequences to the labour market [
26,
27,
28,
29,
30], as well as healthcare [
31].
In the research stream regarding the nature and dynamics of the ageing of population, researchers have been using various indicators to characterise the process, which are usually appropriate for assessing top-down ageing (regarding older age groups) from the proportion in the population of elderly people, i.e., aged 65 years or more, to double ageing, demographic dependencies, and synthetic indicators. The research has covered various countries, including European ones and their regions. Researchers have used various methods, including both graphic or agglomerative, convergence models, or the spatial dynamic shift–share method.
Population structure transformations and diversity of the ageing process in European countries were examined by Káčerová, Ondačková, and Mládek [
24]. They used eleven indicators of ageing or age structure (including: population aged 0–14, Billeter index, inflow coefficient, exchange coefficient, index of economic support with a negative relation to population ageing, and 65+ aged population, 80+ aged population, ageing index, outflow coefficient, index of social support, and age median with a positive relation to population ageing) to design a synthetic indicator. They compared the advancement of the ageing for three years: 1950, 2010, and 2060. In 1950, all of the 39 European countries belonged to three subtypes of a young population. In 2010, only the populations of eleven countries were of the young type, and most of the countries displayed characteristics of the old population types. In 2060, all of the examined countries are projected to belong to one of the three old population subtypes.
When examining the EU-27 countries (without Croatia) in the years 1996–2016, Wasilewska [
32] identified four homogenous groups with regard to the similarity of the synthetic measure of ageing. She constructed the indicator on the basis of four indicators, including: proportions of older age populations (65+ and 80+), the double ageing index (the proportion of people aged 85+ years in the age group of 65+ years), and the old age index (the relation of people aged 65+ years to people aged 0–14 years). She noticed that the outflux of young people after the opening of the EU labour markets intensified the dynamics of ageing in the countries that had become EU members after 2004.
Kurek and Rachwał [
33] conducted a spatial analysis of the ageing of population and employment in the age groups of 50–64 years and 65 years or more, also in EU countries, though for a shorter period (2002–2007). They found a low activity of the elderly on the labour market, and so of key importance to the EU’s regional policies is what steps should be taken to boost entrepreneurship in this age group. They observed that any spatial diversity may result from administrative or cultural conditions or the international environment.
Antczak and Lewandowska-Gwarda [
34] analysed the dynamics of men’s and women’s ageing in 32 European countries (including EU-28) in the years 1991–2018. They used the shares of people aged 65 years or more (five-year age groups by gender). They applied the spatial dynamic shift–share method. They obtained four groups of countries with different ageing dynamics. The fastest ageing countries were Malta, Slovenia, Liechtenstein, Lithuania, Romania, and Poland. The slowest ageing countries were Norway and Luxembourg. The male population aged much faster than the female one. They explained that, in Norway, ageing was limited by a high total fertility rate and positive net immigration. Furthermore, 2011 saw the launch and implementation of certain policies, including retirement reforms, which enabled the development of inclusive workplace policies and the transformation of the national system for healthcare and elderly care. What is more, the SDGs from the 2030 Agenda were incorporated into Norway’s strategy.
Ageing has also been analysed for EU regions or specific countries. Kashnitsky, de Beer, and van Wissen [
35] checked whether ageing diversity in 263 of the EU-27 regions had been increasing or decreasing. They applied the total support ratio to measure ageing and they examined two periods: the past (the years 2003–2012) and the future (2013–2042). They made use of beta-convergence models. They discovered convergence in a predominant part of the years 2003–2012 and an expected convergence in the first and third parts of the forecast period (2013–2022 and 2033–2042). Because of the higher mortality of the working age population, the regions of Eastern Europe are noticeably catching up with the other European regions.
Dehnel, Gołata, and Walesiak [
36] examined the stage of advancement and diversity of the ageing of population in some countries of Central and Eastern Europe (Czechia, Poland, Slovakia, and Hungary) as well as the NUTS 2 regions of those countries in two years: 2005 and 2016. They adopted the multivariate multidimensional method in combination with linear ordering and Theil decomposition. They used five metric variables: median age, share of people aged 60 years or more, double ageing index, old age index, and old-age dependency ratio. They concluded that, during the analysed period, the ageing of the populations in the examined Visegrad Group (V4) countries and regions accelerated significantly. The smallest changes were recorded for Slovakia and its regions. The disproportion between regions in terms of the ageing of population decreased slightly.
Posada, Morollon and Viñuela [
37] identified ageing determinants for Spanish regions. They used absolute and conditional beta-convergence models. They confirmed convergence of the ageing of regions (communes) in Spain, showed negative dependence between the initial share of the elderly and the growth of the share in the years 2001–2011. At the same time, they received a negative sign for the commune size (the bigger the commune, the smaller growth in the elderly population) and a positive sign for the distance from the centre (the further away a commune is, the faster its population is becoming old). When considering the spatial effects, they determined that ageing was not necessarily connected with birth or mortality rates; they were rather affected by the influx of immigrants and the regions’ socioeconomic characteristics.
Halbac-Cotoara-Zamfir, Cividino, Egidi, Salvia, and Salvati [
38] assessed the pace of change in the regional demographic systems in Greece (156 regions in the years 1971–2011). They used Multiway Factor Analysis (MFA). They identified ‘fast’ and ‘slow’ indicators, as well as Greece’s regions, characterised by different paces of change in population structures by age.
Reynaud, Miccoli, and Lagona [
39] showed that, in Italy, in the years 2002 and 2014, neighbouring regions had similar ageing patterns, which indicates the importance of spatial autocorrelation in the ageing of population.
The ageing process has a global dimension. Korenjak-Černe and Simpson [
40] examined the population structures of 20 countries in Latin America and the Caribbean in the years 1960–2011. They used Ward’s agglomerative method to separate four clusters based on indicators of structures by sex and age, and eleven clusters distinguished due to their demographic and economic properties. They proved that, over time, the age structures of the examined countries had been becoming more and more alike.
The ageing of population has not only been studied from top down of the population structure, but also from the bottom up. In this case, researchers have made use of the total fertility rate, as its falling values indicate a decreasing degree of generation replacement and a decrease in the youngest age groups born in a population. Dorius [
22], using beta-convergence models, confirmed the hypothesis that, in the countries around the world, the convergence of total fertility rate (TFR) began around 1995.
Gabrielli, Paterno, Salvini, and Corazziari [
41] demonstrated convergence of mortality and convergence of TFR in 95 poorly and least developed countries (LCD) in the years 1990–2015. They used dynamic factor analysis and cluster analysis as their research methods to distinguish six clusters. They noticed that various factors affect mortality and fertility, and that some of them change slowly and are connected with cultural or behavioural factors.
In turn, Borges [
42] checked convergence of TFR and mortality (life expectation and child mortality) in Latin American countries in ten-year periods from 1940 to 2010. He concentrated on three convergence types (beta, sigma, and gamma). He indicated absolute beta-convergence and sigma-convergence from the year 1981 to 2010 (although, during the years 1950–2010, sigma-divergence of TFR occurred). Regarding child mortality, he discovered divergence in the period 1980–1991, and convergence in the following two decades; moreover, while in life expectancy for newborn boys and girls, the results were multidirectional.
In the research stream that relates ageing to economic issues, it has been observed that a society’s age structure impacts a country’s economic development, and that people of various ages have differing needs and have diverse economic behaviours [
43]. Nagarajan, Teixeira, and Silva [
44], on the basis of an overview of the literature, established three main mechanisms by which the ageing of population impacts economic growth. They identified the mechanisms as: consumption and saving patterns, public social expenditure, and human capital. They observed that nearly all empirical studies that focused on ‘public social expenditure’ found a negative impact of ageing, while most of empirical studies concentrating on human capital did not find any statistically significant dependence between ageing and economic growth. On the other hand, positive influence is much more closely related to the mechanism of ‘consumption and saving patterns’.
Wasilewska and Pietrych [
45] examined the relationship between ageing and economic growth in the EU-27 countries (excluding Croatia) in the years 1996–2016. They used panel regression models, in which the GDP growth rate is a dependent variable and the proportion of people aged 65 years or more and the advanced age index (the proportion of people aged 80 years or more in the 65+ age group) are independent variables. They showed that a negative impact of the ageing of population on economic growth was stronger in the old EU countries than in the new member states. The negative impact of ageing on economy is connected with a falling number of working-age people and a growing community of elderly people, i.e., with a decreasing demographic dividend [
46].
Kashnitsky, de Beer, and van Wissen [
47] examined the dependence of the convergence of ageing and economic convergence in the EU-27 countries (261 NUTS2) for the years 2003–2012. For two variables, the share of working aged people and GDP per capita, they used the Theil inequality coefficient. They determined a reverse dependence between the convergence of ageing and economic convergence. They observed a decline over time of economic inequalities (sigma-convergence), but only up to the crisis in 2008, with a simultaneous rise in inequalities in the share of the working-age population (sigma-divergence).
Broniatowska [
48] confirmed that ageing has a deflationary character. On the basis of data for the Organisation for Economic Co-operation and Development (OECD) countries for the years 1971–2015, she showed that a higher demographic dependency ratio is correlated with low inflation.
Because ageing is a unidirectional and irreversible process, studies that have focused on demographic and economic future are important. Davoudi, Wishardt, and Strange [
49] designed two scenarios for the future of Europe. The first one, the ‘silver age’ scenario, is a continuation of the current demographic trends and policies. In this scenario, Europe will be growing old, immigration will be restricted, young people will be concentrating in urban areas, and older people in suburban and rural areas. The other scenario assumes openness to an influx of immigrants. Those will be concentrating in metropolitan areas, and, on a local scale, immigration will consolidate social and spatial integration. Cuaresma, Loichinger, and Vincelette [
50] analysed the quantitative impact of the projected demographic changes in the EU countries on income convergence. They showed that an improved labour force participation rate on its own is insufficient to counteract the negative impact of the ageing of population on income convergence. In contrast to studies focusing on the past, the researchers examined the future of income convergence in Europe. They observed that education and improvement at work were important, that productivity would be a key factor in income growth, and that the convergence of education levels was a significant prerequisite for income convergence in Europe.
Clements, Dybczak, Gaspar, Gupta, and Soto [
51] projected ageing-related expenditure (as a percentage of GDP) up to 2050 and 2100 in developed countries. They expected that expenditure on age-related programmes (old-age pensions, healthcare) would grow by 8.3 pp of GDP by 2100. In the examined projection variants, the expenditure will rise; only if TFR increases by 2100 will the expenditure on old-age pensions fall by 0.3 pp, and if the retirement age is raised, the rise will amount to 0.4 pp.
Using Italy as an example, Garau, Lecca, and Mandras [
10] stressed that the projected decline in the proportion of the working-age population would adversely affect the country’s GDP and employment. They predicted that, as a result of demographic changes, the decrease in GDP would be smaller than the drop in employment and household consumption in Italy.
This article deals with the ageing of the EU populations in the two decades of the 21st century and 2050. The ageing of populations is a unidirectional, permanent, and irreversible process. Usually, the measurement of the intensity of the process regards one dimension, namely from the top of the age structure downwards. The ageing is perceived as a threat to the achievement of several of the Sustainable Development Goals set out in the 2030 Agenda: 1—no poverty; 2—zero hunger; 10—reduced inequalities; and 11—sustainable cities and communities. This article examines whether the EU countries have become similar or will become similar in terms of the ageing of their populations. Two dimensions have been taken into account: top-down and bottom-up ageing. This approach enables a broader assessment of the intensity of the process and its diversity. If the ageing poses a threat to the achievement of the sustainable development goals, it is relevant to establish which aspect of the ageing will be of importance by 2050 and to take the appropriate steps regarding social policy.
3. Data
In order to examine the convergence of the population structures of the EU countries, a total of ten diagnostic variables and demographic indicators were used (
Table 1). The study covered the 27 EU countries from 1 February 2020 (the UK was disregarded because it had left the community). The analysed period was divided into two parts: the past (2004–2020) and the future (2020–2050). The time interval limits were established on the basis of points in time of key importance to the EU countries’ socioeconomic life—expansion of the EU (2004), outbreak of the COVID-19 pandemic (2020), horizon of Eurostat population projections (2050). The data were obtained from the Eurostat database and referred to the actual behaviour of the population structures in the years 2004–2020 [
52], as well as, on the basis of the EUROPOP2019 baseline projection, their projected behaviour up to 2050 [
53]. All calculations were made in MS Excel.
Basic characteristics of variables for the selected years 2004, 2020, and 2050 are presented in
Table 2, and
Figure 1 and
Figure 2 show the variables for the EU-27 countries in 2020.
Throughout the examined period, i.e., in the years 2004–2050, both the range of values (i.e., the difference between the maximum and minimum values) of individual variables and their mean value, i.e., the median, were subject to change. The decrease in the range of values and the median applied to structure indicators that characterise the younger fractions of the population (proportion of population aged 0–9 years, proportion of population aged 0–19 years). In turn, the growing gap in the average value was typical of indicators characterising the older fractions of the population (proportion of population aged 65 years or more, proportion of population aged 80 years or more, and old-age dependency ratio). A drop in the average value and increased differentiation only referred to the proportion of the population aged 20–64 years, and the range of values decreased, while the median rose in the case of the double ageing index. These multidirectional changes in the average value and value differentiation indicate that the ageing of structures occurred in all of the examined age groups, from the bottom to the top of the population age pyramid. The only restriction was the uncertainty regarding population recovery, recorded in the TFR assumptions of the basic variant of the EUROPOP2019 projection for the years 2021–2050.
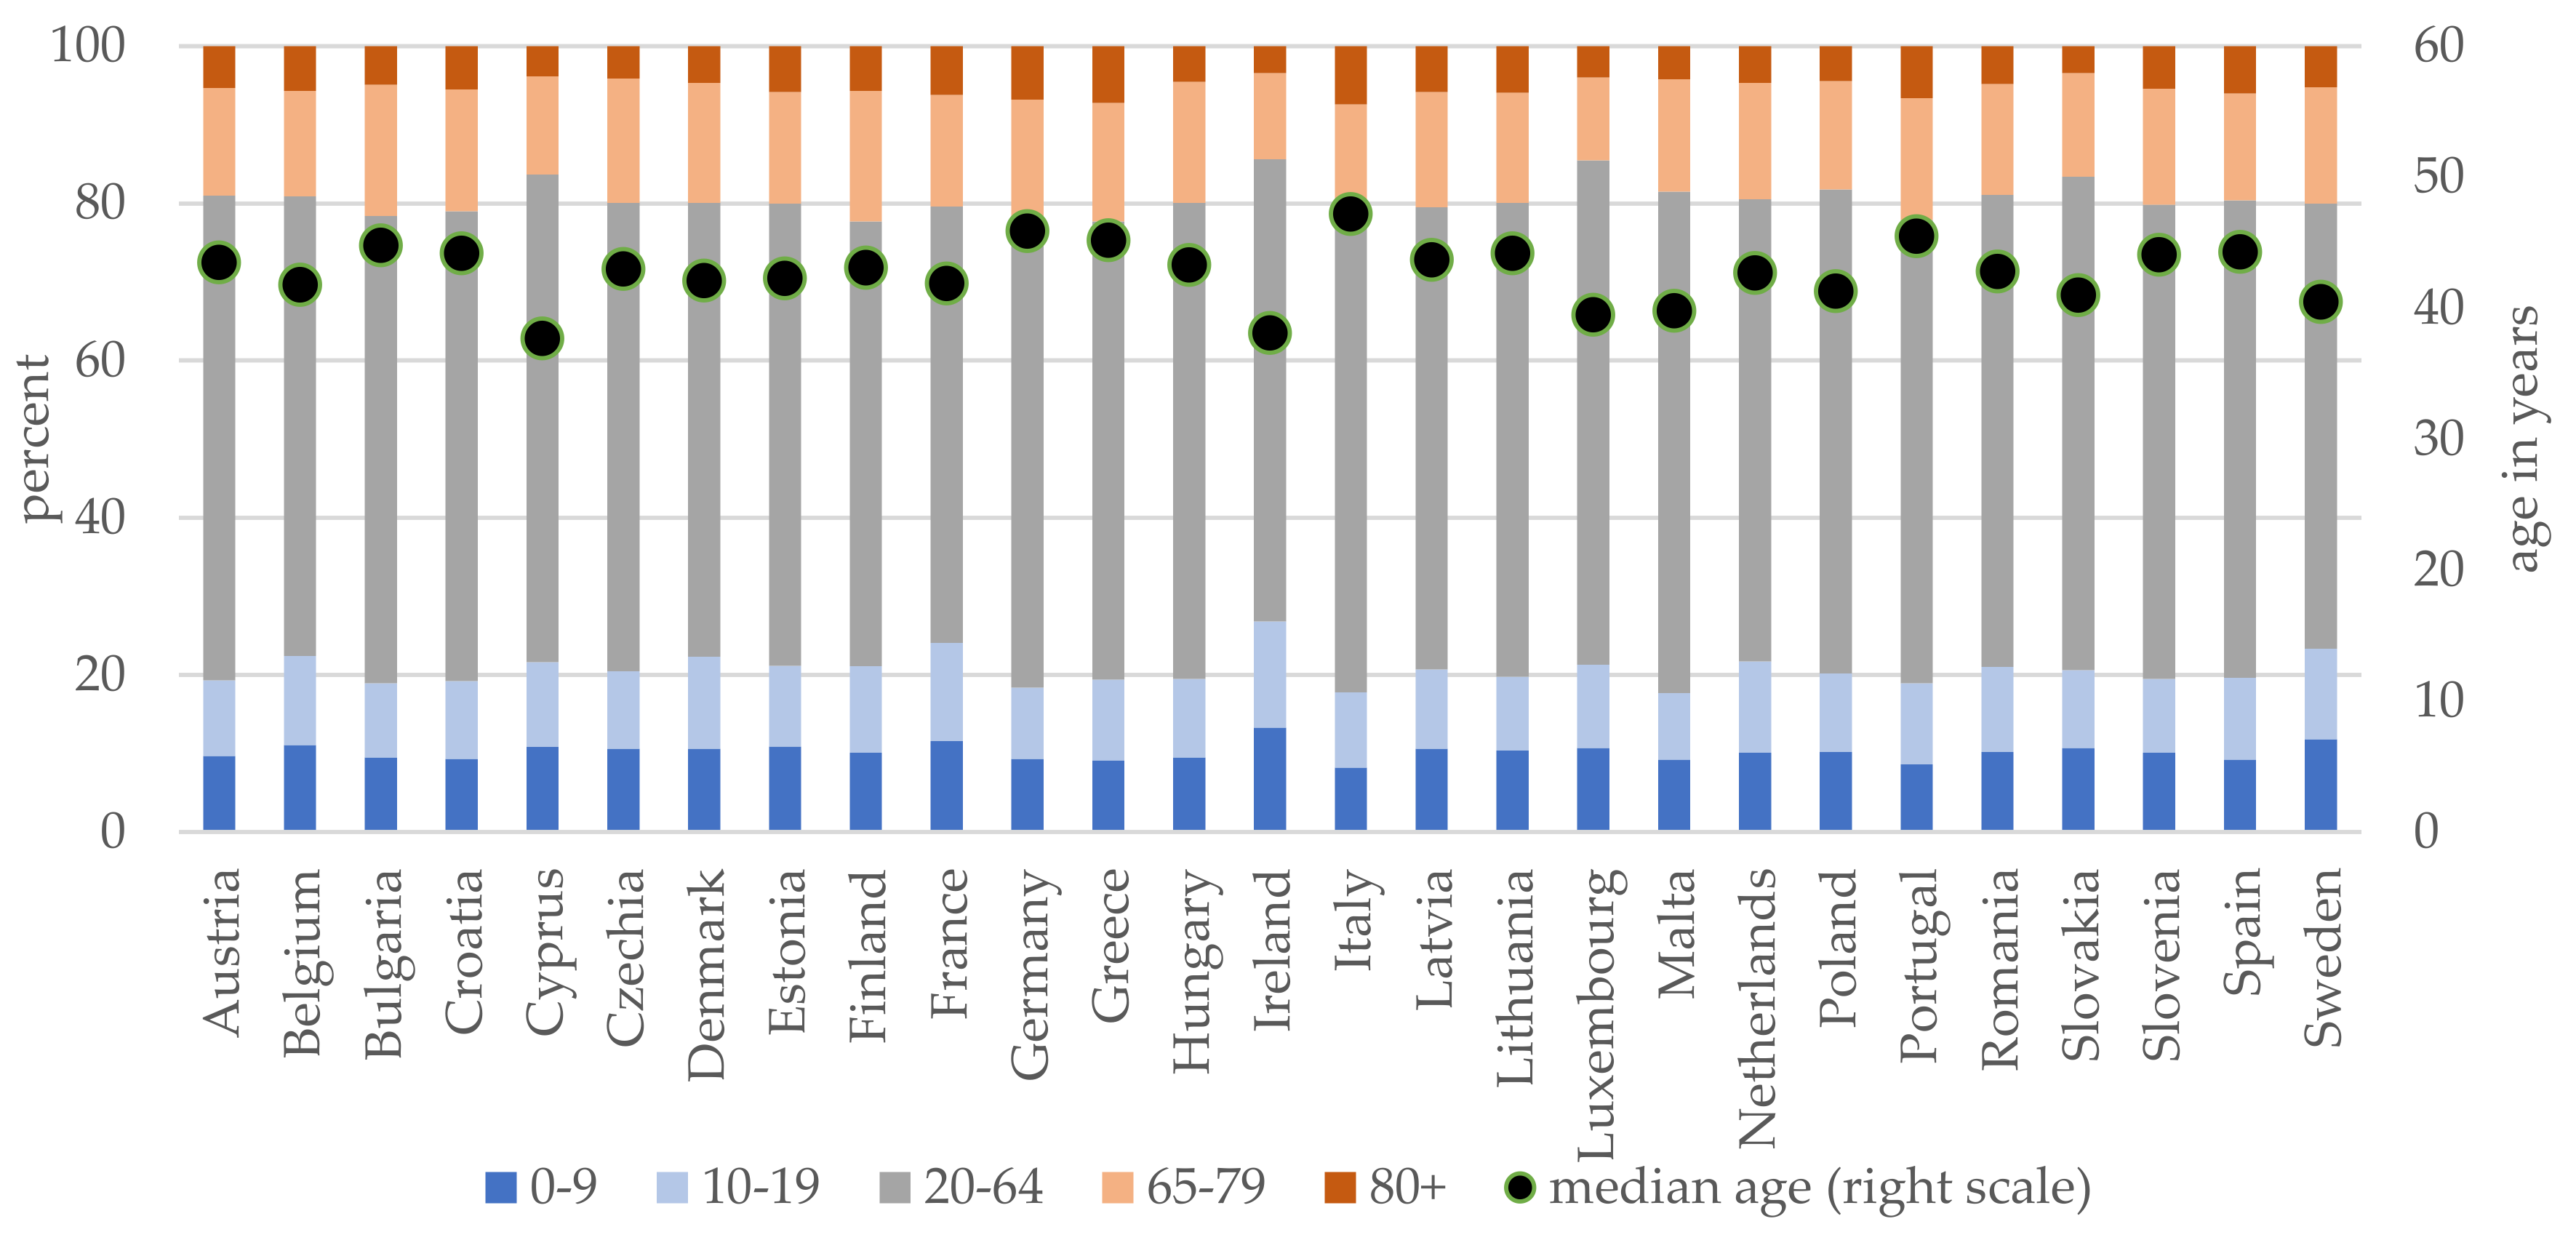
In 2020, in all of the EU-27 countries, the share of the population aged 65 years or more in the total population (i.e., the old-age index) significantly exceeded 7%, and so the countries were classified as demographically old. The index had the biggest values for Italy (23.2), Finland (22.3), and Greece (22.3), while the smallest ones were found for Ireland (14.4) and Luxembourg (14.5). The highest proportions of people aged 0–19 years were in Ireland (26.8) and France (24.1), as shown in
Figure 1. The countries’ demographic old age is also indicated by the values of the median age of the population that exceed 35 years. The lowest median ages of population were recorded for Cyprus (37.7) and Ireland (38.1), while the highest were for Italy (47.2) and Germany (45.9).
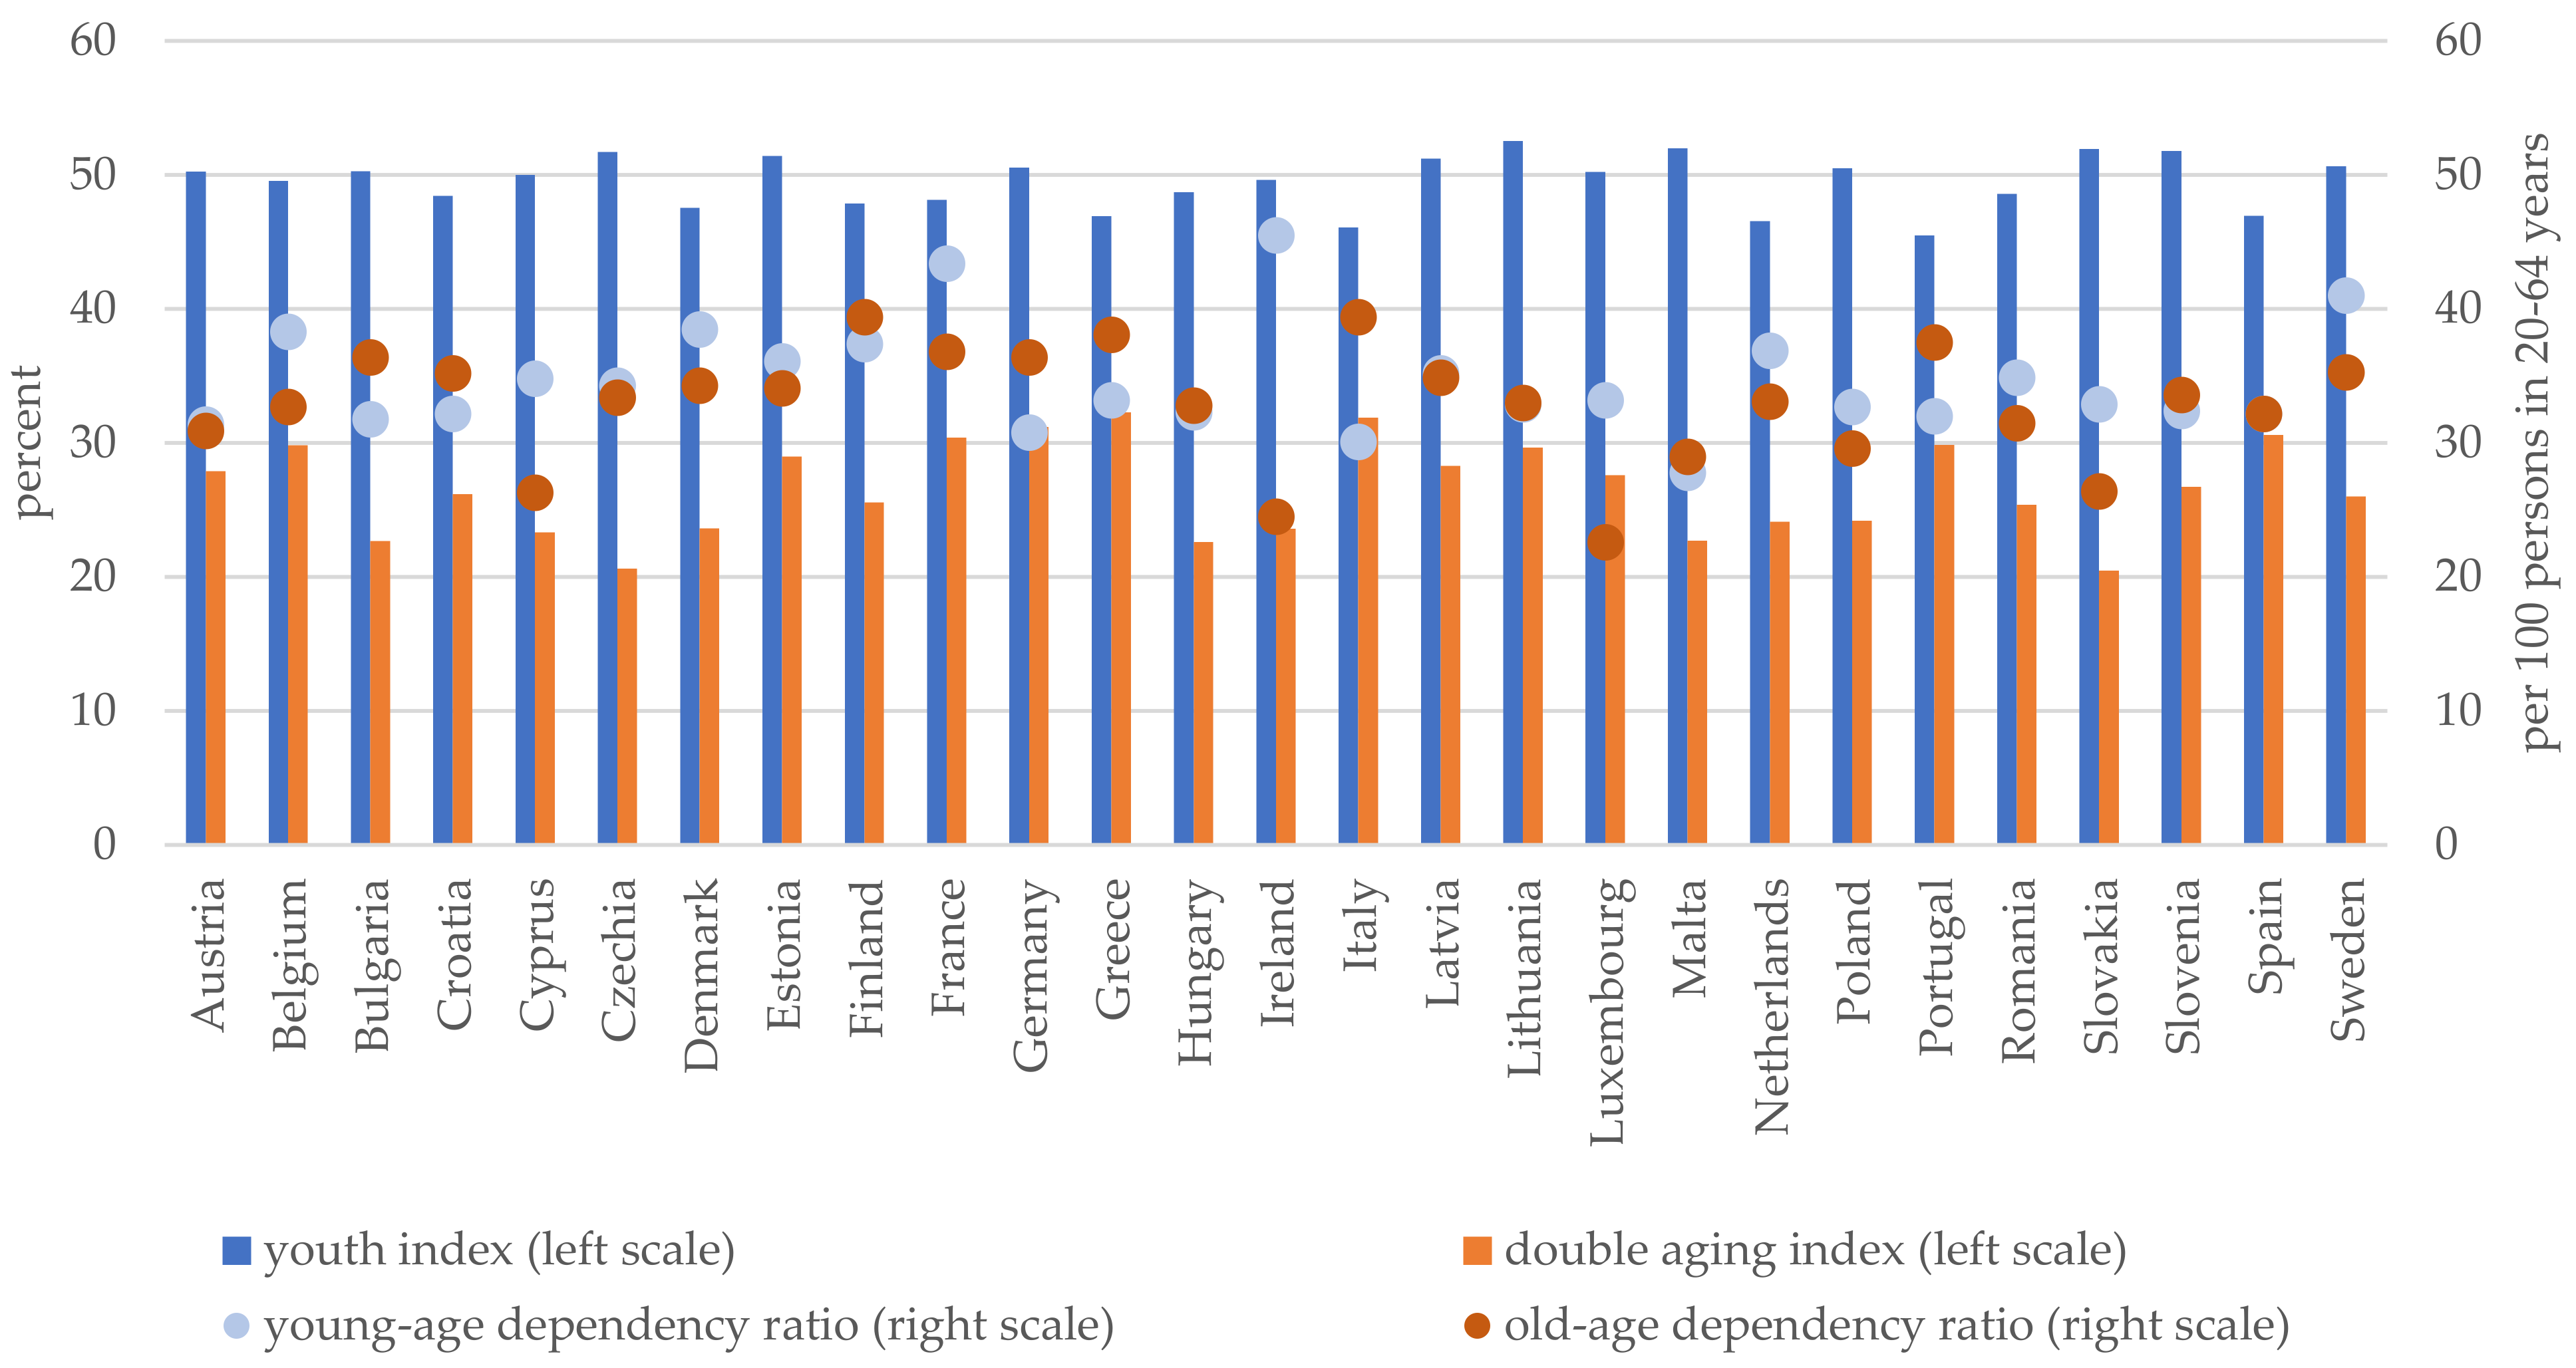
The advancement of the ageing of population is attested by a high percentage of population aged 80 years or more in the 65+ years age group—in all of the EU-27 countries, it exceeds 20%. Among people aged 65 years or more in Greece, Italy, and Germany, nearly one in three people is at least 80 years old (
Figure 2). In regard to young people, the highest share of the population aged 0–9 years in the 0–19 years age group was found in Lithuania (52.5), Malta (52.0), Slovakia (51.9), and Slovenia (51.8). In 11 countries, demographic dependency of the elderly was bigger than that of young people, with the most unfavourable proportions recorded for Italy, Portugal, and Germany. A significant predominance of the young-age dependency ratio over the old-age dependency ratio was found in Ireland, Luxembourg, and Cyprus.
4. Methods
In order to explore similarities between spatial changes in population structures, absolute beta-convergence and sigma-convergence models were used [
54,
55,
56]. Beta-convergence implies that objects (here: EU countries) with low initial values of a studied variable show higher dynamics of changes than objects with higher initial values. Sigma-convergence occurs where the differences in the values of a variable between countries decrease over time. This methodology was used, above all, to study similarities in changes of economic phenomena, but was also applied for analysing demographic processes [
22,
42]. Where beta-convergence was found to occur, the character of the observed changes was identified. Subsequently, it was indicated which of the EU-27 countries were catching up or slowing down, and which were distancing or marginalising themselves when approaching the value of the analysed variable.
Absolute beta-convergence was verified by means of the cross-sectional regression model in the form:
where:
—speed of change in the studied variable between the final and initial parts of the analysed period;
—value of the studied variable in the final part of the analysed period;
—value of the studied variable in the initial part of the analysed period;
a,
b—model parameters;
i—object of study,
i = 1, …,
N.
Model parameters in Equation (1) were estimated using the method of least squares. The significance of the parameter b was examined by means of Student’s t-test. A statistically significant negative value of parameter b attests to the existence of beta-convergence. On the other hand, a statistically important positive value of the parameters indicates the occurrence of beta-divergence.
The parameter
b from Equation (1) was used to determine the coefficient of convergence
β:
where:
T—the interval between the final and initial periods of analysis.
A positive value of coefficient β indicates the occurrence of convergence and specifies its medium-period tempo (expressed as a percentage).
The model of regression of a measure of diversity in relation to time was used to verify sigma-convergence [
57]:
where:
—coefficient of variation of the logarithms of the examined variable in the period
t;
a,
b—model parameters;
t—study period;
t = 1, …,
n.
Model parameters in Equation (3) were estimated by means of the least squares method. The significance of the parameter b was examined by means of Student’s t-test. A negative, statistically significant value of the parameter attests to the occurrence of sigma-convergence, while a positive and statistically important one does the same for sigma-divergence.
Sigma-convergence (divergence) was confirmed with an F-test for two variances. Where sigma-convergence was suspected, the significance of a decline in variance in the initial and final periods was tested. In turn, suspected sigma-divergence was tested by checking the significance of the rise in variance growth in the compared periods.
A test of the significance of the parameter b in the sigma-convergence Equation (3) provides information about changes in diversity of the variable value in the examined period, while the F-test of the variance is only used to examine the significance of the changes in the extreme periods (initial and final). Conclusions related to convergence (divergence) may be ambiguous where tests result in contradictions.
The methods referred to above were used to explore the similarities of both the single variables characterising population structures and a synthetic variable indicating the stage of advancement of the ageing of population, constructed by means of the TOPSIS method [
58,
59]. The method is based on two reference points: the positive ideal solution and the negative ideal solution. The solutions are recognised as the reference points for the objects of study. The best object is at the biggest distance from the negative ideal solution and at the smallest distance from the positive ideal solution. The ideal solution maximises criteria, values of variables that are stimulants, and minimises criteria, values of variables that are destimulants. The negative ideal solution is obtained using the reverse procedure.
The values of the diagnostic matrix that includes observations
xij, i.e.,
ith object for the
jth variable, were minimised as per Equation (4):
It was assumed that each of the variables had the same meaning in the constructed synthetic variable. Subsequently, the positive ideal solution (PIS) was determined:
where:
and the negative ideal solution (NIS):
where:
The distances of the objects of study from the positive ideal solution (reference) was calculated as:
and from the negative ideal solution (anti-reference):
The synthetic measure—measuring the relative proximity of the object to the positive ideal solution—was calculated as:
The indicator is stimulant-like and its values fall within the range [0; 1]. The best object is the one with the biggest value of the measure and the worst one is that with the smallest value of the measure.
5. Results
5.1. Synthetic Variable
The synthetic indicator was constructed using ten partial variables—demographic indicators characterising population structures in the EU-27 countries for the years 2004–2050. The selection of the diagnostic criteria took account of formal and content-related criteria. Information capacity was examined by means of the Pearson correlation coefficient. In most cases, the relations had, at most, a moderate power of dependence. The few cases of high values of correlation coefficients did not result in narrowing down the set of the variables, because this would have led to a set in which one dimension of the ageing would have been overrepresented in relation to the other. Ultimately, in selecting the variables, the content-related criteria prevailed over the formal ones. This set of variables in Equation (1) describes the ageing of the population structures both from top down and from bottom up; Equation (2) does not draw more attention to one of the dimensions; Equation (3) takes account of not only the proportions of the biological age groups (0–19 years, 20–64 years, 65 years or more), but also of the mutual relations between the groups; Equation (4) makes use of variables also used in other studies. In the proposed set (
Table 1), five variables were stimulant-like: proportion of population aged 0–9 years, proportion of population aged 0–19 years, proportion of population aged 20–64 years, youth index, and young-age dependency ratio, which means that, where such variables have big values, the ageing of population is not very advanced. The next five variables were destimulant-like: proportion of population aged 65 years or more, proportion of population aged 80 years or more, double ageing index, median age of population, and old-age dependency ratio, i.e., where such variables have big values, the ageing of population is very advanced. The set of variables takes account of two dimensions of the ageing of population structures: ‘bottom-up’ and ‘top-down’.
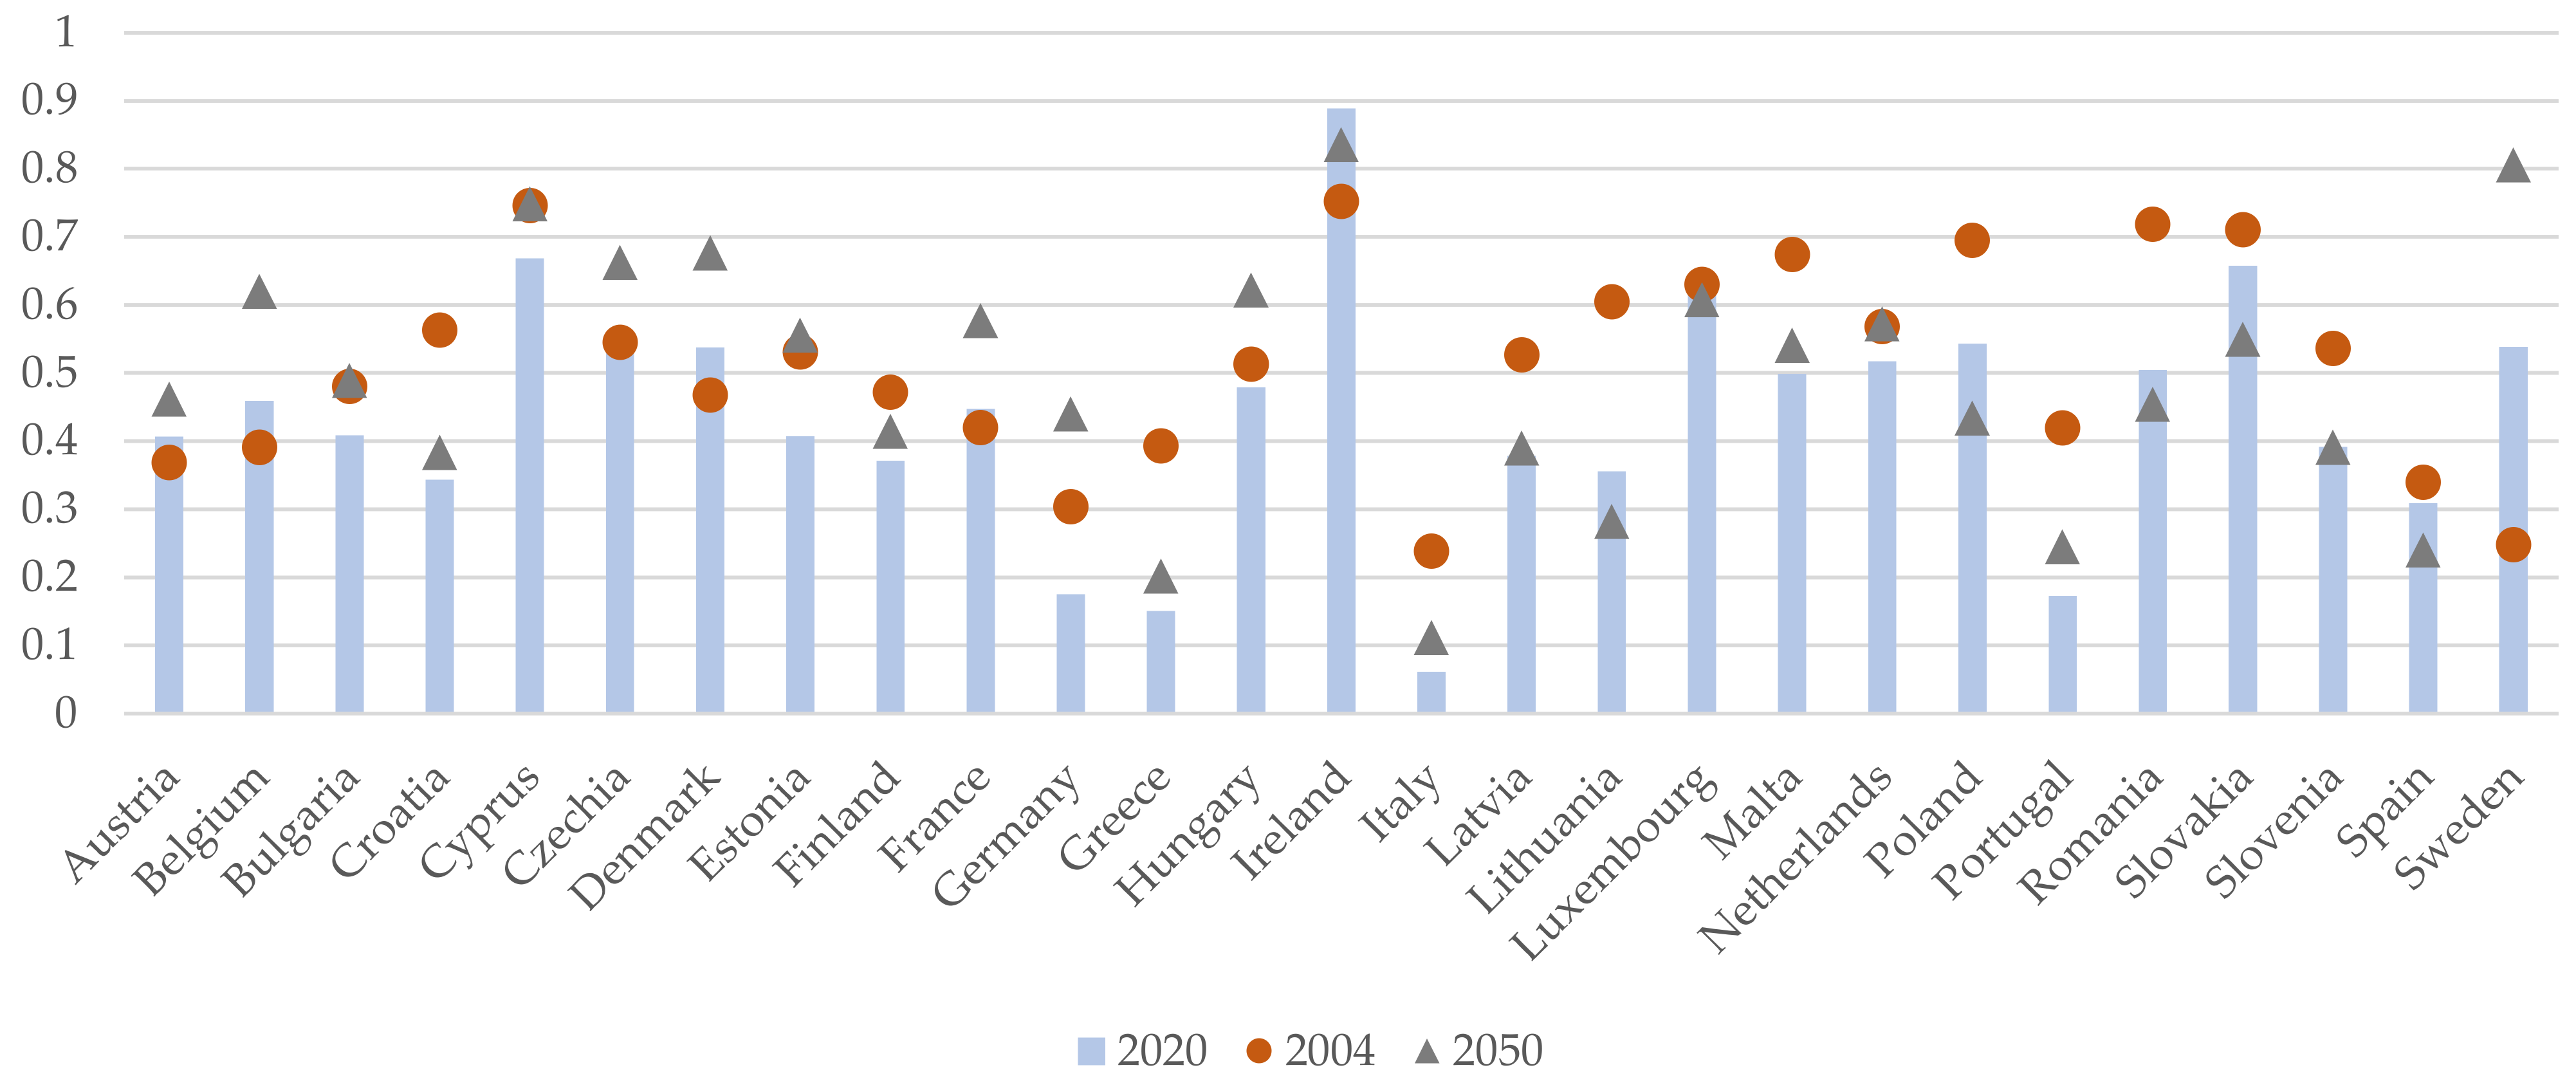
The obtained values of the synthetic indicator for the selected years 2004, 2020, and 2050 are presented in
Figure 3. The indicator is stimulant-like, which means that if it has a small value, the advancement of the ageing of population is high, and, if it is a big value, then it is low. The range of the values of the synthetic indicator changed from:
in 2004 to
in 2020 and
in 2050. In the entire 2004–2050 range, the smallest value was recorded for Italy, and the biggest one was recorded for Ireland. In 2020, the smallest values of the synthetic indicator, indicating the most advanced stage of the ageing of population, referred to Italy, Greece, Portugal, and Germany, and the biggest values referred to Ireland, Cyprus, Slovakia, and Luxembourg (which are countries with the lowest advancement of the ageing of population). In 2004, the synthetic indicator for Sweden was small (0.248); by 2020, it rose to 0.539, and the value projected for 2050 amounts to one of the biggest ones (0.806). Sweden has the biggest range of values for the synthetic indicator for the years 2004–2050, which indicates significant transformations in the population structures when compared with other countries. In 2020, in relation to 2004, the values of the synthetic indicator grew in only eight countries: Austria, Belgium, Czechia, Denmark, France, Ireland, Luxembourg, and Sweden, with the highest rise recorded for the last country. In 2050, when compared with 2020, the synthetic value is predicted to fall only in eight countries (Ireland, Lithuania, Luxembourg, Poland, Romania, Slovakia, Slovenia, and Spain).
5.2. Absolute Beta-Convergence
Based on the values of the synthetic indicator and ten demographic indicators characterising population structures in the European Union countries, models were designed (1) for two ranges of years: 2004–2020 and 2020–2050. The results of the estimation of the model parameters and their verification using a Student’s
t-test are presented in
Table 3. The obtained values of the parameter
b in absolute beta-convergence models of individual indicators characterising population structures in the two time ranges were negative (
Table 3). At the significance level of 0.05 (or 0.1), it may be observed that the parameters significantly differed from zero, which indicates the existence of such convergence as regards nearly all of the considered indicators. This means that 2020 saw an equalisation of the indicators when compared with 2004, which in turn means that the EU-27 countries were becoming alike in terms of their distribution of population structures.
Similarly, by 2050, the EU countries will become similar to one another in this respect when compared with 2020. Beta-convergence has not been confirmed for the proportion of population aged 20–64 years in the years 2004–2020 and the proportion of the population aged 0–19 years in the years 2020–2050. For the synthetic indicator, a negative, statistically important value of the parameter b was in the model, constructed for the years 2020–2050. This supports the conclusion about the population structures of the UE-27 countries becoming alike by 2050. For the years 2004–2020, the value of the parameter was positive, although statistically insignificant. This unconfirmed beta-divergence of the synthetic indicator is puzzling, because beta-convergence was confirmed in nine out of ten models of demographic indicators. It is possible that the result was affected by a small diversity of the variable proportion of population aged 20–64 years, which made the coordinates of the variable in PIS and NIS, in contrast to other variables, similar.
The pace of the convergence of indicators characterising population structures designated with the coefficient of convergence
β in the examined time ranges in the EU-27 countries differed (
Table 3). In the years 2004–2020, the double aging index was the indicator that was becoming equalised the fastest (11.9%). Proportion of population aged 0–9 years in the EU was characterised by a rather high pace of convergence (5.5%). It was impossible to determine the pace of convergence for the youth index (parameter
b < −1); one may only presume that, in the first period under study, the indicator was subject to the overtaking effect, while, in the other period, the coefficient of convergence of the indicator was the biggest (3.5%) when compared with the other indicators. In the years 2020–2050, the values of the coefficients of convergence lower than (or similar to) those in the previous period attest to a slower equalisation of the levels of the demographic indicators. Furthermore, the decline in the pace of convergence during the two time periods 2004–2020 and 2020–2050 particularly regards indicators, referring to younger fractions in the population. Analysis of the obtained model parameters (
Table 3) leads to the conclusion that the EU-27 countries were becoming alike in terms of indicators characterising their population structures. While in the years 2004–2020, a higher pace of convergence was a feature of indicators typical of the younger rather than the older part of the population (with the exception of double ageing index); in the years 2020–2050, it was the indicators characterising the older, not the younger, part of the population (except for youth index) that were converging faster. In the years 2004–2020, the population structures were becoming alike faster because of the bottom indicators of the age pyramid, while, in the period leading to the year 2050, the indicators from the top of the pyramid will equalise faster.
5.3. Identification of the Character of Convergence
With a view to identifying the nature of the convergence of population structures occurring in the EU-27 countries, the examined units were grouped. The classification was conducted for two time periods: 2004–2020 and 2020–2050. The basis for the grouping was the value of the variable (demographic indicator) in a given country in the initial year and the dynamics of the variable change in the period in relation to the mean value. The coordinates of the centre of gravity of the Equation (1) were used as the mean value. Convergence may have a catch-up or slowdown nature, while divergence may have a marginalisation or distancing nature. The results of the grouping in the studied periods of time for the variables—both with a confirmed and unconfirmed beta-convergence—are presented in
Table 4 and
Table 5.
The conducted classification shows that, in the years 2004–2020, the population structures in most of the EU-27 countries were subject to slowing down or catching up convergence (
Table 4). The convergence of the youth index was of a slowing down nature in 13 countries (Austria, Belgium, Croatia, Denmark, Finland, France, Greece, Ireland, Italy, Luxembourg, the Netherlands, Portugal, and Spain). In those countries, the index was higher than the average, and the speed of the change of the index was smaller than the average. The youth index had a catching-up nature in 11 countries (Bulgaria, Cyprus, Czechia, Estonia, Latvia, Lithuania, Malta, Poland, Romania, Slovakia, and Slovenia). In those countries, the index was lower than the average, and the speed of change was higher than the average.
In over half of the EU countries (15 out of 17), the indicator had a slowing down or catching up nature. This individual convergence picture did not correspond to the one resulting from the divergence Equation (1). Results differing from the model’s centre of gravity were related to a low speed of diversity and close-to-zero value of parameter b, which was statistically insignificant. In seven countries (Cyprus, Czechia, Hungary, Ireland, Luxembourg, the Netherlands, and Slovakia), there was distancing, i.e., the synthetic indicator was higher than the average for the EU-27 countries and, at the same time, its growth dynamic was higher than the average. In five countries (Finland, Germany, Greece, Italy, and Portugal), the synthetic indicator was subject to marginalisation, i.e., while it was lower than the average in the 27 countries, it was changing more slowly than the average. In the case of two indicators, proportion of population aged 65 years or more and old-age dependency ratio, the results of the country classification were nearly the same.
Regarding the four indicators characterising the younger fractions of the population (proportion of population aged 0–9 years, proportion of population aged 0–19 years, youth index, and the young-age dependency ratio), Sweden showed distancing in each case, while Austria, Croatia, and Hungary showed marginalisation on three counts. On the other hand, in terms of the indicators characterising the older fractions of the population (proportion of population aged 65 years or more, proportion of population aged 80 years or more, double ageing index, and the old-age dependency ratio), Portugal showed a distancing effect, while Luxembourg and Hungary showed marginalisation and distancing.
In seven countries (Bulgaria, Romania, Latvia, Lithuania, Poland, Slovenia, and Spain), a slowing-down or catching-up effect was recorded for at least eight out of ten demographic indicators. What is more, the synthetic indicator in those countries also shared those convergence natures. Thus, convergence was visible in those seven countries. In three countries (Hungary, Luxembourg, and Portugal), marginalisation or distancing occurred in at least six out of ten measures. In those countries, the synthetic indicator was also affected by divergence.
In the years 2020–2050, the population structures in most of the EU-27 countries were characterised by slowing down or catching up convergence (
Table 5). The convergence of the youth index in 15 countries (Austria, Belgium, Bulgaria, Cyprus, Czechia, Estonia, Germany, Latvia, Lithuania, Luxembourg, Malta, Poland, Slovakia, Slovenia, and Sweden) was slowing down. Only in three countries (Austria, Belgium, and Luxembourg) did the effect consolidate, i.e., it had also occurred in the previous time period. The indicator had a catching up nature in 11 countries (Croatia, Denmark, Finland, France, Greece, Hungary, Italy, the Netherlands, Portugal, Romania, and Spain), but only in Romania was it the same as in the years 2004–2020.
In 14 of the EU-27 countries, the synthetic indicator had a marginalising effect, and 13 had a slowing down or catching up effect. This individual picture of divergence, rather than convergence, does not correspond to the convergence confirmed by means of Equation (1). The parameter b (positive, but statistically insignificant) was relatively close to 0, the speed of divergence was small, and so a detailed analysis of the deviations from the centre of gravity provided different results. Distancing was found for eight countries (Belgium, Bulgaria, Czechia, Denmark, Estonia, France, Hungary, and Sweden), with only Czechia and Hungary having recorded the same effect in the years 2004–2020. Marginalisation of the synthetic indicator occurred in six countries (Croatia, Finland, Latvia, Lithuania, Slovenia, and Spain), and only in Finland was it consolidated.
A comparison of the grouping results for the year ranges 2004–2020 and 2020–2050 showed that the effects of convergence consolidated in no more than 13 countries, and this only applied to five out of ten demographic indicators (proportion of population aged 0–19 years, proportion of population aged 65 years or more, median age of population, young-age dependency ratio, and old-age dependency ratio). Only in the case of two indicators—proportion of population aged 65 years or more and old-age dependency ratio—was the slowing down or catching up nature of the convergence consolidated in the same nine countries: Bulgaria, Croatia, Estonia, Germany, Ireland, Poland, Romania, Slovakia, and Sweden. Furthermore, in the case of the five above-mentioned indicators, the slowing down in the years 2004–2020 changed into marginalisation or distancing in the years 2020–2050. The situation was very noticeable in Lithuania and Latvia. In the case of the other indicators, including the synthetic one, no visible permanent effects of countries becoming alike in terms of their population structures were visible.
5.4. Sigma-Convergence
In order to establish whether the demographic indicators characterising population structures were subject to sigma-convergence, the model parameters in Equation (3) were assessed, and the results are presented in
Table 6. The significance of increases (or decreases) of variance in the initial and final periods of the examined time periods was also tested. The results of the verification are compiled in
Table 7.
In the years 2004–2020, in most situations, the values of the coefficient of variation were falling—this is attested to by negative values of the parameters
b in the sigma-convergence models (
Table 6). The parameters were statistically significant at 0.05, which amounts to sigma-convergence, i.e., the EU-27 countries saw a decrease over time in the diversity of the values of the seven indicators characterising population structures, especially in the old people fractions. On the other hand, positive and statistically significant were the parameters
b of the models for the synthetic indicator, as well as for the following indicators: proportion of population aged 20–64 years and young-age dependency ratio, which translates into sigma-divergence, i.e., a growing diversity of the above indicators in the EU countries for the years 2004–2020.
In the years 2020–2050, the parameter b was also negative in the case of seven indicators, including the synthetic indicator, and statistical significance (at 0.05 or 0.1) of six of them confirmed the assumption that the dispersion of the demographic indicators in the EU countries was on the decrease. Regarding the proportion of population aged 20–64 years and proportion of population aged 0–19 years, statistically significant positive parameters b of the models indicate a growing diversity of the indicators in the EU-27 countries.
Of note are the changing signs of parameters b in the examined periods of time. This refers not only to the synthetic indicator, but also to the young-age dependency ratio, whose parameter signs showed an increase in the years 2004–2020 and a decrease in the years 2020–2050 in the diversity of the indicators in the EU countries. In the case of the proportion of population aged 0–9 years and old-age dependency ratio, the parameters b were negative in the first period and positive in the other period (although statistically insignificant). The reversal in the direction of the trend of the coefficients of variation may be explained with the uncertainty of the values of the indicators characterising the younger part of the population projected for the years up to 2050. Determination of the future birth intensity is more difficult than of the ageing of current populations.
In the past (years 2004–2020), with regard to most of the investigated indicators characterising population structures, a fall in variance was observed in 2020 in relation to 2004, but the fall was only statistically significant (at 0.05 or 0.1) for the youth index and double ageing index. In three cases (including the synthetic indicator), variance in the final period was higher than that in the initial one (
Table 7), with the growth in variance being statistically significant for the synthetic indicator and proportion of population aged 20–64 years. In the future (years 2020–2050), a statistically significant (at 0.05 or 0.1) drop in variance in 2050, when compared with 2020, was determined for three indicators: youth index, proportion of population aged 80 years or more, and double ageing index. On the other hand, an increase in variance for proportion of population aged 0–19 years, proportion of population aged 20–64 years, and old-age dependency ratio was not statistically significant, which fails to confirm the sigma-divergence of the indicators in the EU-27 countries.
6. Discussion
An overview of the previous studies of the ageing of population showed that, despite different variables, time periods, spatial arrangement, or applied methods, the ageing of population structures is subject to convergence. This confirms the global character of the ageing of population. It follows from a study conducted by Káčerová, Ondačková, and Mládek [
24], who used a synthetic indicator to assess the stage of advancement of ageing in Europe in the past (1950, 2010) and the future (2060), predicting that all of the continent’s countries will belong to old population subtypes in the future. Similarities in the ageing were found not only for Europe, but also for Latin America and the Caribbean, where the population structures were becoming alike over time [
40]. Kashnitsky, de Beer, and van Wissen [
35], when investigating the diversity of ageing in the EU-27 regions, confirmed the beta-convergence of the total support ratio in the past (2003–2012) and in the future (2013–2022 and 2033–2042). Furthermore, confirmation was found in the smallest units of Spain’s territorial division (communes) for the beta-convergence of the proportion of elderly population in the years 2001–2011 [
37]. Similarities in the ‘bottom-up’ ageing of population were indicated by the convergence of the total fertility rate in poorly or least developed countries in the years 1995–2016 [
41], as well as in the Latin American countries in the years 1940–2010 [
42]. However, this aspect of the ‘bottom-up’ ageing of population has not been sufficiently explored by means of the structure indicators, although it is has been taken into account with synthetic indicators.
A final note related to the listing of the results of the classification of the European Union countries in terms of their synthetic indicator of ageing [
17] with identification of the character of the convergence of the synthetic indicator (obtained in this study). For the year 2016, Wasilewska created four classes of countries. The oldest group included Germany, Greece, Italy, and Portugal, and the youngest one included Cyprus, Ireland, Luxembourg, and Slovakia. In this study, for the synthetic indicator, the effect of marginalisation identified for the years 2004–2020 referred to five countries, including those classified by Wasilewska as the oldest ones, and the distancing effect occurred in seven countries, including those in the youngest group. This comparison, although looking promising, should be regarded with caution. A significant shortcoming of this comparison is the fact that a static assessment was combined with a dynamic one. The ability to formulate conclusions when juxtaposing the results of the grouping of objects for a specific year with results of the identification of the character of convergence, combining the dynamics of change in a specified time period with the value for the initial year of the period, is limited.
7. Conclusions
The findings of the study of convergence of the population structures of the EU-27 countries warrant the claim that the countries have been becoming, and will continue to become, similar by equalising the levels of the analysed variables characterising population structures. This is attested by absolute beta-convergence confirmed for nearly all individual variables in the two investigated time periods: the past (2004–2020) and the future (2020–2050), as shown in
Table 8. The synthetic variable used in this study covered two dimensions of ageing: ‘bottom-up’ and ‘top-down’, measuring the stage of advancement of the ageing of the structures. In the past, most of the countries witnessed a decline in the variable values, with a simultaneous increase in diversity, while, in the future, most of the countries are expected to experience a growth in the values of the variable and a fall in diversity. Thus, by 2050, the stage of advancement of the ageing of the population structures in the EU-27 countries will increase. The confirmed beta-convergence of the synthetic indicator also indicates that the population structures will become alike in the future, although no such confirmation was found in the past.
Furthermore, considering the division of the examined time period into two subperiods, it may be observed that, in the past (2004–2020), the pace of convergence was higher for fractions regarding younger, rather than older, parts of the population, while, in the future (2020–2050), the pace of convergence will be higher for fractions characterising older, rather than younger, parts of the population. The findings show the two-dimensional nature of the ageing process and also indicate a change in the intensity of the process.
Conclusions regarding the diversity of the EU countries’ population structures declining over time are not unambiguous. In the past (2004–2020), the population structures described by means of youth index and double ageing index were becoming less and less diverse, and thus the EU countries were becoming alike. Regarding the synthetic indicator and proportion of working population (20–64 years), diversity was found to be increasing, which indicates the opposite situation (
Table 8). For the future (2020–2050), it was confirmed that the diversity of the following three indicators characterising population structures will decline: youth index, double ageing index, and proportion of population aged 80 years or more. This multi-directional character of the findings does not warrant unquestionable conclusions about the convergence or divergence of the EU-27 countries in terms of variables characterising population structures. Although, generally, a test of the significance of the directional coefficient confirmed sigma-convergence or sigma-divergence, the test of variance failed to provide such a confirmation. This ambiguity of conclusion should be connected with the fact that the applied tools for measuring sigma-convergence enable the assessment of the diversity in an established time period or only in the extreme parts of the time period. The study found that the diversity of some variables decreased (or increased) over time in a statistically significant manner, but the change in the diversity between the initial and final parts of the studied period proved insignificant.
In conclusion, the research hypothesis that the European countries are becoming similar to one another in terms of the ageing of their populations, while showing different stages of advancement of the ‘top-down’ and ‘bottom-up’ ageing of the population structures, was confirmed. In fact, the existence of convergence or divergence depends on the given indicator used to measure a phenomenon, the adopted time interval, and the studied units (objects). It is therefore necessary to monitor changes in population structures, taking account of the COVID-19 pandemic, successive population projections (because the pandemic has had an adverse effect on the mortality rate) and smaller unit of territorial division.


