Article

Seabed Liquefaction around Pipeline with Backfilling Trench Subjected to Strong Earthquake Motions

1
Institute of Geotechnical Engineering, Nanjing Tech University, Nanjing 210009, China
2
Key Laboratory of Earthquake Engineering and Engineering Vibration, Institute of Engineering Mechanics, China Earthquake Administration, Harbin 150080, China
*
Author to whom correspondence should be addressed.
Sustainability 2022, 14(19), 12825; https://doi.org/10.3390/su141912825
Submission received: 2 July 2022 / Revised: 26 September 2022 / Accepted: 28 September 2022 / Published: 8 October 2022
(This article belongs to the Special Issue Earthquake Engineering Technology and Its Application)

Abstract

:
As an indispensable part of the lifeline for the offshore gas and oil industry, submarine pipelines under long-term marine environmental loadings have historically been susceptible to earthquakes. This study investigates the impact of trench backfilling on the residual liquefaction around a pipeline and the induced uplift of a pipeline under the combined action of an earthquake, ocean wave and current loading. A fully coupled nonlinear effective stress analysis method, which can consider the nonlinear hysteresis and the large deformation after liquefaction of the seabed soil, is adopted to describe the interaction between the seabed soil and the submarine pipeline. Taking a typical borehole in the Bohai strait as the site condition, the nonlinear seismic response analysis of the submarine pipeline under the combined action of seismic loading and ocean wave and current is carried out. The numerical results show that trench backfilling has a significant impact on the seismic response of the pipeline. The existence of trench backfilling reduces the accumulation of the residual excess pore water pressure, so that the seabed liquefaction around the pipeline is mitigated and the uplift of the pipeline is also decreased.

1. Introduction

Due to the rapid exploration of oil and gas in the deep sea, submarine pipelines have developed rapidly in the past few decades, known as a lifeline in the storage and transportation system of submarine oil and gas. The seismic stability of a pipeline is directly related to the safety of offshore oil and gas. Once a strong earthquake occurs, great economic losses and environmental pollution can be caused due to the seabed liquefaction surrounding the pipeline. Unlike the territory counterparts, the submarine pipelines are subjected to long–term ocean environmental loadings, such as ocean waves and currents.
Extensive research has been conducted on the dynamic response of submarine pipelines under the action of ocean waves [1,2,3,4,5,6,7,8,9,10,11,12,13,14]. However, very limited concern is given to the seismic stability of submarine pipelines, especially for those buried in the liquefiable seabed. Earthquake–induced liquefaction of the seabed will lead to great damage to the submarine pipeline. Until the submarine pipelines became an important part of the offshore oil and gas industry, their seismic stability issue gradually attracted the attention of scholars. In the late 1970s, assuming pipelines as rigid structures, Nath and Soh [15] firstly studied the interaction between the seabed and the pipeline under seismic loading, considering the nonlinearity of the seabed soil. Later, the lumped-mass model was used to analyze the seismic response of submarine pipelines subjected to random ground motion by Datta [16]. The results showed that the seismic response of submarine pipelines was obviously different from that of territory pipelines due to the site conditions and the buried depth of pipelines. Yan et al. [17] established a model of seabed–pipeline interaction and studied the influencing factors, such as wall thickness, radius and buried depth, on the strain response of a pipeline under the El Centro seismic wave. Based on the fluid–structure coupling analysis model, Deng et al. [18] established a long-span submarine flexible pipeline model by using finite element software, ADINA, and analyzed the seismic response of the submarine pipeline. Luan and Zhang [19] studied the accumulation of excess pore pressure around the pipeline under seismic loading. However, in the previous studies, few attention has been given to the seismic response of the trenched pipeline with backfilling. The seabed–trench–pipeline interaction has a predominant role on the stability of the pipeline under cyclic loadings associated with earthquake events and ocean waves [20]. Furthermore, the effects of seabed liquefaction and plastic deformation were not well considered in the seismic response analysis of the submarine pipeline [21,22,23]. The seismic response of underground structures is mainly controlled by the surrounding soil. Thus, the seismically induced liquefaction and large deformation have remarkably adverse effects on shallow-buried submarine pipelines.
In this research, typical borehole data in the Bohai strait are chosen as the site condition, with reference to the Bohai strait, China. The Bohai strait, rich in oil and gas resources, has an area of about 77,000 km2, with the north–south length and the east–west length of the Bohai strait being, respectively, about 480 km and 300 km. There are two main fault zones in the Bohai sea, Yingkou–Weifang section of Tanlu fault zone and Zhangjiakou–Bohai active fault zone, which promote the frequent seismic activity in this region. Three strong earthquakes with magnitude 7 or even higher occurred in the middle of the Bohai strait historically. Figure 1 shows the important faults in the Bohai strait and the distribution of historical strong earthquakes. The seabed soil–submarine pipeline interaction model is established incorporating the nonlinear hysteresis and large deformation after liquefaction of the seabed soil. The seismic response of the submarine pipeline under combined action of earthquake and waves is studied and the influence of the trench backfilling on the seabed liquefaction around the pipeline and the induced uplift is further analyzed.

2. Research Method

2.1. Governing Equation

In the framework of Biot’s dynamic consolidation equation and the effective stress principle, the dynamic effective stress analysis method of saturated two–phase medium with soil skeleton–pore water interaction is established and the governing equation can be expressed as follows:
σ ˙ s i j = σ ˙ s i j + δ i j p ,
G 2 u i + ( G 1 2 v ) ε i j , j = p , i + ρ u ¨ i ,
k γ w 2 p p ˙ n s K f = ε ˙ v ,
1 K f = 1 K w + 1 S r P w ,
where σ ˙ s i j is the stress increment tensor of the saturated soil, δ i j is the Kronecker delta and p is excess pore water pressure. G is the shear modulus of the soil skeleton, u i is the displacement vector of soil skeleton, ε v = ε j j is the volume strain tensor, ρ is the density of the soil skeleton and pore water, v is Poisson’s ratio, n s is soil porosity, γ w is the unit weight of water in the pore, k is soil permeability, Kf is the volume compressibility of pore water, Kw is the elastic modulus of water, Sr is the degree of saturation and p w = p 0 + p is absolute pore water pressure.

2.2. Constitutive Model

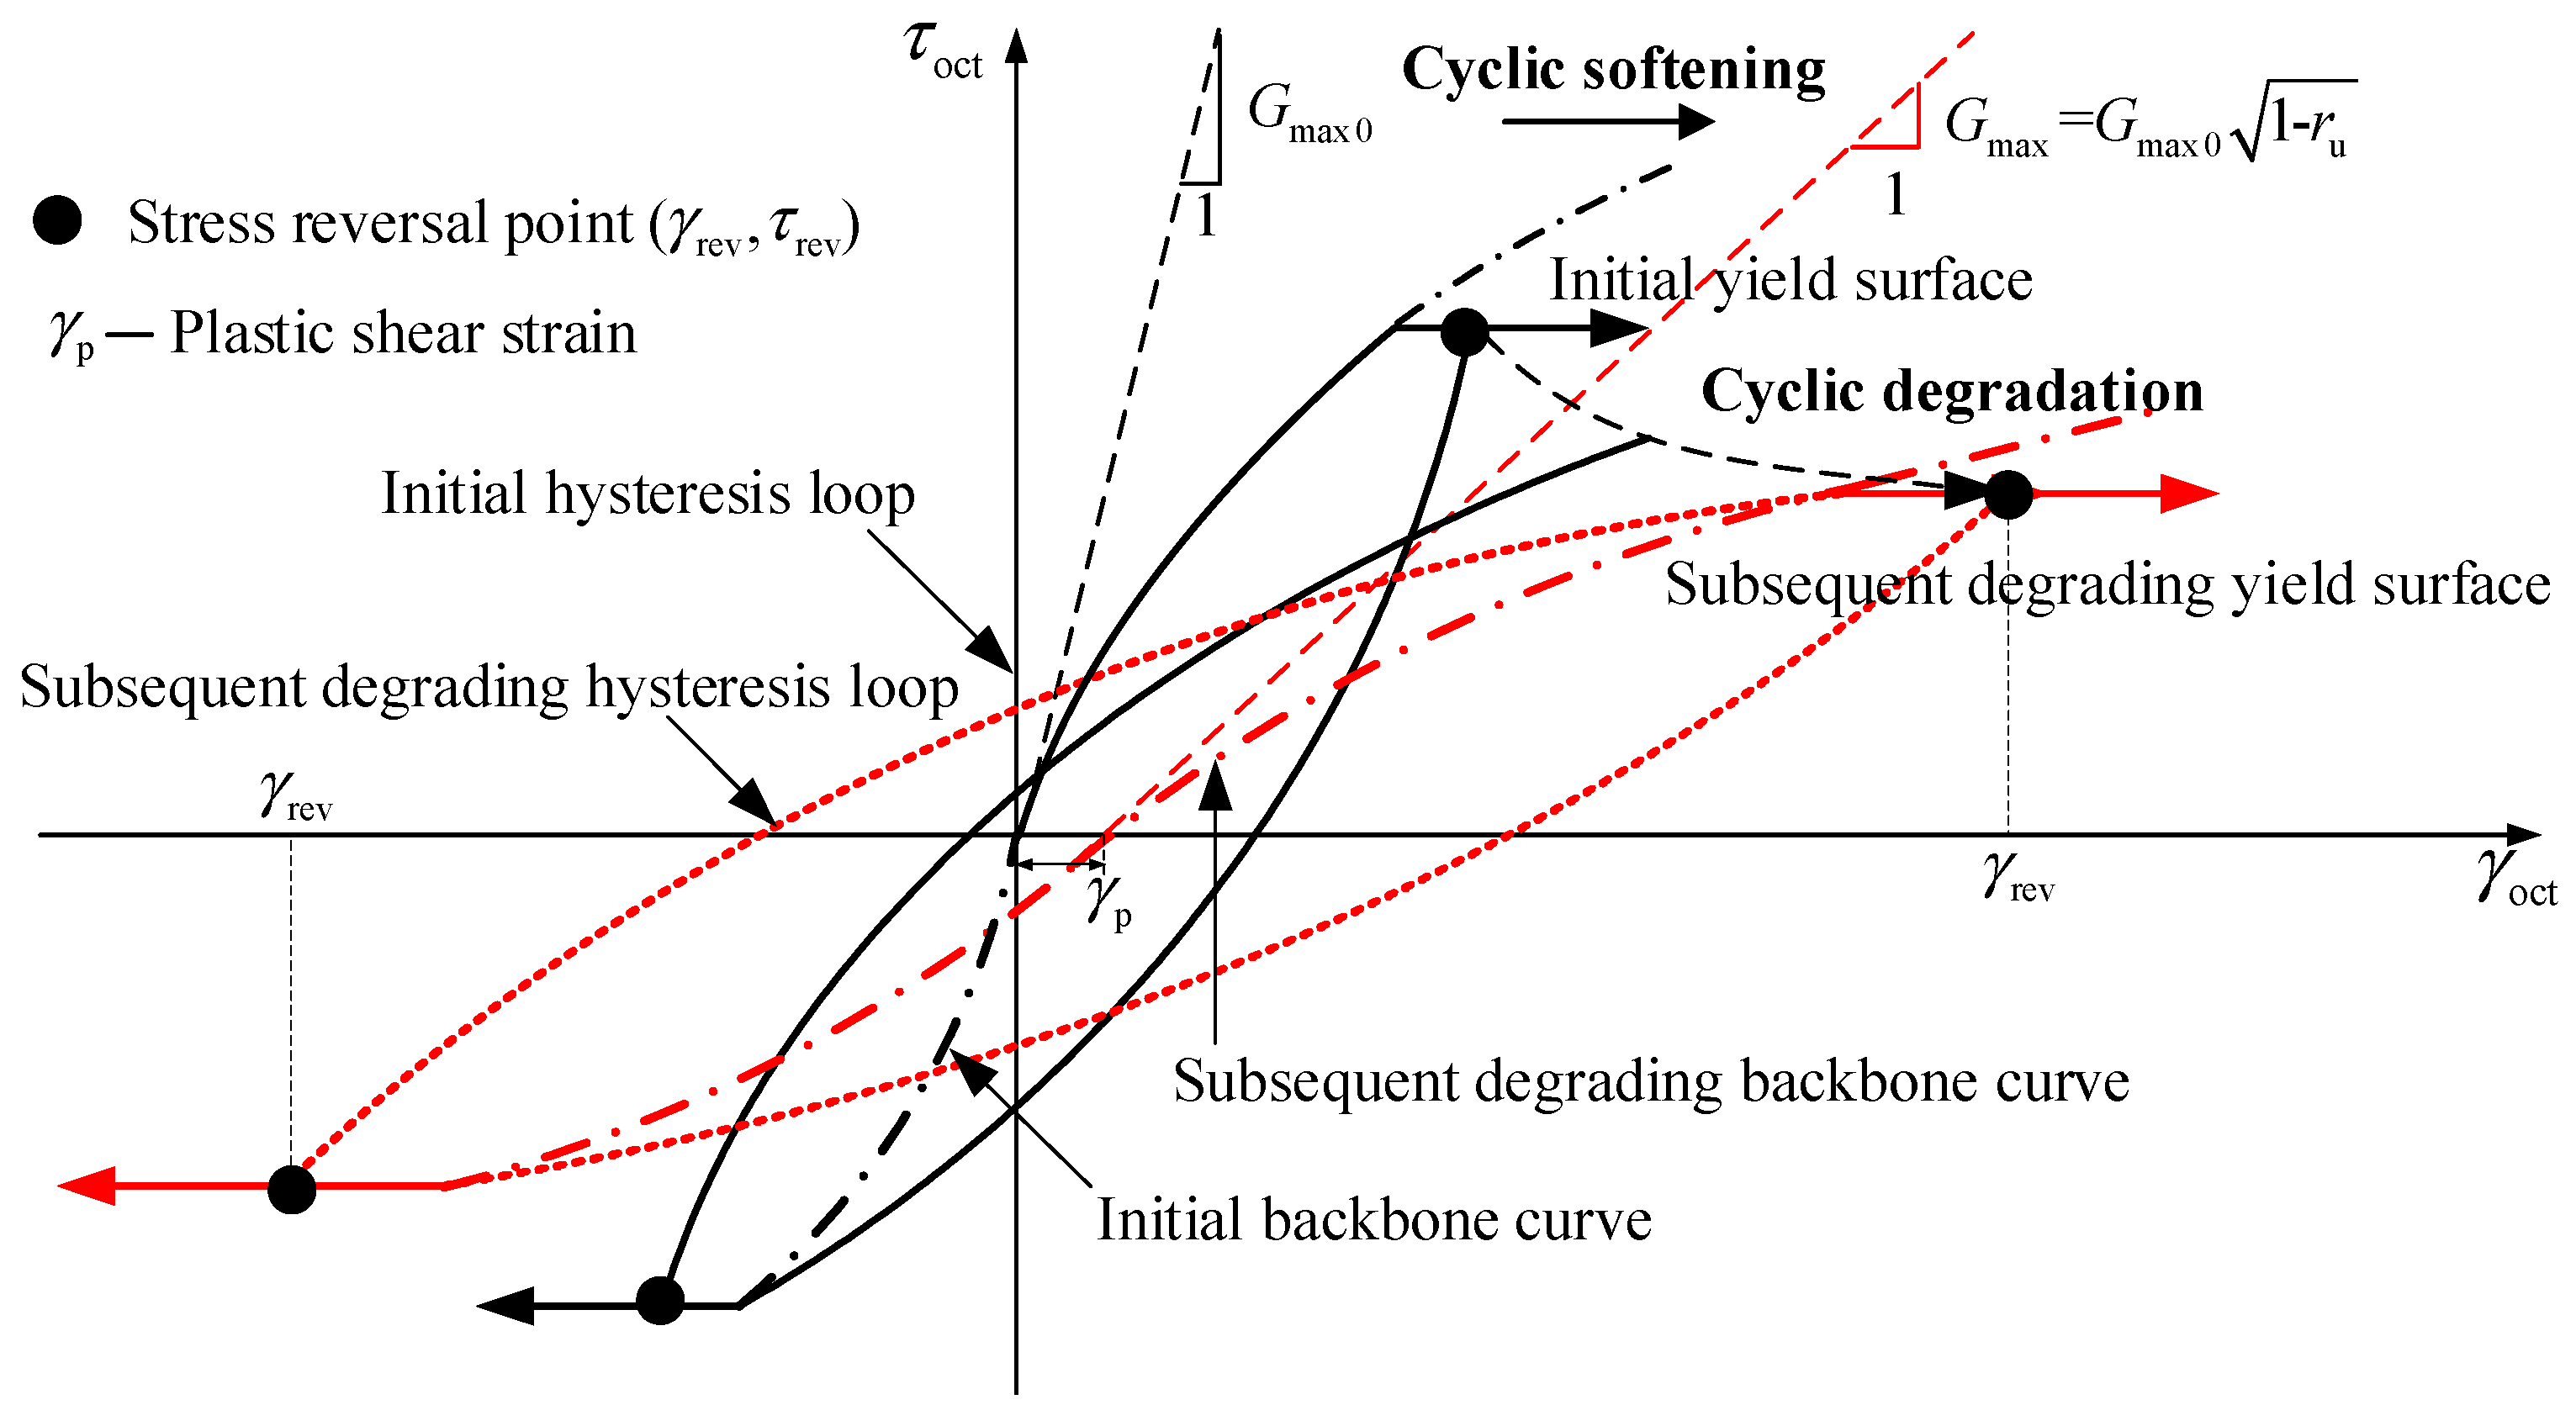
The Davidenkov skeleton curve extended by the Masing rule is used to describe the nonlinear stress–strain relationship of seabed soil in the elastic range. The skeleton curve is modified by the Mohr Coulomb failure criterion to describe the large plastic deformation when the seabed soil is close to liquefaction and after liquefaction [12,13,24]. The cyclic stress–strain relationship is shown in Figure 2.
A large number of laboratory tests show that the rearrangement of soil particles caused by cyclic shear is accompanied by the compression of soil skeleton and the rise of residual pore water pressure. The calculation of plastic volume strain per cycle is added to the constitutive model, as the source term of residual pore water pressure accumulation in Biot’s dynamic consolidation equation [25,26]:
Δ ε vd ( γ γ th ) C 3 = C 1 exp { C 2 ε vd ( γ γ th ) C 3 } ,
where γ = amplitude of cyclic shear strain, ε vd = accumulated volumetric strain from previous cycles, C1, C2, C3 = model constants for the soil in question and γth is volumetric threshold shear strain.
The softening phenomenon of soil under cyclic loading is described by the modulus degradation model and the residual pore water pressure is taken as the degradation parameter [27]:
G max t = G max 0 σ p p ¯ σ p = G max 0 1 r u ,
where G max t is the maximum shear modulus at time t and p ¯ is residual pore water pressure.

2.3. Method Validation

The combined action of earthquake and ocean wave–current loading will form an elliptical stress path in the deviator stress and shear stress space of the seabed soil element, which is similar to the stress path formed in the laboratory soil element test under bidirectional loading. Therefore, the effective stress method proposed in this paper is used to simulate the cyclic loading test of Nanjing fine sand under bidirectional loading to verify the effectiveness of the proposed method. The loading path of the cyclic loading test is shown in Figure 2, with a cyclic stress ratio CSR = 0.15, a/b = 1, β = 0. The relative density of the sample is Dr = 50%, the saturation weight γ = 19.2 KN/m2, the initial effective confining pressure is 100 kPa and the parameters used in the simulation are shown in Table 1.
Figure 3 shows the time history of excess pore water pressure obtained by the method proposed in this paper and the laboratory test using the automated hollow cylinder apparatus, as published in Zhao et al. [28]. One may note that the prediction results of the proposed method are in relatively good agreement with the laboratory test data. The deviation might be due to the fact that in the proposed model, the plastic volume strain and the residual excess pore water pressure are calculated at each cycle, not at each time step. However, the proposed method is able to predict the overall trend of the development of excess pore water pressure of the soil element under bidirectional loading. At the same time, the increase in the residual excess pore water pressure leads to the attenuation of soil skeleton modulus and the gradual amplification of oscillatory pore water pressure.

3. Numerical Analysis Model

3.1. Model Construction

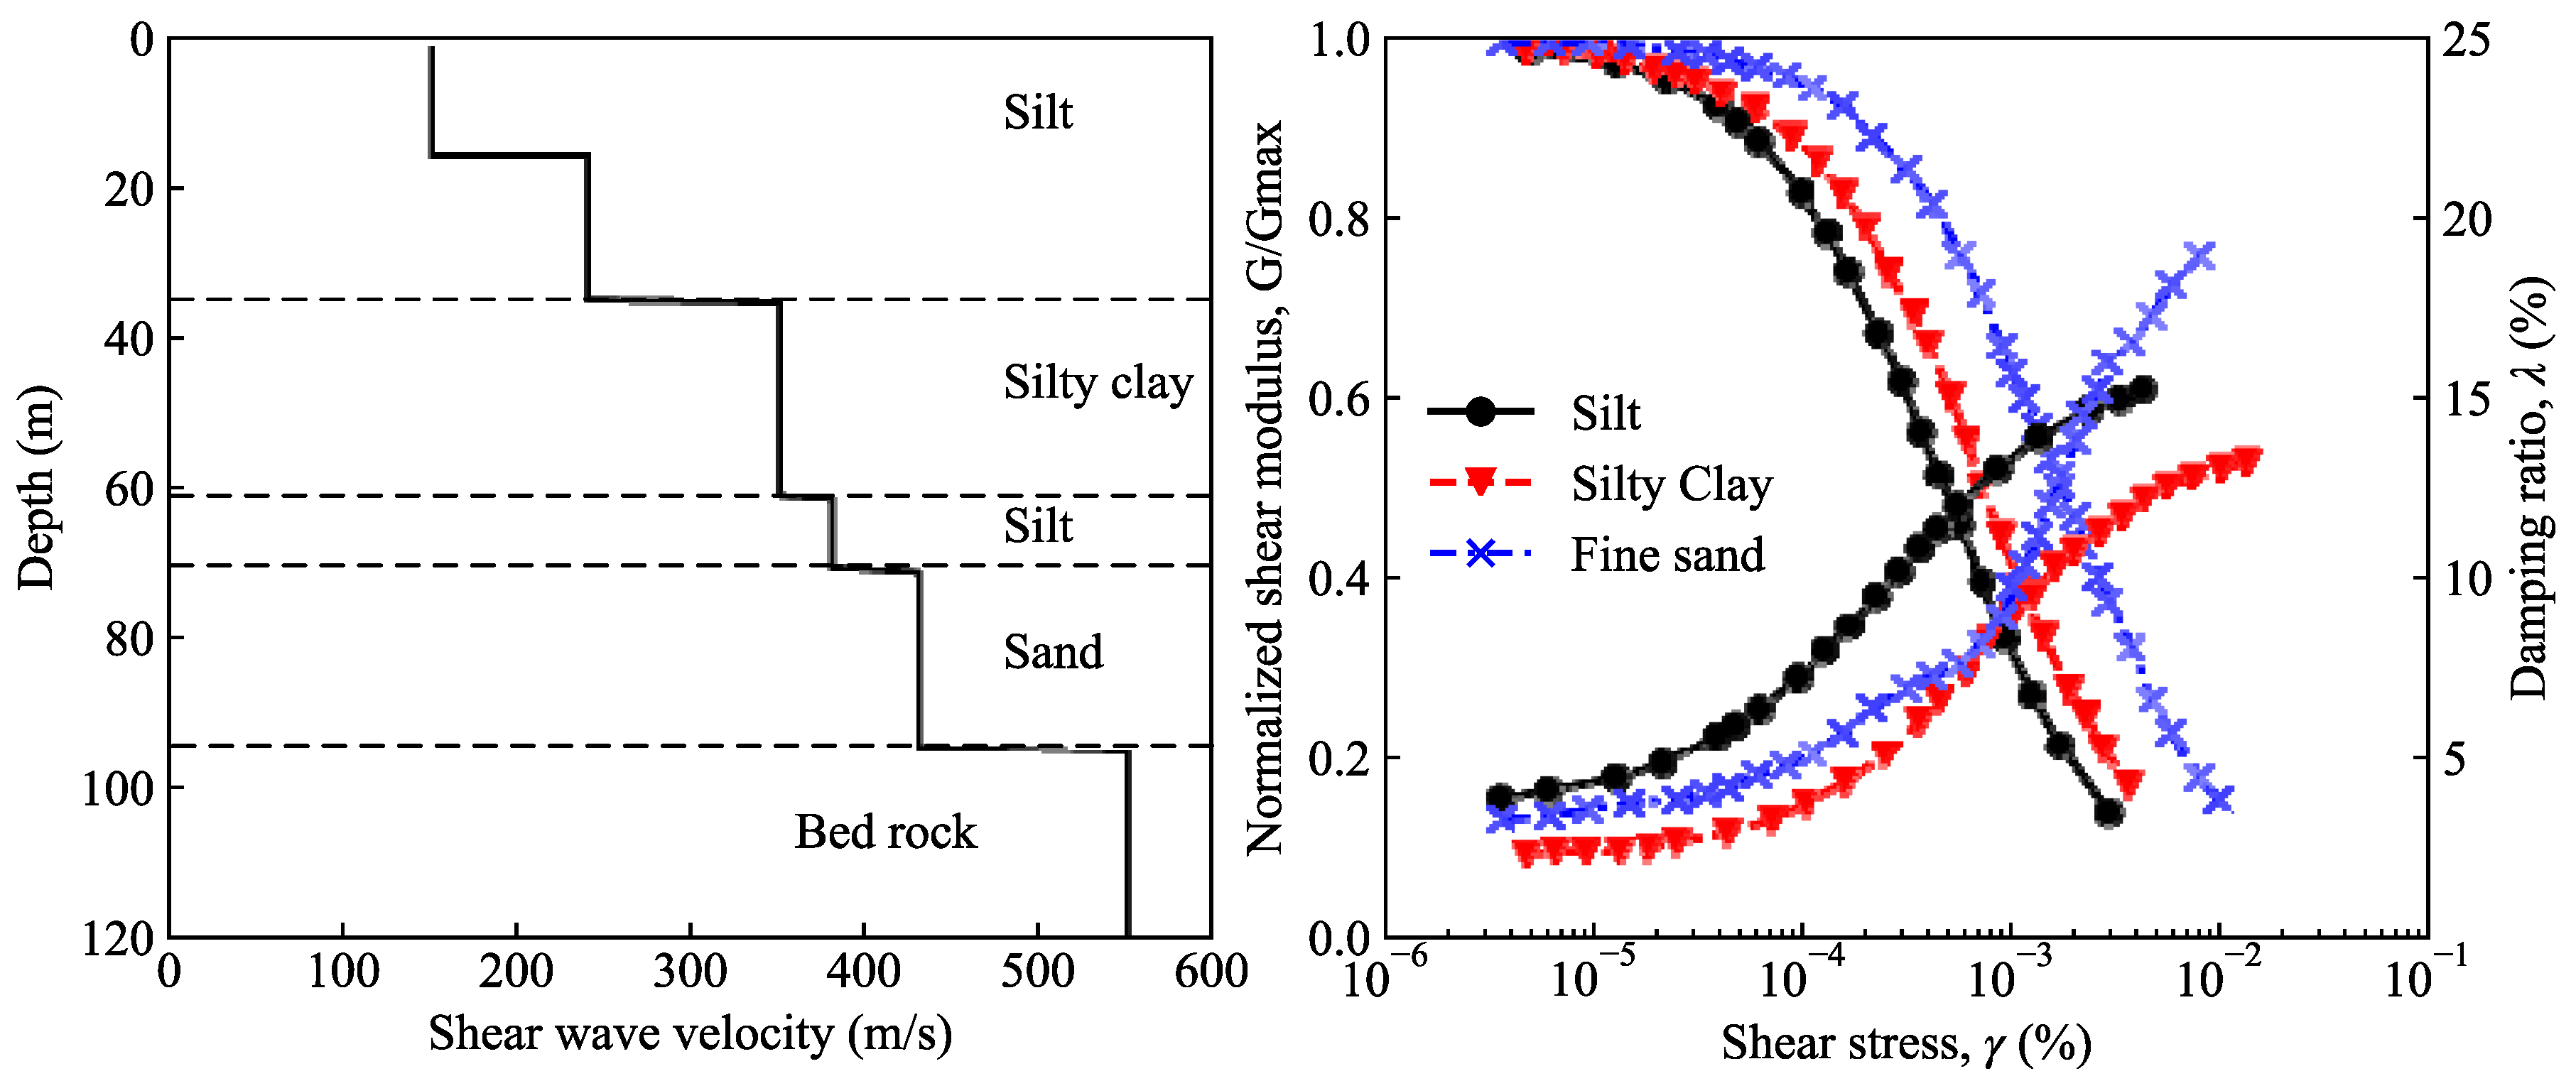
Taking a typical borehole in the Bohai Sea as the site condition, a schematic diagram of the borehole and the corresponding normalized modulus and damping ratio of soil are shown in Figure 4.
A section of submarine pipeline is selected for analysis and the seabed–pipeline interaction model is shown in Figure 5. The diameter of the pipeline is 2 m with a segment thickness of 0.2 m and a buried depth of 2 m. The carbon steel is adopted for the submarine pipeline. The depth of the trench is 3 m, the width of the bottom of the trench is 4 m and the slope ratio of the trench is 1:2. The four-node equal strain finite difference element is used to establish a uniform grid layout and the size of grid in the computational domain in the wave propagation direction is limited to one–eighth to one–tenth of the shortest wavelength, corresponding to the cut–off frequency of the seismic wave propagation in the soil layer [29]. Mesh sensitivity was performed carefully before the analysis to achieve the balance of computational efficiency and accuracy. In the current model, the grid size of the seabed soil is 1 m × 1 m and the grid size of the pipeline is 0.1 m × 0.1 m. In addition, the influence of the trench backfilling around the submarine pipeline on the seismic response of the pipeline is considered. The parameters of seabed soil and of the pipeline are, respectively, shown in Table 2 and Table 3. The assumed soil parameters are calibrated from the shear stiffness and damping ratio curves of natural marine sediments from a typical borehole at the Bohai Strait.
The zero-thickness interface element [30] is used to simulate the interaction between the pipeline and the surrounding seabed soil. The interface is controlled by normal stiffness, tangential stiffness and sliding parameters. There is no overlap between the seabed soil and the pipeline, and the relative sliding between the seabed soil and the pipeline occurs after the yielding of the interface. The normal stiffness and the tangential stiffness of the interface are much larger than those of the surrounding seabed soil. The normal and the tangential stiffness can be taken as 10–times the equivalent stiffness in the surrounding seabed soil [31], which can be expressed as follows:
K + 4 / 3 G Δ z min ,
where K and G are bulk modulus and shear modulus of the seabed soil, respectively, and Δ z min is the minimum width of the element near the interface.
According to Coulomb’s law of friction, when the shear stress at the interface element exceeds the friction resistance, relative sliding occurs:
| τ | σ n μ ,
where σ n is effective normal stress at the interface element and μ is the friction coefficient between the pipeline and surrounding seabed soil, which is 0.7 in the current study.
An artificial boundary composed of linear elastic spring and damper is used at the side and the bottom of the model to limit the size of the calculation area. The influence of dynamic response of the side boundary can be ignored when the horizontal distance between the side boundary and the structure is at least 10–times the width of the structure and the transverse width of the model is 200 m. The shear wave velocity greater than 500 m/s is taken as the seismic bedrock surface and the depth of the model is 100 m, with a critical damping ratio of 5%.

3.2. Model Input Selection

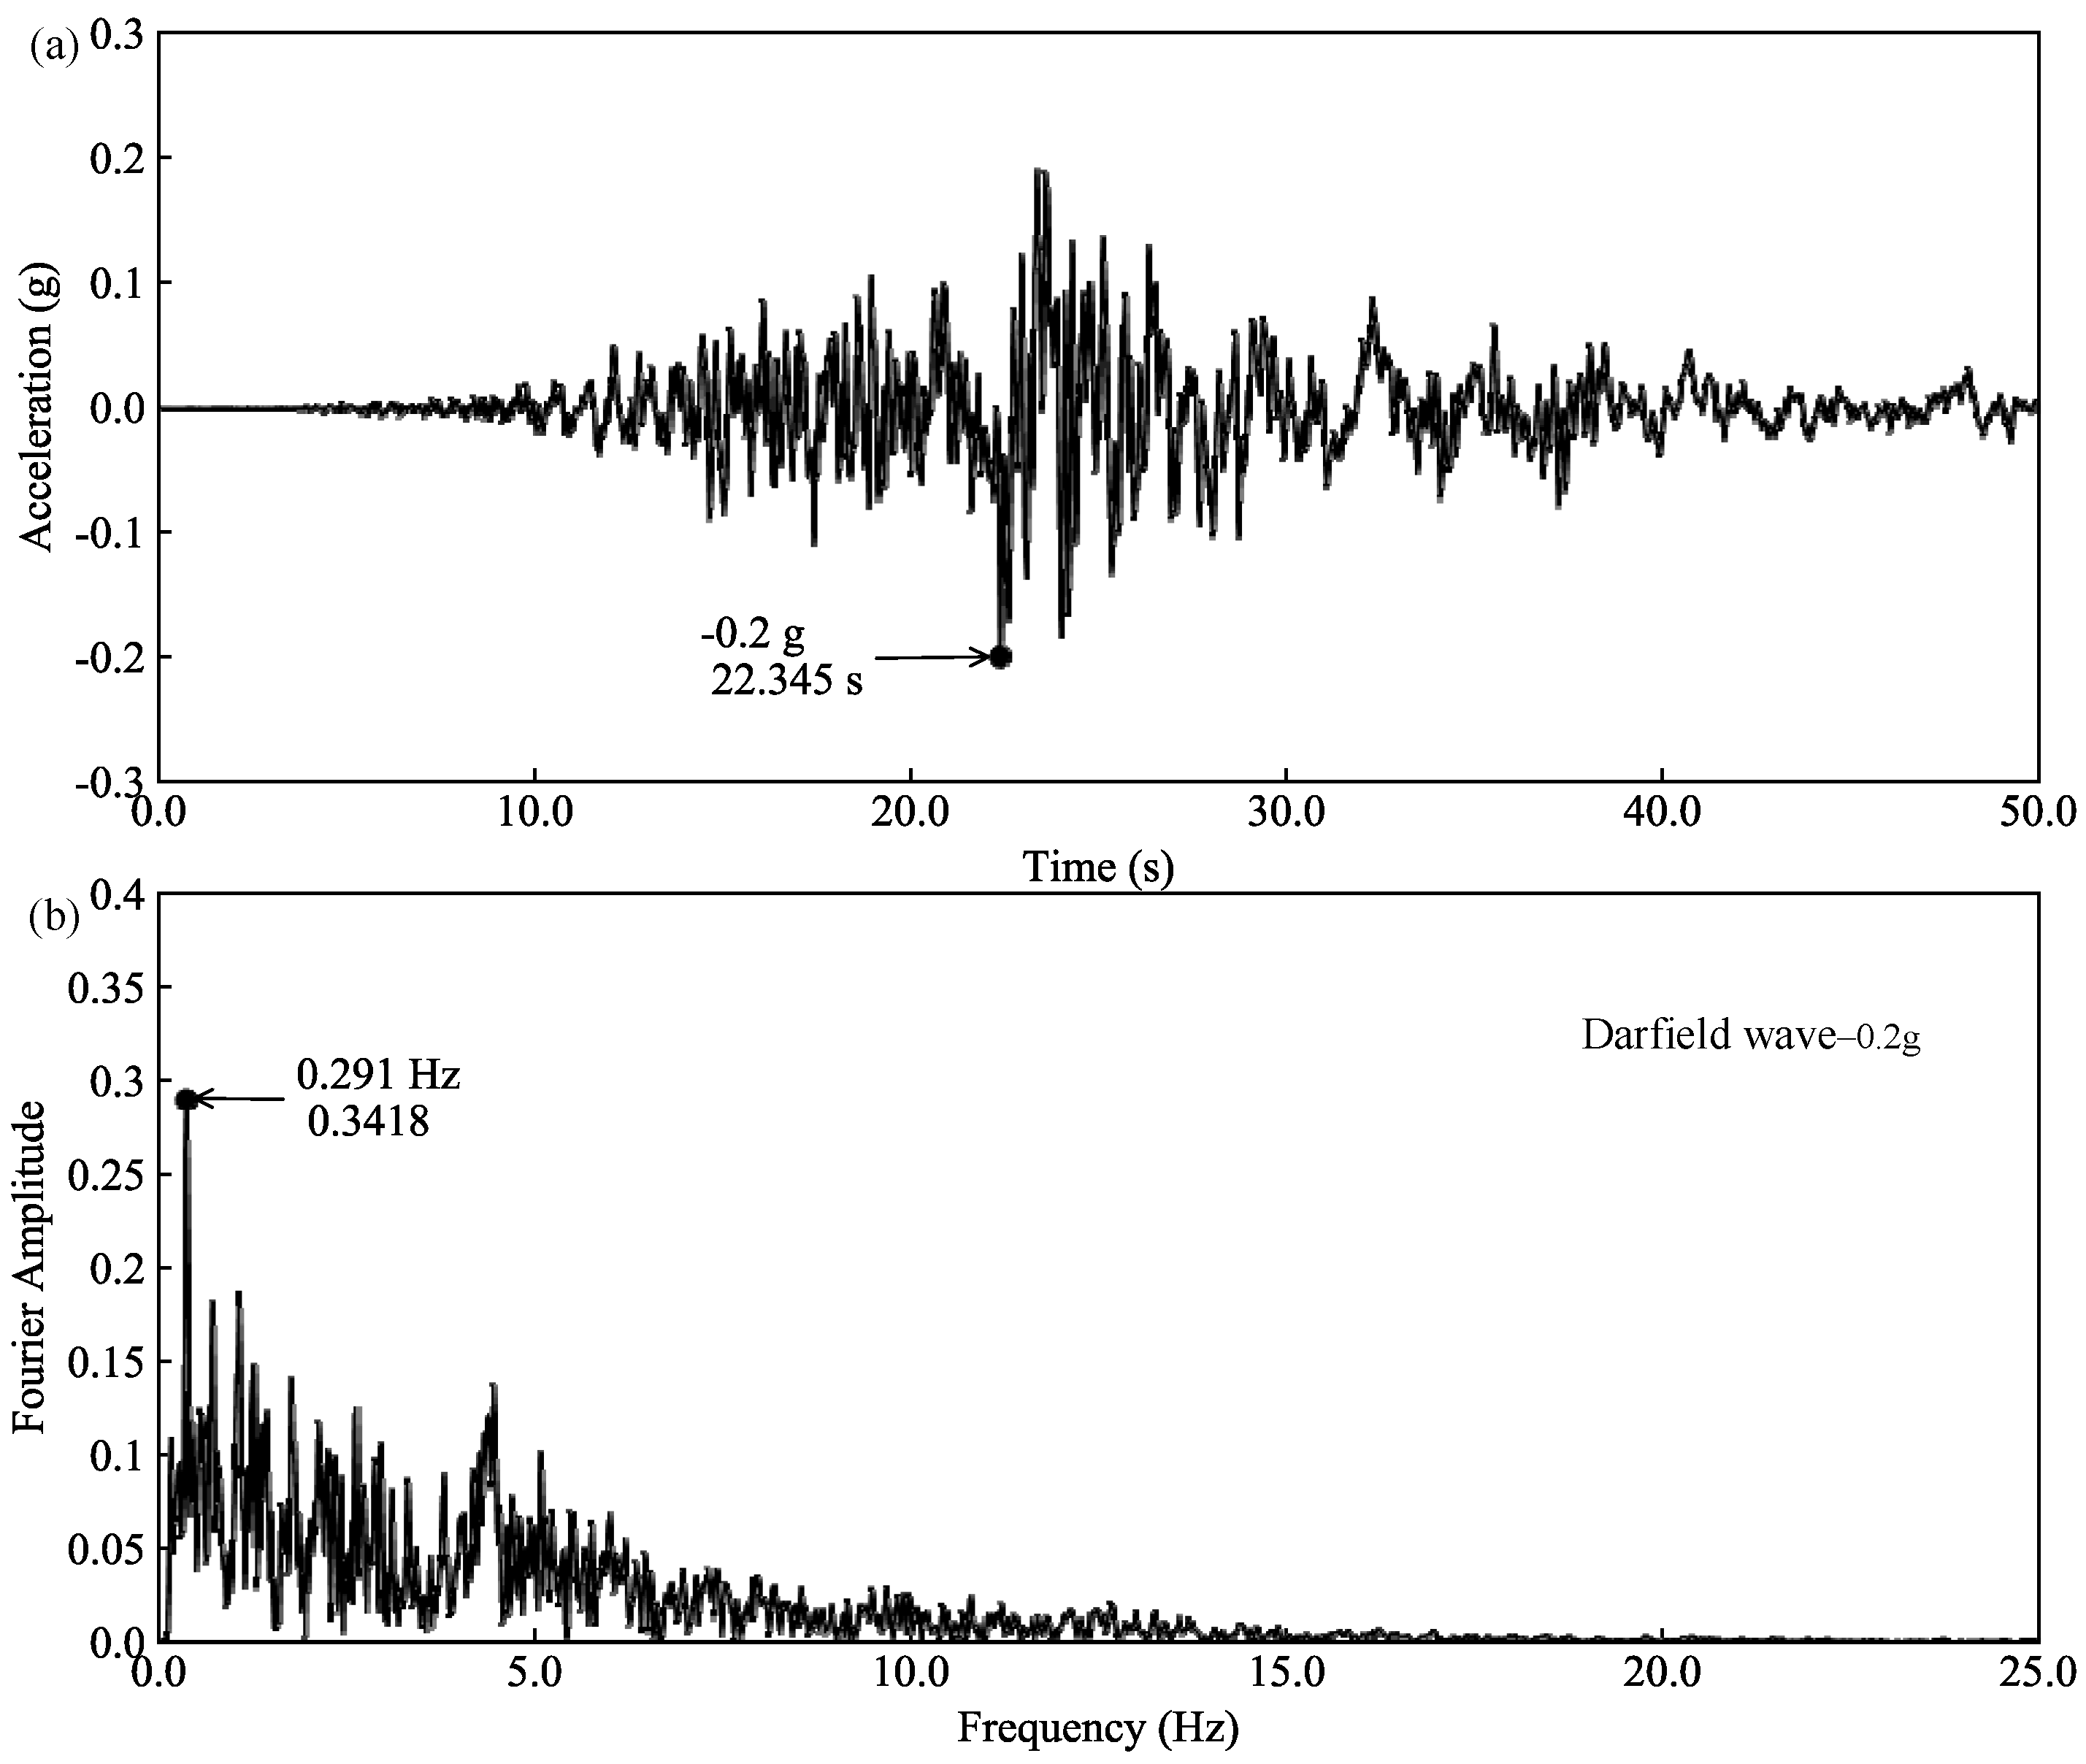
The actual recordings are considered to suitably represent the characteristics of near-field motions. Therefore, the ground motion time series of a real earthquake records with similar magnitude and epicenter distances of the historical earthquakes in Bohai strait, i.e., PRP station record of the 2010 Darfield earthquake, are selected to behave as the frequency spectral characteristics of input bedrock motions: the original acceleration time histories and spectral accelerations at a damping ratio of 5% from the records of the Darfield earthquake are shown in Figure 6, respectively.
The periodic wave and current loading are simulated by a periodic surface pressure at the seabed surface according to the potential flow theory. The third–order analytical solution by Hsu et al. [32] is applied to determine the periodic fluid pressure pb at the seabed surface, which can be written as follows:
P b = ρ f g H 2 cosh β d [ 1 ω 2 β 2 H 2 2 ( U 0 β ω 0 ) ] cos ( β x ω t ) + 3 ρ f H 2 8 { ω 0 ( ω 0 U 0 β ) 2 sinh 4 β d g β 3 sinh 2 β d } cos 2 ( β x ω t ) + 3 ρ f β H 3 ω 0 ( ω 0 U 0 β ) 512 ( 9 4 sinh 2 β d ) sinh 7 β d cos 3 ( β x ω t )
where β = wave number, ω = wave frequency, H = wave height due to wave–urrent interactions, d = water depth and U0 = current velocity. The dispersion equation is expressed by
ω = ω 0 + ( β H ) 2 ω 2 ,
where ω 0 = U 0 β + g β tanh β d
ω 2 = ( 9 + 8 sinh 2 β d + 8 sinh 4 β d ) 64 sinh 4 β d ( ω 0 U 0 β ) ,
If no current follows the wave (U0 = 0 m/s), the aforementioned analytical solution is reduced to the classic third–order solution of the nonlinear wave. The input parameters of ocean wave and current are given in Table 4.

4. Results and Discussion

In this section, special attention is paid to the detailed investigation of progressive liquefaction around the trenched pipeline (Section 4.1) and the phenomena occurring close to the pipeline–trench–seabed interface under seismic loading (Section 4.1). Section 4.2 attempts to interpret the mechanism of seismically induced liquefaction and uplift of the pipeline with backfilling trench.

4.1. Liquefaction Initiation of Seabed around the Trenched Pipeline

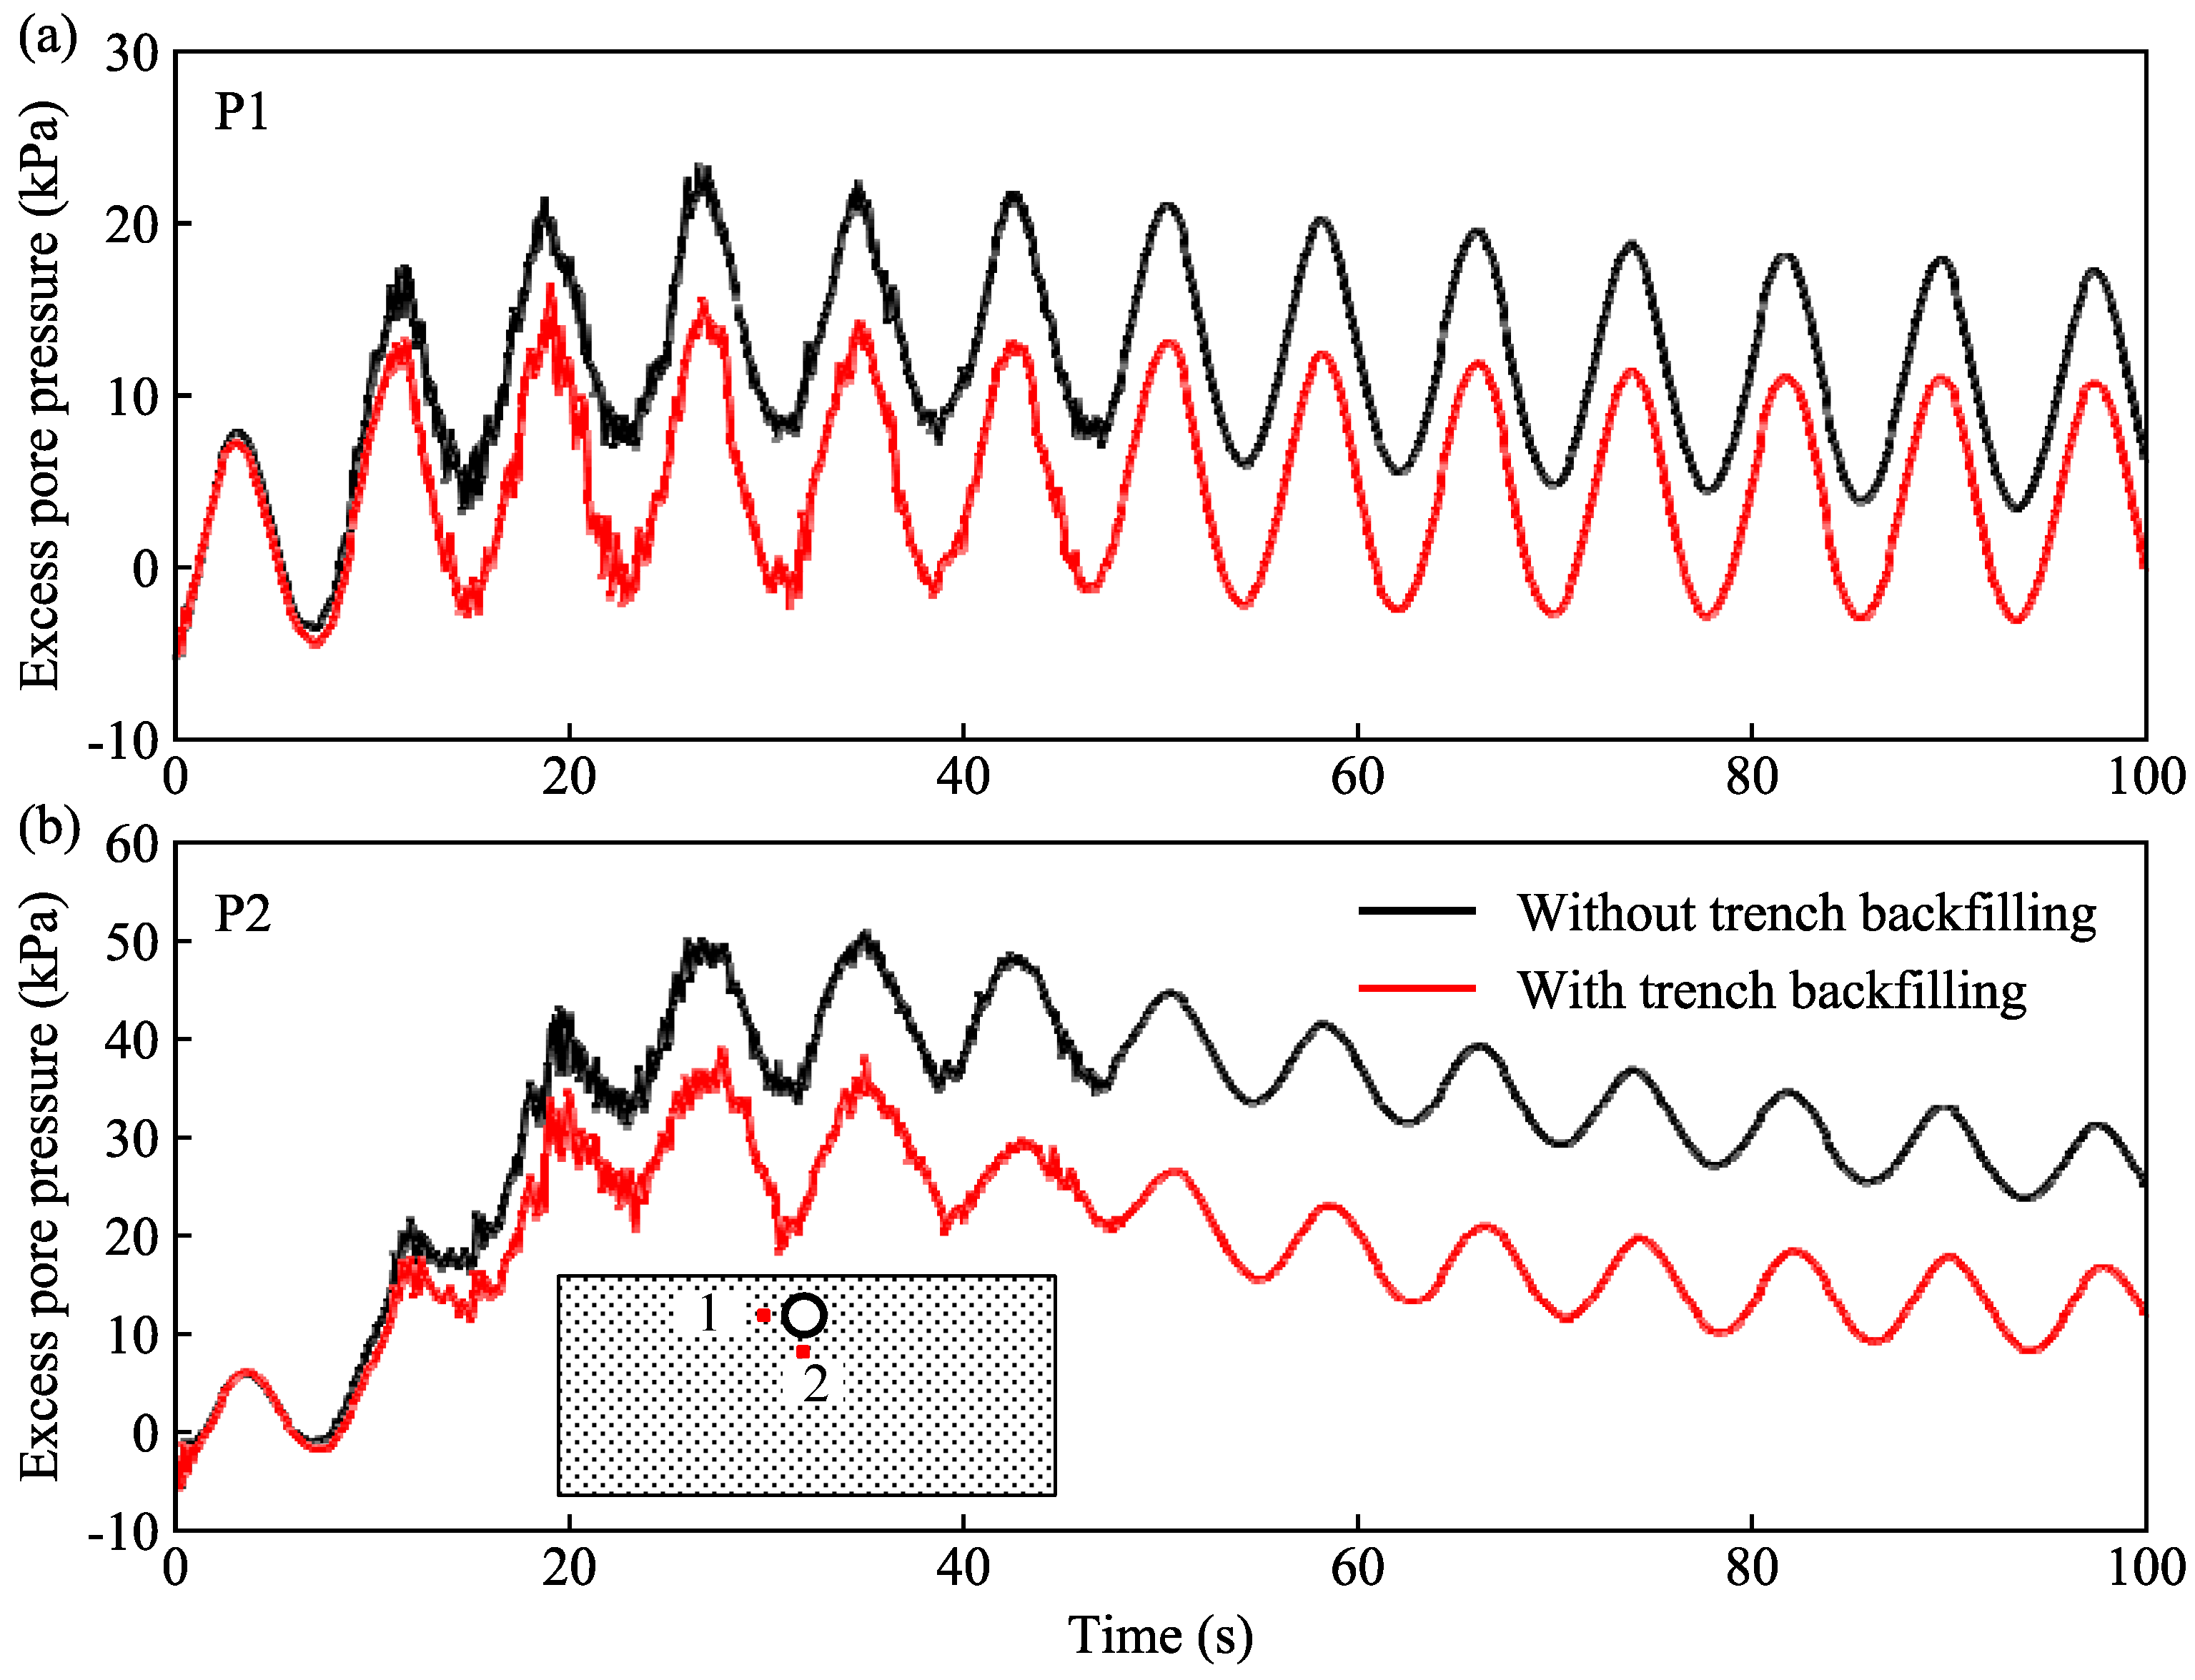
Figure 7 compares the entire buildup process of excess pore water pressure of the soil element at the side (P1) and bottom (P2) of the pipeline for the case with and without trench backfilling. Obviously, the ocean wave and current lead to intensive periodic oscillations of excess pore water pressure induced by seismic loading. Compared with the case without trench backfilling, the excess pore water pressures at P1 and P2 accumulate much more slowly and, eventually, reach a lower value for the case with trench backfilling. For the case without trench backfilling, the excess pore water pressure at P2 reaches 45 kPa at 25 s, which is much larger than that for the case with trench backfilling. The saturated soil under seismic loading is accompanied by the buildup and partial drainage of the excess pore water pressure and the high permeability of the trench backfilling further accelerates the drainage.
Figure 8 compares the progressive liquefaction process of the seabed around the pipeline for the case with and without trench backfilling. Liquefaction first occurs at the seabed surface and gradually spreads downward and finally wraps the pipeline. Residual and transient liquefaction occur simultaneously under seismic and ocean wave and current loading. Transient liquefaction occurs near the seabed surface at the ocean wave crest and moves with the propagation of the ocean wave. Following seismic loading, due to the compaction of soil skeleton and the free drainage condition of the seabed surface, the excess pore water pressure in the seabed begins to dissipate, resulting in obvious reconsolidation phenomenon. For the case with trench backfilling, no liquefaction occurs in the trench backfilling around the pipeline and the maximum excess pore water pressure ratio is in a range from 0.2 to 0.4. Meanwhile, no liquefaction occurs in the seabed soil under the pipeline for the case with trench backfilling and the maximum excess pore water pressure ratio is about 0.6 to 0.8. Thus, the stability of the pipeline is greatly affected by the surrounding soil and the existence of trench backfilling is conducive to the stability of the pipeline.
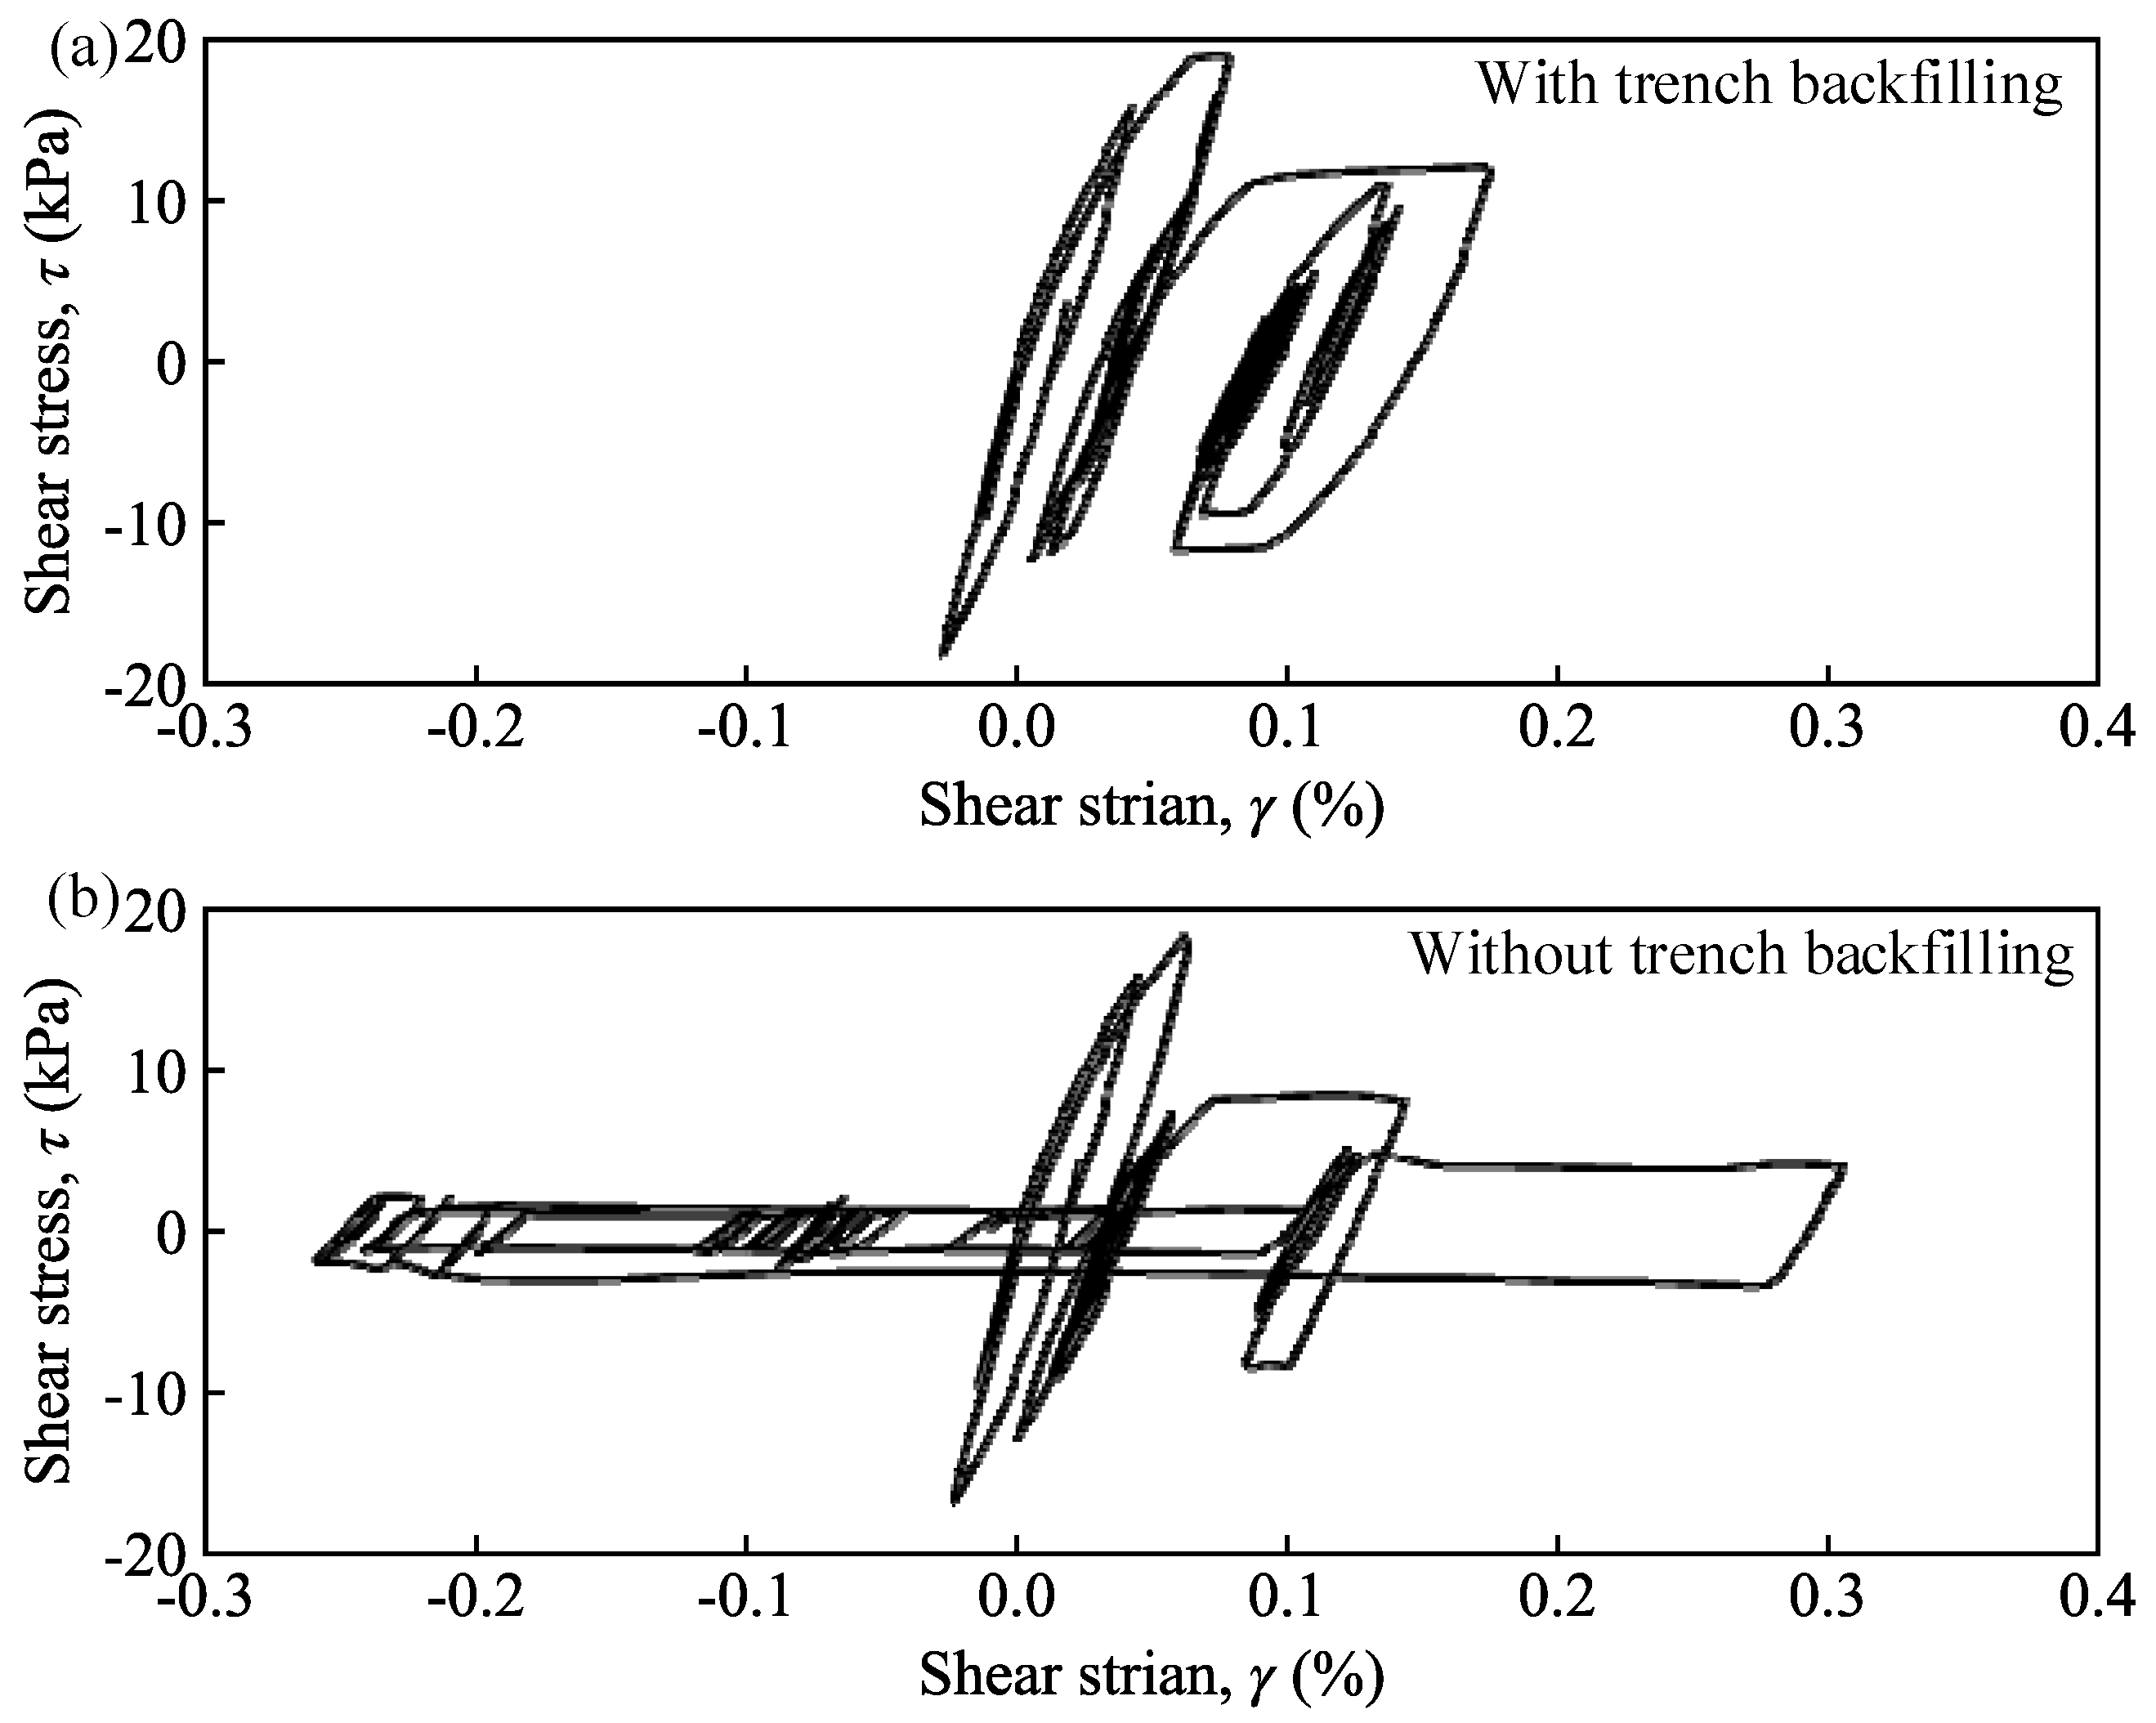
Seismically induced soil liquefaction leads to large deformation and plastic flow of soil around the pipeline. Figure 9 shows the shear stress–strain curve at the side (P1) of the pipeline for the case with and without trench backfilling. The ultimate shear strain under seismic loading without trench backfilling reaches 0.3%, which is two–times the case with trench backfilling. This is because no liquefaction occurs around the pipeline under the case with trench backfilling. When liquefaction occurs, low effective confining stress leads to the rapid reduction in the shear modulus of the soil, resulting in large plastic deformation.

4.2. Liquefaction-Induced Uplift of the Pipeline with Backfilling Trench

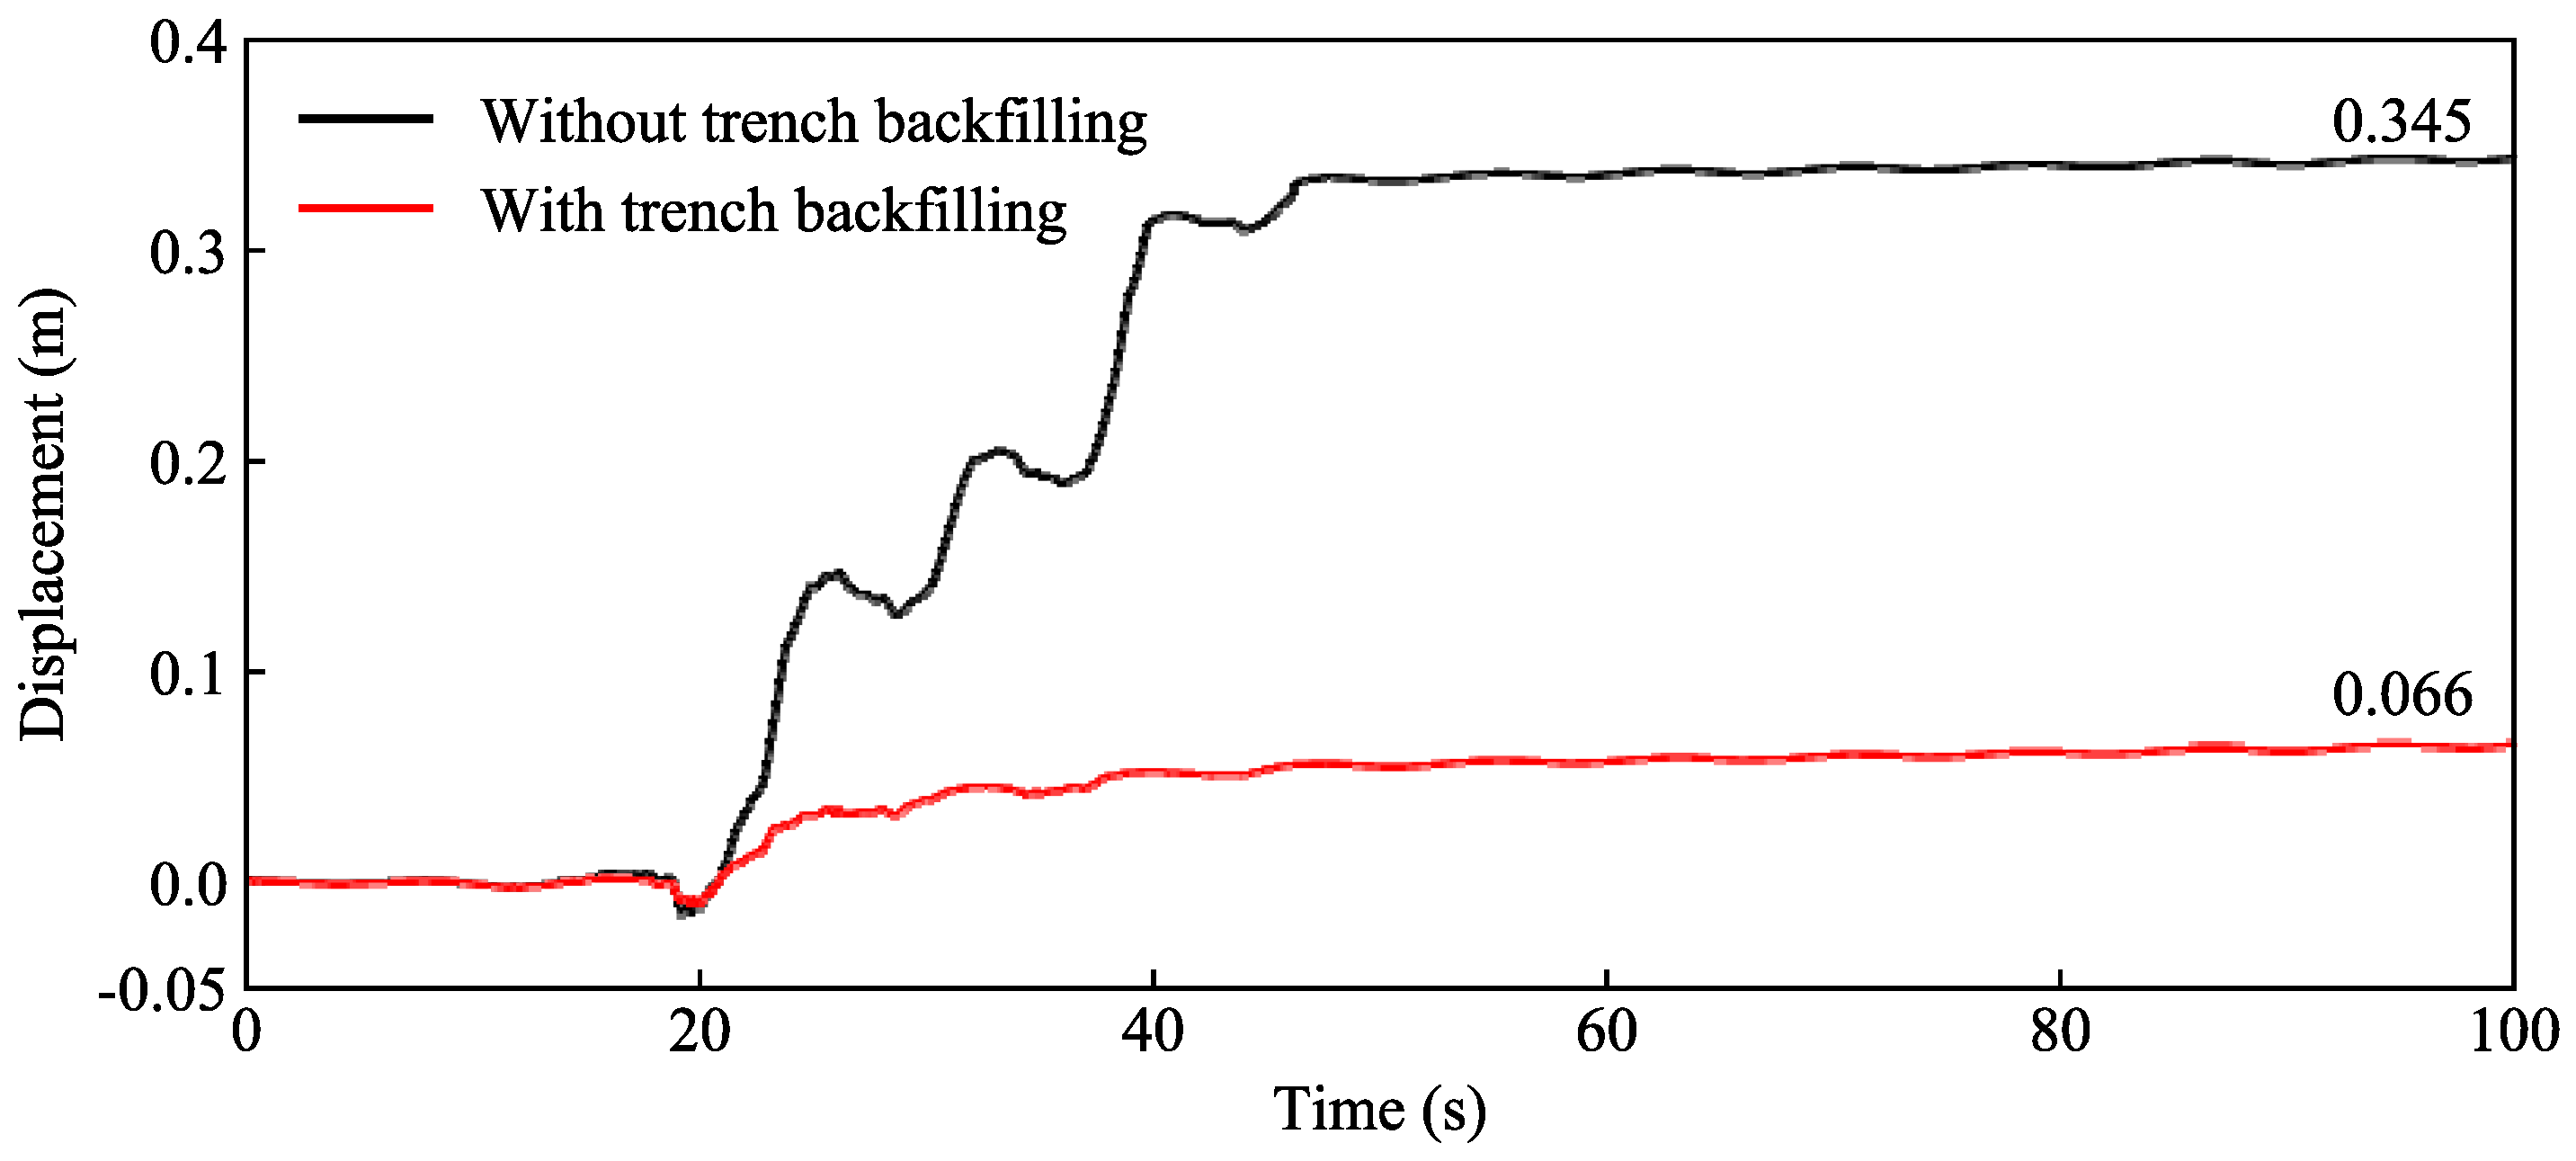
Figure 10 compares the time history of the pipeline uplift for the case with and without trench backfilling. The accumulation of excess pore water pressure and residual liquefaction of seabed around the pipeline leads to the uplift of the pipeline. The uplift of the pipeline occurs at 20 s and begins at the seabed liquefaction around the pipeline. Obviously, the uplift of the pipeline lags behind the accumulation of excess pore water pressure. For the case without trench backfilling, the maximum uplift is 34.5 cm and the pipeline suffers periodic oscillation during the uplift, which is caused by the wave and current propagation along the seabed. This periodic oscillation has adverse effects on the stability of the pipeline. The existence of trench backfilling reduces the uplift of the pipeline, which is about 6.6 cm. In addition, the periodic oscillation caused by wave and current propagation is also greatly relieved. It should be noted that once a strong earthquake occurs in the Bohai strait, the submarine pipelines may suffer severe damage due to the extensive uplift, leading to interruption of oil and gas transportation, oil and gas leakage, extensive economic losses and serious ecological problems.
A major finding in this study is that the current practice in seismic response analysis, neglecting the effect of trench backfilling on the seabed liquefaction and pipeline uplift may not always hold true. The effect has major consequences on the over–assessment of the development of the pipeline uplift at liquefiable seabed, thereby leading to conservative design requirements of the trenched marine structures. The proposed model can describe marine sediments around a trenched pipeline well up to the occurrence of liquefaction under cyclic loading, which can provide an efficient tool to evaluate the earthquake–related damage severity of the pipelines buried in the liquefiable seabed.

5. Conclusions

The Davidenkov skeleton curve associated with the Masing rule and Mohr–Coulomb failure criterion is used to describe the stress–strain relationship of seabed soil and the calculation of plastic volume strain is added as the source term of the accumulation of excess pore water pressure in Biot’s dynamic consolidation equation. The seabed liquefaction and the uplift of the pipeline under seismic loading are analyzed, considering the ocean wave and current propagation. The conclusions are as follows:
(1)
Seismic loading leads to a rise in excess pore water pressure and liquefaction in seabed soil and the wave and current contributes to the periodic oscillation in the rise in excess pore water pressure in the seabed soil. Following seabed liquefaction, the pore water flows upward and the seabed is, thereby, reconsolidated.
(2)
Compared with the case without trench backfilling, the excess pore water pressure rises more slowly in trench backfilling under seismic loading and no liquefaction occurs. The liquefaction of seabed soil at the pipeline bottom is mitigated due to the existence of trench backfilling.
(3)
The seismically induced liquefaction leads to the uplift of the pipeline. The uplift of the pipeline lags behind the accumulation of excess pore water pressure at the surrounding seabed soil, which occurs following seabed liquefaction.
(4)
The existence of trench backfilling reduces the uplift of the pipeline and eliminates the oscillation caused by ocean wave and current during the uplift process.
Once a strong earthquake occurs in the Bohai strait, the submarine pipelines may suffer severe damage, leading to an interruption in oil and gas transportation, oil and gas leakage, extensive economic losses and serious ecological problems. The proposed model can describe marine sediments around a trenched pipeline well up to the occurrence of liquefaction under cyclic loading, which can provide an efficient tool to evaluate the earthquake-related damage severity of the pipelines buried in the liquefiable seabed.

Author Contributions

Conceptualization, Q.W. and J.B.; methodology, J.B.; software, W.H.; validation, Q.W. and Q.L.; formal analysis, Q.W. and W.H.; investigation, Q.W.; resources, Z.L. and K.Z.; data curation, W.H.; writing—original draft preparation, Q.W.; writing—review and editing, Q.L. and K.Z.; supervision, J.B.; project administration, Z.L. and K.Z.; funding acquisition, Q.L., Z.L. and K.Z. All authors have read and agreed to the published version of the manuscript.

Funding

This research was funded by the National Natural Science Fund of China, grant number 51978335, 51668002 and 52168044.

Institutional Review Board Statement

Not applicable.

Informed Consent Statement

Not applicable.

Data Availability Statement

Not applicable.

Acknowledgments

The authors are truly grateful for the financial support from the Scientific Research Fund of Institute of Engineering Mechanics, China Earthquake Administration (2019D05) and the National Natural Science Fund of China (51978335, 52168044, 51668002) and also grateful to the High Performance Computing Center of Nanjing Tech University for supporting the computational resources.

Conflicts of Interest

The authors declare no conflict of interest.

References

  1. Cheng, A.H.D.; Liu, P.L.F. Seepage force on a pipeline buried in a poroelastic seabed under wave loading. Appl. Ocean Res. 1986, 8, 22–32. [Google Scholar] [CrossRef]
  2. Dunn, S.L.; Vun, P.L.; Chan, A.H.C.; Damgaard, J.S. Numerical modelling of wave-induced liquefaction around pipelines. J. Waterw Port. Coast. Ocean Eng. 2006, 132, 276–288. [Google Scholar] [CrossRef]
  3. Gao, F.P.; Yan, S.; Yang, B.; Luo, C. Steady flow-induced instability of a partially embedded pipeline: Pipe-soil interaction mechanism. Ocean Eng. 2011, 38, 934–942. [Google Scholar] [CrossRef] [Green Version]
  4. Magda, W. Wave-induced uplift force acting on a submarine buried pipeline in a compressible seabed. Ocean Eng. 1997, 24, 551–576. [Google Scholar] [CrossRef]
  5. Sawicki, A.; Mierczyński, J. Developments in modelling liquefaction of granular soils caused by cyclic loads. Appl. Mech. Rev. 2006, 59, 91–106. [Google Scholar] [CrossRef]
  6. Sumer, B.M.; Truelsen, C.; Fredsøe, J. Liquefaction around pipelines under waves. J. Waterw Port. Coast. Ocean Eng. 2006, 132, 266–275. [Google Scholar] [CrossRef]
  7. Sumer, B.M. Liquefaction around Marine Structures: (With CD-ROM); World Scientific: London, UK, 2014. [Google Scholar]
  8. Teh, T.C.; Palmer, A.C.; Damgaard, J.S. Experimental study of marine pipelines on unstable and liquefied seabed. Coast. Eng. 2003, 50, 1–17. [Google Scholar] [CrossRef]
  9. Teh, T.C.; Palmer, A.C.; Bolton, M.D.; Damgaard, J. Stability of submarine pipelines on liquefied seabeds. J. Waterw Port. Coast. Ocean Eng. 2006, 132, 244–251. [Google Scholar] [CrossRef] [Green Version]
  10. Ulker, M.; Rahman, M.S.; Guddati, M.N. Wave-induced dynamic response and instability of seabed around caisson breakwater. Ocean Eng. 2010, 37, 1522–1545. [Google Scholar]
  11. Zhao, H.Y.; Jeng, D.S. Accumulated Pore Pressures around Submarine Pipeline Buried in Trench Layer with Partial Backfills. J. Eng. Mech. 2016, 142, 04016042. [Google Scholar] [CrossRef]
  12. Zhao, K.; Xiong, H.; Chen, G.X.; Zhao, D.F.; Chen, W.Y.; Du, X.L. Wave-induced dynamics of marine pipelines in liquefiable seabed. Coast. Eng. 2018, 140, 100–113. [Google Scholar] [CrossRef]
  13. Zhao, K.; Wang, Q.Z.; Chen, S.; Zhuang, H.Y.; Chen, G.X. Dynamic response of pipelines in liquefiable seabed under nature loadings: Waves and currents. Ocean Eng. 2021, 230, 109051. [Google Scholar] [CrossRef]
  14. Zhao, K.; Zhu, S.D.; Bai, X.X.; Wang, Q.Z.; Chen, S.; Zhuang, H.Y.; Chen, G.X. Seismic response of immersed tunnel in liquefiable seabed considering ocean environmental loads. Tunn. Undergr. Space Technol. 2021, 115, 104066. [Google Scholar] [CrossRef]
  15. Nath, B.; Soh, C.H. Transverse seismic response analysis of offshore pipelines in proximity to the sea-bed. Earthq. Eng. Struct. Dyn. 1978, 6, 569–583. [Google Scholar] [CrossRef]
  16. Datta, T.K.; Mashaly, E.A. Seismic Response of Buried Submarine Pipelines. J. Energy Resour. Technol. 1988, 110, 208–218. [Google Scholar] [CrossRef]
  17. Yan, Y.F.; Cheng, L.F. The Finite Element Analysis on the Submarine Pipeline under the Seismic Loading. Adv. Mater. Res. 2012, 1700, 490–495. [Google Scholar] [CrossRef]
  18. Deng, Y.L.; Bian, Y.; Lei, F. Seismic Response Analysis of Free Long-Span Submarine Flexible Pipelines under Earthquakes. In Applied Mechanics and Materials; Trans Tech Publications Ltd.: Stafa-Zurich, Switzerland, 2014; Volume 580, pp. 1704–1707. [Google Scholar]
  19. Luan, M.T.; Zhang, X.L.; Yang, Q.; Guo, Y. Numerical analysis of liquefaction of porous seabed around pipeline fixed in space under seismic loading. Soil Dyn. Earthq. Eng. 2009, 29, 855–864. [Google Scholar]
  20. Li, B.; Wang, F.M.; Fang, H.Y.; Yang, K.J.; Zhang, X.J.; Ji, Y.T. Experimental and numerical study on polymer grouting pretreatment technology in void and corroded concrete pipes. Tunn. Undergr. Space Technol. 2021, 113, 103842. [Google Scholar] [CrossRef]
  21. Miao, Y.; He, H.; Liu, H.; Wang, S.Y. Reproducing ground response using in-situ soil dynamic parameters. Earthq. Engng. Struct. Dyn. 2022, 51, 2449–2465. [Google Scholar] [CrossRef]
  22. Wang, S.Y.; Zhuang, H.Y.; Zhang, H.; He, H.J.; Jiang, W.P.; Yao, E.L.; Ruan, B.; Wu, Y.X.; Miao, Y. Near-surface softening and healing in eastern Honshu associated with the 2011 magnitude-9 Tohoku-Oki Earthquake. Nat. Commun. 2021, 12, 1215. [Google Scholar] [CrossRef] [PubMed]
  23. Zhao, K.; Wang, Q.Z.; Chen, Q.; Zhuang, H.Y.; Chen, G.X. Simplified effective stress modeling of shear wave propagation in saturated granular soils. Géotechnique Lett. 2021, 11, 2045–2543. [Google Scholar] [CrossRef]
  24. Zhao, K.; Wang, Q.Z.; Zhuang, H.Y.; Li, Z.Y.; Chen, G.X. A fully coupled flow deformation model for seismic site response analyses of liquefiable marine sediments. Ocean Eng. 2022, 251, 111144. [Google Scholar] [CrossRef]
  25. Byrne, P.M. A cyclic shear–volume coupling and pore pressure model for sand. In Proceedings of the 2nd International Conference on Recent Advances in Geotechnical Earthquake Engineering and Soil Dynamics, St. Louis, MI, USA, 3 January 1991; pp. 47–55. [Google Scholar]
  26. Chen, G.X.; Zhao, D.F.; Chen, W.Y.; Juang, C.H. Excess Pore-Water Pressure Generation in Cyclic Undrained Testing. J. Geotech. Geoenviron. Eng. 2019, 145, 7. [Google Scholar] [CrossRef]
  27. Ishihara, K. Liquefaction and flow failure during earthquakes. Géotechnique 1993, 43, 351–415. [Google Scholar] [CrossRef]
  28. Zhao, K.; Qin, Y.; Lu, Q.R.; Chen, W.Y.; Zhuang, H.Y.; Chen, G.X. Cyclic resistance of saturated silt under wave-induced non-proportional loading. Appl. Ocean Res. 2020, 102, 102296. [Google Scholar] [CrossRef]
  29. Chen, G.X.; Ruan, B.; Zhao, K.; Chen, W.Y.; Zhuang, H.Y.; Du, X.L.; Juang, C.H. Nonlinear response characteristics of undersea shield tunnel subjected to strong earthquake motions. J. Earthq. Eng. 2020, 24, 351–380. [Google Scholar] [CrossRef]
  30. Day, R.A.; Potts, D.M. Zero thickness interface elements—Numerical stability and application. Int. J. Numer. Anal. Methods Geomech. 1994, 18, 689–708. [Google Scholar] [CrossRef]
  31. Itasca Flac—Fast Lagrangian Analysis of Continua; Version 6; Itasca Consulting Group, Inc.: Minneapolis, MI, USA, 2009.
  32. Hsu, H.C.; Chen, Y.Y.; Hsu, J.R.C.; Tseng, W.J. Nonlinear water waves on uniform current in lagrangian coordinates. J. Nonlinear Math. Phys. 2009, 16, 47–61. [Google Scholar] [CrossRef]
Figure 1. Distribution of major faults and historical strong earthquakes in the Bohai Sea.
Sustainability 14 12825 g001
Figure 2. Schematic illustration of the cyclic stress–strain behavior of soil skeleton including.
Sustainability 14 12825 g002
Figure 3. Comparison between the measured and predicted excess pore pressure time history.
Sustainability 14 12825 g003
Figure 4. Soil profile, shear wave velocity profile and shear modulus reduction and damping ratio curves for the marine sediments from a typical borehole at the Bohai Strait.
Sustainability 14 12825 g004
Figure 5. Sketch of the pipeline–seabed interaction under seismic loading with an ocean wave and current.
Sustainability 14 12825 g005
Figure 6. The original records of the 2010 Darfield earthquake employed as input motions.
Sustainability 14 12825 g006
Figure 7. Excess pore water pressure time histories near the pipeline under seismic loading with and without trench backfilling; (a) at the side of the pipeline; (b) at the bottom of the pipeline.
Sustainability 14 12825 g007
Figure 8. Liquefaction progression under seismic loading with and without trench backfilling.
Sustainability 14 12825 g008
Figure 9. Predicted shear stress–strain responses at side of the pipeline; (a) without backfill soil, (b) with trench backfilling.
Sustainability 14 12825 g009
Figure 10. Liquefaction-induced uplift of the pipeline under seismic loading with and without trench backfilling.
Sustainability 14 12825 g010
Table 1. Parameters of element test.
G max ν AB γ 0   C1C2C3c ϕ Ten
50 MPa0.31.020.354 × 10−40.430.931.01030°0
Table 2. Parameters of seabed soil.
CharacteristicsSiltSilty ClayFine SandTrench Backfilling
Soil porosity (ns)0.500.350.500.50
Poisson’ ratio (ν)0.300.250.250.30
Reference   initial   shear   modulus   ( G max , 0 ref ) 6.5 × 10⁴ (kN/m2)3 × 104 (kN/m2)8 × 104 (kN/m2)6.5 × 104 (kN/m2)
Soil permeability (k)10−5 (m/s)10−8 (m/s)10−4 (m/s)10−4 (m/s)
Coefficient of lateral earth pressure (K0) 0.420.420.420.42
Submerged specific weight of soil ( γ ) 10 (kN/m3)8 (kN/m3)12 (kN/m3)12 (kN/m3)
Degree of saturation (Sr)1111
Relative density (Dr)50%60%70%50%
Davidenkov Model
A1.030.961.021.03
B0.500.470.480.50
γ 0   (×10−4)1.807.3017.901.80
C10.43--0.670.43
C20.93--0.60.93
C31.10--1.251.10
Mohr–Coulomb model
Cohesive strength (c)05 kPa00
Internal friction angle (ϕ)30°25°35°30°
Tensile strength (Ten)0000
Table 3. Parameters of submarine pipeline.
Young’s Modulus (E)Poisson’s Ratio (ν)Density (ρ)Buried Depth (h)
2 × 10¹¹ (kN/m2)0.257800 (kg/m3)2 m
Table 4. Parameters of wave and current.
Wave Height (H)Wave Period (T)Water Depth (d)Current Speed (v)
6 (m)6 (s)10 (m)1 (m/s)
Publisher’s Note: MDPI stays neutral with regard to jurisdictional claims in published maps and institutional affiliations.