
Hydrochemical Characteristics and Genetic Mechanism of Geothermal Springs in the Aba Area, Western Sichuan Province, China


Abstract
1. Introduction
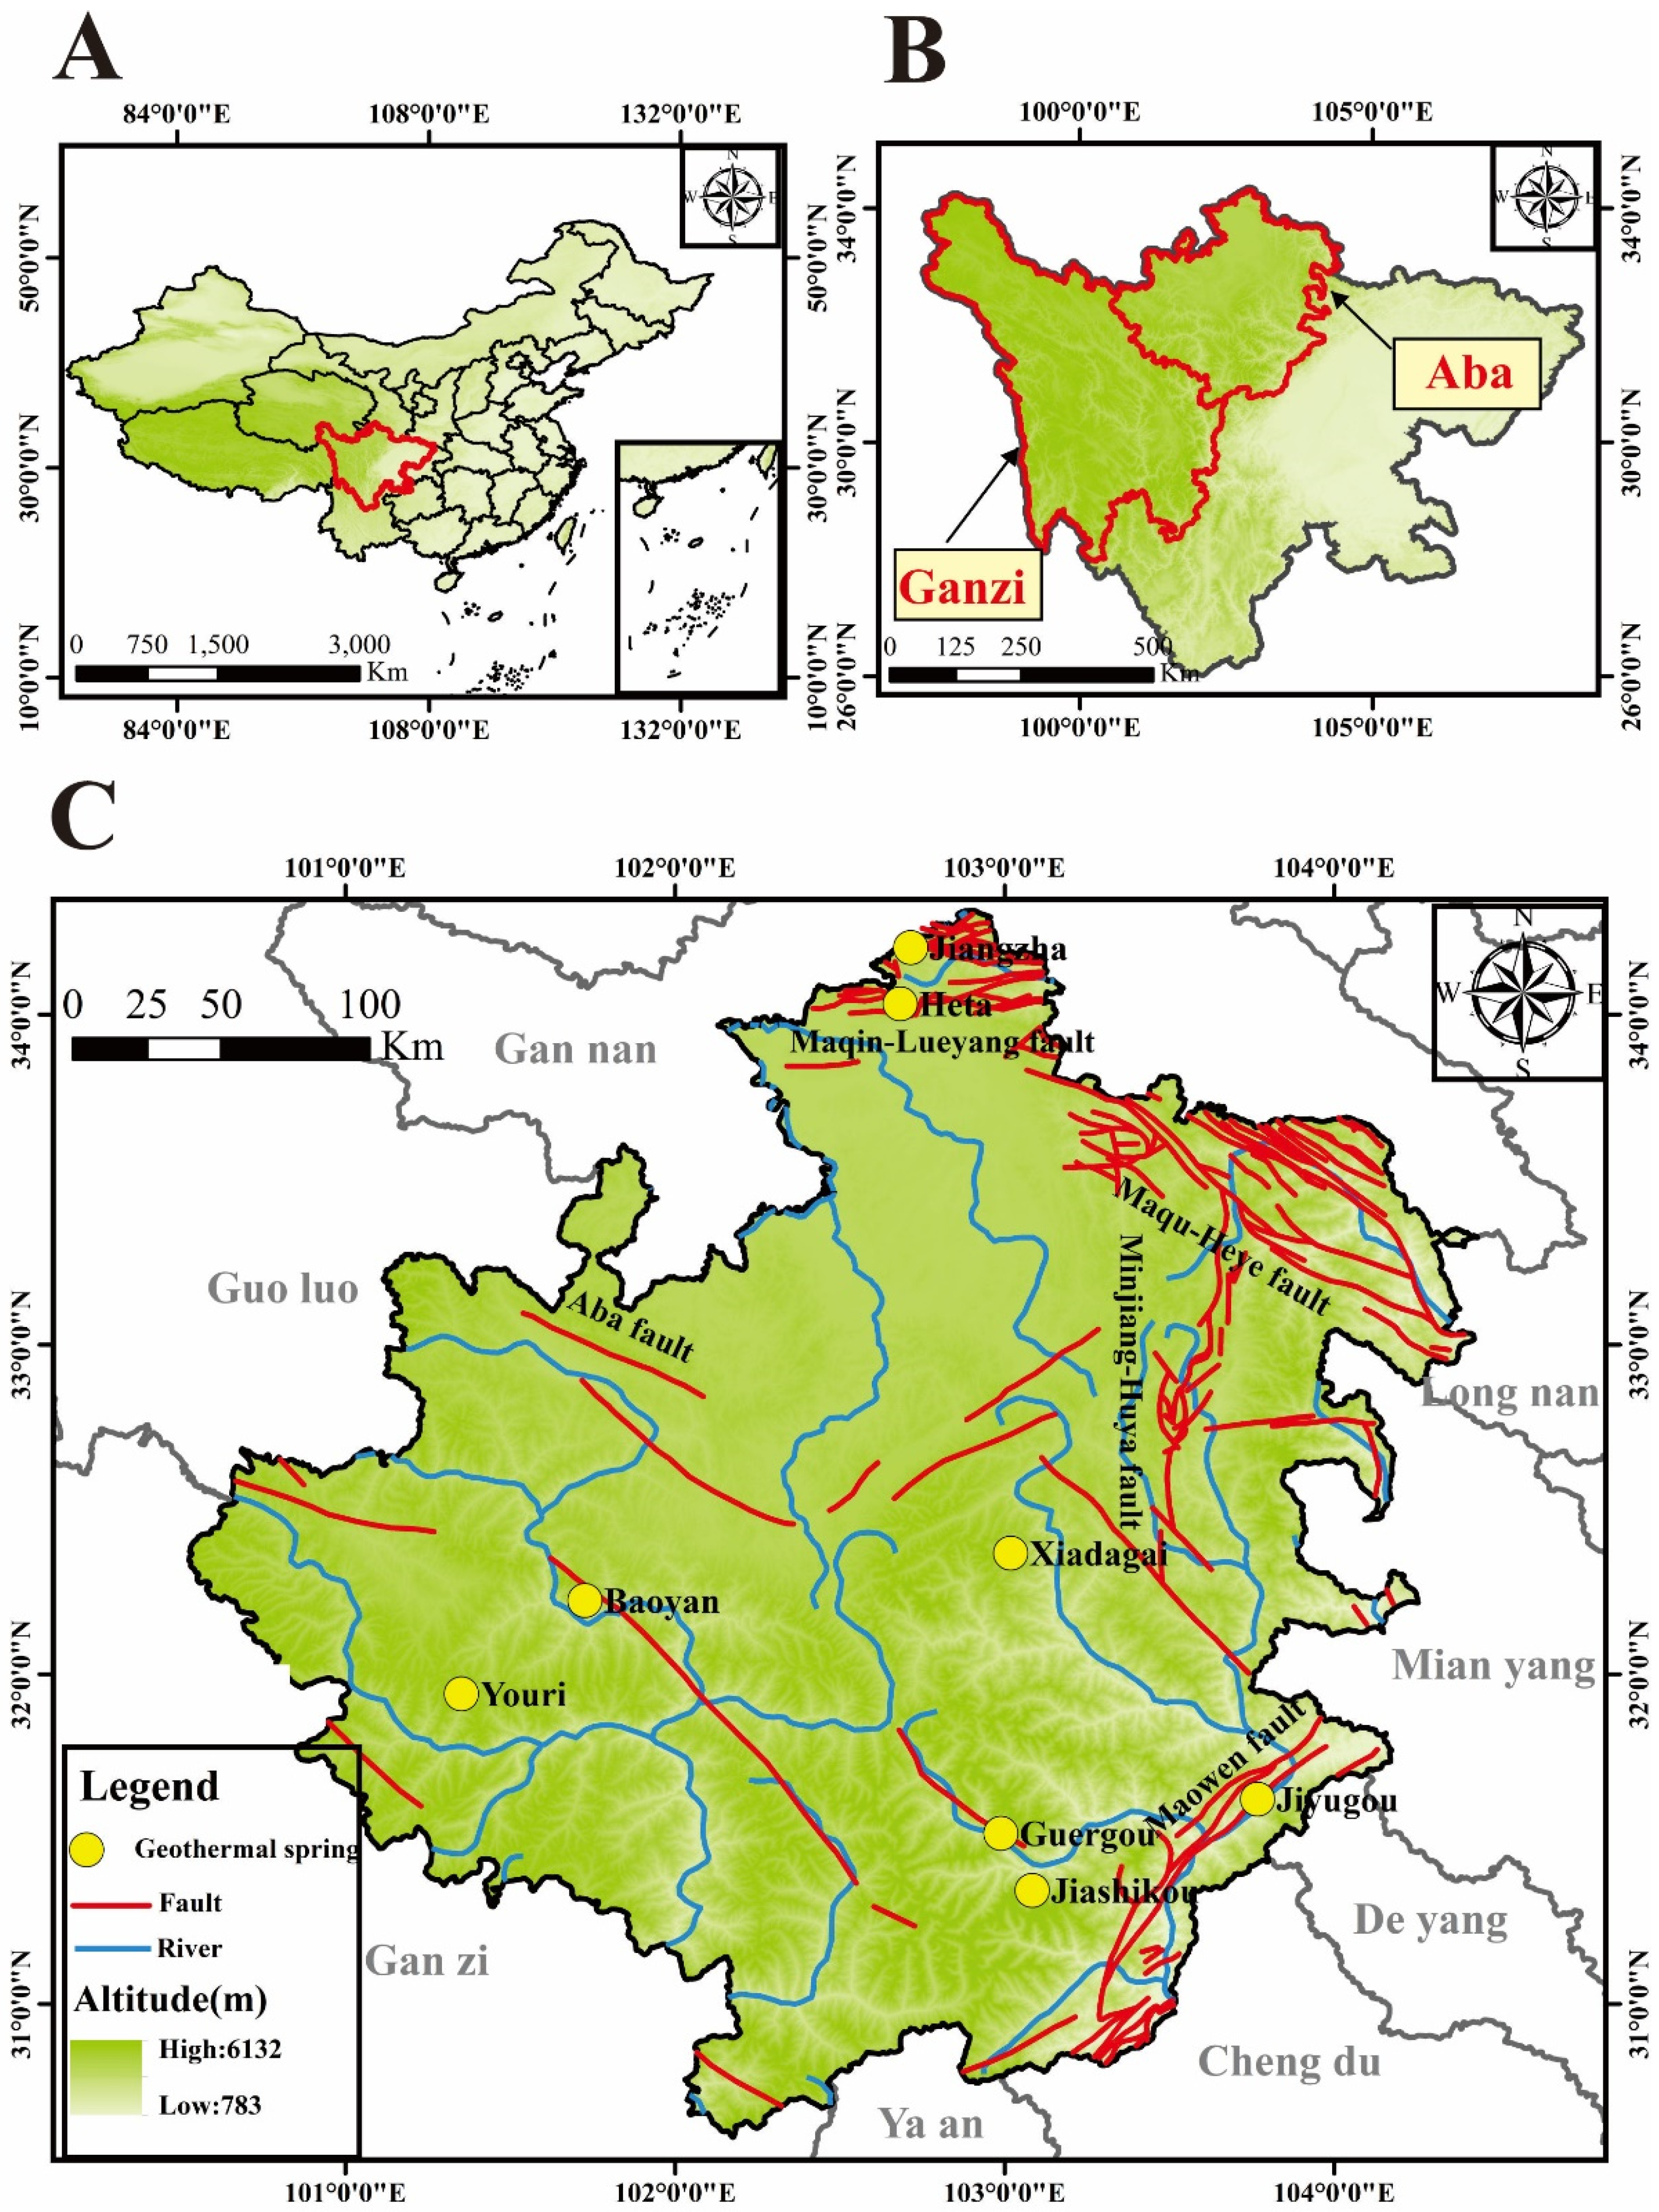
2. Study Area
3. Sample Collection and Laboratory Experiment
4. Results and Discussion
4.1. General Hydrochemical Characteristics
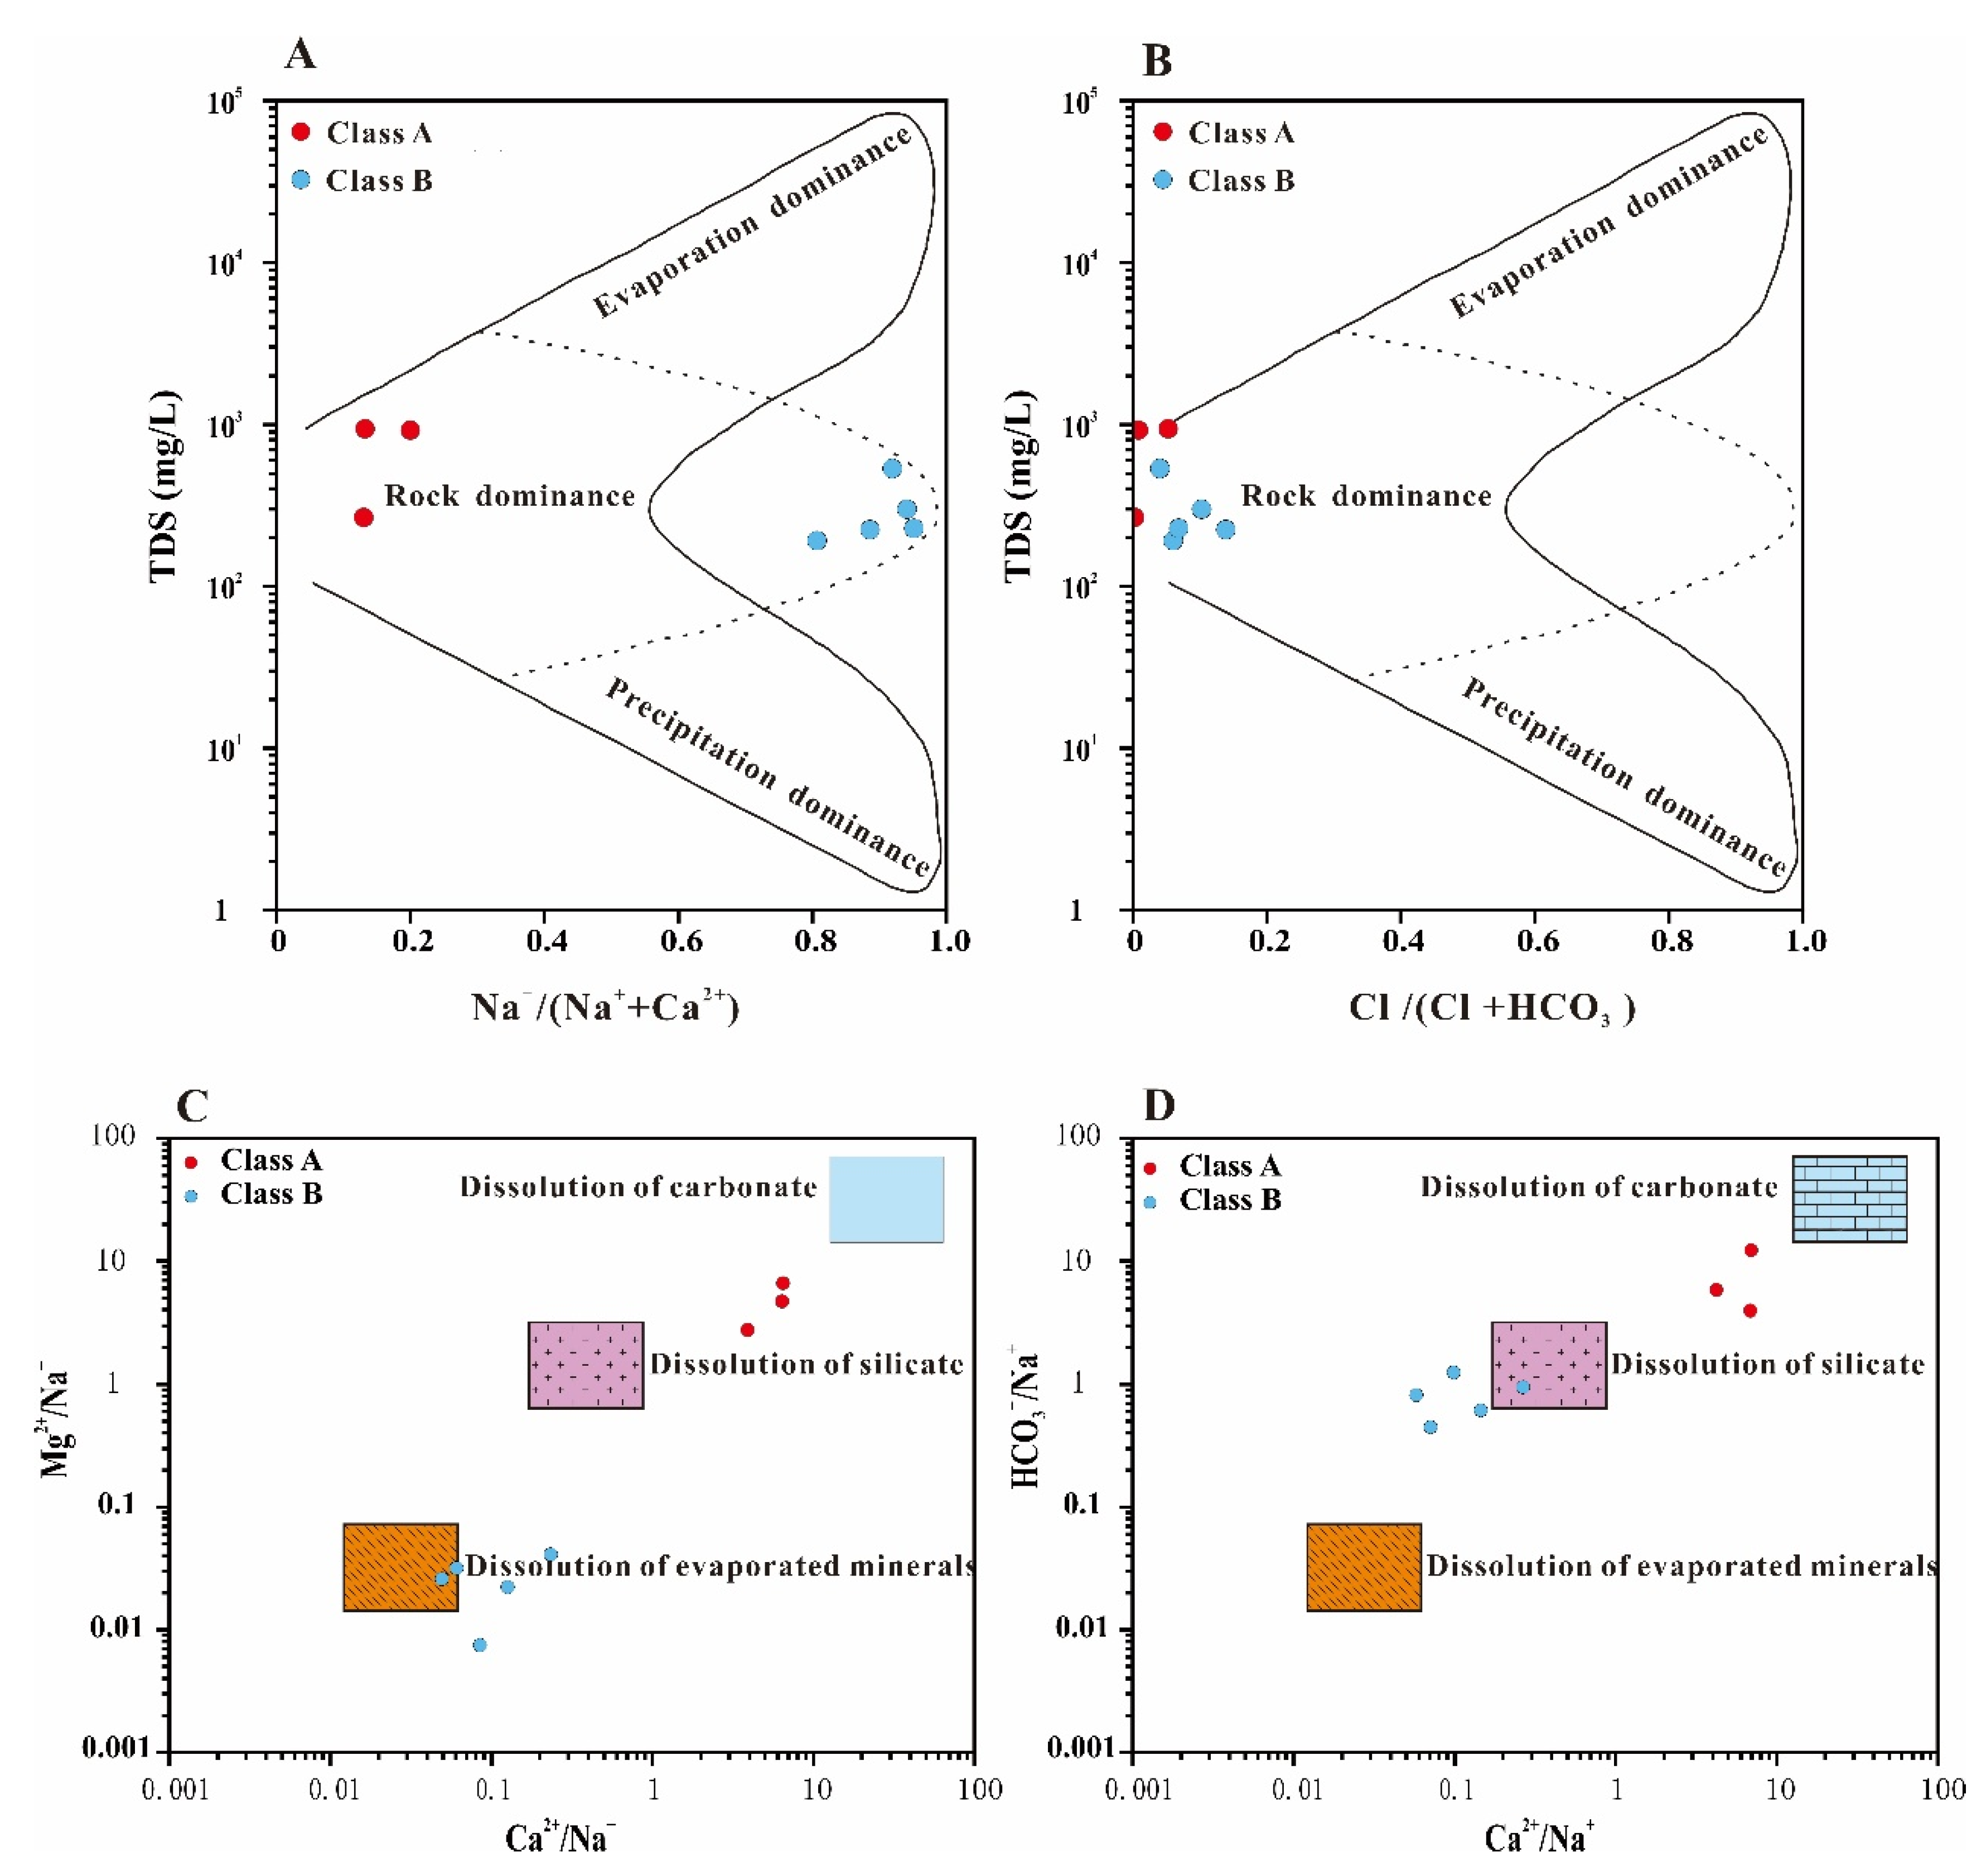
4.2. Factors Controlling Hydrochemical Compositions
4.2.1. Correlation Analysis of Each Parameter
- (1)
- Correlation Analysis of Major Ions
- (2)
- Correlation Analysis of Trace Element
4.2.2. Analysis of Ion Ratios
- (1)
- (K+ + Na+)/Cl−
- (2)
- (Ca2++Mg2+)/(HCO3−+ SO42−)
- (3)
- Ca2+/HCO3−
- (4)
- Ca2+/SO42−
4.2.3. Ion Exchange Process
4.2.4. Mineral Saturation Index
4.3. Reservoir Characteristics of Geothermal System
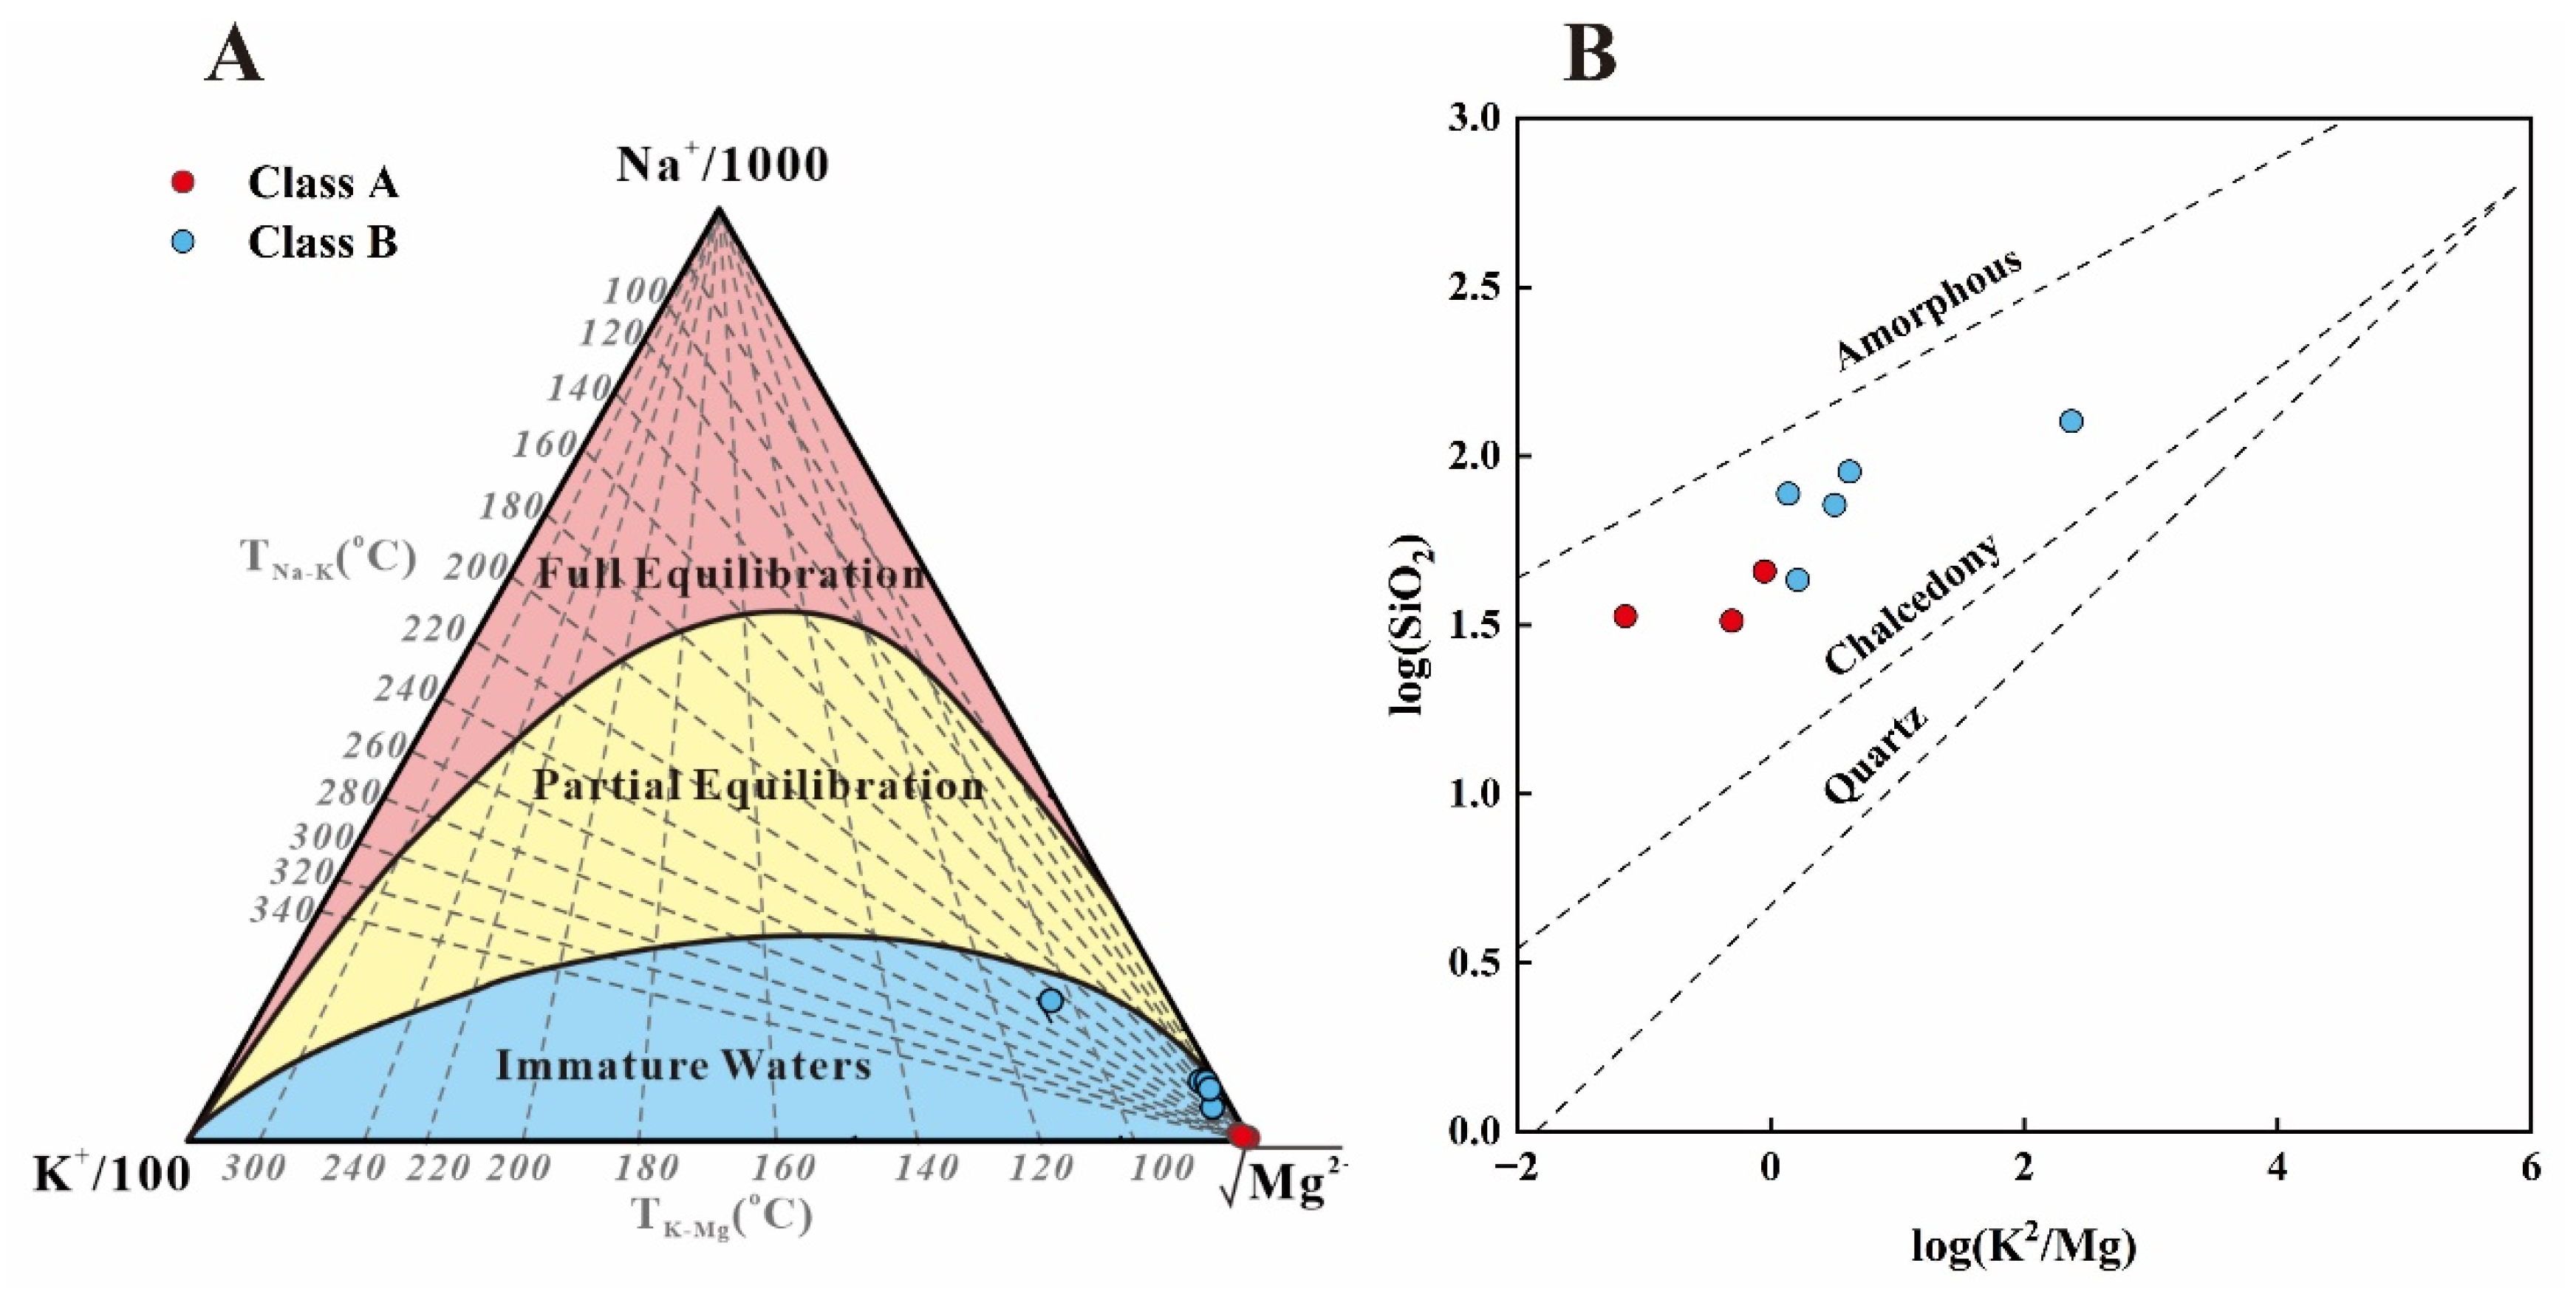
4.3.1. Equilibrium State of Water–Rock Interaction
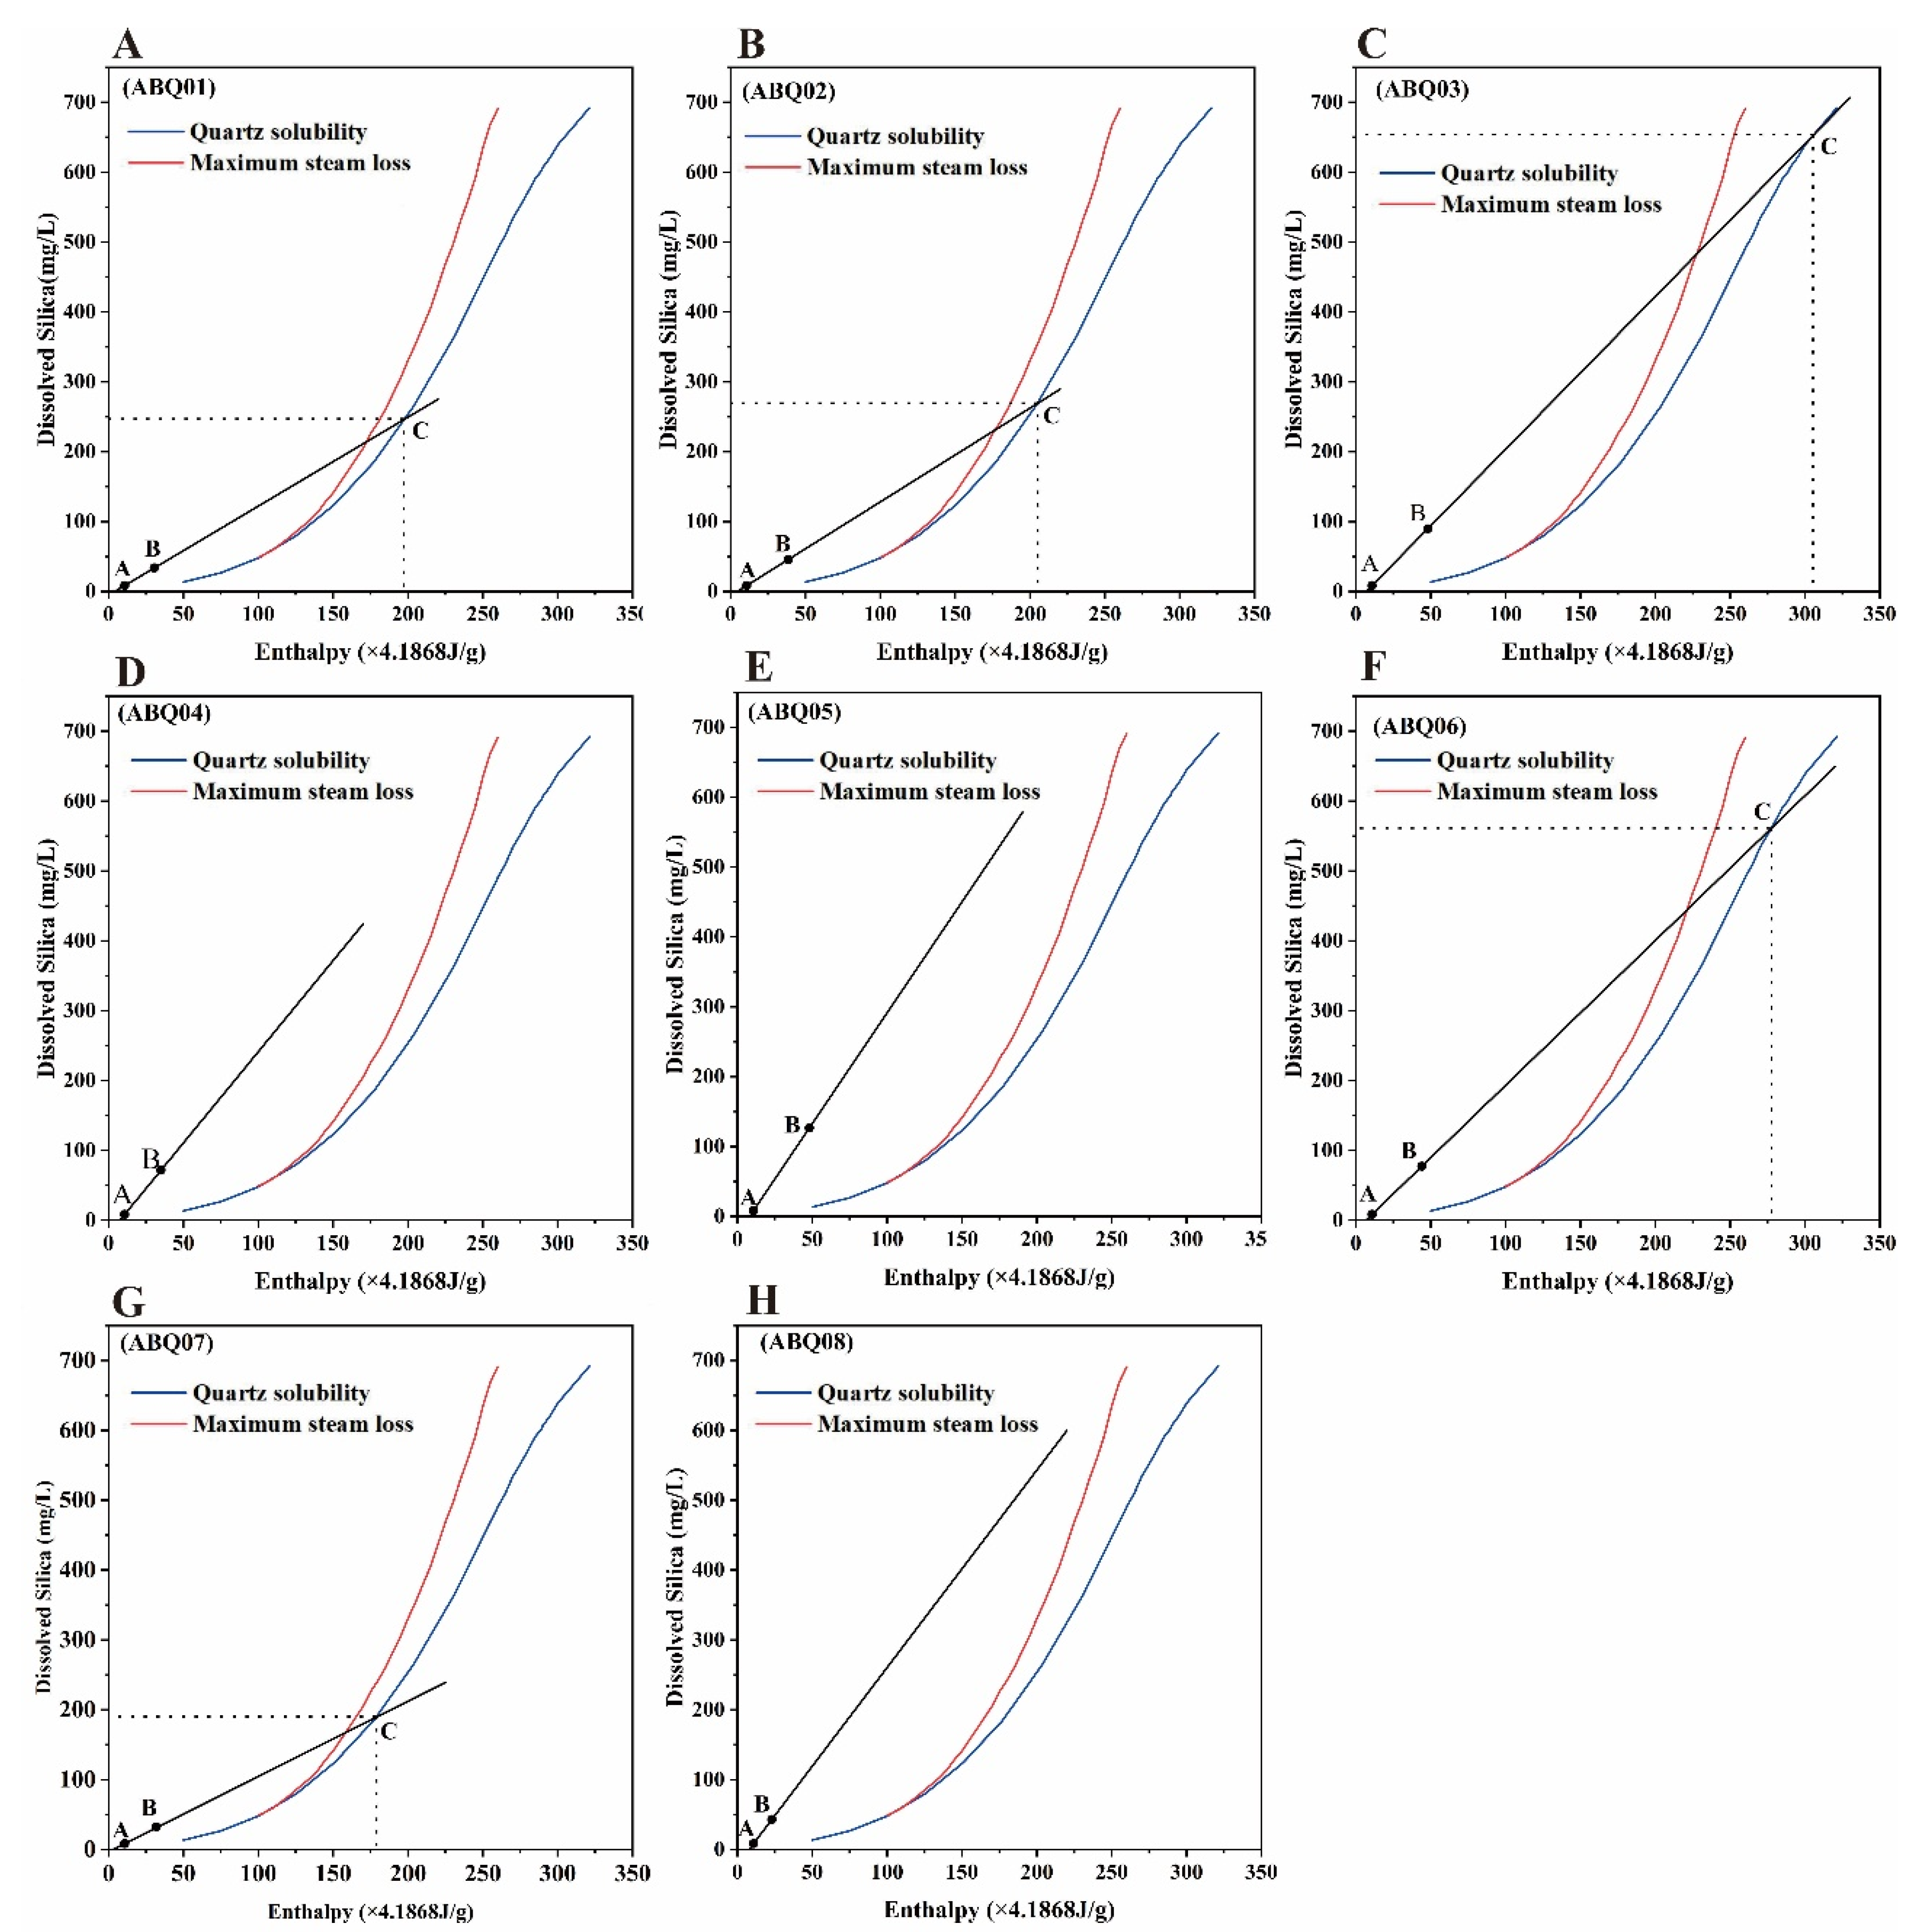
4.3.2. Reservoir Temperature Estimation
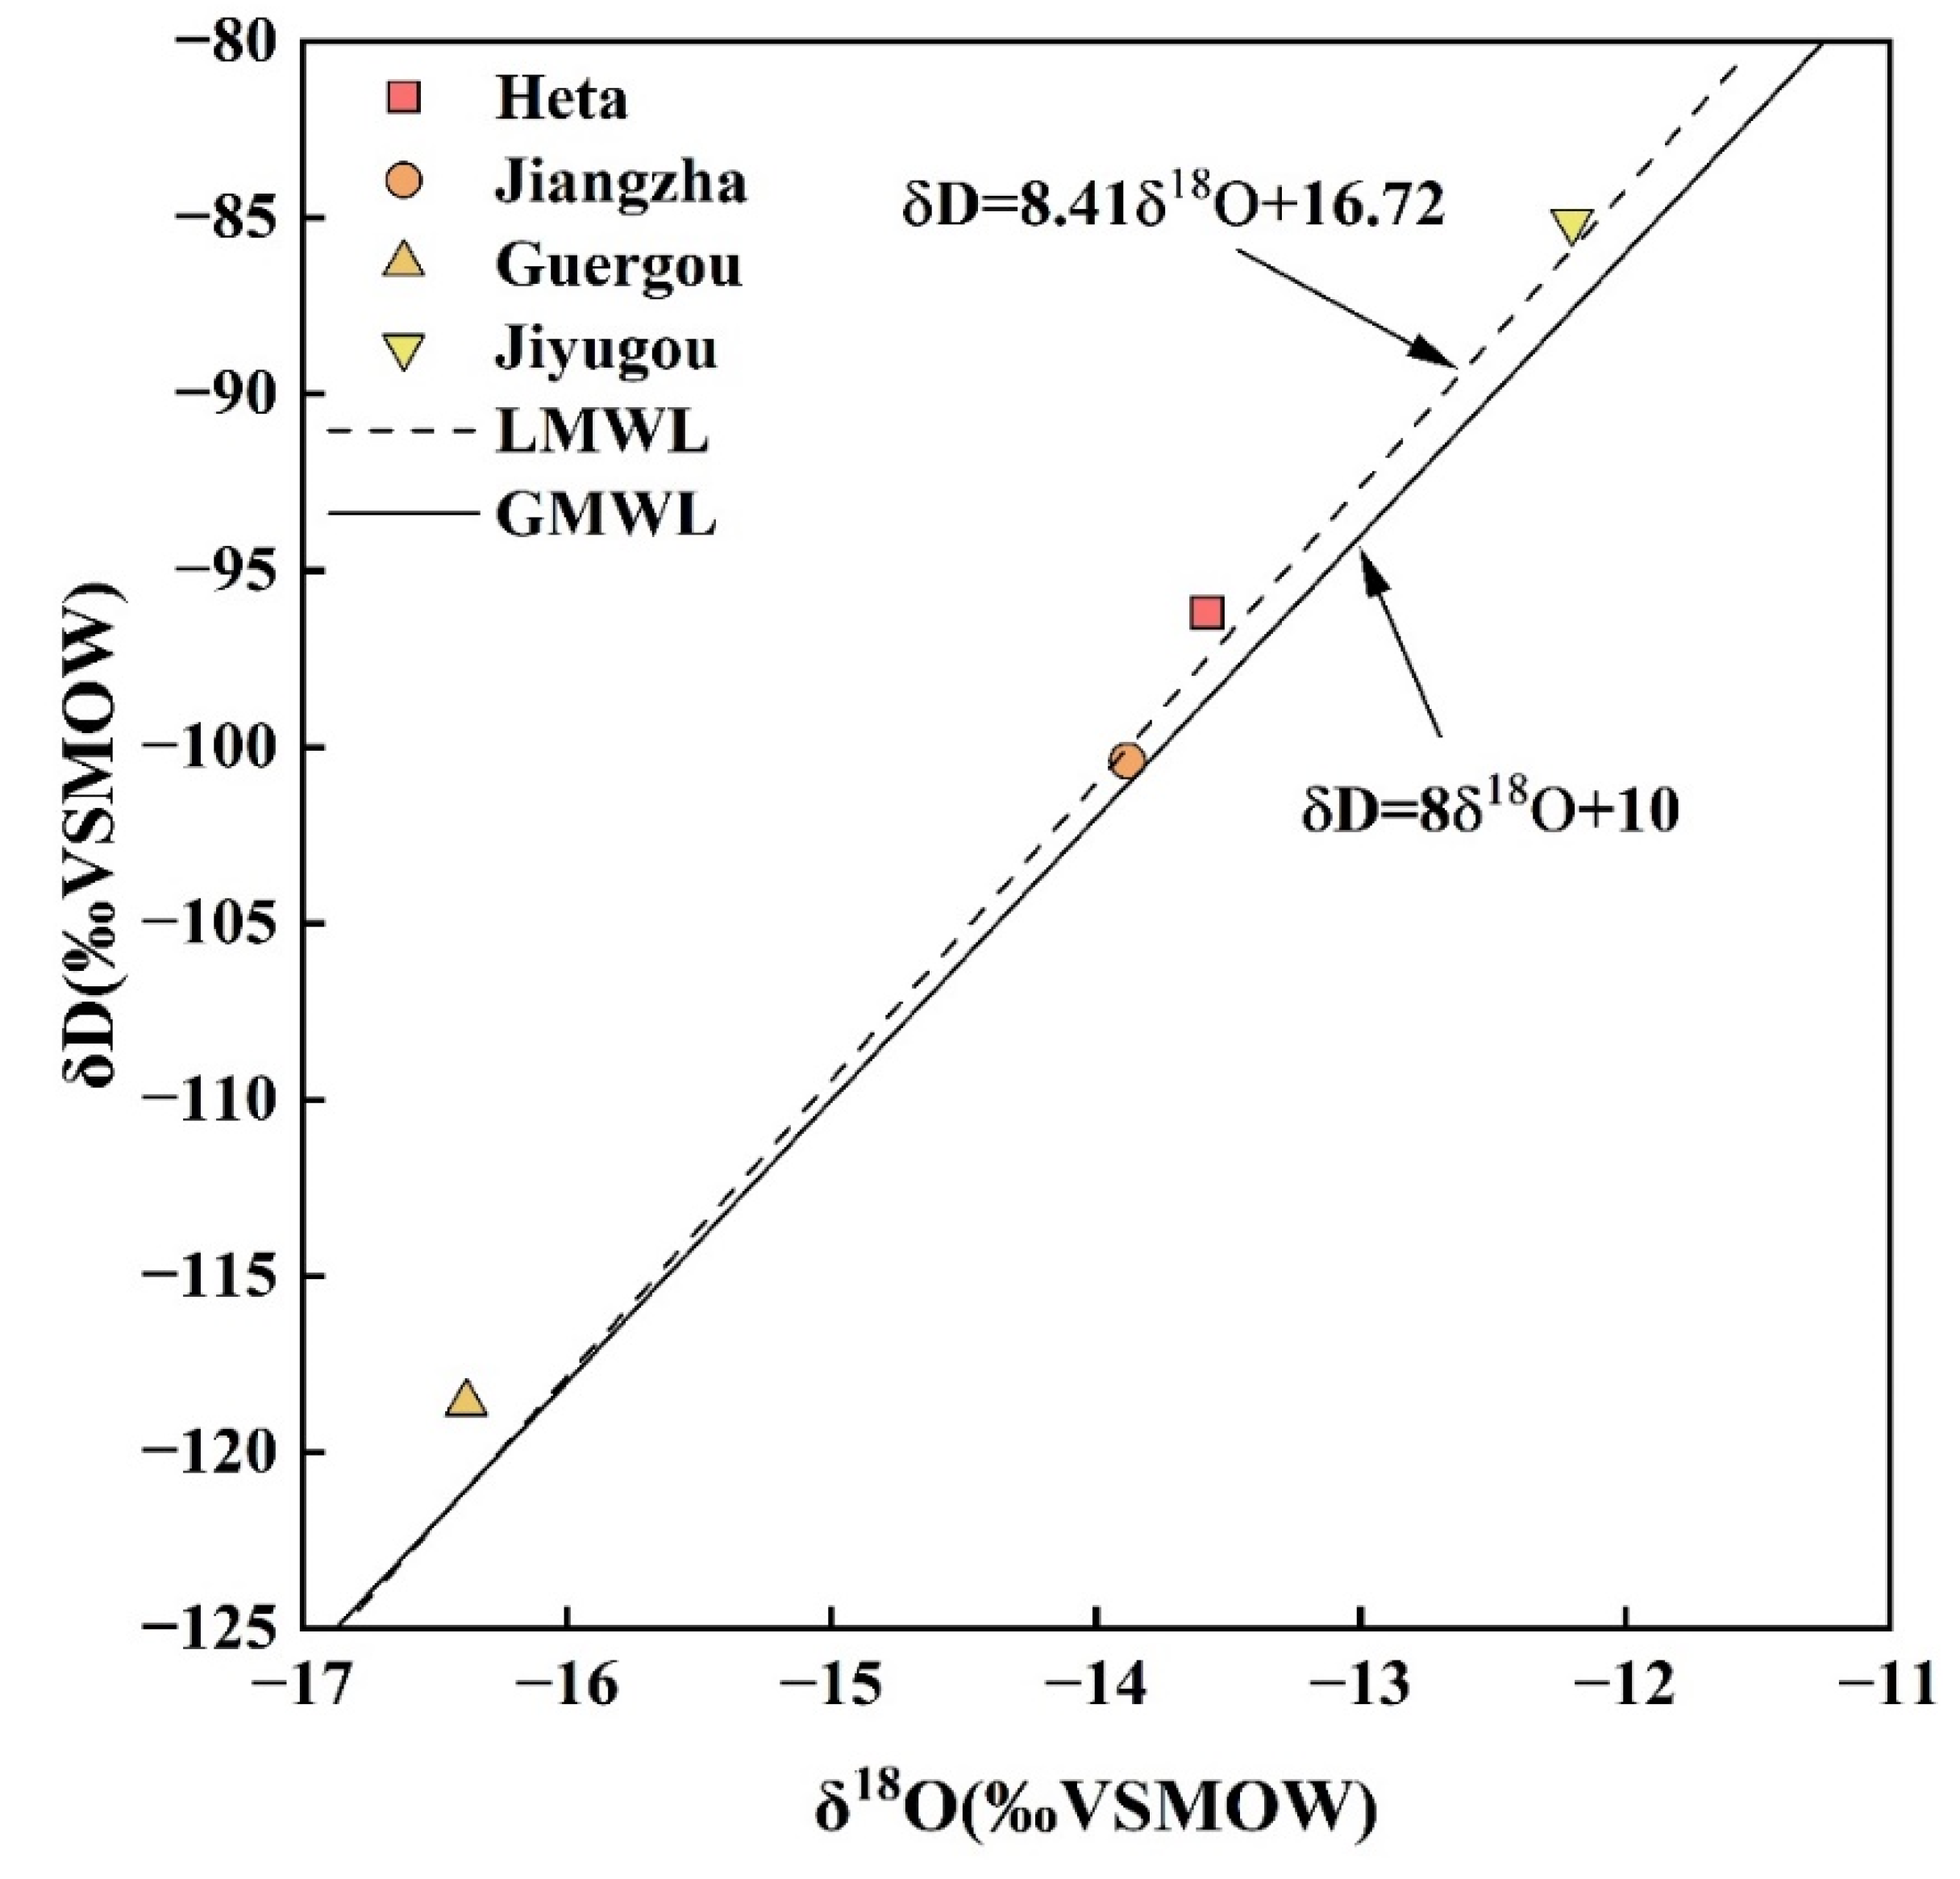
4.4. Recharge Origin of Geothermal Springs by D-O Isotopes
4.5. Conceptual Genetic Model of Geothermal Springs in Aba Area
4.5.1. Carbonate Rock Area with Deep Fault (Class A)
4.5.2. Igneous Rock Area with Deep Fault (Class B)
5. Conclusions
Supplementary Materials
Author Contributions
Funding
Institutional Review Board Statement
Informed Consent Statement
Data Availability Statement
Conflicts of Interest
References
- Muther, T.; Syed, F.I.; Lancaster, A.T.; Salsabila, F.D.; Dahaghi, A.K.; Negahban, S. Geothermal 4.0: AI-enabled geothermal reservoir development-current status, potentials, limitations, and ways forward. Geothermics 2022, 100, 102348. [Google Scholar] [CrossRef]
- Zhang, X.; Hu, Q. Development of Geothermal Resources in China: A Review. J. Earth Sci. 2018, 29, 452–467. [Google Scholar] [CrossRef]
- Tomac, I.; Sauter, M. A review on challenges in the assessment of geomechanical rock performance for deep geothermal reservoir development. Renew. Sustain. Energy Rev. 2018, 82, 3972–3980. [Google Scholar] [CrossRef]
- Wang, Y.; Gu, H.; Li, D.; Lyu, M.; Lu, L.; Zuo, Y.; Song, R. Hydrochemical characteristics and genesis analysis of geothermal fluid in the Zhaxikang geothermal field in Cuona County, southern Tibet. Environ. Earth Sci. 2021, 80, 1–19. [Google Scholar] [CrossRef]
- Cheng, Y.; Pang, Z.; Kong, Y.; Chen, X.; Wang, G. Imaging the heat source of the Kangding high-temperature geothermal system on the Xianshuihe fault by magnetotelluric survey. Geothermics 2022, 102, 102386. [Google Scholar] [CrossRef]
- Wang, Y.; Pang, Z. Heat flux measurements and thermal potential of the Garze geothermal area in the eastern Himalayan Syntaxis. J. Volcanol. Geotherm. Res. 2021, 420, 107407. [Google Scholar] [CrossRef]
- Ai, Y.; Zhang, J.; Dong, M.; Wang, B.; Fang, G. Heat generation effects from shear friction along Xianshui river strike-slip fault in western Sichuan, China. Geothermics 2021, 89, 101936. [Google Scholar] [CrossRef]
- Li, X.; Huang, X.; Liao, X.; Zhang, Y. Hydrogeochemical Characteristics and Conceptual Model of the Geothermal Waters in the Xianshuihe Fault Zone, Southwestern China. Int. J. Environ. Res. Public Health 2020, 17, 500. [Google Scholar] [CrossRef]
- Liu, W.; Guan, L.; Liu, Y.; Xie, X.; Zhang, M.; Chen, B.; Xu, S.; Sano, Y. Fluid geochemistry and geothermal anomaly along the Yushu-Ganzi-Xianshuihe fault system, eastern Tibetan Plateau: Implications for regional seismic activity. J. Hydrol. 2022, 607, 127554. [Google Scholar] [CrossRef]
- Tang, X.; Zhang, J.; Pang, Z.; Hu, S.; Tian, J.; Bao, S. The eastern Tibetan Plateau geothermal belt, western China: Geology, geophysics, genesis, and hydrothermal system. Tectonophysics 2017, 717, 433–448. [Google Scholar] [CrossRef]
- Shi, Z.; Liao, F.; Wang, G.; Xu, Q.; Mu, W.; Sun, X. Hydrogeochemical Characteristics and Evolution of Hot Springs in Eastern Tibetan Plateau Geothermal Belt, Western China: Insight from Multivariate Statistical Analysis. Geofluids 2017, 2017, 1–11. [Google Scholar] [CrossRef]
- Li, J.; Sagoe, G.; Yang, G.; Liu, D.; Li, Y. The application of geochemistry to bicarbonate thermal springs with high reservoir temperature: A case study of the Batang geothermal field, western Sichuan Province, China. J. Volcanol. Geotherm. Res. 2019, 371, 20–31. [Google Scholar] [CrossRef]
- Li, B.; Shi, Z.; Wang, G.; Liu, C. Earthquake-related hydrochemical changes in thermal springs in the Xianshuihe Fault zone, Western China. J. Hydrol. 2019, 579, 124175. [Google Scholar] [CrossRef]
- Yan, Y.; Zhou, X.; Liao, L.; Tian, J.; Li, Y.; Shi, Z.; Liu, F.; Ouyang, S. Hydrogeochemical Characteristic of Geothermal Water and Precursory Anomalies along the Xianshuihe Fault Zone, Southwestern China. Water 2022, 14, 550. [Google Scholar] [CrossRef]
- Li, Y.; Pang, Z.; Galeczka, I.M. Quantitative assessment of calcite scaling of a high temperature geothermal well in the Kangding geothermal field of Eastern Himalayan Syntax. Geothermics 2020, 87, 101844. [Google Scholar] [CrossRef]
- Luo, J.; Pang, Z.; Kong, Y.; Wang, Y. Geothermal potential evaluation and development prioritization based on geochemistry of geothermal waters from Kangding area, western Sichuan, China. Environ. Earth Sci. 2017, 76, 343. [Google Scholar] [CrossRef]
- Yang, Z.; Shen, C.; Ratschbacher, L.; Enkelmann, E.; Jonckheere, R.; Wauschkuhn, B.; Dong, Y. Sichuan Basin and beyond: Eastward foreland growth of the Tibetan Plateau from an integration of Late Cretaceous-Cenozoic fission track and (U-Th)/He ages of the eastern Tibetan Plateau, Qinling, and Daba Shan. J. Geophys. Res. Solid Earth 2017, 122, 4712–4740. [Google Scholar] [CrossRef]
- Zhang, Y.H.; Wang, Y.S.; Wang, W.S.; Liu, J.; Yuan, L.L. Zircon U-Pb-Hf isotopes and mineral chemistry of Early Cretaceous granodiorite in the Lunggar iron deposit in central Lhasa, Tibet Y, China. J. Cent. South Univ. 2019, 26, 3457–3469. [Google Scholar] [CrossRef]
- Zhang, Y.-H.; Yao, R.-W.; Wang, Y.; Duo, J.; Cao, H.-W. Zircon U–Pb and sericite Ar–Ar geochronology, geochemistry and S–Pb–Hf isotopes of the Zebuxia Pb–Zn deposit, Tibet, southwestern China. Ore Geol. Rev. 2022, 148, 104999. [Google Scholar] [CrossRef]
- Xinyu, Z.; Jinbao, L.; Bin, G.; Zengwu, W.; Yuting, L. Temporal and spatial characteristics of snow cover in Aba, Sichuan from 2000 to 2015. J. Arid. Land Resour. Environ. 2019, 33, 131–136. [Google Scholar] [CrossRef]
- Wang, E.; Meng, K.; Su, Z.; Meng, Q.; Chu, J.J.; Chen, Z.; Wang, G.; Shi, X.; Liang, X. Block rotation: Tectonic response of the Sichuan basin to the southeastward growth of the Tibetan Plateau along the Xianshuihe-Xiaojiang fault. Tectonics 2014, 33, 686–718. [Google Scholar] [CrossRef]
- Shen, B.; Wu, J.; Zhan, S.; Jin, M.; Saparov, A.; Abuduwaili, J. Spatial variations and controls on the hydrochemistry of surface waters across the Ili-Balkhash Basin, arid Central Asia. J. Hydrol. 2021, 600, 126565. [Google Scholar] [CrossRef]
- Xiao, Y.; Hao, Q.; Zhang, Y.; Zhu, Y.; Yin, S.; Qin, L.; Li, X. Investigating sources, driving forces and potential health risks of nitrate and fluoride in groundwater of a typical alluvial fan plain. Sci. Total Environ. 2022, 802, 149909. [Google Scholar] [CrossRef] [PubMed]
- Xiao, J.; Wang, L.; Chai, N.; Liu, T.; Jin, Z.; Rinklebe, J. Groundwater hydrochemistry, source identification and pollution assessment in intensive industrial areas, eastern Chinese loess plateau. Environ. Pollut. 2021, 278, 116930. [Google Scholar] [CrossRef]
- Xiong, G.-Y.; Chen, G.-Q.; Xu, X.-Y.; Liu, W.-Q.; Fu, T.-F.; Khokiattiwong, S.; Kornkanitnan, N.; Seddique, A.A.; Shi, X.-F.; Liu, S.-F.; et al. A comparative study on hydrochemical evolution and quality of groundwater in coastal areas of Thailand and Bangladesh. J. Southeast Asian Earth Sci. 2020, 195, 104336. [Google Scholar] [CrossRef]
- Kaasalainen, H.; Stefánsson, A. The chemistry of trace elements in surface geothermal waters and steam, Iceland. Chem. Geol. 2012, 330–331, 60–85. [Google Scholar] [CrossRef]
- Alçiçek, H.; Bülbül, A.; Alçiçek, M.C. Hydrogeochemistry of the thermal waters from the Yenice Geothermal Field (Denizli Basin, Southwestern Anatolia, Turkey). J. Volcanol. Geotherm. Res. 2016, 309, 118–138. [Google Scholar] [CrossRef]
- Chang, X.-W.; Xu, M.; Jiang, L.-W.; Li, X.; Zhang, Y.-H. Hydrogeochemical Characteristics and Formation of Low-Temperature Geothermal Waters in Mangbang-Longling Area of Western Yunnan, China. J. Chem. 2021, 2021, 1–13. [Google Scholar] [CrossRef]
- Hou, Y.; Shi, Z.; Mu, W. Fluid Geochemistry of Fault Zone Hydrothermal System in the Yidun-Litang Area, Eastern Tibetan Plateau Geothermal Belt. Geofluids 2018, 2018, 1–13. [Google Scholar] [CrossRef]
- Wang, X.; Wang, G.; Lu, C.; Gan, H.; Liu, Z. Evolution of deep parent fluids of geothermal fields in the Nimu–Nagchu geothermal belt, Tibet, China. Geothermics 2018, 71, 118–131. [Google Scholar] [CrossRef]
- Marandi, A.; Shand, P. Groundwater chemistry and the Gibbs Diagram. Appl. Geochem. 2018, 97, 209–212. [Google Scholar] [CrossRef]
- Yao, R.; Yan, Y.; Wei, C.; Luo, M.; Xiao, Y.; Zhang, Y. Hydrochemical Characteristics and Groundwater Quality Assessment Using an Integrated Approach of the PCA, SOM, and Fuzzy c-Means Clustering: A Case Study in the Northern Sichuan Basin. Front. Environ. Sci. 2022, 10, 907872. [Google Scholar] [CrossRef]
- Xiao, Y.; Xiao, D.; Hao, Q.; Liu, K.; Wang, R.; Huang, X.; Liao, X.; Zhang, Y. Accessible Phreatic Groundwater Resources in the Central Shijiazhuang of North China Plain: Perspective From the Hydrogeochemical Constraints. Front. Environ. Sci. 2021, 9, 747097. [Google Scholar] [CrossRef]
- Qian, J.; Peng, Y.; Zhao, W.; Ma, L.; He, X.; Lu, Y. Hydrochemical processes and evolution of karst groundwater in the northeastern Huaibei Plain, China. Hydrogeol. J. 2018, 26, 1721–1729. [Google Scholar] [CrossRef]
- Zhang, Y.; Xu, M.; Li, X.; Qi, J.; Zhang, Q.; Guo, J.; Yu, L.; Zhao, R. Hydrochemical Characteristics and Multivariate Statistical Analysis of Natural Water System: A Case Study in Kangding County, Southwestern China. Water 2018, 10, 80. [Google Scholar] [CrossRef]
- Zhang, Y.; Dai, Y.; Wang, Y.; Huang, X.; Xiao, Y.; Pei, Q. Hydrochemistry, quality and potential health risk appraisal of nitrate enriched groundwater in the Nanchong area, southwestern China. Sci. Total Environ. 2021, 784, 147186. [Google Scholar] [CrossRef]
- Zhang, Y.; He, Z.; Tian, H.; Huang, X.; Zhang, Z.; Liu, Y.; Xiao, Y.; Li, R. Hydrochemistry appraisal, quality assessment and health risk evaluation of shallow groundwater in the Mianyang area of Sichuan Basin, southwestern China. Environ. Earth Sci. 2021, 80, 576. [Google Scholar] [CrossRef]
- Xiao, Y.; Liu, K.; Yan, H.; Zhou, B.; Huang, X.; Hao, Q.; Zhang, Y.; Zhang, Y.; Liao, X.; Yin, S. Hydrogeochemical constraints on groundwater resource sustainable development in the arid Golmud alluvial fan plain on Tibetan plateau. Environ. Earth Sci. 2021, 80, 750. [Google Scholar] [CrossRef]
- Singh, C.K.; Kumar, A.; Shashtri, S.; Kumar, A.; Kumar, P.; Mallick, J. Multivariate statistical analysis and geochemical modeling for geochemical assessment of groundwater of Delhi, India. J. Geochem. Explor. 2017, 175, 59–71. [Google Scholar] [CrossRef]
- Liu, P.; Hoth, N.; Drebenstedt, C.; Sun, Y.; Xu, Z. Hydro-geochemical paths of multi-layer groundwater system in coal mining regions—Using multivariate statistics and geochemical modeling approaches. Sci. Total Environ. 2017, 601–602, 1–14. [Google Scholar] [CrossRef]
- Li, X.; Huang, X.; Zhang, Y. Spatio-temporal analysis of groundwater chemistry, quality and potential human health risks in the Pinggu basin of North China Plain: Evidence from high-resolution monitoring dataset of 2015–2017. Sci. Total Environ. 2021, 800, 149568. [Google Scholar] [CrossRef] [PubMed]
- Yang, J.; Ye, M.; Tang, Z.; Jiao, T.; Song, X.; Pei, Y.; Liu, H. Using cluster analysis for understanding spatial and temporal patterns and controlling factors of groundwater geochemistry in a regional aquifer. J. Hydrol. 2020, 583, 124594. [Google Scholar] [CrossRef]
- Reed, M.; Spycher, N. Calculation of pH and mineral equilibria in hydrothermal waters with application to geothermometry and studies of boiling and dilution. Geochim. Cosmochim. Acta 1983, 48, 1479–1492. [Google Scholar] [CrossRef]
- Sasaki, K.; Morita, J.; Iwaki, C.; Ueda, A. Geochemical evaluation of geothermal resources in Toyama Prefecture, Japan, based on the chemical and isotopic characteristics of hot spring waters. Geothermics 2021, 93, 102071. [Google Scholar] [CrossRef]
- Giggenbach, W.F. Geothermal solute equilibria. Derivation of Na-K-Mg-Ca geoindicators. Geochim. Cosmochim. Acta 1988, 52, 2749–2765. [Google Scholar] [CrossRef]
- Zhang, W.; Wang, G.; Xing, L.; Li, T.; Zhao, J. Geochemical response of deep geothermal processes in the Litang region, Western Sichuan. Energy Explor. Exploit. 2019, 37, 626–645. [Google Scholar] [CrossRef]
- Wang, X.; Zhou, X.; Zheng, Y.; Song, C.; Long, M.; Chen, T.; Ren, Z.; Yang, M.; Li, X.; Guo, J. Hydrochemical characteristics and mixing behavior of thermal springs along the Bijiang River in the Lanping basin of China. Environ. Earth Sci. 2017, 76, 487. [Google Scholar] [CrossRef]
- Ba, J.; Su, C.; Li, Y.; Tu, S. Characteristics of heat flow and geothermal fields in Ruidian, Western Yunnan Province, China. Int. J. Heat Technol. 2018, 36, 1203–1211. [Google Scholar] [CrossRef]
- Yuan, J.; Xu, F.; Deng, G.; Tang, Y. Using stable isotopes and major ions to identify hydrogeochemical characteristics of karst groundwater in Xide country, Sichuan Province. Carbonates Evaporites 2017, 33, 223–234. [Google Scholar] [CrossRef]
- Craig, H. Isotopic Variations in Meteoric Waters. Science 1961, 133, 1702–1703. [Google Scholar] [CrossRef]
- Kong, Y.; Wang, K.; Li, J.; Pang, Z. Stable Isotopes of Precipitation in China: A Consideration of Moisture Sources. Water 2019, 11, 1239. [Google Scholar] [CrossRef]
- Ta, M.; Zhou, X.; Guo, J.; Wang, Y.; Wang, X.; Xu, Y. Hydrogeochemical characteristics and formation of the hot springs occurring in the plunging ends of an anticline in Chongqing, Eastern Sichuan Basin, China. Environ. Earth Sci. 2019, 78, 1–14. [Google Scholar] [CrossRef]
- Yu, J.; Zhang, H.; Yu, F.; Liu, D. Oxygen and hydrogen isotopic compositions of meteoric waters in the eastern part of Xizang. Chin. J. Geochem. 1984, 3, 93–101. [Google Scholar] [CrossRef]
- Artemieva, I.M.; Thybo, H.; Jakobsen, K.; Sørensen, N.K.; Nielsen, L.S.K. Heat production in granitic rocks: Global analysis based on a new data compilation GRANITE2017. Earth-Sci. Rev. 2017, 172, 1–26. [Google Scholar] [CrossRef]
- Fournier, R. Chemical geothermometers and mixing models for geothermal systems. Geothermics 1977, 5, 41–50. [Google Scholar] [CrossRef]
- Fournier, R. Application of water geochemistry to geothermal exploration and reservoir engineering. In Geothermal Systems: Principles and Case Histories; Rybach, L., Muffler, L.J.P., Eds.; Wiley: Chichester, UK, 1981; pp. 109–143. [Google Scholar]


| ID | Name | Altitude (m) | T (°C) | pH | TDS (mg/L) | Structural Location | Geothermal Reservoir Temperature Lithology | |||||||||
|---|---|---|---|---|---|---|---|---|---|---|---|---|---|---|---|---|
| ABQ01 | Heta | 3360 | 30.49 | 7.6 | 264.80 | Maqin–Lueyang deep fault zone | Conglomerate intercalated with metamorphic limestone | |||||||||
| ABQ02 | Jiangzha | 3253 | 38.40 | 6.6 | 917.00 | Maqin–Lueyang deep fault zone | Siliceous dolomite | |||||||||
| ABQ03 | Guergou | 2583 | 48.00 | 8.9 | 190.40 | The Miyaluo fault | Granite | |||||||||
| ABQ04 | Xiadagai | 3402 | 35.00 | 8.4 | 222.90 | Structure of Zhimulin Mountain type | Calcareous quartz sandstone | |||||||||
| ABQ05 | Baoyan | 3360 | 48.00 | 7.1 | 530.70 | Caodeng syncline | Slate, phyllite | |||||||||
| ABQ06 | Jiashikou | 2840 | 44.00 | 9.1 | 298.30 | Xuecheng S-type structure | Conglomeratic sandstone | |||||||||
| ABQ07 | Jiyugou | 1703 | 31.92 | 7.1 | 937.40 | Maowen active fault | Metamorphic dolomite | |||||||||
| ABQ08 | Youri | 3920 | 23.00 | 9.5 | 227.40 | The Seda fault, Rushi anticline and Balachon syncline | Sandstone | |||||||||
| ID | K+ | Na+ | Ca2+ | Mg2+ | Cl− | SO42− | HCO3− | CO32− | H2SiO3 | Sr | F | Li | B | 18O | D | Re |
| ABQ01 | 1.40 | 8.00 | 46.09 | 27.36 | 0.35 | 32.48 | 247.10 | 0.00 | 43.64 | 0.14 | 0.47 | 0.02 | 1.05 | −13.58 | −96.2 | 4960 |
| ABQ02 | 8.00 | 50.00 | 173.3 | 71.14 | 3.90 | 209.60 | 726.10 | 0.00 | 59.20 | 1.26 | 1.04 | 0.19 | 2.35 | −13.88 | −100.4 | 5015 |
| ABQ03 | 1.60 | 29.00 | 6.01 | 0.61 | 2.48 | 14.16 | 66.02 | 3.05 | 116.81 | 0.04 | 1.39 | 0.02 | 0.49 | −16.38 | −118.6 | 5040 |
| ABQ04 | 1.40 | 54.00 | 6.01 | 0.61 | 7.45 | 27.60 | 79.32 | 30.01 | 93.18 | 0.02 | 7.84 | 0.05 | 1.01 | - | - | - |
| ABQ05 | 12.00 | 160.00 | 12.02 | 0.61 | 12.00 | 11.92 | 482.00 | 0.00 | 164.55 | 0.35 | 12.00 | 2.23 | 7.09 | - | - | - |
| ANQ06 | 1.30 | 75.00 | 4.01 | 1.22 | 5.32 | 12.44 | 79.32 | 54.01 | 100.49 | 0.058 | 0.01 | 0.072 | 1.65 | - | - | - |
| ABQ07 | 6.00 | 30.00 | 170.30 | 72.35 | 9.57 | 516.00 | 292.90 | 0.00 | 42.32 | 4.56 | 2.18 | 0.06 | 1.13 | −12.20 | −85.1 | 2876 |
| ABQ08 | 1.00 | 46.00 | 2.00 | 0.61 | 3.90 | 8.16 | 90.03 | 15.25 | 55.90 | 0.03 | 5.37 | 0.05 | 0.36 | - | - | - |
| ABD09 | 1.45 | 17.10 | 59.90 | 10.40 | 1.80 | 55.30 | 221.90 | 3.00 | 11.00 | 0.33 | 0.11 | 0.05 | 0.10 | - | −54.60 | - |
| ID | T (°C) | Quartz 1 | Chalcedony 1 | Na-K | K-Mg | Na-K-Ca |
|---|---|---|---|---|---|---|
| ABQ01 | 30.49 | 87.16 | 60.88 | 257.22 | 19.00 | 7.02 |
| ABQ02 | 38.40 | 98.83 | 73.00 | 244.73 | 41.94 | 41.18 |
| ABQ03 | 48.00 | 127.75 | 103.43 | 131.52 | 57.75 | 53.36 |
| ABQ04 | 35.00 | 117.65 | 92.25 | 77.20 | 54.90 | 110.29 |
| ABQ05 | 48.00 | 144.11 | 120.91 | 158.75 | 107.78 | 126.34 |
| ABQ06 | 44.00 | 120.97 | 96.25 | 53.80 | 46.22 | 64.36 |
| ABQ07 | 31.92 | 86.03 | 59.70 | 276.99 | 36.26 | 29.96 |
| ABQ08 | 23.00 | 96.57 | 70.65 | 66.57 | 47.92 | 65.52 |
| ID | Silicon-Enthalpy Equation | Silicon-Enthalpy Diagram | Initial Silica Concentration (mg/L) | |||
| Cold Water Mixing Ratio (%) | Geothermal Reservoir Temperature (°C) | Cold Water Mixing Ratio (%) | Geothermal Reservoir Temperature (°C) | |||
| ABQ01 | 89.52 | 196.11 | 89.44 | 197.44 | 246.26 | |
| ABQ02 | 85.78 | 201.41 | 85.76 | 204.73 | 268.84 | |
| ABQ03 | 87.18 | 285.18 | 87.39 | 305.98 | 653.97 | |
| ABQ04 | - | - | - | - | - | |
| ABQ05 | - | - | - | - | - | |
| ABQ06 | 87.55 | 266.16 | 87.55 | 277.31 | 560.77 | |
| ABQ07 | 87.93 | 184.26 | 87.00 | 178.46 | 189.16 | |
| ABQ08 | - | - | - | - | - | |
Publisher’s Note: MDPI stays neutral with regard to jurisdictional claims in published maps and institutional affiliations. |
© 2022 by the authors. Licensee MDPI, Basel, Switzerland. This article is an open access article distributed under the terms and conditions of the Creative Commons Attribution (CC BY) license (https://creativecommons.org/licenses/by/4.0/).
Share and Cite
Sun, M.; Zhang, X.; Yuan, X.; Yu, Z.; Xiao, Y.; Wang, Y.; Zhang, Y. Hydrochemical Characteristics and Genetic Mechanism of Geothermal Springs in the Aba Area, Western Sichuan Province, China. Sustainability 2022, 14, 12824. https://doi.org/10.3390/su141912824
Sun M, Zhang X, Yuan X, Yu Z, Xiao Y, Wang Y, Zhang Y. Hydrochemical Characteristics and Genetic Mechanism of Geothermal Springs in the Aba Area, Western Sichuan Province, China. Sustainability. 2022; 14(19):12824. https://doi.org/10.3390/su141912824
Chicago/Turabian StyleSun, Minglu, Xu Zhang, Xingcheng Yuan, Zhongyou Yu, Yao Xiao, Ying Wang, and Yunhui Zhang. 2022. "Hydrochemical Characteristics and Genetic Mechanism of Geothermal Springs in the Aba Area, Western Sichuan Province, China" Sustainability 14, no. 19: 12824. https://doi.org/10.3390/su141912824
APA StyleSun, M., Zhang, X., Yuan, X., Yu, Z., Xiao, Y., Wang, Y., & Zhang, Y. (2022). Hydrochemical Characteristics and Genetic Mechanism of Geothermal Springs in the Aba Area, Western Sichuan Province, China. Sustainability, 14(19), 12824. https://doi.org/10.3390/su141912824