Article

Spatial Distribution Characteristics of Public Fitness Venues in the Main Urban Area of Dalian from the Perspective of Urban Accessibility

1
School of Physical Education, Liaoning Normal University, No. 850 Huanghe Road, ShaHekou District, Dalian 116029, China
2
Key Laboratory of Regional Sustainable Development Modeling, Institute of Geographic Sciences and Natural Resources Research, CAS, Beijing 100101, China
3
School of Earth and Planetary Sciences (EPS), Curtin University, Perth, WA 6102, Australia
*
Authors to whom correspondence should be addressed.
Sustainability 2022, 14(19), 12728; https://doi.org/10.3390/su141912728
Submission received: 11 May 2022 / Revised: 24 September 2022 / Accepted: 28 September 2022 / Published: 6 October 2022

Abstract

:
In the context of the Healthy China initiative, studying the spatial distribution characteristics of urban sports venues will benefit sports venue planning in cities and promote the health of urban residents. Therefore, considering the main urban area of Dalian City as the study area, in this study, we investigated the spatial distribution characteristics of fitness venues and their accessibility through spatial and buffer zone analyses using data of public fitness venues, school sports venues, and the traffic road network. The conclusion is as follows: (1) In Zhongshan, Xigang, and Shahekou Districts, public fitness venues are more densely distributed in non-coastal areas. (2) Within 0–15 min, Xigang District showed the highest ratio of the public fitness venue service area (24.42%), which was followed by Shahekou (19.02%), Zhongshan (17.13%), and Ganjingzi Districts (4.82%). (3) The number of sports venues increased from 272 to 1117 when school sports venues were considered. Due to this, the service area ratio of fitness venues in all districts was increased, and the ranking was also changed. After this, Shahekou District had the highest ratio of the sports and fitness venue service area (55.65%), which was followed by Xigang (48.43%), Zhongshan (35.68%), and Ganjingzi Districts (11.91%). Therefore, solutions to introduce more school sports venues should be investigated to ensure a uniform spatial distribution of urban fitness venues. This study provides a reference to plan and develop fitness venues in cities.

1. Introduction

Public fitness venues [1], which are a part of the public service infrastructure to promote national fitness, are the main places for urban residents to undertake various fitness activities, and they are involved in improving the health of urban residents. National fitness is an important indicator of all citizens having a healthy life of, it is a reflection of a nation’s comprehensive strength, and an important approach to achieve nationwide health [2]. With the benefits of steady economic development [3], the living standards of urban residents have improved, thereby increasing the demand for sports, fitness, leisure, and recreation. However, rapid urbanization has compromised integrated planning to develop public fitness service facilities, urban road traffic networks, and community housing, thus resulting in an unbalanced supply and uneven spatial distribution of public fitness venues [4]. Consequently, urban residents are unaware of the location of fitness centers [5]. Therefore, based on the theories of the Healthy China initiative, the National Fitness initiative, and the equalization of basic public services [6], studying the spatial distribution characteristics of urban public fitness venues will not only help to solve the problem of there being an insufficient number of fitness venues for urban residents, but also benefit the planning and development of cities [7].
A previous study reported that a lack of physical activity centers hinders the physical activity of people and encourages people to use non-fitness venues to undertake physical activity [8]. Numerous scholars have studied the spatial distribution of physical fitness venues from multiple perspectives. These studies have mostly compared the inter-regional spatial distribution of fitness venues, but there have been fewer studies on school sports venues. For example, a comparative study between urban and rural areas on the satisfaction of residents with urban and rural exercise facilities in China indicated that rural residents were more dissatisfied (by almost 16.1%) with their local public sports service system than urban residents were [9]. Xiao believes that the distribution of sports venues is of great significance to mobilize the enthusiasm of primary and secondary school students to participate in sports activities and to promote their formation of good physical activity habits. Therefore, the studies of the distribution characteristics of primary and secondary school sports grounds in Nanchang are based on GIS technology [10]. Other scholars have discussed the actual use and satisfaction towards school sport field facilities in elementary schools in Taichung City [11]. Studies have focused on how different school ground environments can stimulate physical activity (PA) in children. The study found that the constructed schoolyard afforded a space of 44 m2 per child, and they had access to sports and game courts and various types of equipment for PA [12]. Furthermore, Duan compared the activity areas in two urban parks in China and Germany and found that men exercised more than women, who are less active [13]. In addition, several studies have been conducted on the spatial pattern [14,15], equity [16], and accessibility [17] of physical fitness venues. Among these, accessibility analyses have been widely used in sports venue research. Cutumisu and Spence assessed the accessibility that people had to facilities using an enhanced two-step floating catchment area method, and they found that women and older adults were less physically active and that those with a higher self-efficacy used sports venues for physical activity more frequently [18]. In addition, accessibility analyses have been widely used in spatial planning and analysis. Karusisi et al. examined the relationship between the accessibility to specific sports facilities and related sports practices, and they showed that the level of education and household income were associated with swimming activities and that the spatial accessibility to a pool was related to swimming by adjusting the personal environment [19]. Furthermore, Bukers and Wibowo concluded that German gymnasiums are not easily accessible [20].
Accessibility, which refers to the ease of communication between different spatial entities that are overcoming distance barriers [21], has been widely considered in transportation planning [22], urban planning [23], and geography studies [24]. Currently, the main methods for calculating accessibility are the cost–distance method [25], the gravitational model method [26], and the buffer zone analysis [27]. The buffer zone essentially represents the topological data of a map patch consisting of polygons that separate a certain geographical target [28]. The cost–distance method calculates the time that is required or the material that is consumed (generally, time, and money) to transport from a spatial point or an area to an urban green space [29]. This method abstracts all of the targets as points during the evaluation; therefore, the error in the evaluation results is large [30]. The gravity model method is suitable for urban or regional spatial-scale studies that do not require highly accurate results. The buffer zone analysis considers the road network, and its results can be used to visualize the accessibility to facilities that are in service and those that are under planning [31]. Therefore, in the present study, the buffer zone analysis was selected for the accessibility calculations.
While studying urban accessibility, different scholars have drawn conclusions on the optimal travel time of urban residents, and the coverage and distribution characteristics of the urban green and blue spaces based on the data of population elements, hydrology, traffic, urban parks, and green spaces in the city, through buffer zone analysis, network analysis, walkability, and accessibility. Wustemann et al. studied the accessibility of urban households to blue spaces in Germany and showed that approximately 20% of German urban households are located at a maximum distance of 500 m from the nearest water source [32]. Moreover, Silva et al. conducted an in-depth analysis of the role of environmental equity in the accessibility to green infrastructure in two European countries. The results showed that the availability and accessibility to public green spaces was higher in Tartu, Estonia, than in it was in Faro, Portugal [33]. Das and Honiball, and Monteiro et al. analyzed the accessibility among South African urban parks [34] and between garden and real cities [35], respectively. They found that the ratio of the road network to the pedestrian facilities network, number of park entrance streets, park size (area), and park night-time illumination were the main variables affecting the accessibility of parks. Additionally, the accessibility in garden cities was better than that in real cities because there is less sprawl in the former. Yin at al. studied the neighborhood accessibility to subsidized housing in US cities and found that better walkability and accessibility measures, which were included in the affordable housing siting criteria, would encourage the development of revitalization strategies to improve the walking experience, services, and transportation [36]. As such, the accessibility analysis enables an objective evaluation of the equity and convenience of the spatial distribution of urban parks, green spaces, and housing.
Previous studies on the accessibility to sports venues have focused on two aspects: the different levels of the areas and the different attributes of the people. The spatial analysis method has been mainly used to analyze the accessibility of sports venues at different regional levels. For example, when they considered the national sports characteristic town as the study site, Liu and Zhou showed that the topography, climate, economy, population density, and traffic conditions were the main factors causing an uneven spatial distribution [37]. In addition, the spatial distribution characteristics of urban sports service facilities, urban fitness paths [38], and school sports venues [39] have been studied. Moreover, the accessibility to sports venues using different population attributes has been studied. For example, based on the fitness needs of the elderly population, Chun and Zheng found that the distribution of fitness venues in Nan gang District, Harbin, did not match the needs of the elderly population that were involved in fitness activities [40]. Other studies on the accessibility to sports venues from the perspective of population geography [41] have also been conducted.
In summary, the accessibility analysis has been applied to study the spatial distribution of sports venues, but most of the previous studies have focused on public sports venues or school venues, and studies that comparatively analyze the spatial distribution of both venue types are relatively few in number. Rung et al. found an association between the activity areas and the number of park users through a study of the relationship between the activity areas, the number of park users, and the level of physical activities in parks [42]. Karusisi et al. also considered the number of sports facilities that there were around residences in a study of the relationship between spatial accessibility to specific sports facilities and physical practice issues. The number of fitness venues and the size of the area are important indicators of the adequacy of fitness venues in a certain area. Therefore, in this study, we analyzed the number and area of public fitness venues in the city statistically and compared the differences between them in each district the city by calculating the percentage of the number of fitness venues and the size of the area in each district. Cranney et al. analyzed the number and location of outdoor gyms and the type of equipment in the outdoor gyms in Sydney, and they found that 36.8% of the gyms were located in the suburbs [43]. Furthermore, it was suggested that increasing the accessibility to outdoor gyms through well-designed locations is an important public health strategy that is used to increase physical activities among at-risk populations. This study was conducted to understand the density of public gyms that are distributed in the study area by assessing the location of gyms in order to analyze the balance of the public gym distribution and then the spatial distribution characteristics. Therefore, in this study, we aimed to (1) analyze the spatial distribution characteristics of fitness venues from the perspective of the number of them and the area that they are in based on data of public fitness venues and school sports venues, (2) analyze the status of the accessibility to an urban “15-min fitness circle” by calculating the ratio of the service area to the service area in which the public fitness venues are located at 0–15 min distance using the buffer zone analysis, (3) compare and analyze the change in accessibility to an urban 15 min fitness circle by calculating the service area-to-service area ratio of the public fitness venues after considering school sports venues, and (4) demonstrate the necessity of opening school sports venues in the main city of Dalian through the abovementioned methods.
We explored following three questions:
  • Is the spatial distribution of public fitness venues in the city reasonable?
  • What is the accessibility to public fitness venues in the city? Does it meet the expectations of full coverage of the 15 min fitness circle?
  • What is the effect of opening school sports venues to the society on the accessibility to fitness venues in the city?
To address the first problem, by obtaining data on the location, number, and area of public fitness venues in the city, we found that the spatial distribution of public fitness venues in the city is uneven. To solve the second problem, we used a buffer zone analysis to study the current situation of the accessibility to public fitness venues in the city. By calculating the service area of each public fitness venue from 0 to 15 min, we found that the city did not reach the state of full coverage of the 15 min fitness circle. For the third problem, we included the school sports venues in the main urban area within the research scope and used the same method that is described above to calculate the service area of the fitness venues after increasing the range to include school sports venues. Through a comparative analysis, we found that the opening of school sports venues to society will lead to a substantial increase in the accessibility to fitness venues in the main urban area. The abovementioned three issues will be discussed in detail in the following sections.

2. Materials and Methods

2.1. Study Area

According to the data that were released by the State General Administration of Sports in April 2022, there are 3,971,400 sports venues in China, with a sports venue area of 3411 million square meters and a per capita sports venue area of 2.41 square meters. According to the latest statistics that were released by the Liaoning Provincial Sports Bureau, there are 71,851 sports venues in Liaoning Province, with a sports venue area of 9169.71 square meters and a per capita sports venue area of 2.15 square meters. Liaoning Province has been striving to achieve the full coverage of the 15 min fitness circle in urban communities by 2025. Dalian, Liaoning Province, is an important central city on the north coast of China and it is one of the representative cities in Liaoning Province. Therefore, it was chosen as the target city for this study. Dalian is located between 38°47′–39°07′ N and 121°16′–121°45′ E, in the southernmost part of Northeast China, south of Liaodong Peninsula, at the junction of Yellow and Bohai Seas, and across the sea from Shandong Peninsula. As the main urban area of Dalian (Zhongshan, Shahekou, Xigang, and Ganjingzi Districts) is the most economically developed and densely populated area, with a stable building planning area, it is also the representative area of Dalian City. Therefore, we selected Zhongshan, Shahekou, Xigang, and Ganjingzi Districts of Dalian as the study areas (Figure 1). The data of the island areas were not included in this study.

2.2. Data Source

Public fitness venues mainly include fitness trails, fitness parks, and different types of sports fields in the community. The names and areas of the fitness venues were obtained from the Dalian Sports Bureau, and their geographical coordinates were obtained from Baidu maps (2022). In total, 1065 site locations were obtained. In this study, 272 public fitness venues with an area of 400 m2 or more were selected as the study sites based on the venue level and the visualization degree of their area in the maps. The administrative vector data including the scope and boundary of each administrative district and street of the main urban area of Dalian were obtained from the Resource, Environment Science and Data Center and the Baidu map websites. Moreover, the road network data of the main urban area of Dalian were obtained using OpenStreetMap (2022). Based on the management policy, school sports venues are not open to urban residents, therefore, in this study, public fitness venues refer to fitness venues that are outside of schools and do not include sports venues that are inside schools. Therefore, public fitness venues and school sports venues are independent of each other and are juxtaposed. However, in the discussion section, when the public fitness venues and school sports venues are combined and analyzed, we refer to them collectively as sports venues. Table 1 lists the sources of each data type that is used in this study.

2.3. Methods

In this study, we used the data of street-level boundaries, urban road networks, point areas of public fitness venues, and school sports venues [44]. Spatial overlay, buffer zone [45], and comparative analyses were used to analyze the spatial distribution characteristics of the public fitness venues and the school sports venues. By combining the administrative planning and spatial distribution characteristics of the sports and fitness venues, the buffer zone method was used for the public fitness venues considering walking durations of 0–5, 0–10, and 0–15 min and the walking speed of urban residents (1 m/s) [46]. The service area that was covered by each period was calculated to determine its service area ratio [47] as follows:
P = S1/(S2 − S3) × 100%
where P is the ratio of the public fitness service area, S2 is the area of each administrative district, S3 is the area of public fitness venues in each administrative district, and S1 is the area of public fitness venue services in each administrative district.
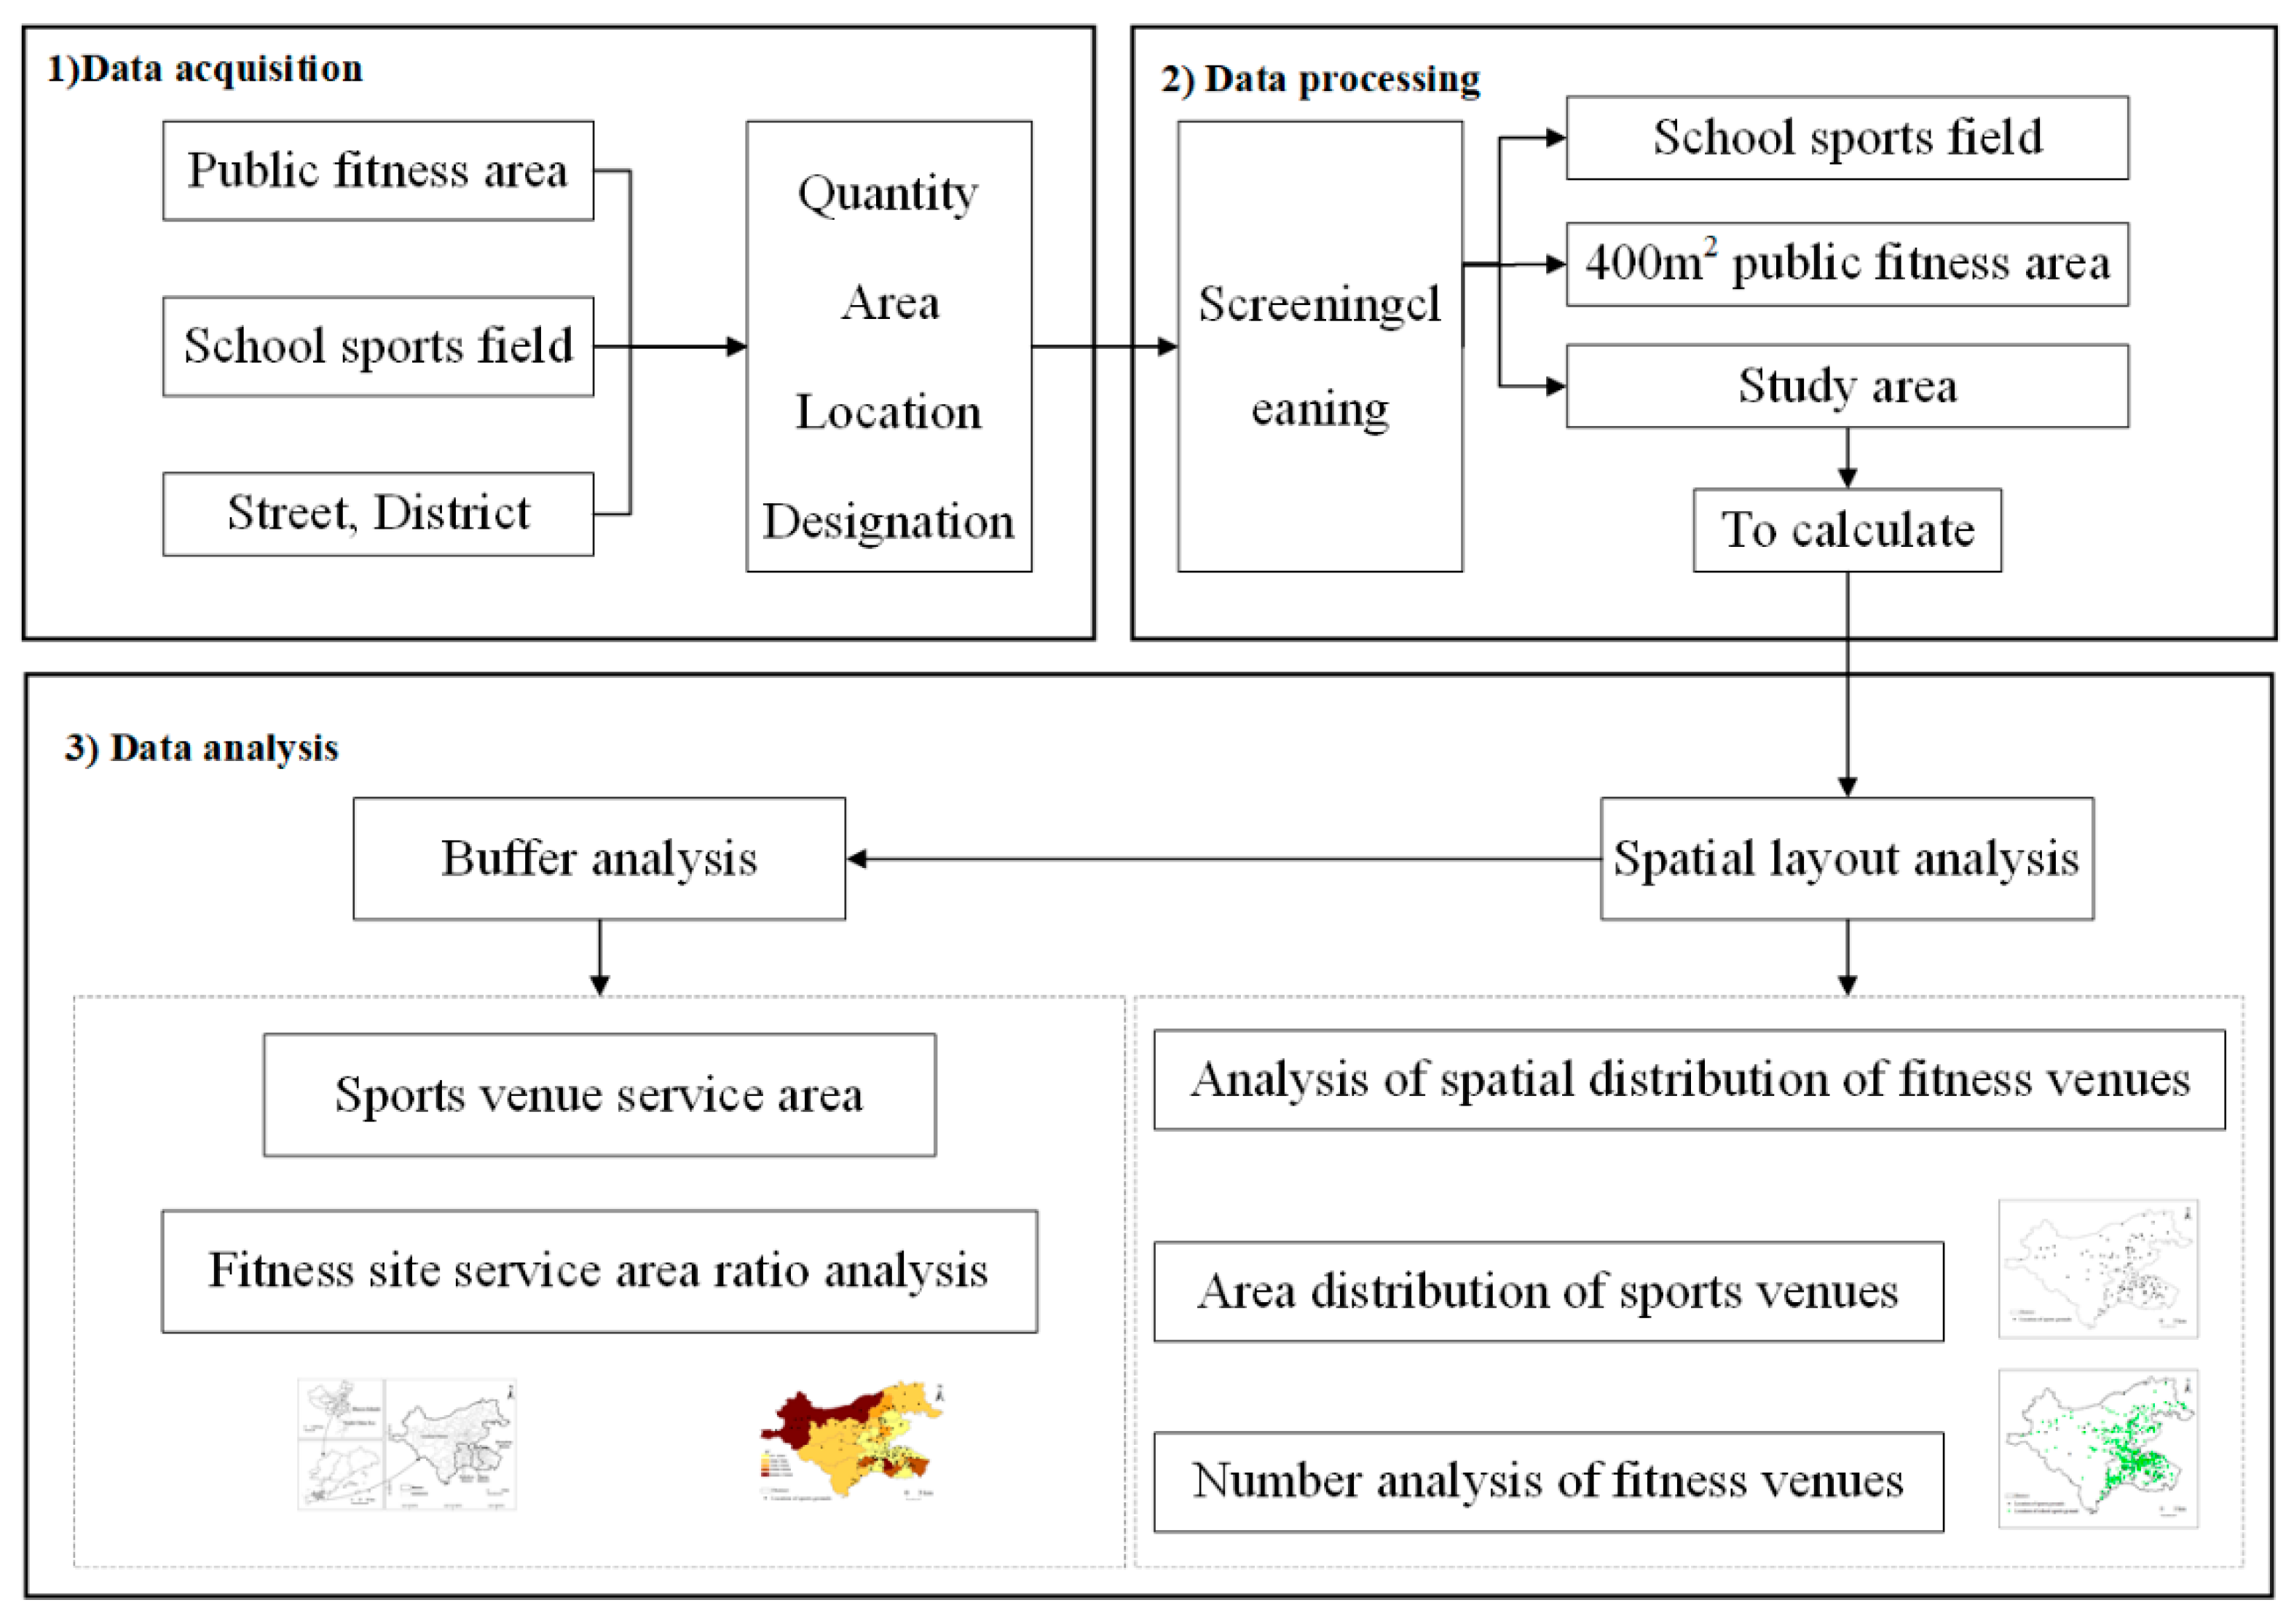
To investigate the distribution characteristics of the public fitness venues, ArcGIS10.7 software was used to filter and process the coordinates and the area of the public fitness sports venues and analyze them in terms of the balance of the spatial area distribution. The overall workflow chart of the study is shown in Figure 2.

3. Results

3.1. Location Distribution Characteristics of Public Fitness Venues

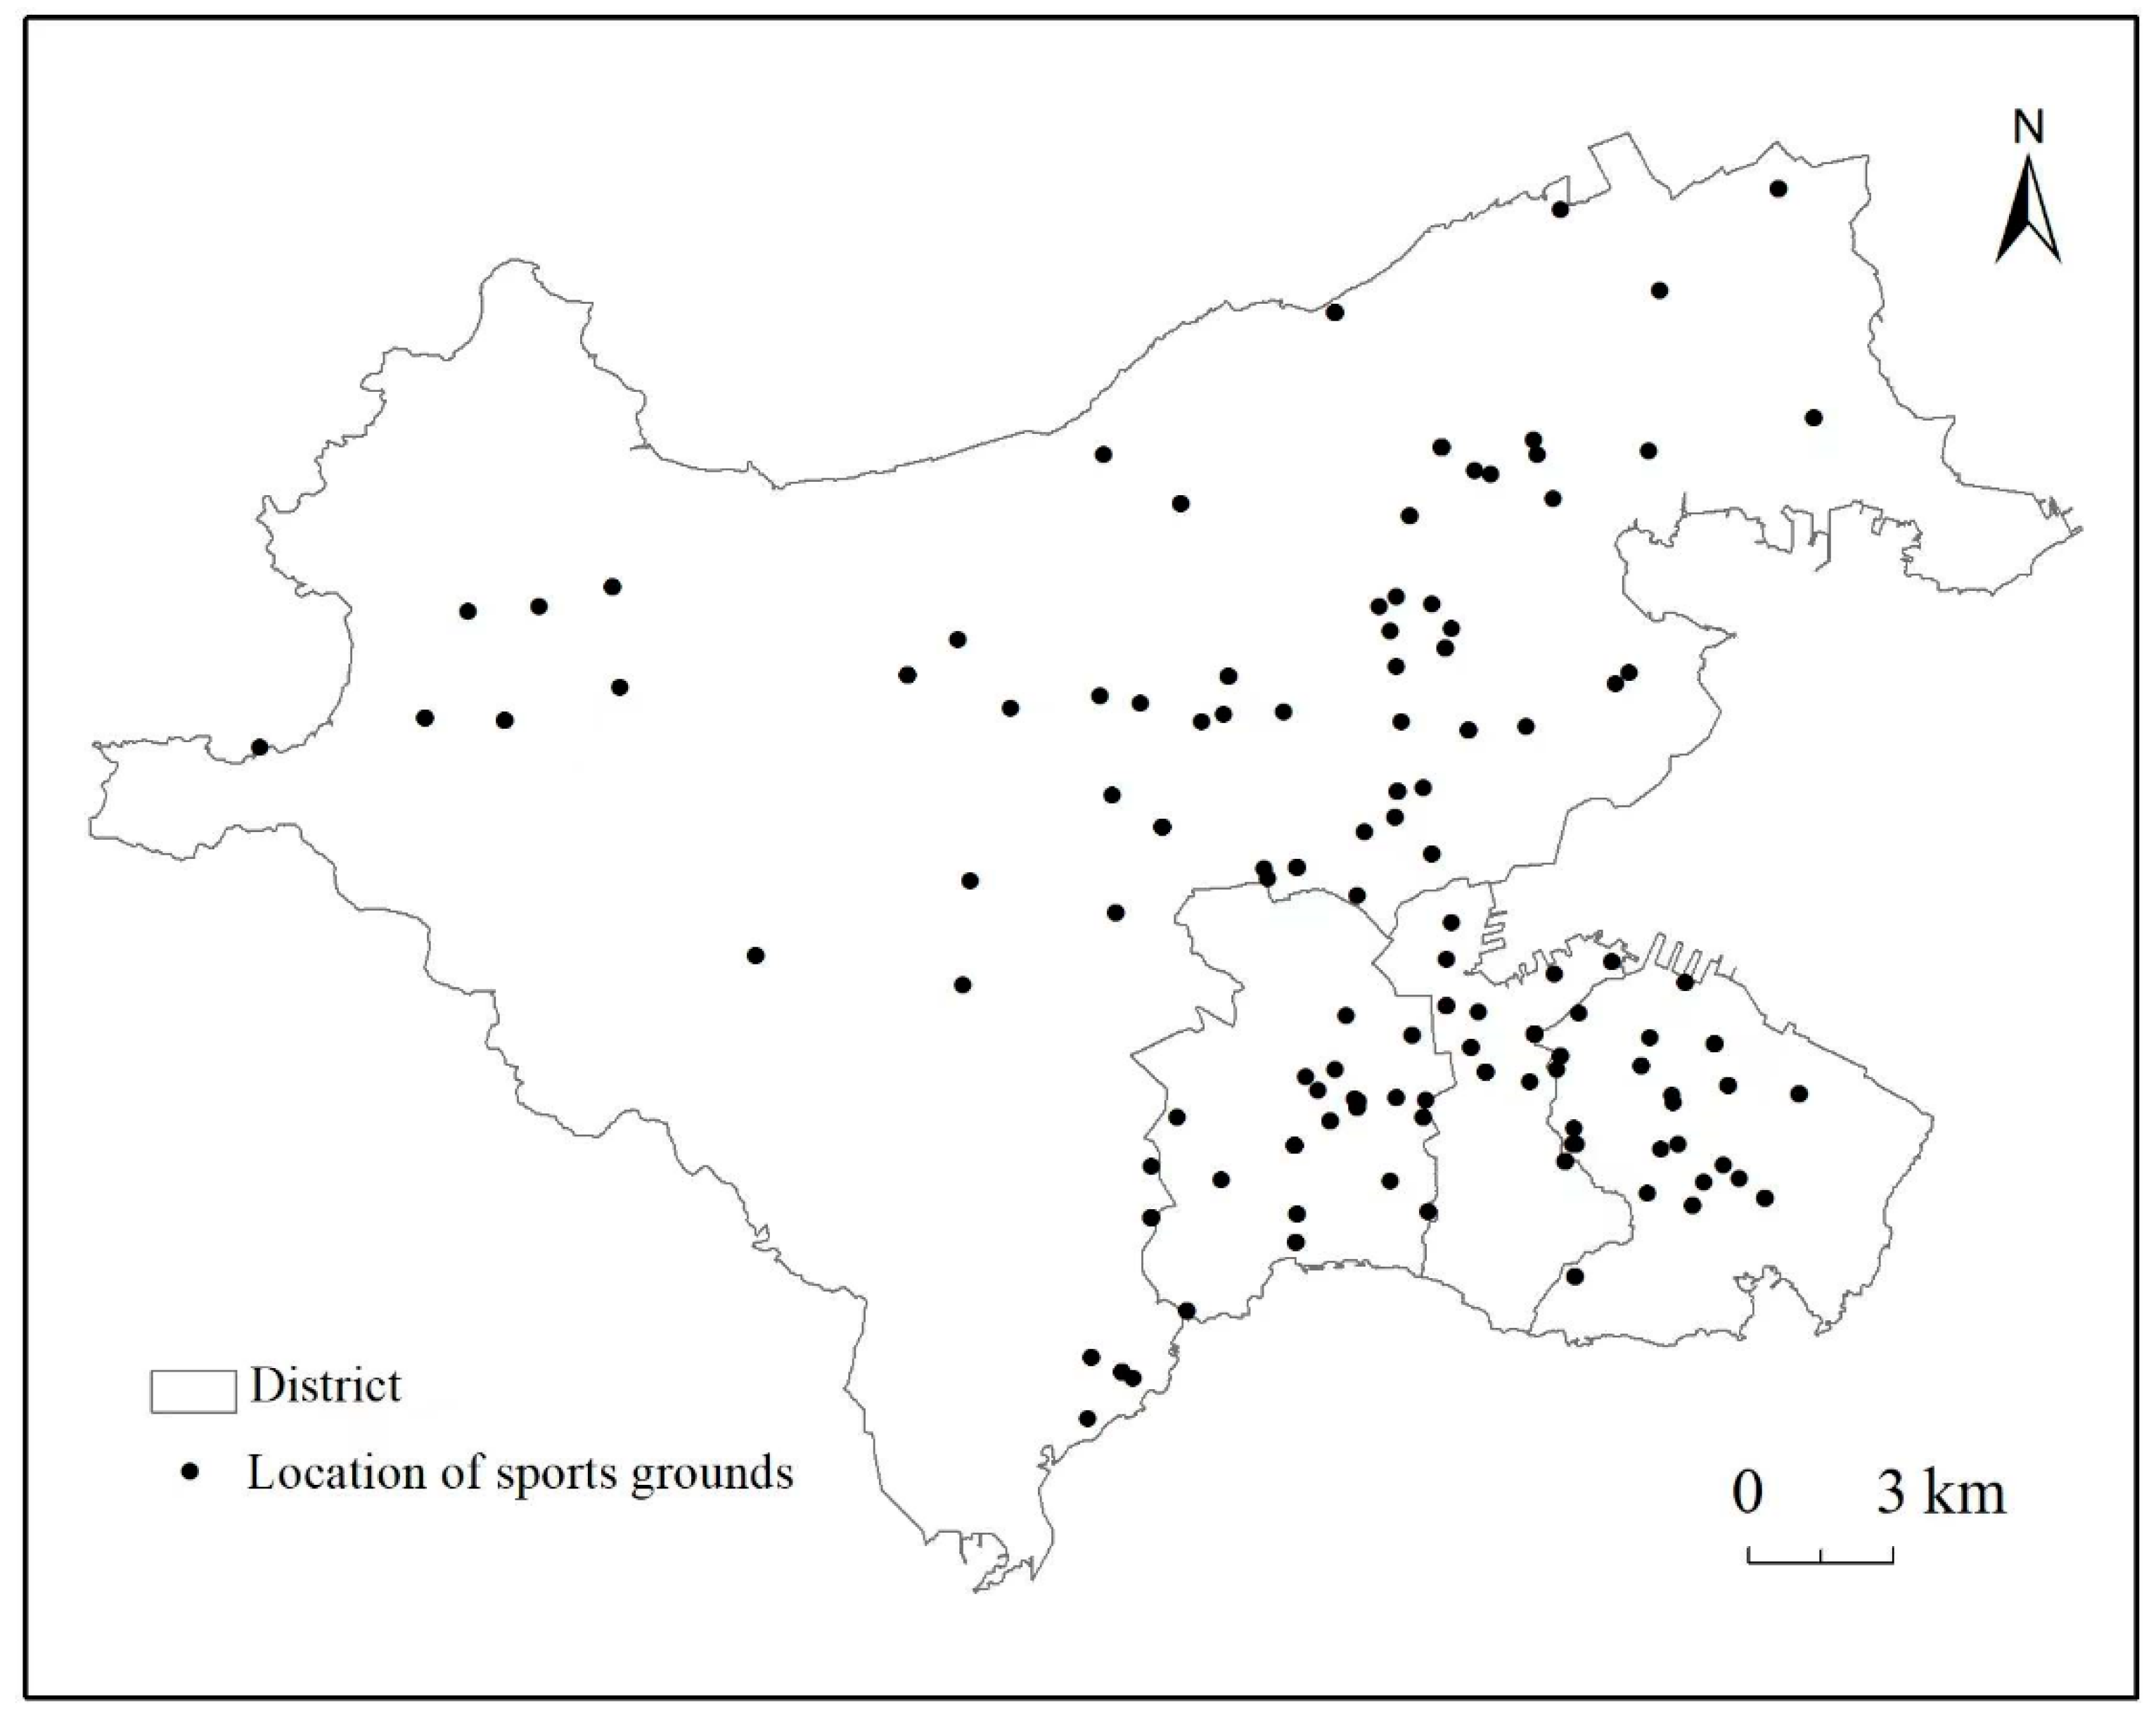
The public fitness venues with an area of >400 m2 were mainly concentrated in the central and southeastern parts of the study area (Figure 3), showing that the geographic location of public fitness venues (with an area >400 m2) was mainly concentrated in the central and southeastern parts of it. The number of public fitness venues in Ganjingzi District was the highest (143; Table 2), but the distribution was generally scattered, mainly in the eastern part. This finding was possibly because the built-up area was mainly concentrated in the east, whereas the western area was mainly covered by forests and mountains, with a relatively less built-up area, thereby resulting in fewer fitness venues in the western area than in the eastern area. Furthermore, 60 public fitness venues were identified in Shahekou District, and they were mostly concentrated in the central areas possibly because of the small area of the administrative district. Xigang District had only 36 fitness venues, which were mainly distributed in the northern area because the southern area is mostly mountainous and covered with forests, and such landscapes are less conducive to the construction of fitness venues. Zhongshan District had the fewest fitness sports venues (33), and they were mainly distributed in the central and northern regions, with there being relatively few public fitness venues in the coastal areas.

3.2. Area Distribution Characteristics of Public Fitness Venues

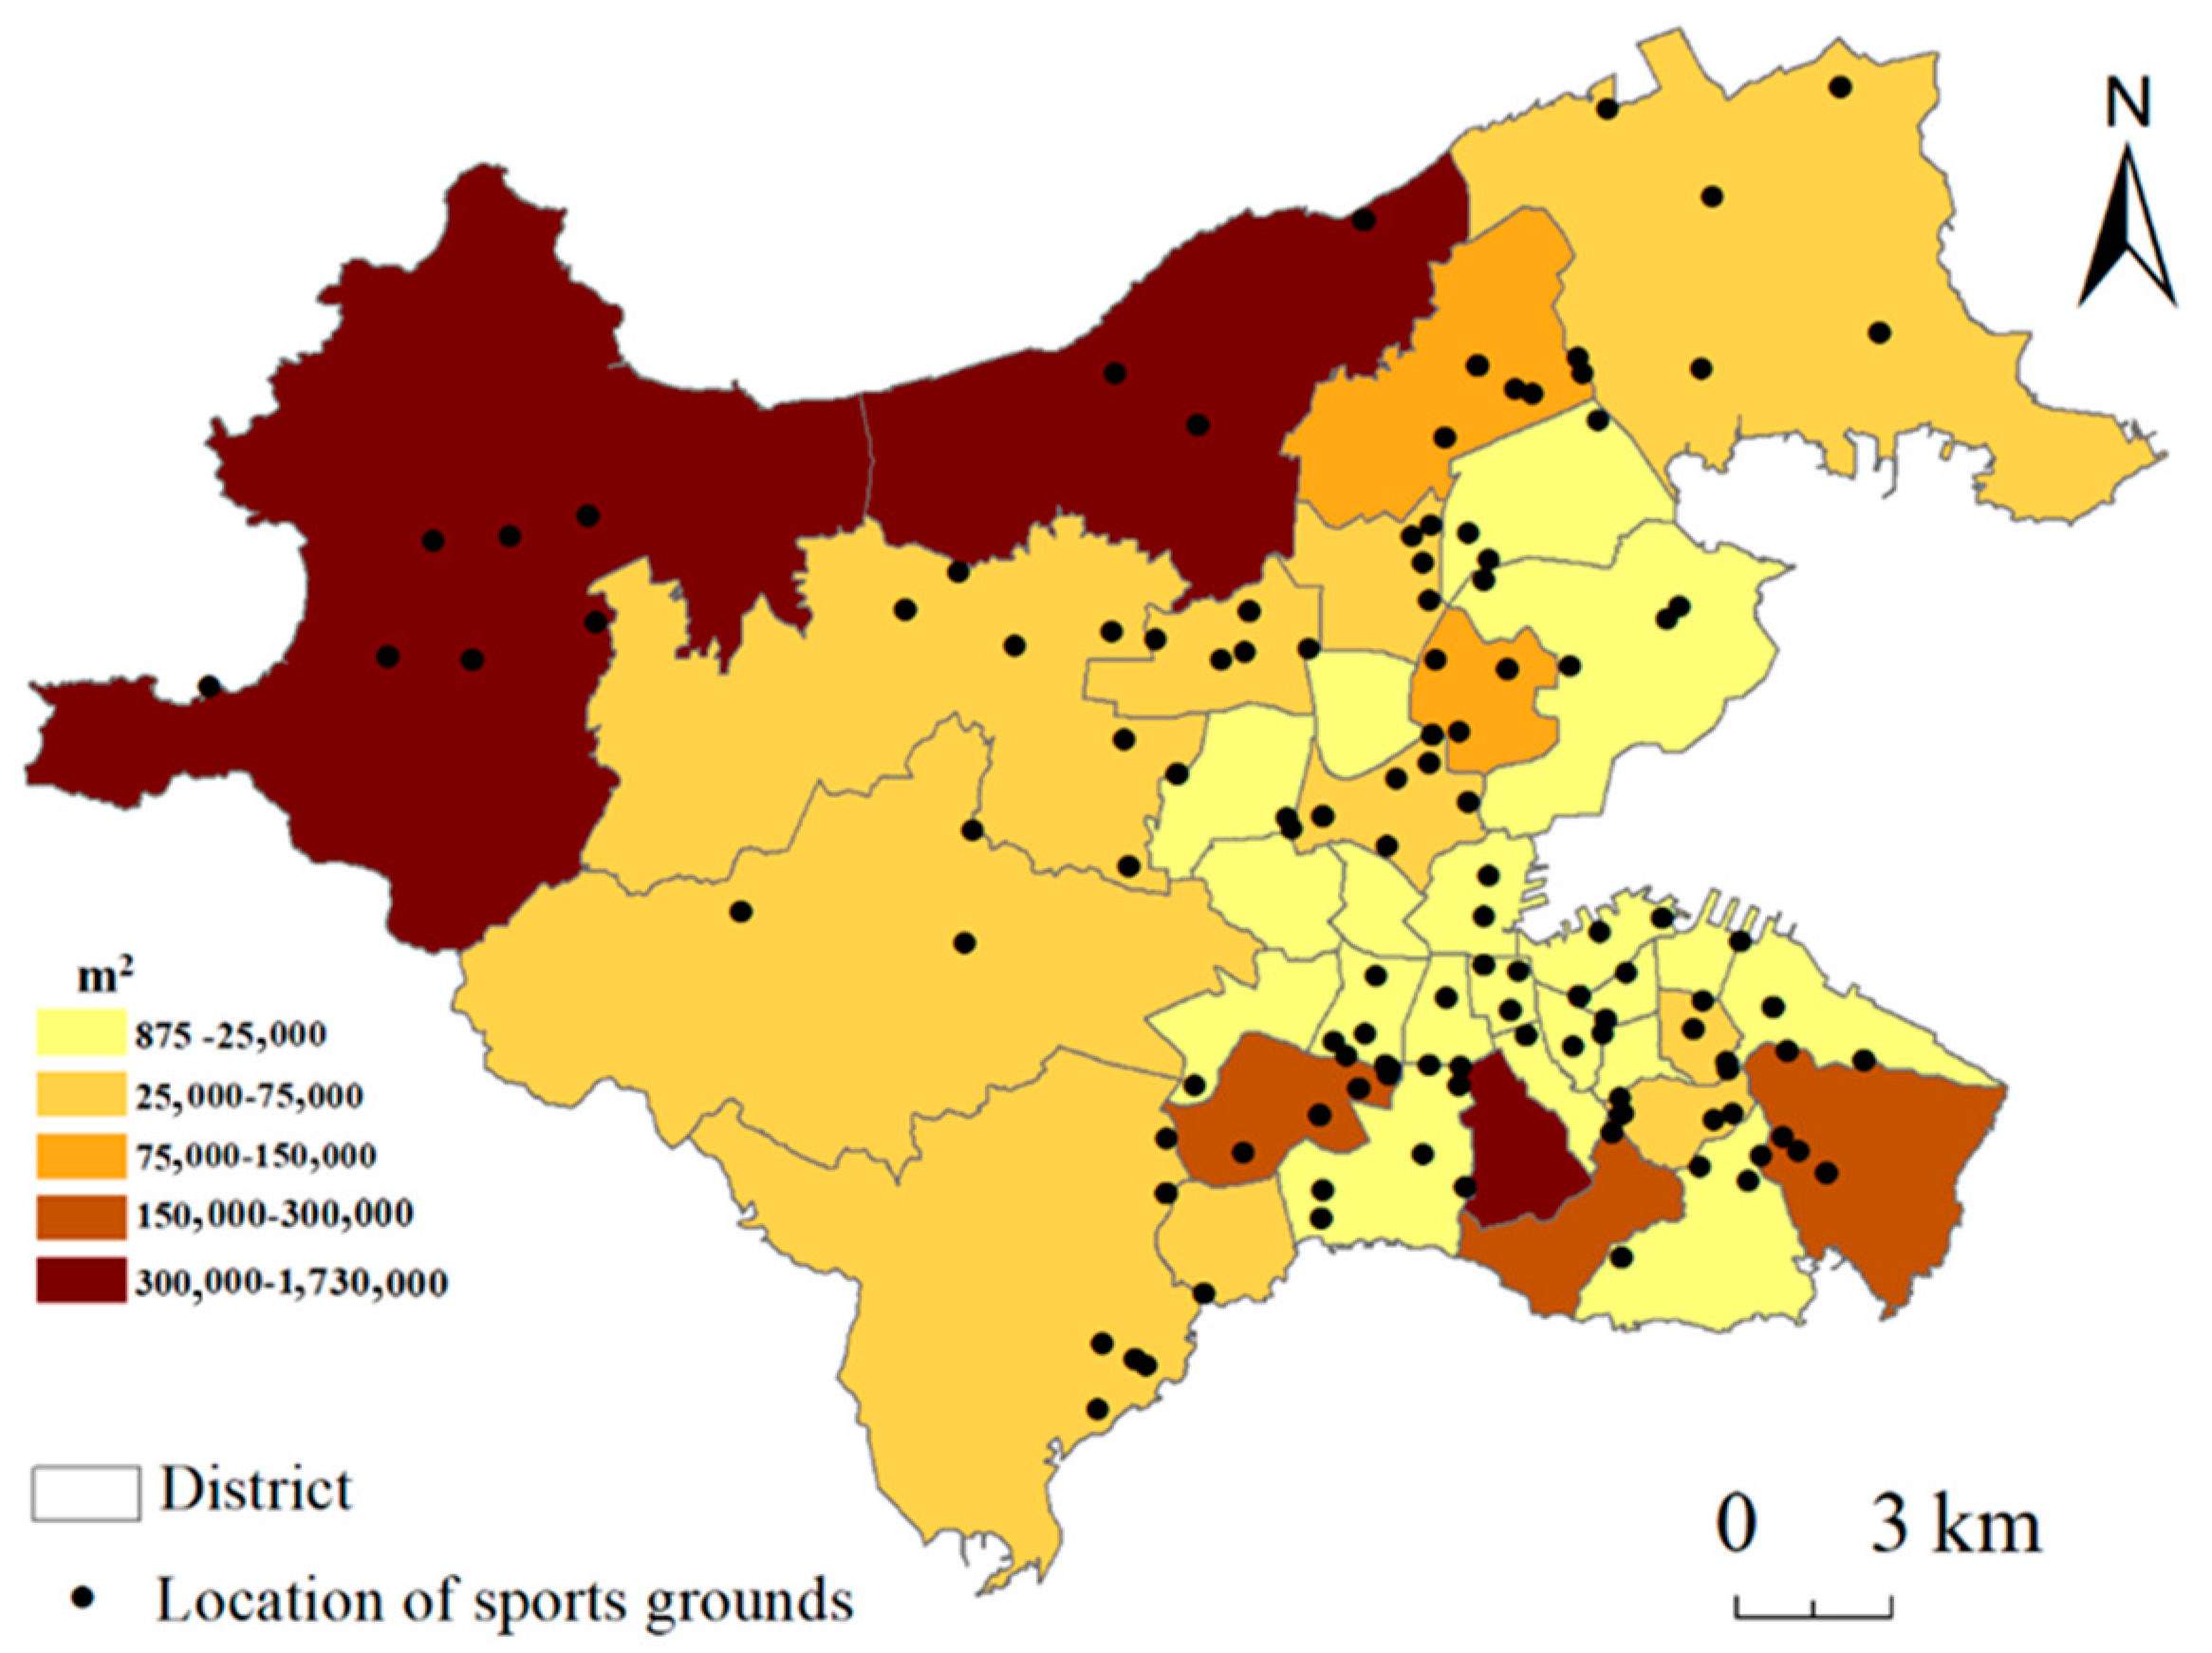
To analyze the area distribution of the public fitness venues on the main urban streets, the total area of the public fitness venues in each of the 38 streets in the main urban area was calculated, and the areas were divided into five classes according to their size (Figure 4). Although the number of fitness venues on the streets of the central area was high, the total fitness venue area was relatively small because of the exponential economic development and dense population in this area, thereby increasing the demand for residential and commercial development rather than for sports venues. Although the streets around the main city had fewer sports venues, the area of the sports venues was larger than that which was in the central region, possibly due to the relatively low demand for land in the coastal areas, which usually have large beach bathing places and fitness trails. As shown in Table 3, the number of streets with fitness venue areas ranging between 875 and 75,000 m2 was 30, thus accounting for 78.95% of the total area, whereas the fitness venue areas on six streets were above 0.15 km2, thus accounting for less than 16%. These findings indicate that the fitness venue area on the streets in the main urban area of Dalian is uneven and show large spatial differences.

3.3. Accessibility Analysis of Public Fitness Venues

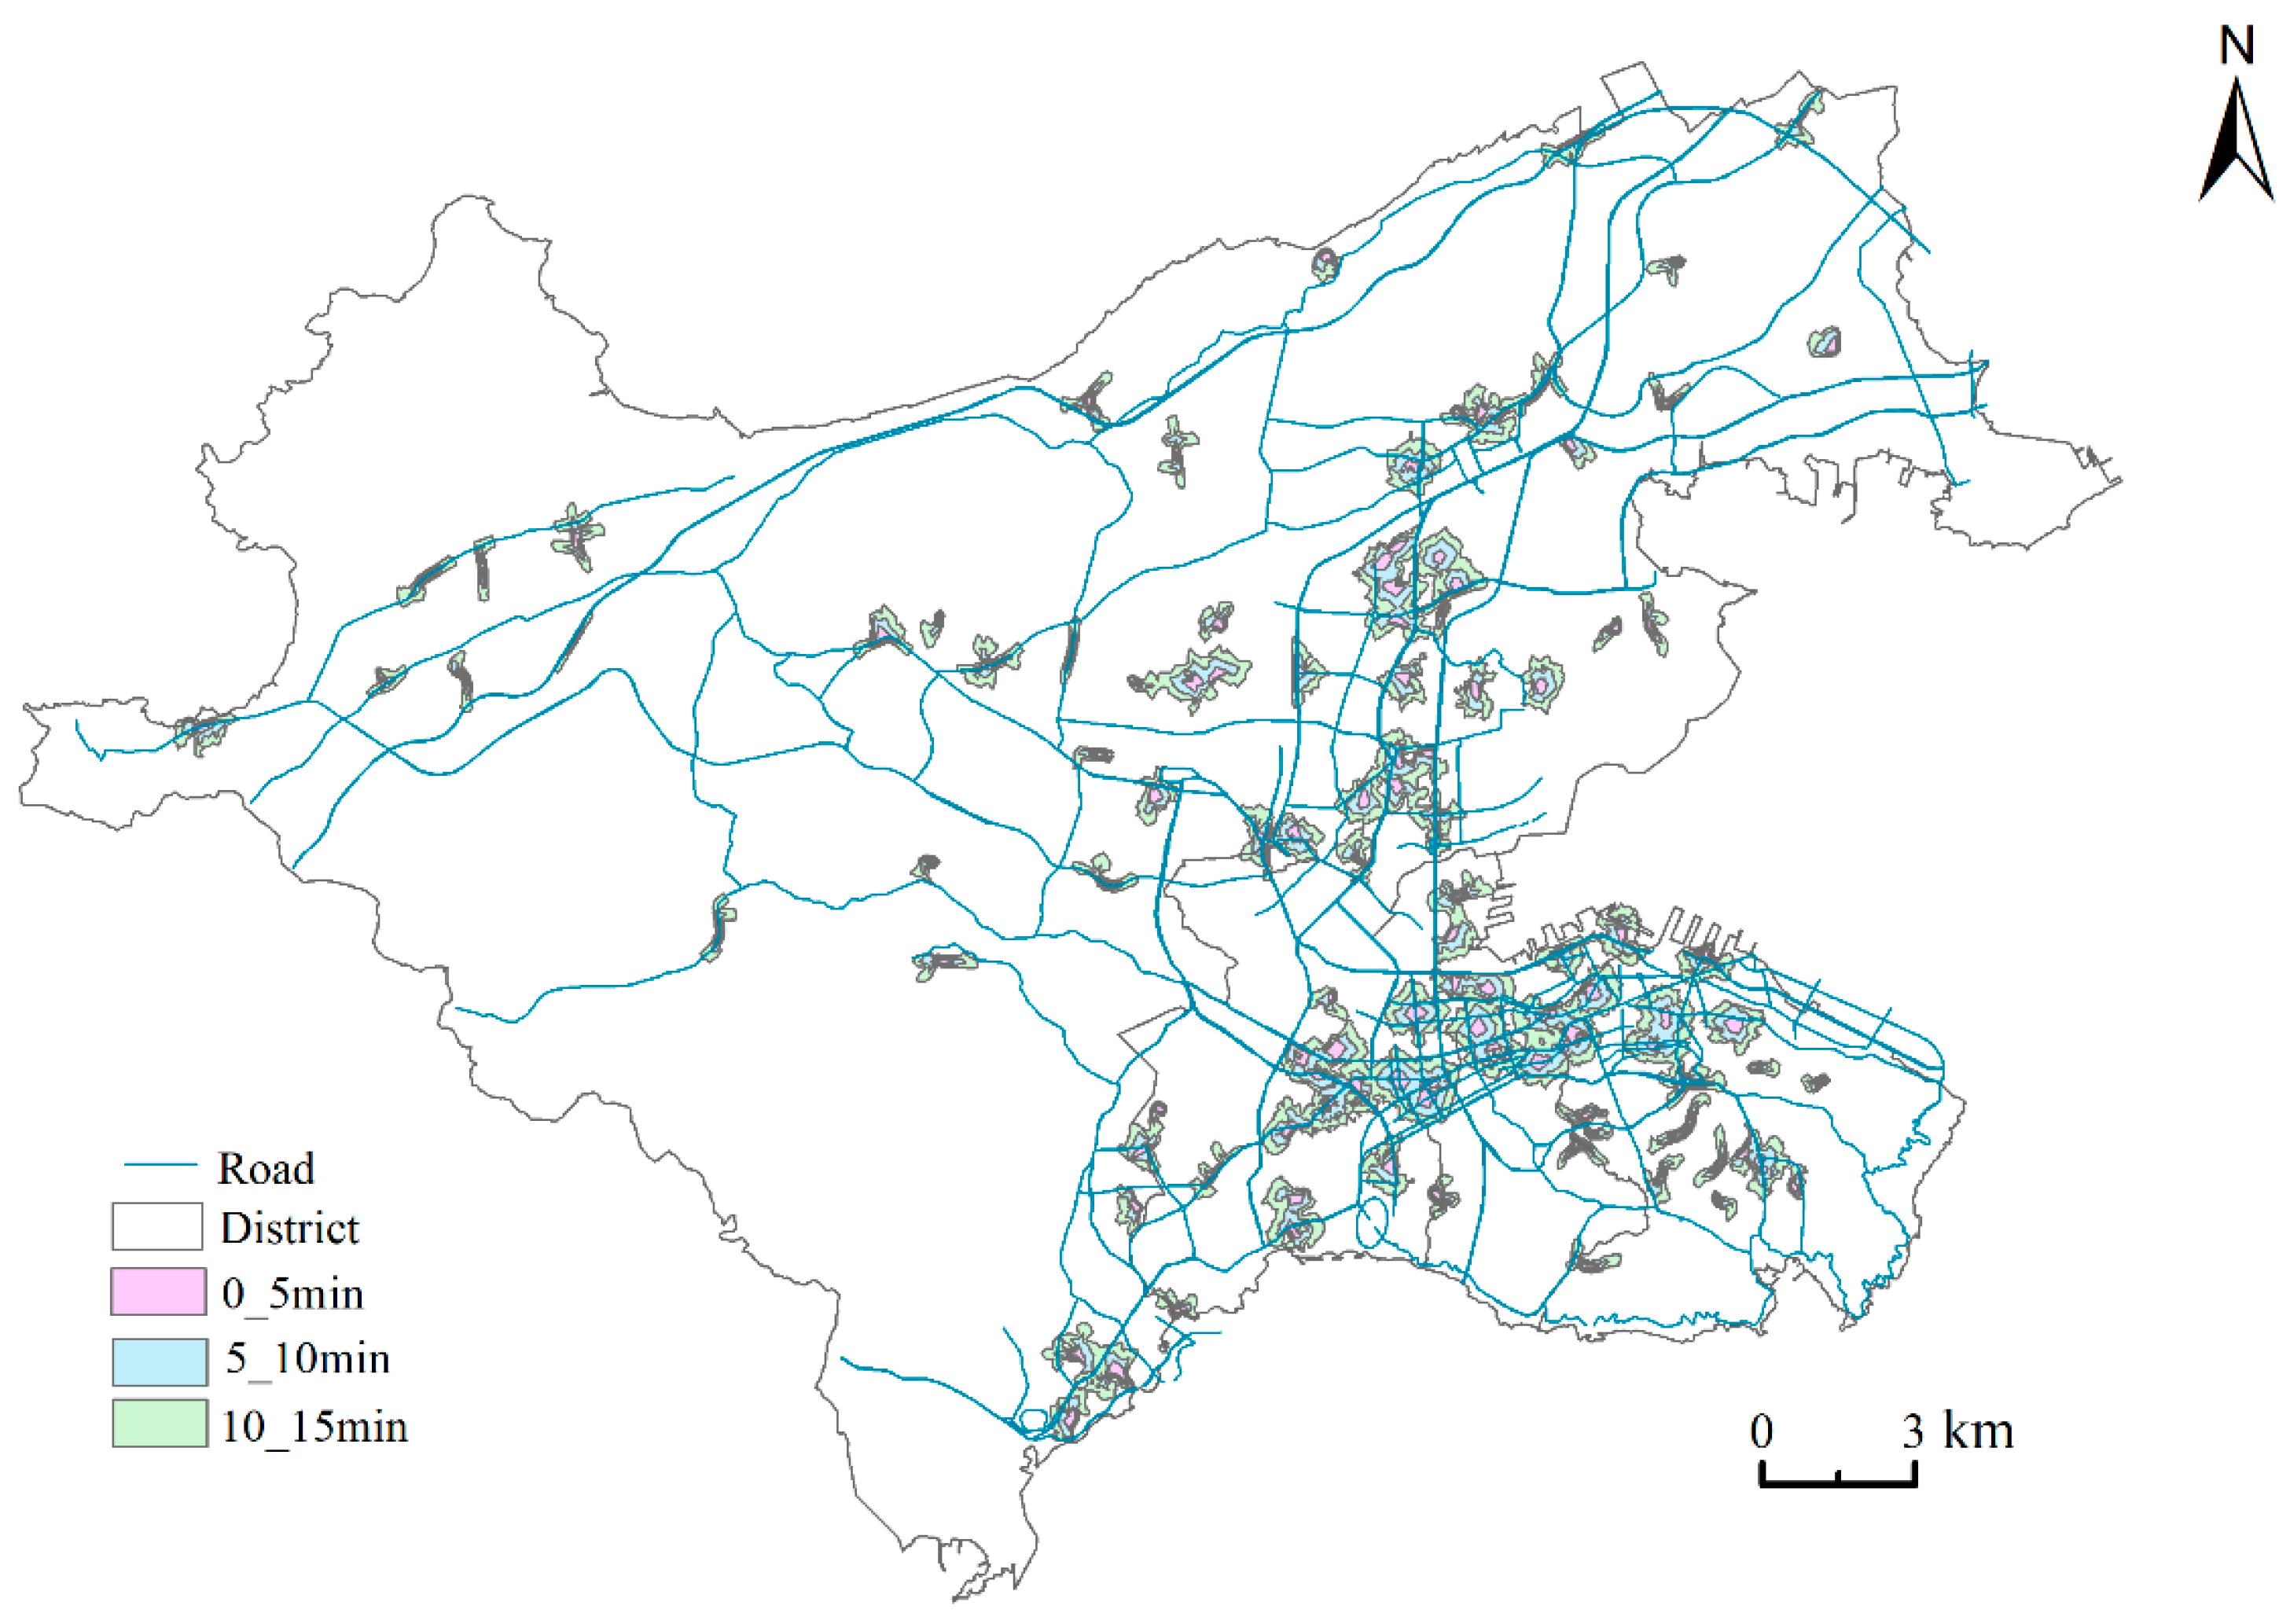
The accessibility to public fitness venues was studied using the buffer zone method [48]. The service area of public fitness venues represents the area that is covered by urban residents by walking at a speed of 1 m/s in a time range of 0–15 min [49] with each venue being at the center (Figure 5 and Table 4).
In the 0–5 min time range, the service area of the fitness venues in Xigang District was 0.56 km2, with it having the highest service area ratio of 2.18%, which was followed by Shahekou, Zhongshan, and Ganjingzi Districts. The service area of the fitness venues in Ganjingzi District was 2.09 km2, but the service area ratio was the lowest (0.41%) because the urban area in this district was 508.42 km2. In the time range of 0–10 min, the service area ratio of for the fitness venues in each district improved. The service area ratio of Xigang District increased to 10.09%, which was the highest and it was followed by that of Shahekou, Zhongshan, and Ganjingzi Districts. Ganjingzi District showed the lowest increase in the service area ratio of the sports and fitness area (from 0.41% to 1.79%). In the 0–15 min time range, Zhongshan, Shahekou, and Xigang Districts showed almost the same level of change in their service area ratios of the fitness venues, but Xigang District had the highest change (24.42%), which was followed by Shahekou District (19.02%) and Zhongshan District (17.13%). Ganjingzi District showed a considerable change, with the service area increasing from 9.09 km2 to 24.42 km2, but the service area ratio of the fitness venues was still relatively low (4.82%).
In conclusion, the highest ratio of the fitness venue service area within a 0–15 min walking duration was observed in Xigang District, which was followed by Shahekou, Zhongshan, and Ganjingzi Districts. However, although the service area and service area ratio of the fitness venues differed significantly among the four districts (Table 4), the overall value was relatively low, with the highest value being only 24.42%. Therefore, the accessibility of the residents to the fitness venues within a 0–15 min walking duration was relatively low, which is not conducive to them accessing the venues.

4. Discussion

Since the mid-1990s, the Ministry of Education of the People’s Republic of China and the General Administration of Sports of China have issued several documents to extend the accessibility of the public and school sports venues; however, the effect of opening school sports venues to the society in cities was not satisfactory. According to experts, if all of the existing school sports venues are fully and effectively developed and utilized, then their access for all residents will be increased, thus leading to a marked improvement in urban sports in China and national fitness [50]. Therefore, in this study, we analyzed the changes in the spatial distribution and accessibility to fitness venues in each administrative district after considering school sports venues.

4.1. Spatial Distribution Characteristics of Sports Venues after Considering School Sports Venues

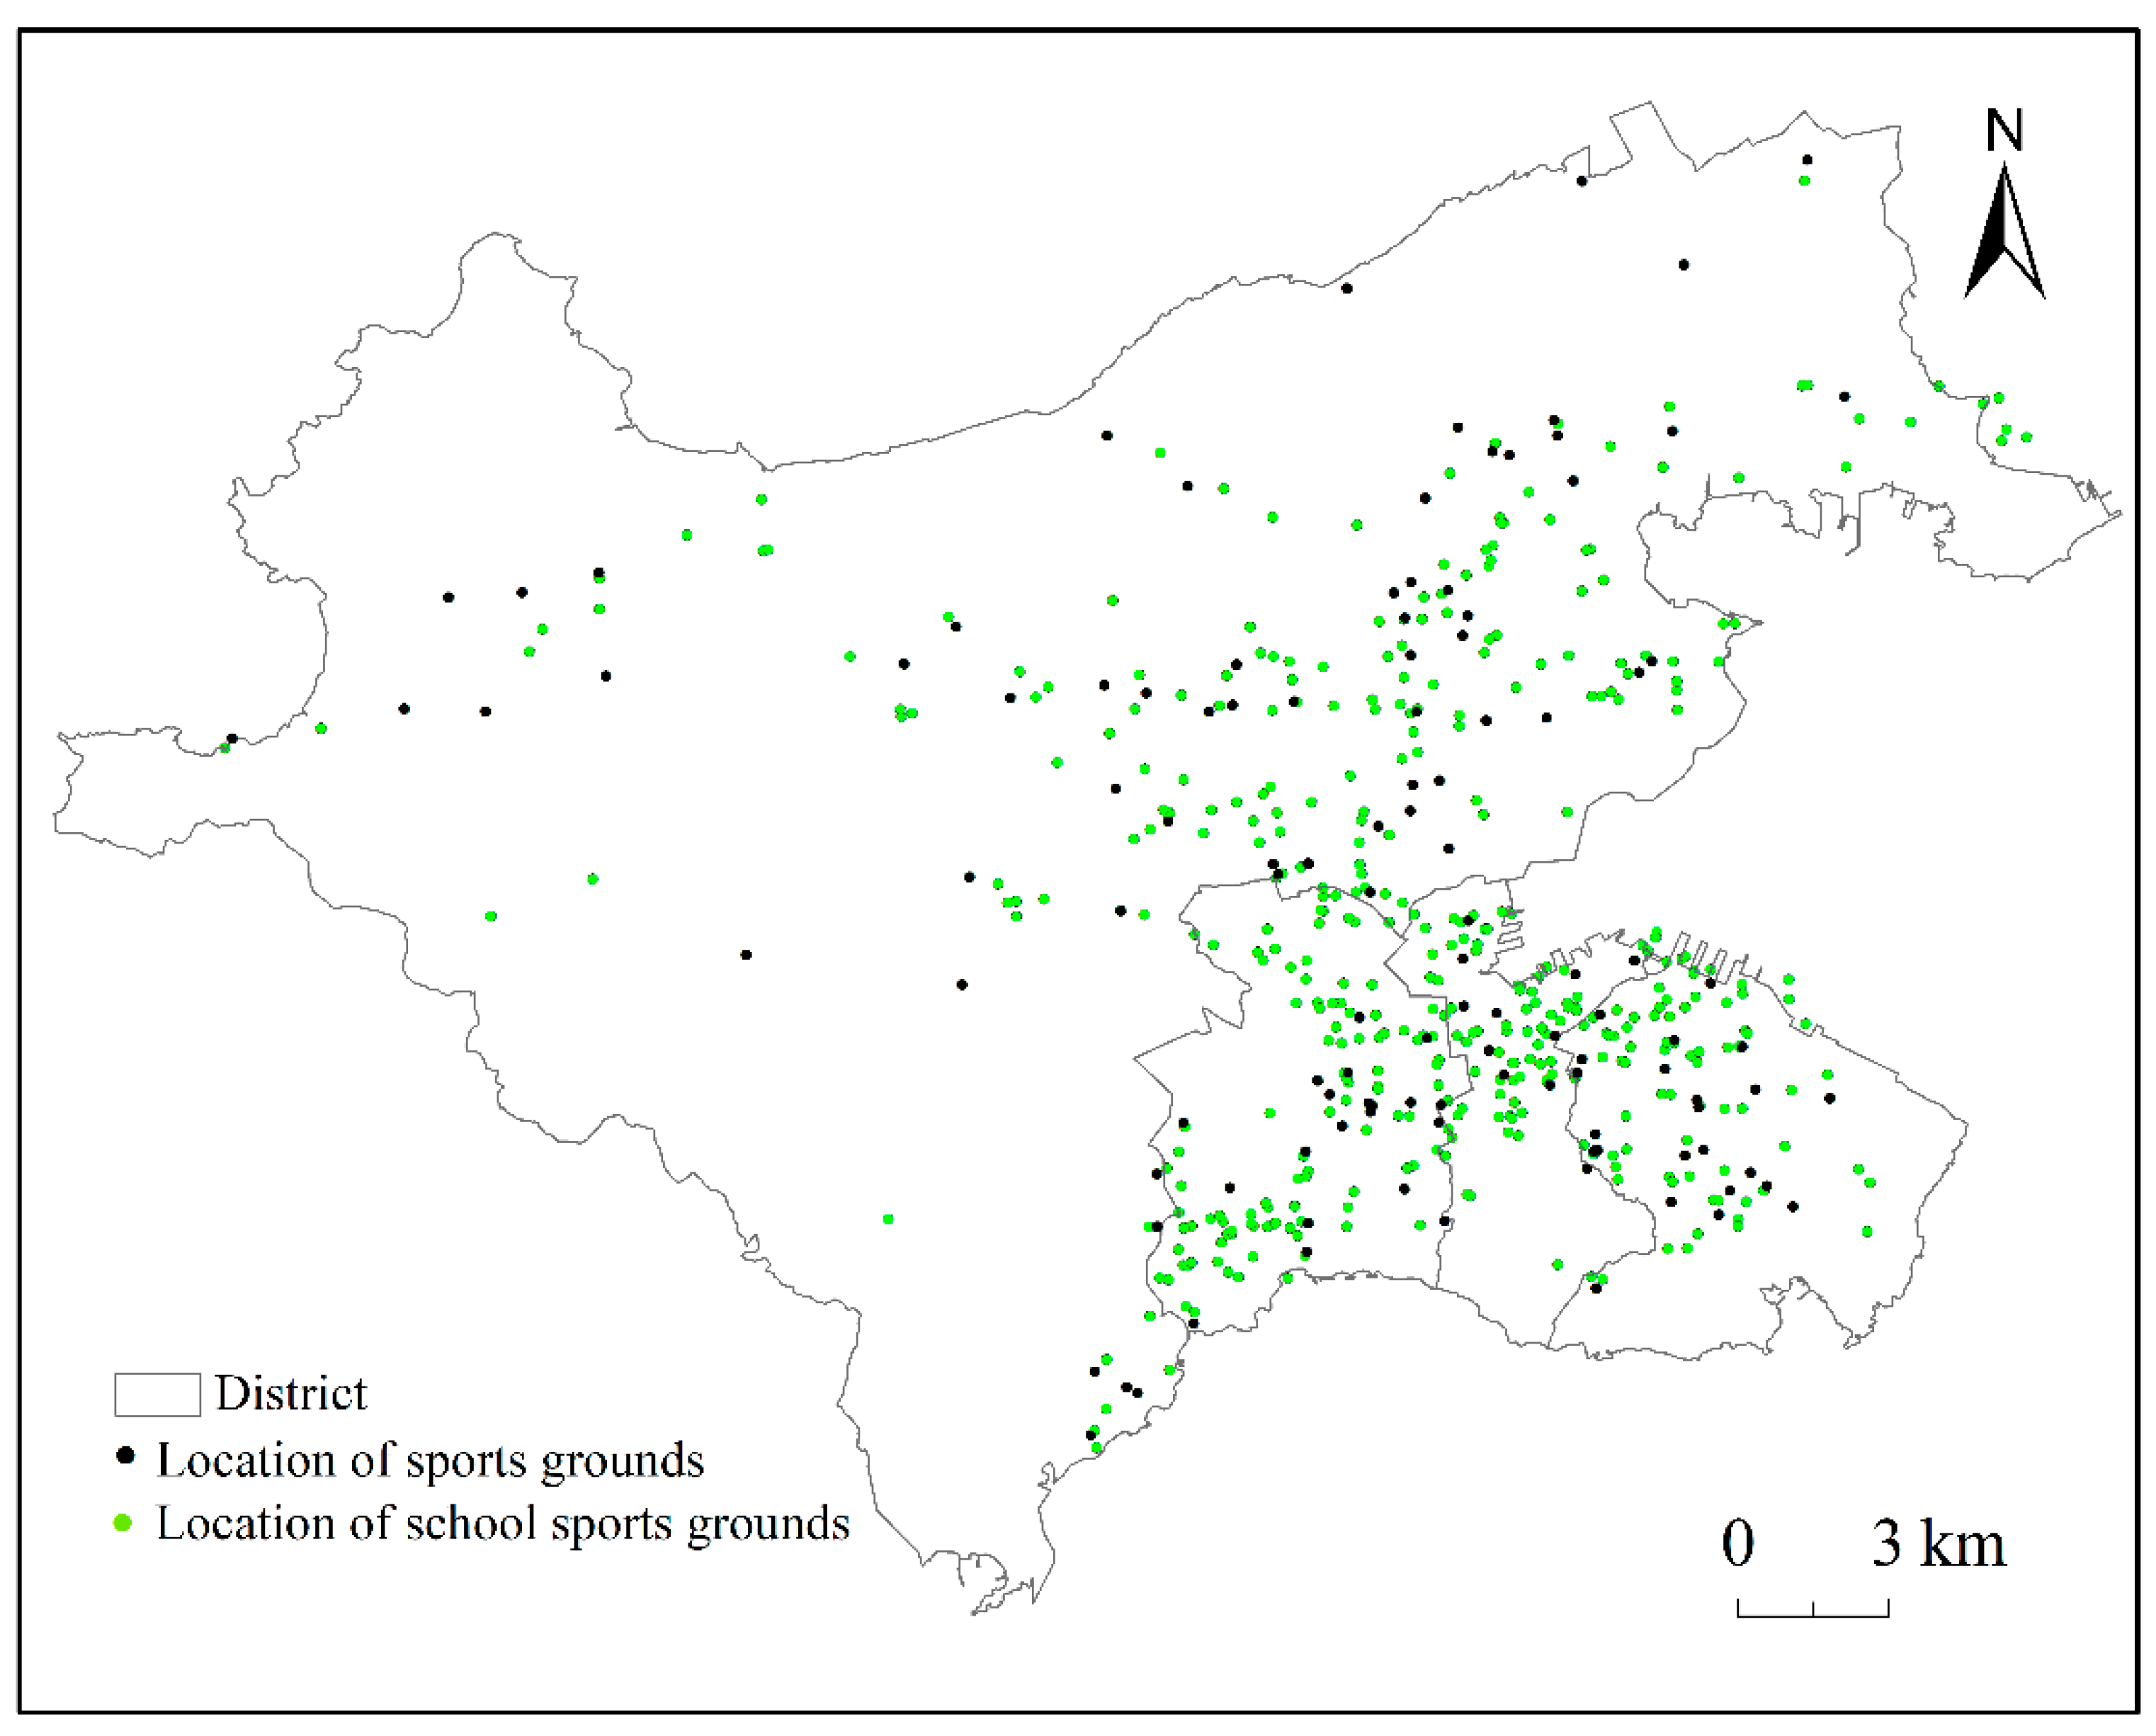
As shown in Figure 6, the spatial distribution characteristics of the fitness venues and the number of sports venues in the main urban area of Dalian changed significantly after considering school sports venues. In terms of the spatial distribution characteristics, the increase in sports venues was mainly concentrated in the northeast and southwest of Shahekou District, north of Xi gang District, northwest of Zhongshan District, and in the central and eastern areas of Ganjingzi District. The sports venues in the northern coastal area and the western area of Ganjingzi District were relatively scattered due to there being dispersed economic development and a varied topography. Although the total number of fitness venues in Ganjingzi District was the highest (493), the number of school sports venues was relatively low due to the large base number of public fitness venues, thereby resulting in an increase of only 2.45% (Table 5). Shahekou had the highest growth rate (4.47%) possibly because of the high number of educational institutes in this area, especially colleges and universities. This was followed by Xigang District (4.08%) and Zhongshan District (2.42%). Furthermore, if school sports venues were open to the public, then the number of fitness venues within the main city would increase from 272 to 1117, which could effectively alleviate the problem of there being an insufficient number of fitness venues.

4.2. Accessibility Analysis of Sports Venues after Considering School Sports Venues

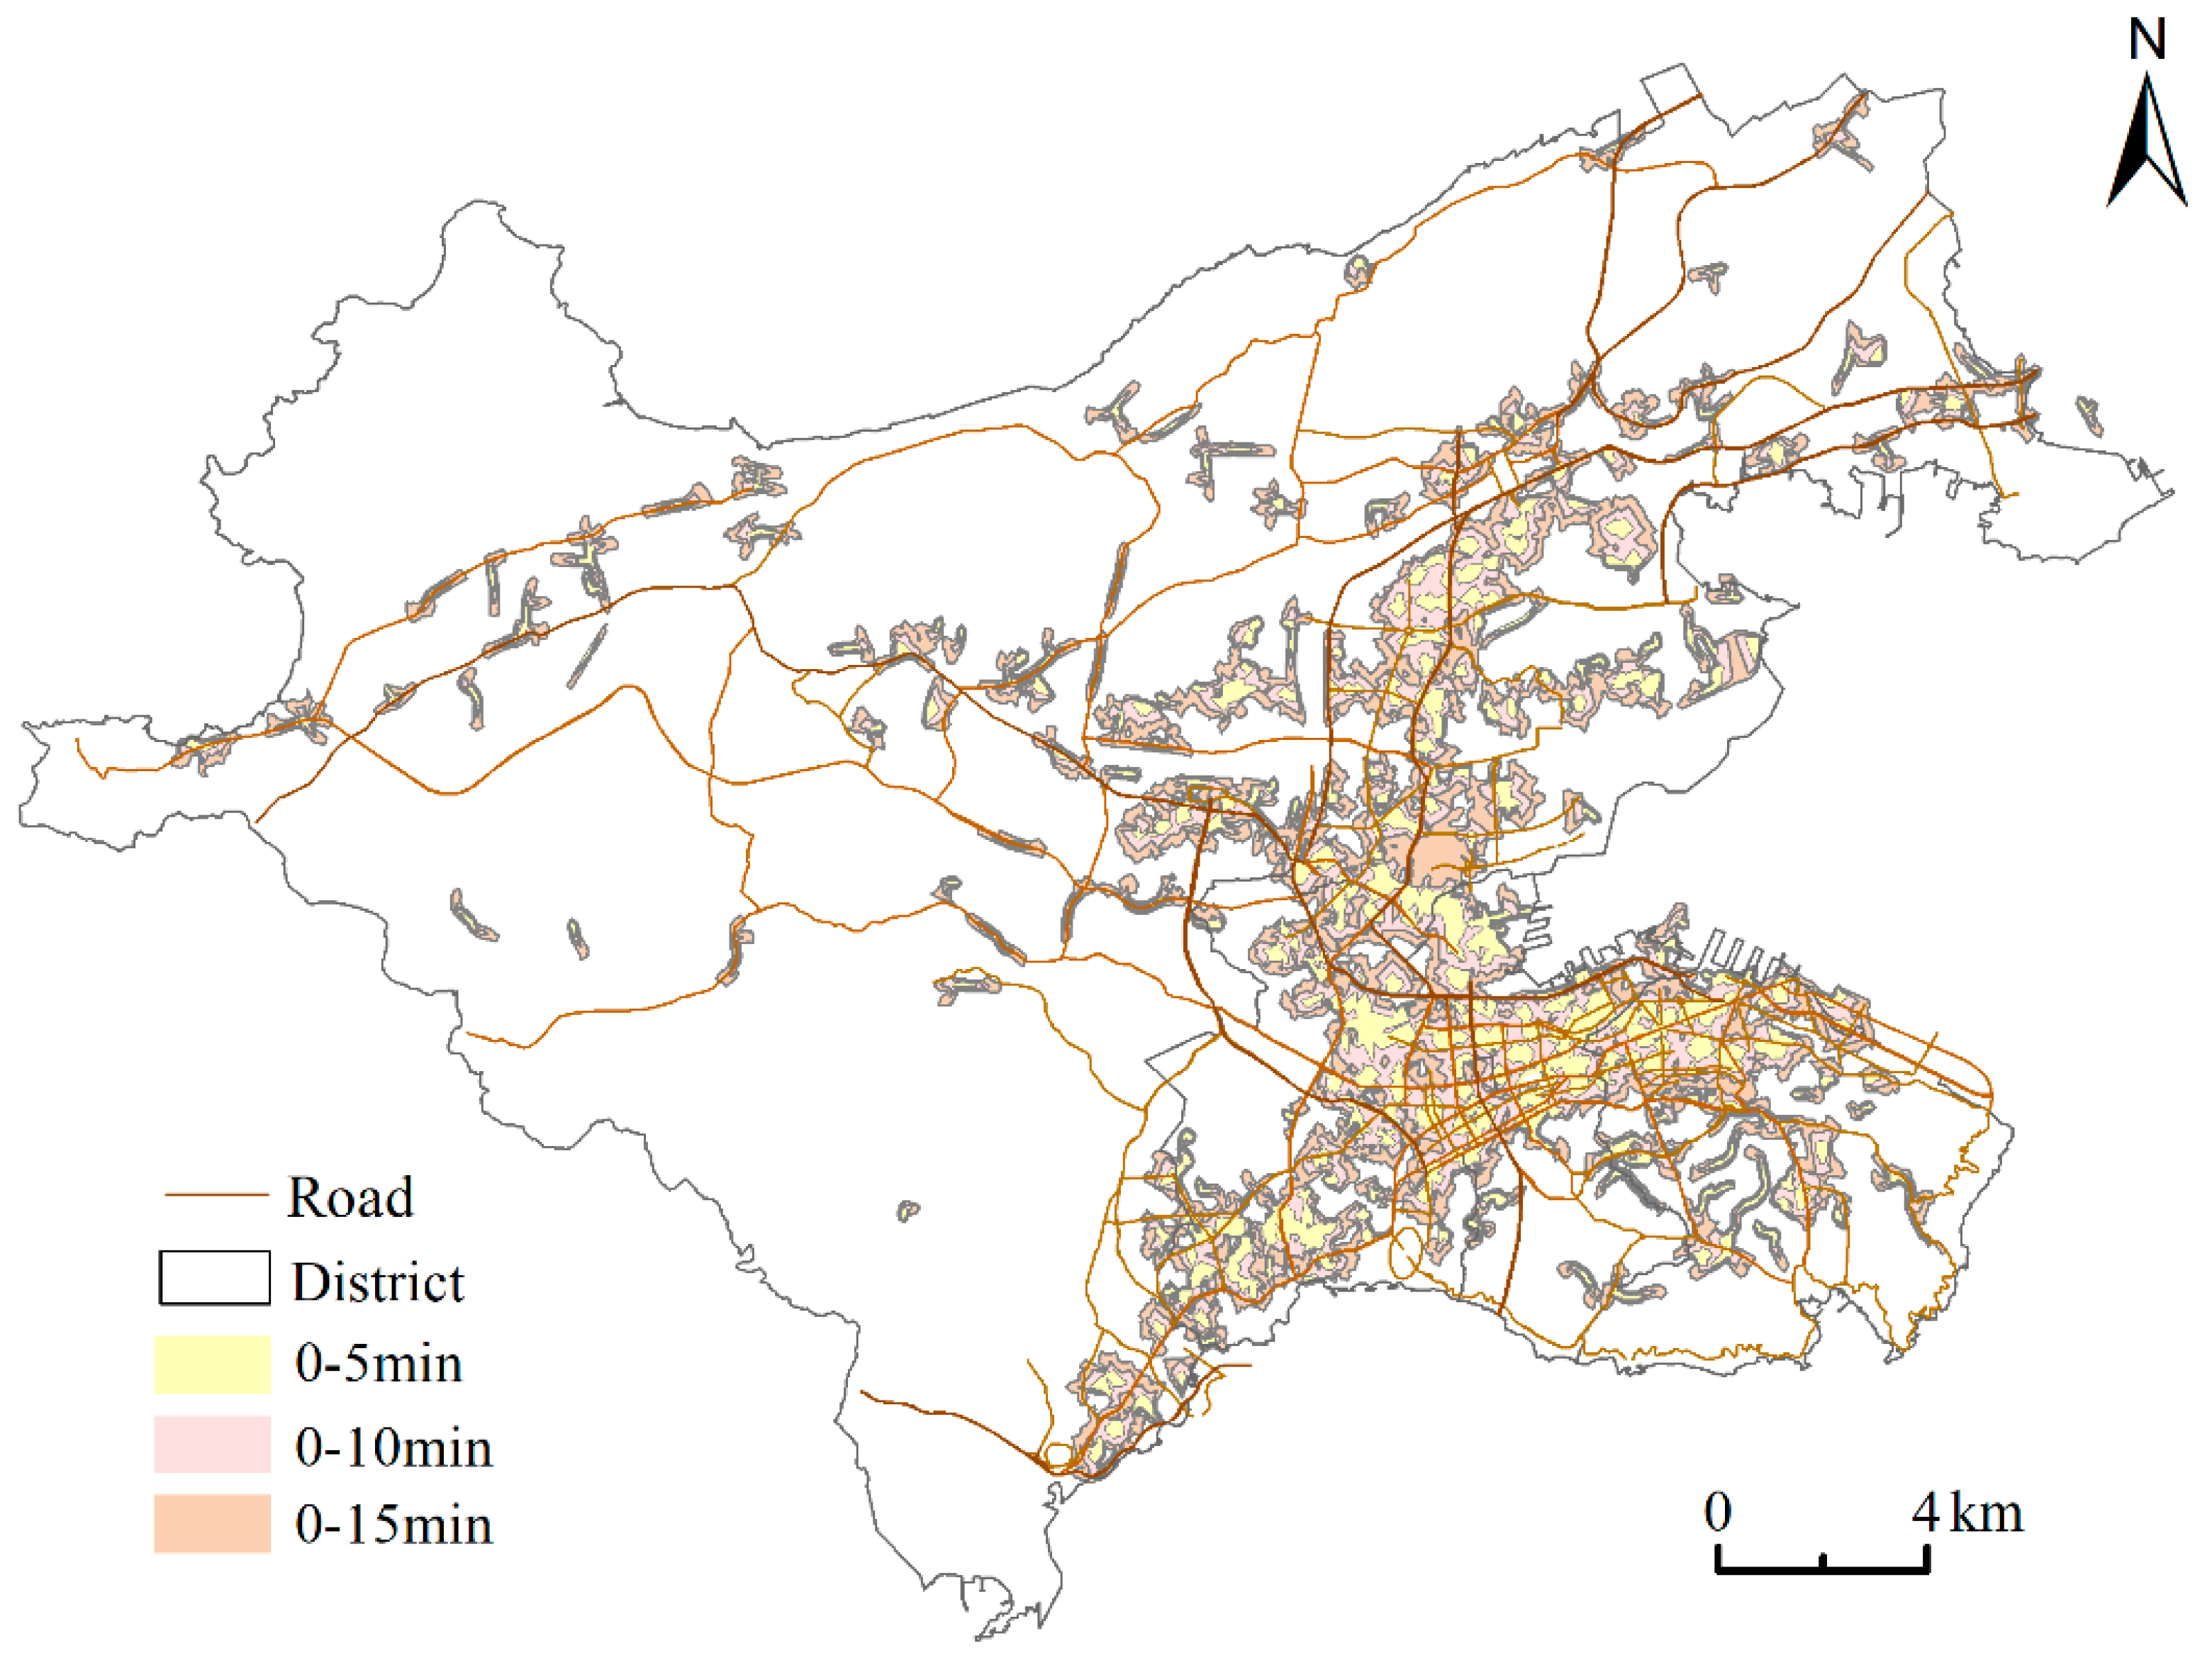
To understand the changes in the service area of the fitness venues after considering school sports venues, the changes in the service area and the service area ratio of the fitness venues in the 0–15 min walking time range was assessed for each district (Figure 7 and Table 6). From a general perspective, after considering the school sports venues, the service area of the fitness venues in the main urban area increased considerably. The service area of the fitness venues in the northern part of Xigang and Zhongshan Districts, the eastern part of Ganjingzi District, and the northwestern part of Shahekou District could be accessed completely within 0–15 min. In addition, the service area of Ganjingzi District was the highest (2.38 km2), which was followed by that of Xigang, Shahekou, and Zhongshan Districts.
In the time range of 0–5 min, Zhongshan District showed the lowest service area of sports venues (3.52 km2), whereas this was the highest in Ganjingzi District, which was followed by Shahekou and Xigang Districts. However, the ratio of the service area of venues in Xigang District increased from 2.18% before we considered school sports venues to 16.73% after we considered school sports venues, which was the largest change, and this was followed by that in Shahekou, Zhongshan, and Ganjingzi Districts. Moreover, the service area ratio of Ganjingzi District was only 1.58%. In the time range of 0–10 min, the order of the sports venue service areas decreased in the following order: Ganjingzi > Shahekou > Zhongshan > Xigang Districts, with the area of Xigang District being the lowest (9.05 km2). Although the service area of the sports venues in Zhongshan District exceeded that of Xigang District, the ratio of the service area in Xigang District was still the highest (38.87%). In addition, Ganjingzi District had the largest sports venue service area after we considered the school sports venues, but its service area ratio was still the lowest (5.5%) because of it having a large urban area (508.42 km2). The order of the sports venue service areas in the time range of 0–15 min was similar to that which was observed in the time range of 0–5 min, except for Shahekou District, which had a sports venue service area ratio of 55.65%; this was the only area that exceeded 50%, which was the highest. This was followed by the sports venue service areas of Xigang (48.43%), Zhongshan (35.68%), and Ganjingzi (11.91%) Districts.
The results of the study indicate that the number of public fitness venues in the main city of Dalian is insufficient and unevenly distributed, thus failing to meet the expectation of full coverage of the 15 min fitness circle. Wang et al. analyzed the sports venues in China and found that the percentages of full-time open, part-time open, and membership venues in China were 51.5%, 14.3%, and 34.2%, respectively, and only half of the sports venues were fully open to the public. This finding indicated that there was an even lower actual per capita sports venue area. In this study, we found that the opening of school sports venues to the community can alleviate the lack of public fitness venues in the main city of Dalian and can significantly improve the coverage of the 15 min fitness circle in the main city of Dalian. This conclusion was confirmed by other studies. For example, Zhang and Lan, who conducted a study in Liaoning Province including Dalian City, through questionnaires and other methods, concluded that the community sports resources could no longer meet the residents’ fitness needs, and that 67.4% of the residents wanted school sports resources to be open to residents [51]. Meanwhile, Jun et al. reported that the opening of school sports facilities can effectively alleviate the problem of having insufficient social sports resources [52], whereas Chen et al. concluded that the opening of school sports venues has a positive effect on the implementation of the National Fitness Plan Outline in China [53]. This study provides city-specific data to support the above findings from a microscopic perspective. In addition, K.Y. et al. found through literature combing that there are more macro studies on the opening of school sports venues to the society and there is less literature on micro-practice studies, and our findings complement this finding based on the micro-practice studies of specific cities [54]. In addition, Luo et al. suggested that there are certain dilemmas in opening school sports venues to the community [55]. Spengler et al. found potential barriers in terms of the responsibility of school administrators to open school sports and recreational facilities to community members through their study [56]. While Song et al. identified a lack of school management, teacher team building, and safety as the main factors that are limiting the opening of school sports venue resources to the public [57]. For the implementation of the opening of school sports venues to the community, we will continue to conduct in-depth research in the future.

4.3. Limitations

As the sports venue data of this study were derived from cumulative statistics, the current actual situation using this dataset will deviate with time. In addition, as the area of the public sports venues that were considered in this study was only more than 400 m2 area, further limitations exist.

5. Conclusions

In this study, we considered the main urban area of Dalian as a case study and examined the spatial distribution characteristics and the service area ratio of public fitness venues before and after considering school sports venues in each district. Moreover, the service area ratios of the fitness venues before and after considering the school sports venues in each district under different travel times were compared and analyzed. The following main conclusions were drawn:
(1)
Regarding location distribution, the fitness venues in the main urban area were mainly concentrated in Shahekou, Xigang, and Zhongshan Districts. Although Ganjingzi District had the largest number of fitness venues, their aggregation was low. The area distribution indicated that 38 streets had the highest number of public fitness venues (875–25,000 m2), thus accounting for 52.63%, and these were mainly concentrated in the central part of the main urban area. The total number of public fitness venues in the main urban area before and after considering the school sports venues increased significantly from 272 to 1117.
(2)
In terms of the accessibility of them, Xigang District had the highest ratio of the fitness venue service area after considering the school sports venues in the 0–5 min (16.73%) and 0–10 min (35.84%) time ranges. In the 0–15 min time range, the fitness venue service area ratio of Shahekou District increased from 19.02% to 55.65% after considering the school sports venues. This was followed by Xigang, Zhongshan, and Ganjingzi Districts.
(3)
To understand the fitness venue distribution comprehensively, school sports venues were considered, and the ratio of the fitness venue service areas and their spatial distribution patterns were assessed. Although the 15 min fitness circle in Shahekou District, northern Xi gang District, central Ganjingzi District, and northeastern Zhongshan District significantly improved, the coverage of the fitness venue service area in the peripheral areas of the main city of Dalian was still low. This indicated that the distribution of fitness venues in the main city was unbalanced, wherein the central area had more access to fitness venues, but the surrounding areas had relatively less access.

6. Suggestions

For the location distribution of the public fitness venues, we recommend that the government increases the planning and construction of public fitness venues at the edge of the main urban area and increase the area planning of public fitness venues. We recommend combining urban green space, idle plant areas, and other channels to increase the utilization of land in order to increase the number of public fitness venues. Especially in Ganjingzi District, the government should increase the financial support and land planning for the construction of public fitness venues in the district support programs.
For the increased accessibility to public fitness venues, we recommend that the government jointly develops a reasonable plan for the opening of school sports venues to the community, and that they encourage schools to gradually open school sports venues resources to drive the surrounding urban residents to take up exercise in schools. From the perspective of safety, we recommend the development of open policies by region, starting with the “one school one policy” or “one district one policy”, and then gradually adopting an “open to all” policy.
For a comprehensive view of the distribution pattern of fitness venues, we recommend that the government coordinates the planning of fitness venue construction to not only focus on the central area, but also take into account the surrounding areas, especially the coastal part of the Ganjingzi area. This could increase the construction of the fitness venues in this area to ensure that the fitness needs of the urban residents can be met so that the can reach the fitness venue within 15 min.

Author Contributions

Y.J. and H.Z.: methodology; Z.S.: software; C.W.: validation; Y.J., D.S. and Z.S.: formal analysis; C.W. and J.X.: investigation; Y.J. and H.Z.: resources; Y.J.: data curation; C.W.: writing—original draft preparation; C.W.: writing—review and editing; Z.S. and D.S: visualization; Y.J. and H.Z.: supervision; Y.J. and J.X.: project administration; Y.J.: funding acquisition. All authors have read and agreed to the published version of the manuscript.

Funding

2021 Ministry of Education Humanities and Social Science Research General Project “Research on the Social Support System of Youth Physical Fitness Behavior from the Perspective of Family Endowment”. Grant number: 21YJA890018. Basic scientific research projects of Liaoning Provincial Department of Education: Research on the overall development of the goal of “competition + industry” of the three major ball projects in Liaoning Province. Grant number: LJKR0434.

Institutional Review Board Statement

Not applicable.

Informed Consent Statement

Not applicable.

Data Availability Statement

Not applicable.

Conflicts of Interest

The authors declare no conflict of interest.

References

  1. Zhu, Y.; Liang, D. The Spatial Distribution of Public Fitness Facilities in the Main District of Wuhu City. J. Anhui Norm. Univ. Nat. Sci. 2019, 3, 269–276. [Google Scholar] [CrossRef]
  2. Zhang, X. The Construction of Urban Public Sports Service from the Perspective of Public Health. Rev. Bras. Med. Esporte 2021, 27, 69–72. [Google Scholar] [CrossRef]
  3. Barro, R.J. Economic Growth and Convergence, Applied to China. China World Econ. 2016, 24, 5–19. [Google Scholar] [CrossRef]
  4. Chen, X.; Hu, B.; Wang, L.; Tian, F. The Influencing Factors of Opening of College Sports Resources in the Background of National Public Fitness Services. Rev. Bras. Med. Esporte 2021, 27, 87–90. [Google Scholar] [CrossRef]
  5. You, M.L. Development Strategies of Urban Sports Stadiums and Facilities in China Based on Practices During the 13th Five-Year Plan. Sport. Cult. Guide 2022, 56–62. [Google Scholar]
  6. Liu, X. A Study of the Whole-process Working Mechanism of Community Fitness Facilities’ Construction: Practice of Community Sports Parks in Guangdong Province. Planners 2021, 61–66. [Google Scholar]
  7. Jakar, G.S.; Razin, E.; Rosentraub, M.S.; Rosen, G. Sport Facility Development: Municipal Capital and Shutting out the Private Sector. Eur. Plan. Stud. 2018, 26, 1222–1241. [Google Scholar] [CrossRef]
  8. Wang, K.; Wang, X. Providing Sports Venues on Mainland China: Implications for Promoting Leisure-Time Physical Activity and National Fitness Policies. Int. J. Environ. Res. Public Health 2020, 17, 5136. [Google Scholar] [CrossRef]
  9. Zheng, J.; An, R. Satisfaction with Local Exercise Facility: A Rural-Urban Comparison in China. Rural Remote Health 2015, 15, 2990. [Google Scholar] [CrossRef]
  10. Xiao, H. Research on Distribution Characteristics of Primary and Secondary School Sports Grounds in Nanchang City Based on GIS Technology. In Proceedings of the 2018 4th International Conference on Education, Management and Information Technology (ICEMIT 2018), Changchun, China, 6–7 July 2018; Wang, Y.M., Zhou, D.C., Eds.; Francis Acad Press: London, UK, 2018; pp. 843–846. [Google Scholar]
  11. Lin, P.-L.; Shiau, Y.-C.; Chang, L.-L. Study on User Satisfaction in Sport Site Facilities for Senior Students of Elementary Schools in Taichung City. In Proceedings of the 2016 International Conference on Artificial Life and Robotics (ICAROB 2016), Ginowan, Japan, 29–31 January 2016; Jia, Y., Ito, T., Lee, J.J., Sugisaka, M., Eds.; Alife Robotics Co, Ltd: Shimohanda, Japan, 2016; pp. 174–177. [Google Scholar]
  12. Kjonniksen, L.; Wiium, N.; Fjortoft, I. Affordances of School Ground Environments for Physical Activity: A Case Study on 10-and 12-Year-Old Children in a Norwegian Primary School. Front. Public Health 2022, 10, 773323. [Google Scholar] [CrossRef]
  13. Duan, Y.; Wagner, P.; Zhang, R.; Wulff, H.; Brehrn, W. Physical Activity Areas in Urban Parks and Their Use by the Elderly from Two Cities in China and Germany. Landsc. Urban Plan. 2018, 178, 261–269. [Google Scholar] [CrossRef]
  14. Asefi, A.; Nosrati, A.G. The Spatial Justice in the Distribution of Built Outdoor Sports Facilities. J. Facil. Manag. 2020, 18, 159–178. [Google Scholar] [CrossRef]
  15. Che, Y.; Cao, Y.; Wu, R.; Liu, J.; Chen, L.; Wu, J. Spatio-Temporal Pattern of World Heritage and Its Accessibility Assessment in China. Sustainability 2022, 14, 3033. [Google Scholar] [CrossRef]
  16. Higgerson, J.; Halliday, E.; Ortiz-Nunez, A.; Brown, R.; Barr, B. Impact of Free Access to Leisure Facilities and Community Outreach on Inequalities in Physical Activity: A Quasi-Experimental Study. J. Epidemiol. Community Health 2018, 72, jech-2017-209882. [Google Scholar] [CrossRef] [PubMed]
  17. Gao, S.; Li, C.; Rong, Y.; Yan, Q.; Liu, W.; Ma, Z. The Places-People Exercise: Understanding Spatial Patterns and the Formation Mechanism for Urban Commercial Fitness Space in Changchun City, China. Sustainability 2022, 14, 1358. [Google Scholar] [CrossRef]
  18. Cutumisu, N.; Spence, J.C. Sport Fields as Potential Catalysts for Physical Activity in the Neighbourhood. Int. J. Environ. Res. Public Health 2012, 9, 294–314. [Google Scholar] [CrossRef] [PubMed] [Green Version]
  19. Karusisi, N.; Thomas, F.; Meline, J.; Chaix, B. Spatial Accessibility to Specific Sport Facilities and Corresponding Sport Practice: The RECORD Study. Int. J. Behav. Nutr. Phys. Act. 2013, 10, 48. [Google Scholar] [CrossRef] [Green Version]
  20. Buekers, F.; Wibowo, J. Accessibility of sports halls Significance for participation in sports and an attempt at operationalization. Ger. J. Exerc. Sport Res. 2020, 50, 71–81. [Google Scholar] [CrossRef]
  21. Zong, Y.X.; Yu-Qi, L.U. Assessment of Fair Space of Opportunities for Regional Development Based on Accessibility—A Case of Jiangxi Province. Sci. Geogr. Sin. 2009, 29, 809–816. [Google Scholar] [CrossRef]
  22. Wang, L.; Liu, Y.; Mao, L.; Sun, C. Potential Impacts of China 2030 High-Speed Rail Network on Ground Transportation Accessibility. Sustainability 2018, 10, 1270. [Google Scholar] [CrossRef] [Green Version]
  23. Christodoulou, A.; Dijkstra, L.; Christidis, P.; Bolsi, P.; Poelman, H. A Fine Resolution Dataset of Accessibility under Different Traffic Conditions in European Cities. Sci. Data 2020, 7, 279. [Google Scholar] [CrossRef]
  24. Zhou, L.; Shen, G.; Wu, Y.; Brown, R.; Chen, T.; Wang, C. Urban Form, Growth, and Accessibility in Space and Time: Anatomy of Land Use at the Parcel-Level in a Small to Medium-Sized American City. Sustainability 2018, 10, 4572. [Google Scholar] [CrossRef]
  25. Jobe, R.T.; White, P.S. A New Cost-Distance Model for Human Accessibility and an Evaluation of Accessibility Bias in Permanent Vegetation Plots in Great Smoky Mountains National Park, USA. J. Veg. Sci. 2009, 20, 1099–1109. [Google Scholar] [CrossRef]
  26. Yin, H.W.; Kong, F.H.; Zong, Y.G. Accessibility and Equity Assessment on Urban Green Space. Acta Ecol. Sin. 2008, 28, 3375–3383. [Google Scholar]
  27. Samli, A.; Hadju, V.; Soma, A.S. Spatial Analysis of Health Facilities in Mamuju City, West Sulawesi. Enferm. Clin. 2020, 30, 71–75. [Google Scholar] [CrossRef]
  28. Peng, H.; Li-Miao, X.U. Buffer Zone Analysis and Eco-Environmental Impact Assessment. J. Tianjin Norm. Univ. Nat. Sci. Ed. 2004, 24, 34–37. [Google Scholar]
  29. Luo, W.; Wang, F.H. Measures of Spatial Accessibility to Health Care in a GIS Environment: Synthesis and a Case Study in the Chicago Region. Environ. Plan. B-Plan. Des. 2003, 30, 865–884. [Google Scholar] [CrossRef] [PubMed] [Green Version]
  30. Wuestemann, H.; Kalisch, D.; Kolbe, J. Access to Urban Green Space and Environmental Inequalities in Germany. Landsc. Urban Plan. 2017, 164, 124–131. [Google Scholar] [CrossRef]
  31. Shi, T.; Jun-Ying, L.I.; Ying, L.I.; Yin, H.Y.; University, S.A. Analysis of Urban Park Accessibility in Shenyang City. Chin. J. Ecol. 2016, 35, 1345–1350. [Google Scholar] [CrossRef]
  32. Wuestemann, H.; Kalisch, D.; Kolbe, J. Accessibility of Urban Blue in German Major Cities. Ecol. Indic. 2017, 78, 125–130. [Google Scholar] [CrossRef]
  33. de Sousa Silva, C.; Viegas, I.; Panagopoulos, T.; Bell, S. Environmental Justice in Accessibility to Green Infrastructure in Two European Cities. Land 2018, 7, 134. [Google Scholar] [CrossRef] [Green Version]
  34. Das, D.K.; Honiball, J.E. Appraisal of Public Park Accessibility in South African Cities. Proc. Inst. Civ. Eng.-Munic. Eng. 2019, 172, 114–121. [Google Scholar] [CrossRef] [Green Version]
  35. Monteiro, J.; Sousa, N.; Natividade-Jesus, E.; Coutinho-Rodrigues, J. Benchmarking City Layouts—A Methodological Approach and an Accessibility Comparison between a Real City and the Garden City. Sustainability 2022, 14, 5029. [Google Scholar] [CrossRef]
  36. Yin, L.; Patterson, K.; Silverman, R.; Wu, L.; Zhang, H. Neighbourhood Accessibility and Walkability of Subsidised Housing in Shrinking US Cities. Urban Stud. 2022, 59, 323–340. [Google Scholar] [CrossRef]
  37. Liu, Z.; Zhou, H. Arc GIS-based Research on Spatial Distribution Characteristics and Influencing Factors of National Sports Towns. J. Chengdu Sport Univ. 2020, 62–67. [Google Scholar] [CrossRef]
  38. Yan-Xia, L.I.; Hao, J.L. Analysis on Space Character of National Fitness Facilities in Shijiazhuang. China Sport Sci. Technol. 2006, 5, 16–19+22. [Google Scholar] [CrossRef]
  39. Sun, C. Spatial Distribution Features and Influential Factors of Municipal-Scale Schools Sports Venues in China. J. Tianjin Univ. Sport 2020, 506–512. [Google Scholar] [CrossRef]
  40. Zheng, C. Assessing the Spatial Accessibility of Physical Fitness Facilities for Older Adults in Winter Cities of China. Chin. Landsc. Archit. 2019, 99–104. [Google Scholar]
  41. Ding, D. Research on the Spatial Characteristics and Strategies of Urban Public Sports Service Facilities based on GIS—Taken Chongqing as An Example. J. Xi’an Phys. Educ. Univ. 2017, 82–87. [Google Scholar] [CrossRef]
  42. Rung, A.L.; Mowen, A.J.; Broyles, S.T.; Gustat, J. The Role of Park Conditions and Features on Park Visitation and Physical Activity. J. Phys. Act. Health 2011, 8, S178–S187. [Google Scholar] [CrossRef] [Green Version]
  43. Cranney, L.; Shaw, L.; Phongsavan, P. Are Outdoor Gyms Located in Areas of Greatest Need and Impact? An Audit in Sydney, Australia. Ann. Leis. Res. 2019, 22, 395–403. [Google Scholar] [CrossRef]
  44. Zhu, X.; Zhang, S.; Zhang, W. Research on Vector Spatial Data Change Detection Method Based on Grid-Based Clustering and Spatial Overlay—An Example of the Application of National Geographic Conditions Monitoring. J. Nanjing Norm. Univ. Nat. Sci. Ed. 2019, 42, 136. [Google Scholar] [CrossRef]
  45. Lin, L.; Xu, Z.; Huang, X. Spatial Distribution of Land Use Degree Based on Buffer Analysis: A Case Study of Mawei District in Fuzhou. Remote Sens. Inf. 2019, 135–143. [Google Scholar]
  46. Zeng, W.; Xiang, L.L.; Zhang, X.L. Research in Spatial Pattern of Accessibility to Community Service Facilities and Spatial Deprivation of low income Community in NanJing. Hum. Geogr. 2017, 32, 73–81. [Google Scholar]
  47. Jun, Y.; Li, C.; Li, Y.; Li, X.; Dong, W. Research on Network Accessibility and Scope of Services Differentitation of Green Space. Bull. Surv. Mapp. 2015, 3, 40–43. [Google Scholar] [CrossRef]
  48. Wan, A.; Chen, H.; Xie, X.; Liu, Y. Effects of Water Systems and Roads on Linpan Distribution Based on Buffer Analysis. Environ. Dev. Sustain. 2022, 24, 7349–7360. [Google Scholar] [CrossRef]
  49. Salbach, N.M.; O’Brien, K.; Brooks, D.; Irvin, E.; Martino, R.; Takhar, P.; Chan, S.; Howe, J.-A. Speed and Distance Requirements for Community Ambulation: A Systematic Review. Arch. Phys. Med. Rehabil. 2014, 95, 117–128. [Google Scholar] [CrossRef]
  50. Guifu, X.U. The Present State on Opening Up the Urban School Sports Fields in China and Strategies on Its Development. J. Sport. Sci. 2011, 32, 110–114. [Google Scholar] [CrossRef]
  51. Zhang, L.; Wang, D.; Li, Y. The Investigation of Promotion Development of School Physical Education to Community Sports—Take six cities in Liaoning Province as an example. J. Harbin Sport Univ. 2017, 6, 56–61. [Google Scholar]
  52. Jun, H. Study on the Practice of Sports Resources in the Schools of the State or City to Serve the Mass Sports. In Proceedings of the International Symposium 2018—Research and Practice of Higher Education Theory, Shanghai, China, 13–14 October 2018; Zhou, Y., Ed.; Science & Research Central Ltd: Newark, NJ, USA, 2018; pp. 141–148. [Google Scholar]
  53. Debao, C. Research on Opening Status to the Public of School Sports Facilities in Anhui Province. In Proceedings of the 2013 Fourth International Conference on Education and Sports Education (ESE 2013), Pt Iv, HongKong, China, 11–12 April 2013; Chang, W., Zhang, T., Eds.; Singapore Management & Sports Science Inst Pte Ltd.: Singapore, 2013; Volume 14, pp. 184–188. [Google Scholar]
  54. Jin, K. Study of Social Sharing Mechanisms to School’s Stadiums Resources. In Proceedings of the 2014 2nd International Conference in Humanities, Social Sciences and Global Business Management (ISSGBM 2014), Guangzhou, China, 26–27 December 2014; Zhang, Y., Ed.; Singapore Management & Sports Science Inst Pte Ltd.: Singapore, 2014; Volume 29, pp. 189–193. [Google Scholar]
  55. Luo, Q. Research on the Predicament and Optimization of the Openness of College Sports Facilities in China. In Proceedings of the 2018 4th International Conference on Education, Management and Information Technology (ICEMIT 2018), Changchun, China, 6–7 July 2018; Wang, Y.M., Zhou, D.C., Eds.; Francis Acad Press: London, UK, 2018; pp. 992–996. [Google Scholar]
  56. Spengler, J.O.; Carroll, M.S.; Connaughton, D.P.; Evenson, K.R. Policies to Promote the Community Use of Schools A Review of State Recreational User Statutes. Am. J. Prev. Med. 2010, 39, 81–88. [Google Scholar] [CrossRef] [PubMed]
  57. Song, Y. Development of School Sports Facilities Resources for Social Sharing Model. In Proceedings of the 2014 Conference on Informatisation in Education, Management and Business, Guangzhou, China, 13–14 September 2014; Tan, D., Ed.; Atlantis Press: Paris, France, 2014; pp. 217–220. [Google Scholar]
Figure 1. Location of the main urban area of Dalian.
Sustainability 14 12728 g001
Figure 2. Workflow chart of the present study.
Sustainability 14 12728 g002
Figure 3. Location distribution of public fitness venues in the main urban area of Dalian.
Sustainability 14 12728 g003
Figure 4. Area distribution of public fitness venues in the main urban area of Dalian.
Sustainability 14 12728 g004
Figure 5. Service scope of public fitness venues in the main urban area of Dalian.
Sustainability 14 12728 g005
Figure 6. Distribution of fitness venues after considering school sports venues in the main urban area of Dalian.
Sustainability 14 12728 g006
Figure 7. Service scope of fitness venues after adding school sports venues in the main urban area of Dalian.
Sustainability 14 12728 g007
Table 1. Data sources and methods.
Data NameData DescriptionData Sources
Data of public fitness venues in the main urban areaSite name, area and locationDalian Sports Bureau, Baidu map
Data of school sports venues in main urban areasSite name, area and locationDalian Sports Bureau, Baidu map
Street map data of main urban district of DalianScope of main urban area street boundaryResource and Environmental Sciences and Data Center, Baidu map
Table 2. Number of public fitness venues (by district) in the main urban area of Dalian.
DistrictGanjingziShahekouXigangZhongshan
Quantity143603633
Sports area (km2)1.430.970.780.27
Number of streets14879
Table 3. Statistical map of fitness venues in the main urban area of Dalian.
Area (103 m2)0.875–2525–7575–150150–300300–1730
Quantity2010233
The percentage52.6326.325.267.897.89
Table 4. Service area and area ratio of public fitness venues in the main urban area of Dalian.
The City NameUrban Area/(km2)Site Area/(km2)The Service Area/(km2)Service Area Ratio/(%)
0–50–100–150–50–100–15
Zhongshan45.440.270.773.337.741.707.3717.13
Shahekou43.050.100.893.698.172.078.5919.02
Xigang26.450.780.562.596.272.1810.0924.42
Ganjingzi508.421.432.099.0924.420.411.794.82
Table 5. Statistics of the number of fitness venues after adding school sports venues in the main urban area of Dalian.
Public Fitness VenuesSchool Premises Main Fitness AreaFitness Space Growth (%)
Zhongshan3380113242
Shahekou60268328447
Xigang36147183408
Ganjingzi143350493245
The total number2728451117311
The average number of68211.25279.25311
Table 6. Area and area ratio of walking service scope of public fitness ground and school sports ground in the main urban area of Dalian.
The City NameUrban Area/(km2)Site Area/(km2)The Service Area/(km2)Service Area Ratio/(km2)
0–50–100–150–50–100–15
Zhongshan45.440.483.529.7516.047.8321.6935.68
Shahekou43.050.825.5215.0423.513.0735.6155.65
Xigang26.451.224.229.0512.2216.7335.8748.43
Ganjingzi508.422.387.9927.8460.271.585.511.91
Publisher’s Note: MDPI stays neutral with regard to jurisdictional claims in published maps and institutional affiliations.