Article

Spatial Distribution, Contamination Levels, and Health Risks of Trace Elements in Topsoil along an Urbanization Gradient in the City of Urumqi, China

1
College of Geographical Science and Tourism, Xinjiang Normal University, Urumqi 830054, China
2
Xinjiang Laboratory of Arid Zone Lake Environment and Resources, Xinjiang Normal University, Urumqi 830054, China
*
Author to whom correspondence should be addressed.
Sustainability 2022, 14(19), 12646; https://doi.org/10.3390/su141912646
Submission received: 13 July 2022 / Revised: 18 September 2022 / Accepted: 27 September 2022 / Published: 5 October 2022

Abstract

:
For this study, we collected a total of 77 topsoil samples from urban, suburban, and rural gradients in the Urumqi city area in northwest China and analyzed their concentrations of seven trace elements: Arsenic (As), cadmium (Cd), nickel (Ni), lead (Pb), mercury (Hg), copper (Cu), and Zinc (Zn). To assess and compare the contamination levels and the potential health risk of trace elements in topsoil along an urbanization gradient, we employed the pollution index and the health risk assessment model introduced by the US Environmental Protection Agency; we also used geostatistical analysis to analyze the spatial distribution patterns. The results we obtained indicate that the contamination levels of trace elements in soil decreased in the order of urban > rural > suburban gradients. We found a similar spatial distribution pattern of contamination levels of Ni, Zn, Cd, and Pb elements, with a zonal distribution pattern, while the spatial distribution patterns of As, Cu, and Hg elements show high concentration patches in many of the areas investigated in this study. Furthermore, based on the identified concentrations, the topsoil is heavily contaminated by Hg and slightly contaminated by Pb, As, and Zn in the urban gradient, whereas it is heavily contaminated by Hg in suburban and rural gradients and slightly contaminated by As in the suburban gradient. The total non-carcinogenic risk index of the analyzed trace elements for adults and children decrease in the order of urban > suburban > rural gradients, whereas the total carcinogenic risk index of the analyzed elements for adults and children decreased in the order of suburban > urban > rural gradients. However, the contamination of topsoil in all gradients is more harmful to children’s health than to that of adults. Overall, urbanization has had obvious effects on the accumulation of trace elements in soil, and As is the main carcinogenic and non-carcinogenic risk factor among the investigated elements in topsoil in all urbanization gradients.

1. Introduction

Urbanization processes can affect the accumulation of trace elements in topsoils in urban ecosystems [1]. Soil contamination by trace elements is of great concern because of their long persistence in the environment and their toxicity for humans and other organisms [2,3]. Urban soil is a sink of pollutants from various contamination sources, such as traffic exhaust, industrial emissions, metal smelting, and other activities [4]. Large quantities of pollutants, such as trace elements from natural or anthropogenic origins, can penetrate the soil structure, and may pose a potential risk to the environment and wild creatures due to their toxic effects [5,6,7]. Potentially dangerous trace elements for human health can be transmitted from soil to water and plants and thereby to the human body [8]. In addition, these elements may also enter the human body through direct contact, dust inhalation, and hand-to-mouth intake [9]. Consequently, some serious systemic health issues may develop as a result of the excessive accumulation of trace elements, which are associated with diseases such as breast and gastrointestinal cancer, kidney damage, nervous system damage, memory deterioration, and bone diseases [10,11,12]. Therefore, the effects of urbanization on the environmental quality of soil along an urbanization gradient have emerged as an important frontier in environmental research.
The urbanization gradient is a continuum of a combination of landscape features that vary systematically as a result of anthropogenic environmental changes [13]. The urbanization gradient has an important effect on trace element concentrations and the element types associated with it. Over the past several decades, many studies have been performed on the metal contamination of soil in the urbanization gradient around the world. For example, Celine et al. explored the effects of urbanization on the urban soil in Hong Kong and found that urban soils are more polluted with trace elements, such as Cu, Pb, and Zn than suburban soils [14]. Lu et al. investigated the heavy metal content of the soil in urban and rural gradients and found that concentrations of heavy metal in soils decreased with increasing distance from the urban center [15]. Zhao et al. assessed the risk of heavy metals in road sediments in an urban-rural gradient and indicated that the mean concentrations for all metals combined decreased in the order of central urban > central suburban county > rural town > rural village [2]. Li et al. investigated the spatial pattern of soil heavy-metal enrichment in rapidly urbanizing areas, and indicated that the contents of Hg, Cd, Pb, and Cu decreased gradually with increasing distance from the core of the built-up area, especially in the case of Hg [16]. Islam et al. assessed the potential ecological and health risks of trace elements in soils from different land-use types that are present in the urbanized area in Bangladesh and found a descending order of As > Pb > Cd > Cr > Cu > Ni in terms of hazard quotient values for both adults and children [17]. Xie et al. analyzed the effects of urbanization on the accumulation of trace elements in the soil in residential areas of Beijing and showed that the urbanization indicators were found to be significantly correlated with the contents of elements in residential soils [18]. Similarly, Streeter et al. explored health changes in soils on an agricultural-urban gradient in Iowa and found that the average concentrations of Pb and As were highest in urban floodplains and lowest in agricultural floodplains [19]. Sheng et al. reported the spatial distribution characteristics and human health risks of trace elements in topsoil in Anhui Province and indicated that the trace elements in the urban topsoil of Anhui Province have certain non-carcinogenic health risks to children, but the risk is not significant to adults [20]. Other related studies have also shown that as urbanization accelerates, trace element concentrations in the soil gradually decrease from urban to rural areas, reflecting obvious anthropogenic enrichment characteristics [21,22]. Therefore, it was preferentially accepted that the contamination of urban soil with hazardous trace elements is an urgent research problem due to their negative and prolonged ecosystem impacts, which need to be assessed. The concentrations and contamination risks of trace elements in soil decrease along an urban-suburban-rural gradient zone, and the urbanization-induced soil trace element contamination would impede the sustainable development of a regional urban system.
However, the above-mentioned research mainly focused on the contamination risks of trace elements in soils in an urban-rural gradient zone of highly urbanized and industrialized cities, but very few studies were related to the effects of urbanization on the contamination of urban soils in oases in arid zones. As a result of rapid urbanization, eco-environmental problems in oases in the northwestern arid zones along the “Silk Road Economic Belt” have garnered more attention [23,24]. The city of Urumqi, the biggest metropolitan city in Xinjiang, northwest China, is situated in the southern part of the Junggar Desert. Urumqi is one of the node cities in the “Silk Road Economic Belt” and occupies a very important position in the “Belt and Road” strategy. Recent studies report that a significant degree of trace element contamination exists in soil and surface dust in Urumqi [25,26]. So far, however, there has been no relevant discussion about the effects of urbanization on the trace element contamination of soil in Urumqi. Therefore, it is necessary to assess the contamination levels and potential health risks of hazardous trace elements in soil along the urbanization gradient in these cities.
The main objectives of this study are to analyze the effects of urbanization on the spatial dynamics of soil trace elements along the urbanization gradient, the different behaviors of trace elements in response to urban expansion in oases in the arid zone, and to evaluate potential health impacts on adults and children due to the ingestion of elements in these soils. We collected topsoil samples from 77 sampling sites in the Urumqi and analyzed the concentrations, spatial distribution patterns, contamination levels, and potential health risks of seven trace elements in soil from urban, suburban, and rural gradient zones, based on the Nemerow pollution index, geostatistical analysis, and the United States Environmental Protection Agency (US EPA) health risk assessment model.

2. Materials and Methods

2.1. Study Area

We conducted our field research in the city of Urumqi, which is the provincial capital of the Xinjiang Uyghur Autonomous Region, China. Urumqi city is located in the southern part of the Kurbantonggut Desert and the northern part of the Tarim Basin, with a total urban area of about 480 km2. Urumqi city is characterized by a continental desert climate, with an annual mean temperature, precipitation, and evaporation capacity of about 6.7 °C, 280 mm, and 2730 mm, respectively. The main factories are primarily located in the northern and northeastern parts of the city, while roads with high traffic volumes stretch across the city center [25]. Compared to other cities in Xinjiang, Urumqi is characterized by significant conflict between urbanization, industrialization, and the ecological environment. As such, a typical and continuous urban-suburban-rural gradient zone (30 km × 11 km) (87°28′–87°37′ E and 43°48′–44°04′ N) was selected in the Urumqi area to study the effects of urbanization on trace element concentrations in topsoil (Figure 1). Each gradient extended over a distance of approximately 8 km. The urban gradient was the commercial core area and service industry distribution area of Urumqi. The land-use types are mainly commercial areas, cultural and educational areas, and residential areas. The land-use types in the rural gradient were mainly cultivated land. The suburban area is a transitional area between urban and rural areas, containing agricultural land, industrial land, and residential areas. The soil type in the urban and suburban gradients is mainly grey desert soil, while the soil types in the rural gradient are paddy soil, fluvo-aquic soil, and meadow marsh soil.

2.2. Sample Collection, Preparation, and Analysis

We collected a total of 77 topsoil samples (at 0–20 cm depth) from a typical urban-suburban-rural gradient of the Urumqi area in April 2021. Based on previous research results by Wang et al., combined with the degree of urbanization, topography, and land use in the Urumqi area, urban, suburban and rural gradients were divided [27]. Urban soils were collected at locations where there is a high density of buildings and roads, while rural soils were collected from agricultural lands that are at least 50 m away from roads, and suburban soils were collected from the areas between urban and rural zones. The sampling sites are also illustrated on the map in Figure 1. Considering the complexity of the soil environment in the central urban area, a total of 42 samples were collected from the urban gradient, while 19 samples were collected from the suburban gradient, and 16 samples were collected from the rural gradient. At each sampling point, five sub-samples from the top 0–20 cm of the topsoil layer were taken from 100 m × 100 m areas and mixed to form one representative composite soil sample, then manually mixed in a clean polyethylene bag.
The collected soil samples were air-dried for 72 h, passed through a 100–mesh nylon sieve, then digested as per the procedure detailed in “HJ/T 166–2004” [28]. As, Cd, Ni, Pb, Hg, Cu, and Zn elements have been listed as the priority control pollutants by the “Soil environmental quality—Risk control standard for soil contamination of development land (GB36600—2018)” standard. Therefore, this study focused on the contamination levels and risk assessments of the above elements in the collected soil samples. All samples were entrusted to the Xinjiang Liyuan Xinde Environmental Testing Technology Service Co., Ltd., for chemical analysis. The concentrations of Cd, Cu, Ni, Pb, and Zn were determined as per the national standard of China, as detailed in HJ 803–2016 [29], using an inductively coupled plasma mass spectrometer (ICP–MS 7800, Agilent, Japan). The concentrations of As and Hg were determined as per the National Standard of China detailed in GB/T 22105.2–2008 [30], using an atomic fluorescence photometer (AFS–933, Titan Instruments, Beijing, China).

3. Quality Control

The quality of the analytical data was analyzed using laboratory quality control methods, including the use of reagent blanks, duplicates, and standard reference materials for each batch of soil samples. To ensure the precision of the analytical procedures, a standard solution of elements was used to compare samples to national standards (Chinese national standards samples, GSS-12). The recovery percentages of samples that were spiked with standards ranged from 92.35 to 105.86%. All the soil samples were tested repeatedly, while the determining consistency of the repeated element measurements was about 96.1%.

4. Contamination Assessment of Trace Elements

The pollution index (Pi) is a single-step and commonly used contamination assessment method that considers the influences of background values on the contamination levels of trace metals in various environmental media, such as soil, dust, and sediments [31,32]. The Pi is calculated as:
Pi = Ci/Si
where Ci represents the concentration of element i in a soil sample and Si represents the geochemical background value of this element in the soils of the Urumqi city area. The following classification standards were used to describe the contamination levels of the Pi value: no contamination (Pi < 1), slight contamination (1 ≤ Pi < 2), moderate contamination (2 ≤ Pi < 3), and heavy contamination (Pi ≥ 3) [33].
The Nemerow pollution index (NPI) can be used to estimate the total contamination level of trace elements in receptor sites. The NPI considers not only the contribution of average Pi but also the largest Pi values [34]. The NPI is calculated as:
N P I = P i m a x 2 + P i a v e 2 / 2
where Pimax represents the maximum value of the Pi of trace elements in certain sampling sites, and Piave represents the average value of the Pi. The following classification standard was used to describe the contamination level of the NPI value: no contamination (NPI ≤ 0.7), warning level (0.7 < NPI ≤ 1), slight contamination (1 < NPI ≤ 2), moderate contamination (2 < NPI ≤ 3), and heavy contamination (NPI > 3) [33].

5. Health Risk Assessment of Trace Elements

5.1. Exposure Analysis

The level of exposure to trace elements was assessed, based on the chronic daily intake (CDI, mg/kg/day) value of soil. Three routes of intake, including incidental oral ingestion, inhalation, and dermal contact were considered. The chronic daily intake in the three exposure pathways is calculated according to previous studies [35,36,37] as:
CDIingest = [(Ci × IngR × CF × EF × ED)/(BW × AT)
CDIinhale = [(Ci × InhR × EF × ED)/(PEF × BW × AT)
CDIdermal = [(Ci × SA × AF × ABS × EF × ED)/(BW × AT)
CDItotal = CDIingest + CDIinhale + CDIdermal
The chronic daily intake of soil via the three exposure pathways was estimated according to the standardized method published by the US EPA, based on the parameters listed in Table 1. Using the standardized method published by the US EPA, the Superfund Public Health Evaluation Manual, and research related to the health risks of trace element contamination in soils [38,39,40,41], the exposure assessment parameters determined for this study are shown in Table 1.

5.2. Assessment of the Non-Carcinogenic Health Risk

The non-carcinogenic health risk for an individual trace element was calculated as the hazard quotient (HQ), as in Equation (7):
HQ = CDI/RfD
where RfD represents the reference dose (mg/kg/day), which is considered to be an estimation of daily exposure for the human population. To assess the overall non-carcinogenic risk posed by all trace elements in soil, the calculated HQ values of trace elements were summed up and expressed as a hazard index (HI):
HI = ΣHQ = HQingest + HQinhale + HQdermal
According to the US EPA [37], when HI < 1, the exposed individual is unlikely to show an apparent adverse health effect. In contrast, if HI > 1, non-carcinogenic adverse health effects may occur with a probability that tends to increase with an increase in HI value.

5.3. Assessment of the Carcinogenic Health Risk

According to the International Agency for Research on Cancer [42], As and Cd are considered carcinogenic trace elements. Therefore, the carcinogenic risks (CR) of these two trace elements in soil from three exposure pathways were calculated as:
CR = CDI × SF
TCR = ΣCR = CRingest + CRinhale + CRdermal
where CR indicates the carcinogenic risk (unitless), TCR indicates the total carcinogenic risk (unitless), and SF indicates the carcinogenic slope factor of trace elements (mg/kg/day).
The acceptable threshold value of TCR is 1 × 10⁻⁴, while a TCR value surpassing 1 × 10⁻⁴ is considered to be unacceptable. A TCR value below 1 × 10⁻⁶ is not considered to pose significant adverse health effects [43]. The RfD and SF values determined in this study are compared to those reported in the relevant literature (Table 2) [38,39,44,45].

6. Results and Discussion

Concentrations of Trace Elements in Soil along an Urbanization Gradient

The minimum, maximum, average, median, and background concentrations of the investigated trace elements in topsoils from all urbanization gradients are given in Table 3, along with the standard deviations (St.D) and the coefficients of variation (CV). It should be noted that the background values refer to the element concentrations in Urumqi soils [46].
As shown in Table 3, on average, the concentrations of As, Cd, Ni, Pb, Hg, Cu, and Zn in the collected urban soils are 10.36, 0.14, 20.21, 15.86, 0.50, 22.65, and 68.79 mg/kg, respectively. The average concentrations of As, Pb, Hg, and Zn elements in urban soils exceeded the corresponding background values by factors of 1.04, 1.12, 6.58, and 1.07, respectively, with the highest enrichment being in the Hg element. The average values of the other three elements in urban soils are lower than the background values. The average concentrations of As, Cd, Ni, Pb, Hg, Cu, and Zn elements in the collected suburban soils are 10.68, 0.14, 16.37, 11.95, 0.40, 21.97, and 53.16 mg/kg, respectively. The average concentrations of the Hg and As elements in suburban soils exceeded the corresponding background values by factors of 5.26 and 1.07, respectively, with the highest enrichment of the Hg element, and the average concentrations of the other five elements are lower than the background values. Meanwhile, the average concentrations of As, Cd, Ni, Pb, Hg, Cu, and Zn elements in the collected rural soils are 9.18, 0.13, 15.31, 11.56, 0.46, 22.57, and 55.69 mg·kg−1, respectively. Among them, the average concentration of Hg in the rural soils was equal to 6.05 times the corresponding background value, with obvious enrichment, whereas the average values of the other six elements in rural soils are lower than the background values. Based on the above analysis, the concentrations of Hg in soils in all urbanization gradients were significantly higher than their corresponding background values, indicating that Hg is particularly abundant compared to the other investigated elements in the topsoil in all the urbanization gradients of Urumqi.
The coefficients of variation (CV) listed in Table 3 are used to show the degree of variability within the concentrations of trace elements in topsoils. CV values of less than 0.25 indicate low variability, whereas values between 0.26 and 0.50 and those greater than 0.51 signify moderate and high variability, respectively [47]. Based on the CV values of the analyzed species in soils in each urbanization gradient, the CV values of As and Ni in urban soil, the CV values of As, Ni, Pb, Cu, and Zn in suburban soil, and the CV values of the Ni, Pb, Cu, and Zn elements in rural soil are all lower than 0.25, indicating low variability for these trace elements in the corresponding urbanization gradients. This indicates that As and Ni in urban soils, As, Ni, Pb, Cu, and Zn in suburban soils, and Ni, Pb, Cu, and Zn in rural soils are the most likely natural factors to be affected. The CV values of Cd and Hg in the soils of all urbanization gradients, the CV values of Cu and Zn in urban soils, and the CV value of As in rural soils are from 0.25 to 0.50, indicating moderate variability for these trace elements in the corresponding urbanization gradients. It indicates that Cd and Hg in all gradients, Cu and Zn in urban soil, and As in rural soil are likely to be affected by both anthropogenic factors and natural factors. It should be pointed out that Pb displays remarkable variations in urban soils, with the CV value for Pb being the highest, and indicates that human activities in the urban gradient zone may have an obvious impact on the accumulation of Pb in topsoil.
Our results indicate that the average concentrations of Ni and Pb in soil decrease in the order of urban > suburban > rural, while the average concentrations of As in the soil decrease in the order of suburban > urban > rural, and the average concentrations of Cd in the soil decrease, in the order of urban = suburban > rural, the average concentrations of Cu, Hg, and Zn in the soil decrease in the order of urban > rural > suburban. On the whole, the concentrations of the analyzed trace elements differed among the investigated urbanization gradients. The urban soils were highly enriched with trace elements, such as Cd, Cu, Hg, Ni, Pb, and Zn, in comparison with the suburban and rural soil samples.

7. Contamination Assessment of Trace Elements in the Soil along an Urbanization Gradient

The Pi and NPI values of the analyzed trace elements in topsoils in urban, suburban, and rural gradients of the Urumqi city area were calculated. As shown in Table 4, the decreasing order of trace element concentration in soil in different urbanization gradients is distinctive. On average, the Pi values for the observed trace elements in urban soil can be ranked as Hg (6.56) > Pb (1.13) > Zn (1.07) > As (1.03) > Cu (0.94) > Ni (0.68) > Cd (0.61), while the Pi values of trace elements in suburban soil can be ranked as Hg (5.27) > As (1.07) > Cu (0.92) > Pb (0.85) > Zn (0.83) > Cd (0.59) > Ni (0.55), and the Pi values of trace elements in rural soil can be ranked as Hg (6.10) > Cu (0.94) > As (0.92) > Zn (0.87) > Pb (0.82) > Cd (0.57) > Ni (0.51).
According to the classification standard and the calculated value of Pi, the soils in urban gradients are heavily contaminated by Hg and slightly contaminated by Pb, As, and Zn elements. The soils in suburban and rural gradients are heavily contaminated by Hg, while the soils in suburban gradients are slightly contaminated by As. It should be noted that, based on the maximum Pi values, the soils in the urban gradient are heavily contaminated by Hg, Pb, and Zn, and moderately contaminated by Cu. This implies that trace elements, particularly Hg, Pb, Cu, and Zn, are likely to be the most significant contaminants of topsoils in the Urumqi city area and, thus, should be monitored closely. On the whole, the contamination levels of trace elements differed among the investigated urbanization gradients. The average Pi values of Cd, Ni, and Pb in the soil decreased in the order of urban > suburban > rural, while the average Pi values of As decreased in the order of suburban > urban > rural; the average Pi values of Hg and Zn decreased in the order of urban > rural > suburban and the average Pi values of Cu decreased in the order of urban = rural > suburban. The results indicate that the topsoil in the urban gradient, where the population density and traffic flow are relatively higher, was more heavily contaminated by trace elements than the topsoil in suburban and rural gradient zones.
The average NPI values of trace elements in soils in urban, suburban, and rural gradients in the study area were 4.85, 3.87, and 4.45, respectively, at the heavy contamination level. The total contamination level (NPI) of trace elements can be ranked as urban > rural > suburban. Overall, Hg contributed the most to the NPI of trace elements in soils in all gradient zones, which account for 73.93%, 73.43%, and 72.95% of the NPI of trace elements in soils in urban, suburban, and rural gradients, respectively, indicating that Hg is the most dominant contamination factor in soils in all urbanization gradients in the study area.
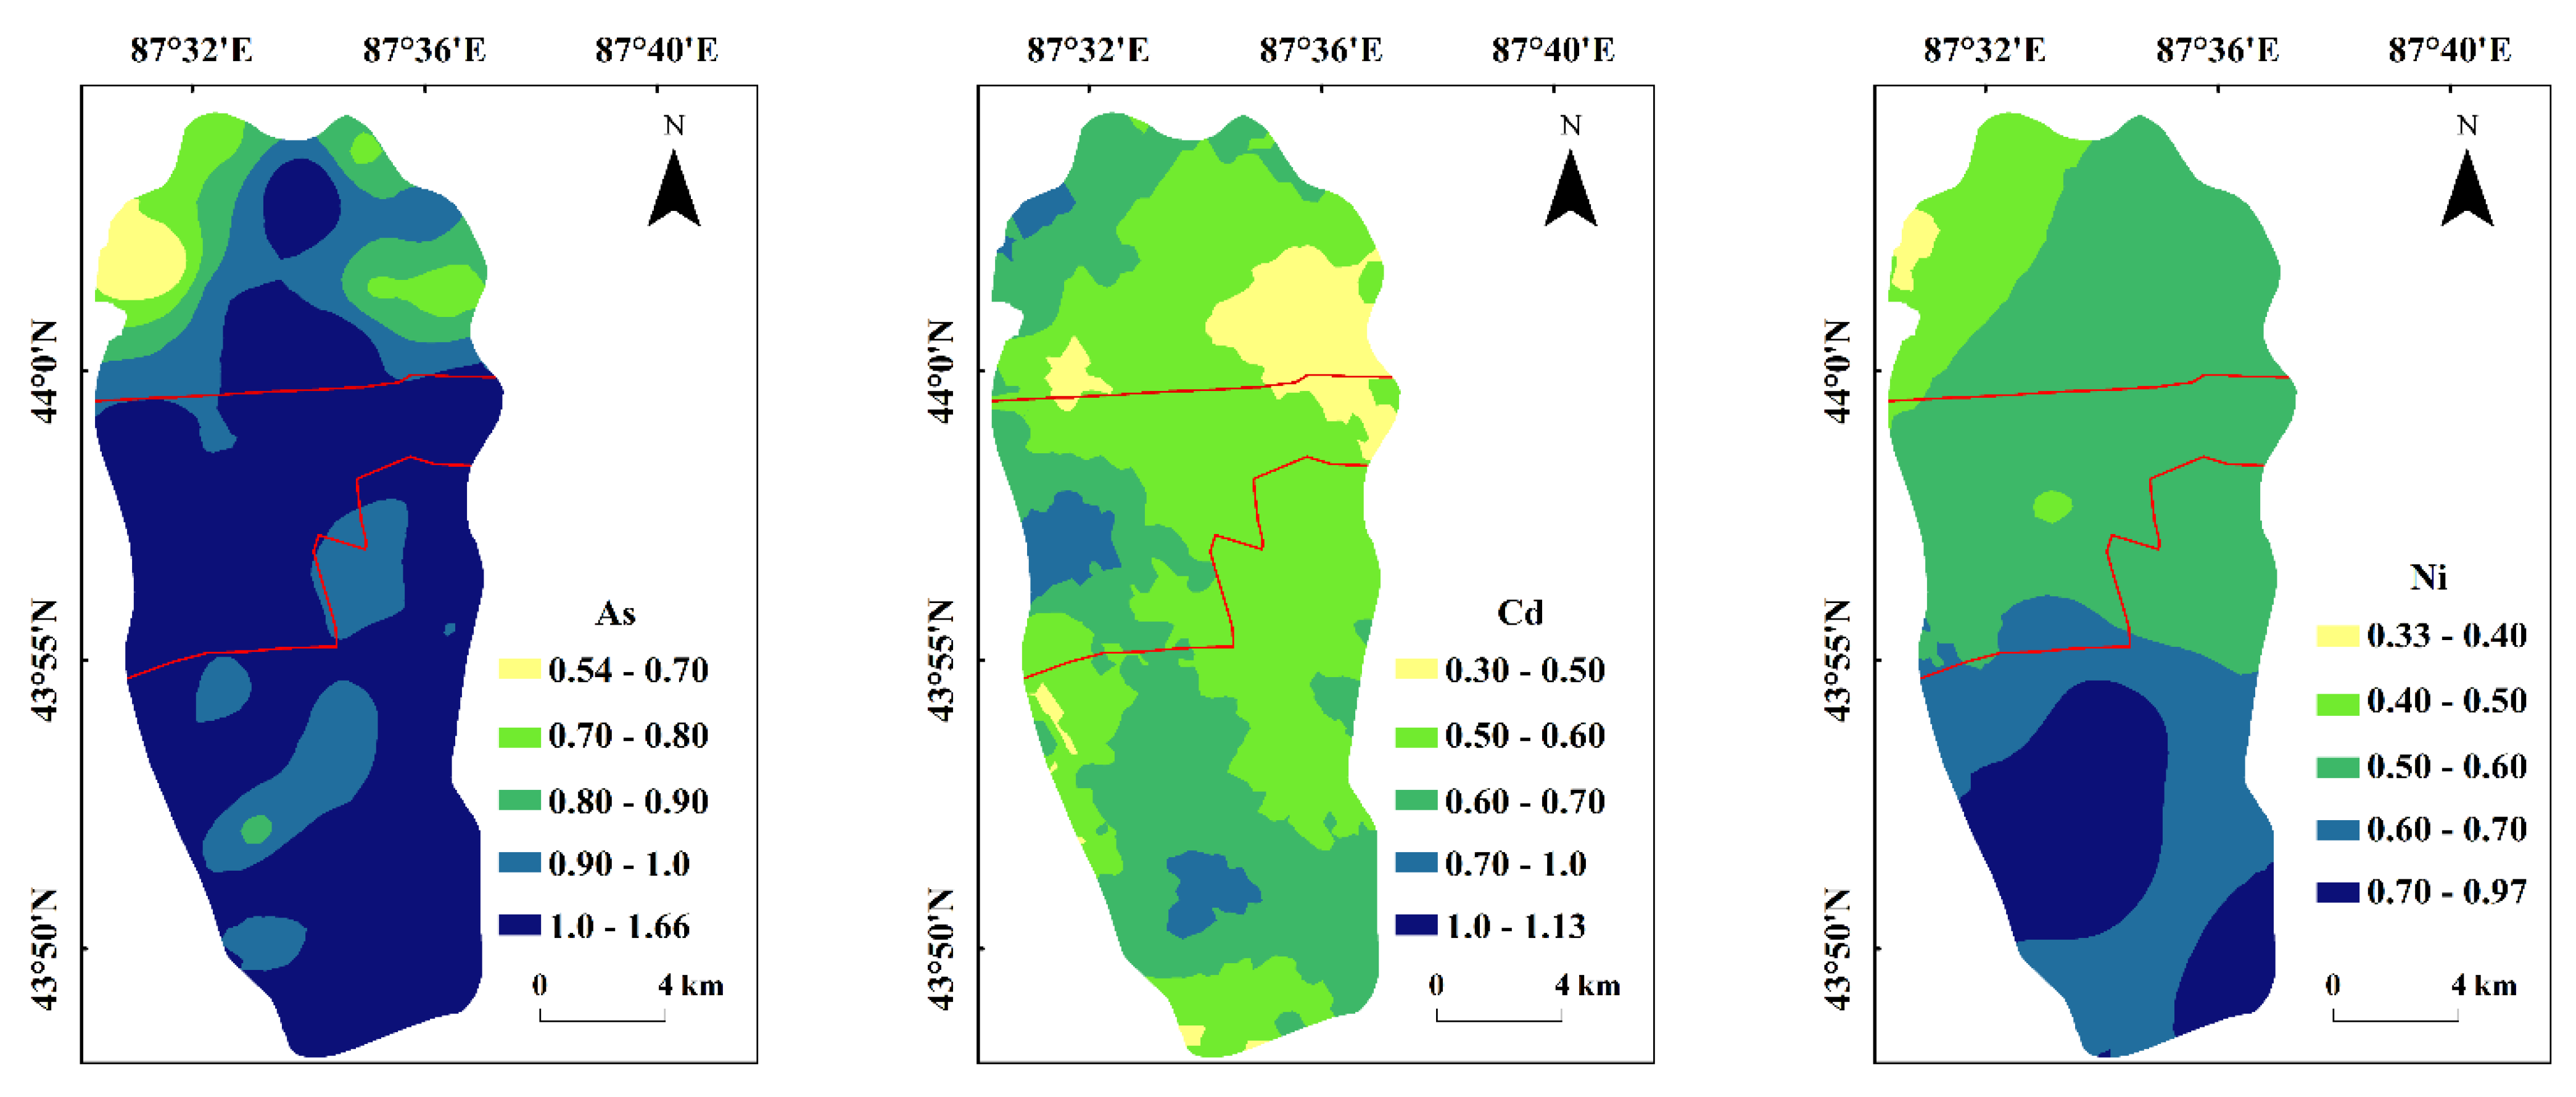
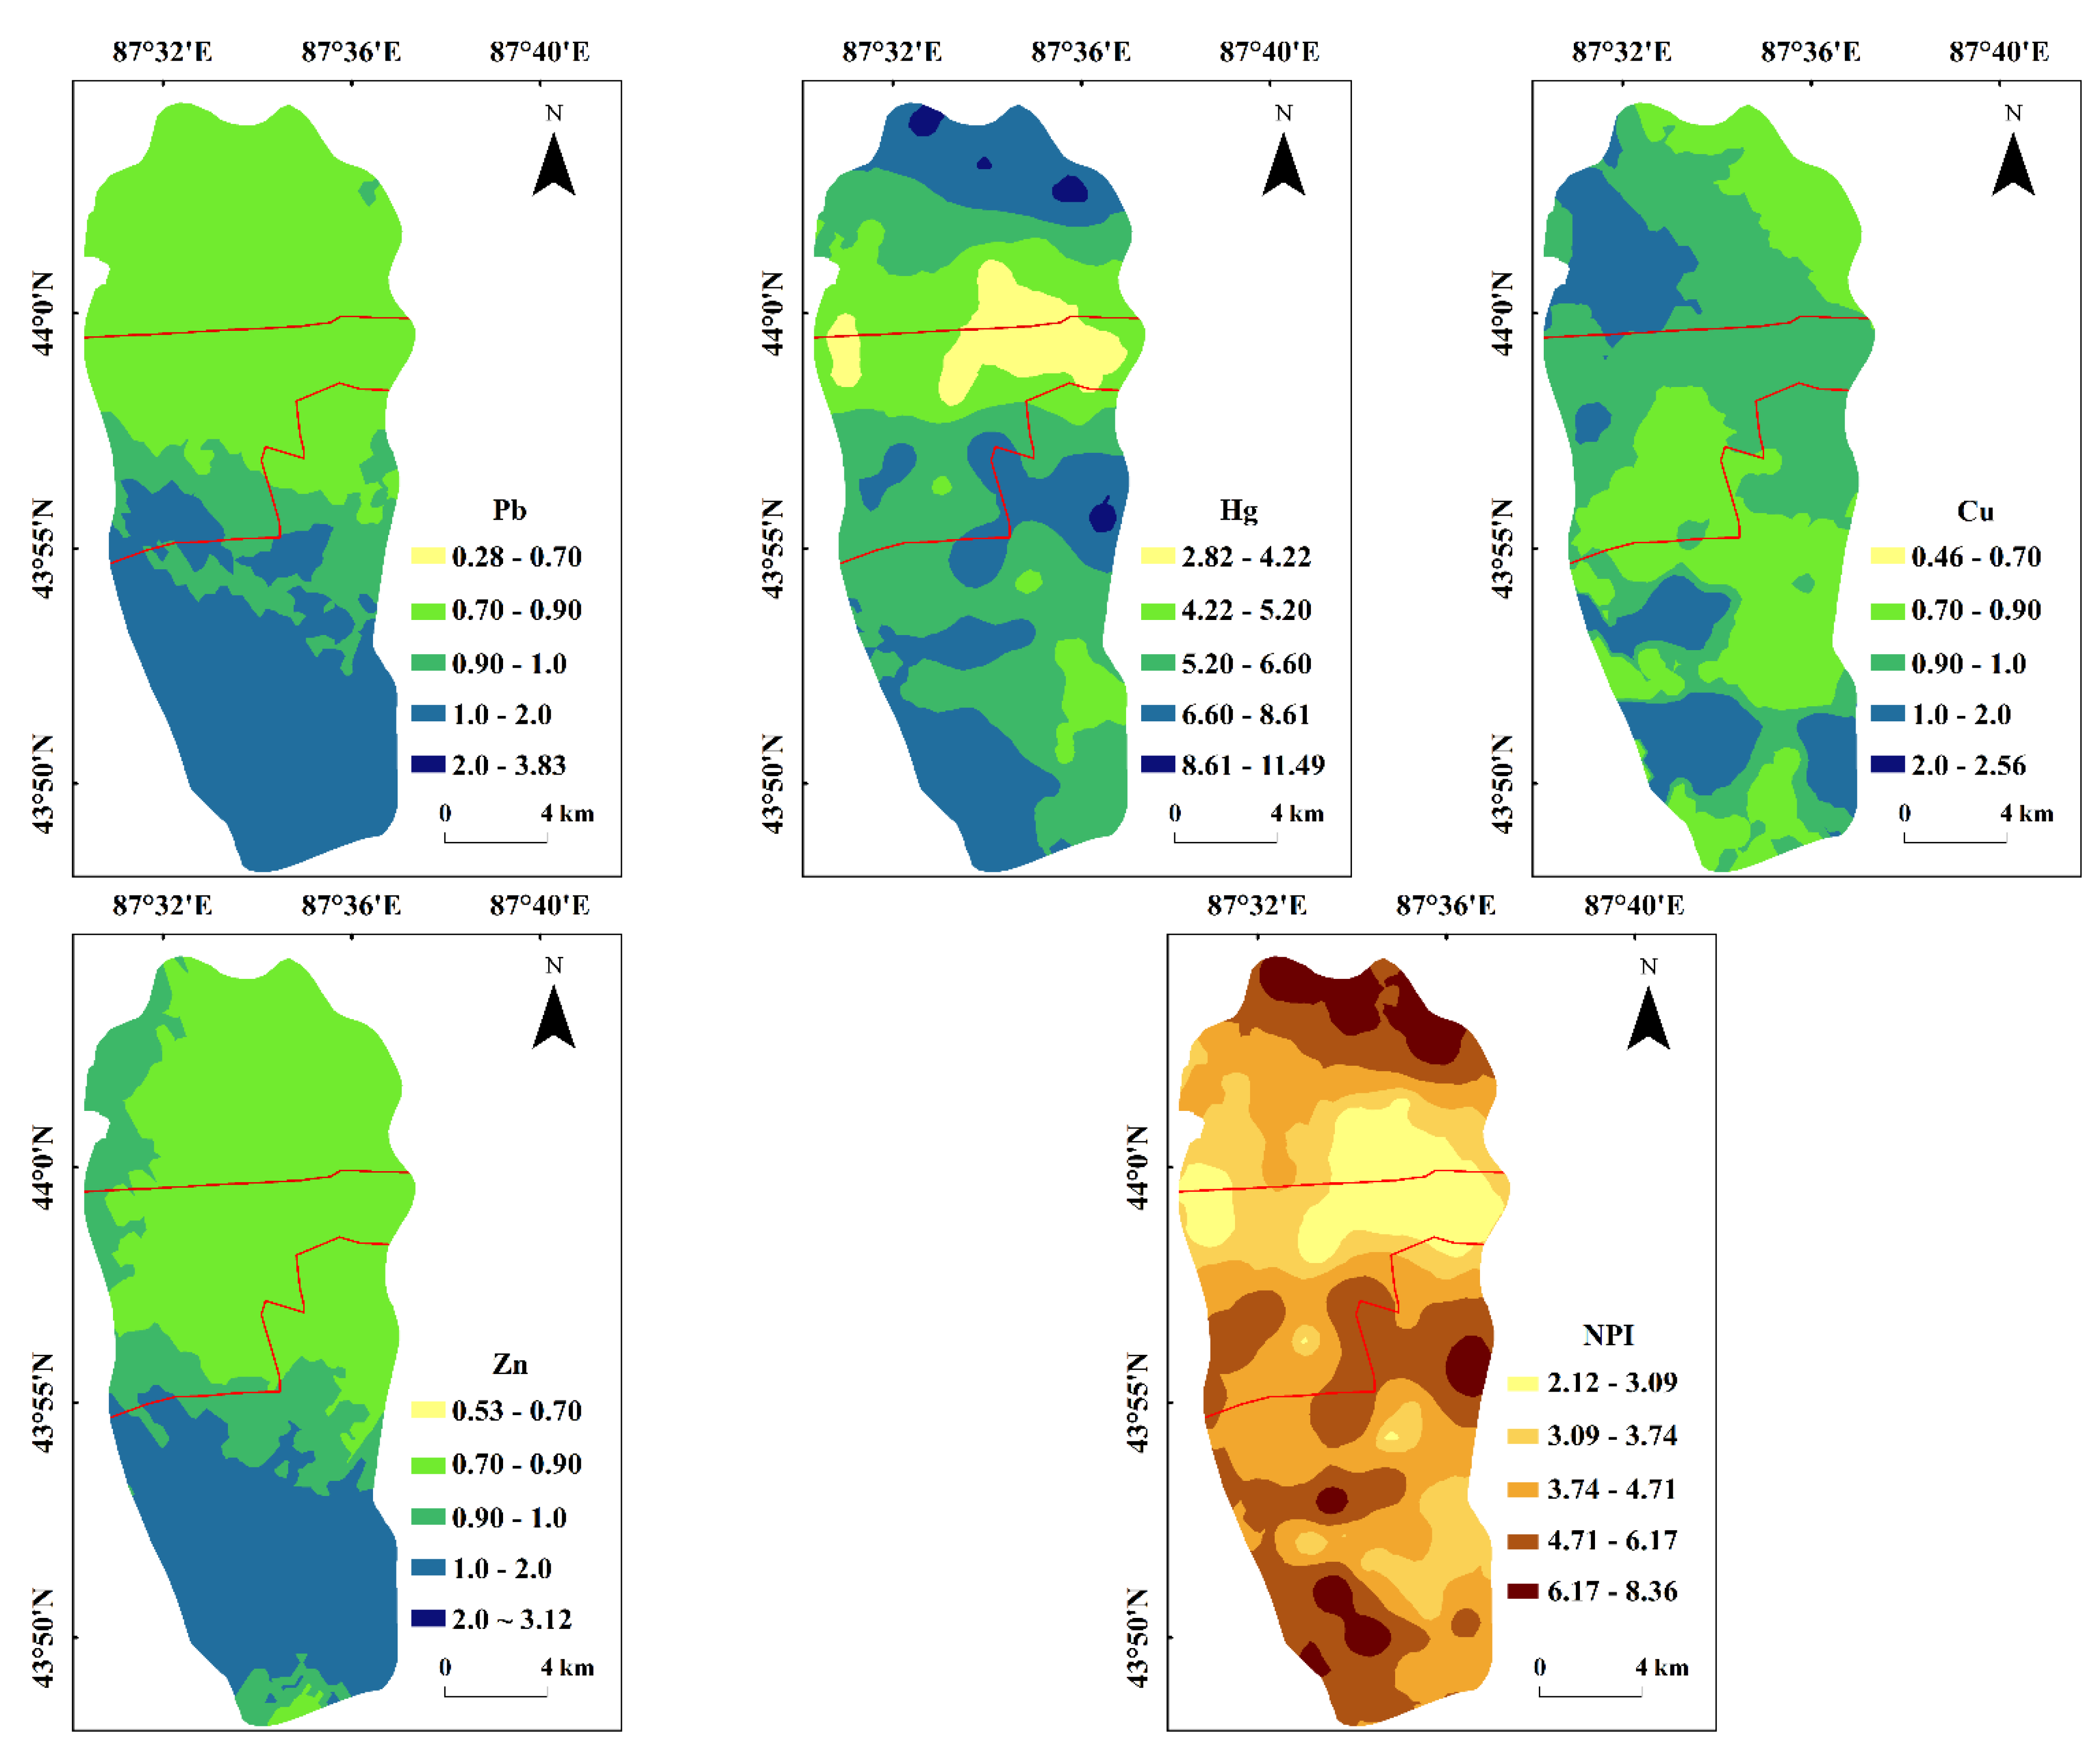
Spatial distribution patterns of the contamination levels of trace elements can be illustrated, based on geographical information systems (GIS). In general, these patterns show higher contamination levels in high-traffic or industrial areas than in residential or commercial areas [48]. Spatial heterogeneity and the distribution patterns of the contamination levels of trace elements in the soil are typically identified using the geostatistical analysis method [49,50]. In this study, the distribution patterns of contamination levels of the seven trace elements in Urumqi were mapped using the ordinary Kriging interpolation, based on the geostatistical analysis method and GIS technology (Figure 2).
It can be seen from Figure 2 that the distribution patterns of contamination levels of the trace elements in topsoil in the study area are quite different. The distribution patterns of contamination levels of Cd, Ni, Pb, and Zn in the soil are similar to one another, with high contamination levels in the urban gradient zone and low contamination in the rural gradient zone in the study area. The reason is that the urban gradient zone is in the old sections of the city, with a large population, frequent human activities, and frequent commercial activities. The average concentrations of Pb and Zn in surface soils in urban areas are slightly higher than the corresponding background levels in grey desert soils and are lower than the corresponding background values in suburban and rural areas, indicating that some of these elements are present at natural background concentrations, controlled by the parent material, while others originate from anthropogenic factors. Soil samples were taken from green belts surrounded by heavily trafficked roads; traffic exhaust significantly influenced the accumulation of trace elements in the topsoil at these sampling sites. Related studies have reported that the Cd, Ni, Pb, and Zn elements in soils are mainly derived from traffic emission sources because more than 90% of Pb from traffic emissions is due to brake wear, while more than 80% of Ni from traffic emissions is due to exhaust emissions [51,52,53]. Cd is also found in tires, diesel fuel, and lubricating oils [54]. Thus, traffic emissions and other human activities may be a common source governing the distribution of Cd, Ni, Pb, and Zn in topsoil in the study area.
There is no obvious zonal distribution for the contamination levels of As, Cu, and Hg, and high contamination areas appear in each urbanization gradient in the study area. Among them, Hg is the element with the highest contamination level and the largest contaminated area in the topsoil in the study area, indicating a serious contamination level of Hg in the topsoil in the study area. Relevant studies have shown that the major sources of the high As and Hg concentrations are industrial (smelting) emissions and coal combustion [55,56]. A continuous industrial belt has been formed in the northern part of Urumqi; industrial emissions lead to the enrichment of Hg elements in the surrounding soil via atmospheric deposition. Other related research results in the study area also show that the Hg element content in the study area is very high, which is related to the parent material of the soil [57,58]. Considering the above analysis, the Hg element comes from natural and anthropogenic sources. Highly concentrated areas of Cu were observed in the rural gradient zones in the study area. Cu is a micronutrient, one that is especially common in manure and sewage sludge used to fertilize the soil [59,60]. Thus, arable soils frequently have elevated Cu contents.
It can be seen from the spatial distribution patterns of the NPI values of trace elements in the topsoil in the study area that the spatial distribution pattern of NPI is basically consistent with the spatial distribution pattern of the Pi value of the Hg element, which further indicates that Hg is the main contaminant in the topsoil in the study area. However, the NPI values of trace elements in urban soils gradually decreased from the west to the east, whereas the NPI values of trace elements in suburban soils gradually decreased from the south to the north, and the NPI values of trace elements in rural soils decreased from the north to the south.

8. Non-Carcinogenic Risk of Trace Elements in the Soil along an Urbanization Gradient

The health risk assessment model introduced by the US EPA was used to evaluate the potential health risks of trace elements in soils along an urbanization gradient in the study area; the results of the health risk assessments of trace elements in different urbanization gradients were compared and discussed. In general, a person is exposed to trace elements in topsoil via three main routes: ingestion, inhalation, and dermal contact. Considering the physiological and behavioral differences between adults and children, both were included in the health risk assessment of trace elements in this study. The chronic daily intake of each element in the soils in all urbanization gradients via the three exposure routes was estimated for adults and children and was then used to calculate the hazard quotients (HQ) and hazard indexes (HI).
As shown in Table 5, the average HQ values of trace elements in the soils in urban, suburban, and rural gradients decreased in the order of HQAs > HQPb> HQHg > HQCd > HQNi > HQCu > HQZn, for both adults and children. This indicates that the As in the soil in all urbanization gradients has the highest non-carcinogenic health risk. When ranked based on exposure routes, the average HQ values decrease in the order of HQdermal > HQingest > HQinhale. This indicates that dermal contact is the main route of exposure to the non-carcinogenic health risks of trace elements in soils in all urbanization gradients. The calculated total non-carcinogenic hazard index of the analyzed trace elements in soil for children is higher than that for adults in each urbanization gradient zone. This is probably due to the fact that children are more susceptible to a given dose of toxin and are more likely to inadvertently ingest significant quantities of dust from the soil. Through ingestion, children tend to be exposed to greater amounts of soil than adults due to pica and play behavior [61,62]. These results indicate that trace elements in the soil in all urbanization gradients present more of a non-carcinogenic health risk to children than to adults.
The hazard index (HI) represents the cumulative effect of the hazard quotient of all the trace elements. As shown in Table 5, the HI values of trace elements in soil in the urban, suburban, and rural gradients of the Urumqi are 0.26, 0.25, and 0.23 for adults, and 1.02, 0.99, and 0.90 for children, respectively. It can be seen that the calculated HI values of children in each urbanization gradient are greater than that of adults. Moreover, when considering the combined HI values of the analyzed trace elements, a relatively higher potential non-carcinogenic risk to the local children is observed, with all values exceeding 0.9, reaching up to 1.02 in the soil from the urban gradient, indicating that the contamination of soil with trace elements presents more of a non-carcinogenic health risk for children.
On the whole, As contributed the most to the HI values of analyzed trace elements in all urbanization gradients, indicating that As is the main non-carcinogenic risk factor in soils in the study area. The HI values of trace elements in soil can be ranked as urban > suburban > rural, for both adults and children, indicating that the trace elements in the topsoil in the urban gradient present more of a potential health risk than topsoil in suburban and rural gradient zones. This basically corresponds to the concentrations of trace elements in the soil from each gradient in the study area, which leads to the relatively higher non-carcinogenic health risks of trace elements in the urban gradient.
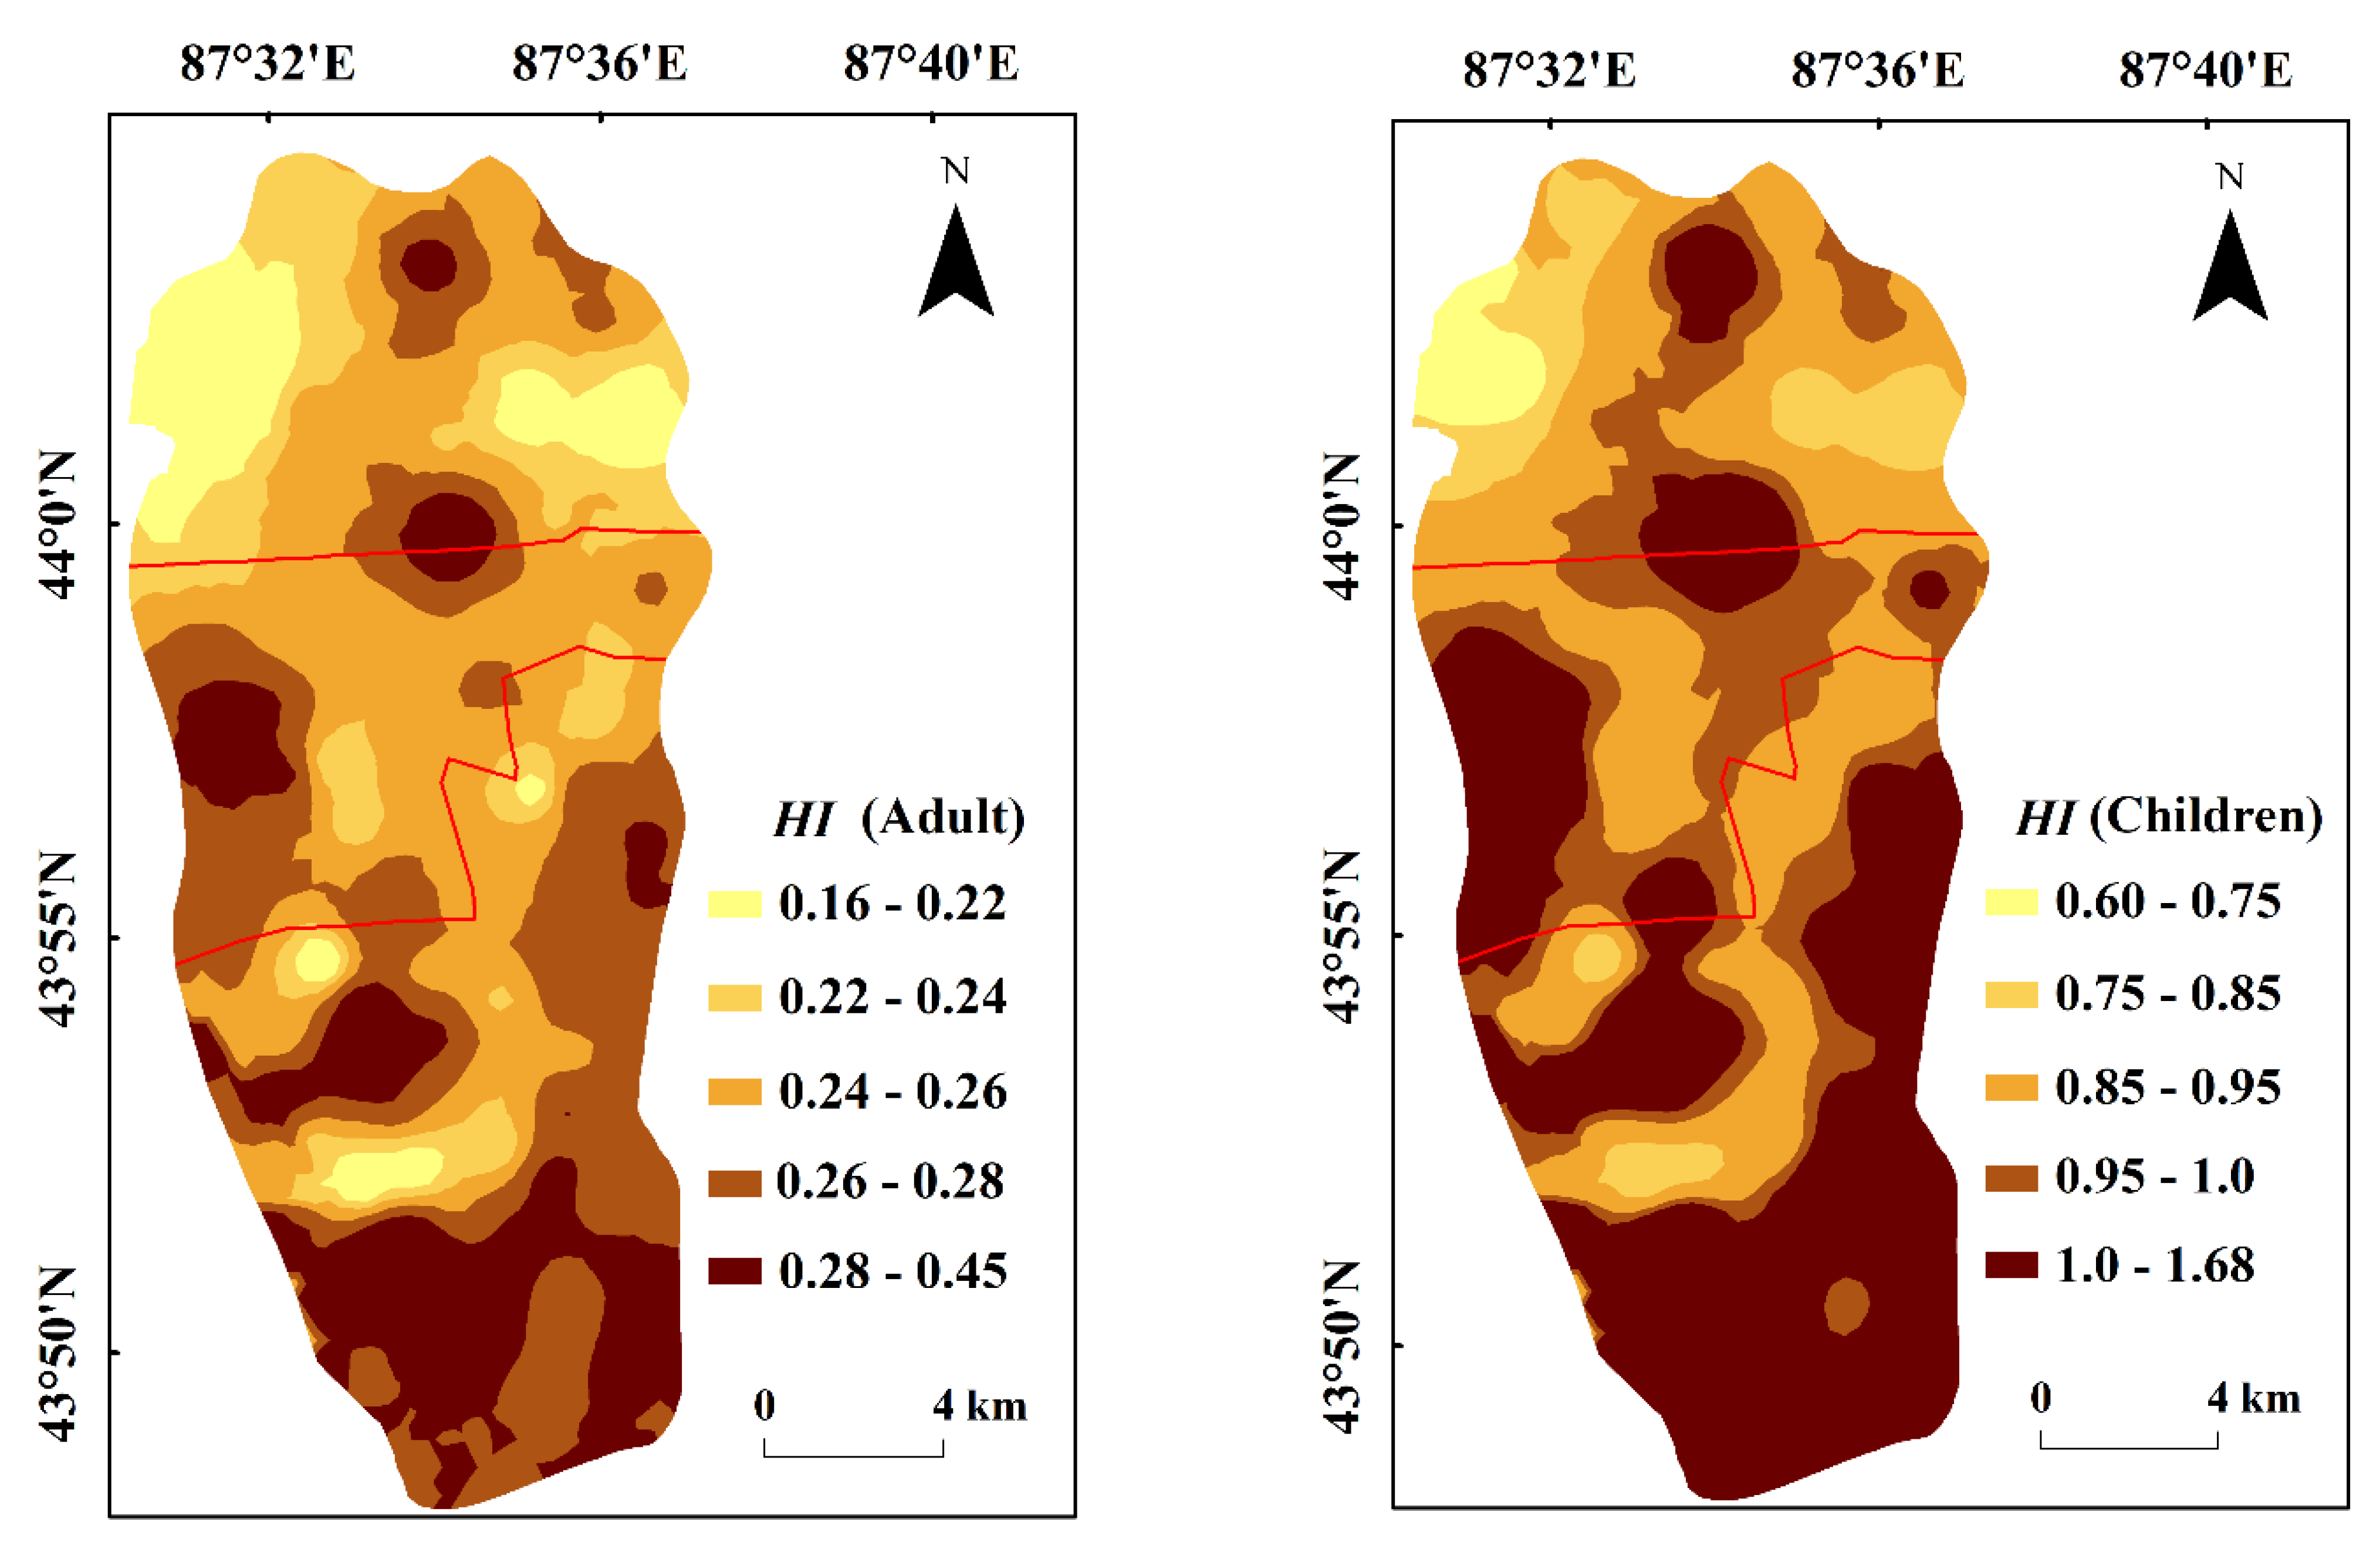
Figure 3 illustrates the spatial distribution of the HI values of trace elements in the soil for children and adults, as it was determined that children had higher levels of non-carcinogenic risk, especially in the southern parts in the study area. However, the spatial distribution patterns of the HI values of trace elements for both children and adults seem to be consistent with the spatial distribution pattern of the Pi value of As, which further indicates that As is the main non-carcinogenic health risk factor in terms of topsoil in the study area.

9. Carcinogenic Risk of Trace Elements in the Soil along an Urbanization Gradient

Due to the lack of carcinogenic slope factors (SF) for the Cu, Hg, Ni, Pb, and Zn elements, the carcinogenic risks of As and Cd were calculated in the present study. The estimated carcinogenic risk (CR) and the total carcinogenic risk (TCR) of As and Cd for both adults and children, from exposure via ingestion, inhalation, and dermal contact with the soil in all urbanization gradients in the study area are listed in Table 6.
As shown in Table 6, the CR values of As in the soil in all urbanization gradients are the highest in the two groups (adults and children) but are still within the safe range. The calculated TCR values of As for adults and children were 2.55 × 10⁻⁵ and 2.70 × 10⁻⁵ in urban soil, 2.62 × 10⁻⁵ and 2.79 × 10⁻⁵ in suburban soil, and 7.98 × 10⁻⁶ and 1.54 × 10⁻⁵ in rural soil, respectively, which are lower than the acceptable risk threshold value (1 × 10⁻⁴). Meanwhile, the CR values of Cd for adults and children were 4.94 × 10⁻⁷ and 8.83 × 10⁻⁷ in urban soil, 4.05 × 10⁻⁷ and 8.59 × 10⁻⁷ in suburban soil, and 4.63 × 10⁻⁷ and 8.28 × 10⁻⁷ in rural soil, respectively; these values are also lower than the acceptable risk threshold value. The results show that the As and Cd elements in soil in all urbanization gradients cannot pose a carcinogenic health risk for either adults or children. Moreover, based on the values listed in Table 6, dermal contact is the main route of exposure to As and Cd elements in the soil.
On the whole, As contributed the most to the TCR values of trace elements in all urbanization gradients, indicating that As is the main carcinogenic risk factor in soils in the study area. The obtained TCR values for As and Cd elements in soil in each urbanization gradient in the study area can be ranked as suburban > urban > rural, for both adults and children, while the potential carcinogenic risk of As and Cd elements for children was greater than that for adults. These results indicate that trace elements in the topsoil present a higher carcinogenic health risk to children than to adults. This is a matter of deep concern because As has been confirmed to be the main carcinogenic and non-carcinogenic risk factor in terms of carcinogens and also has the potential to induce other forms of chronic health problems via topsoil in the study area.
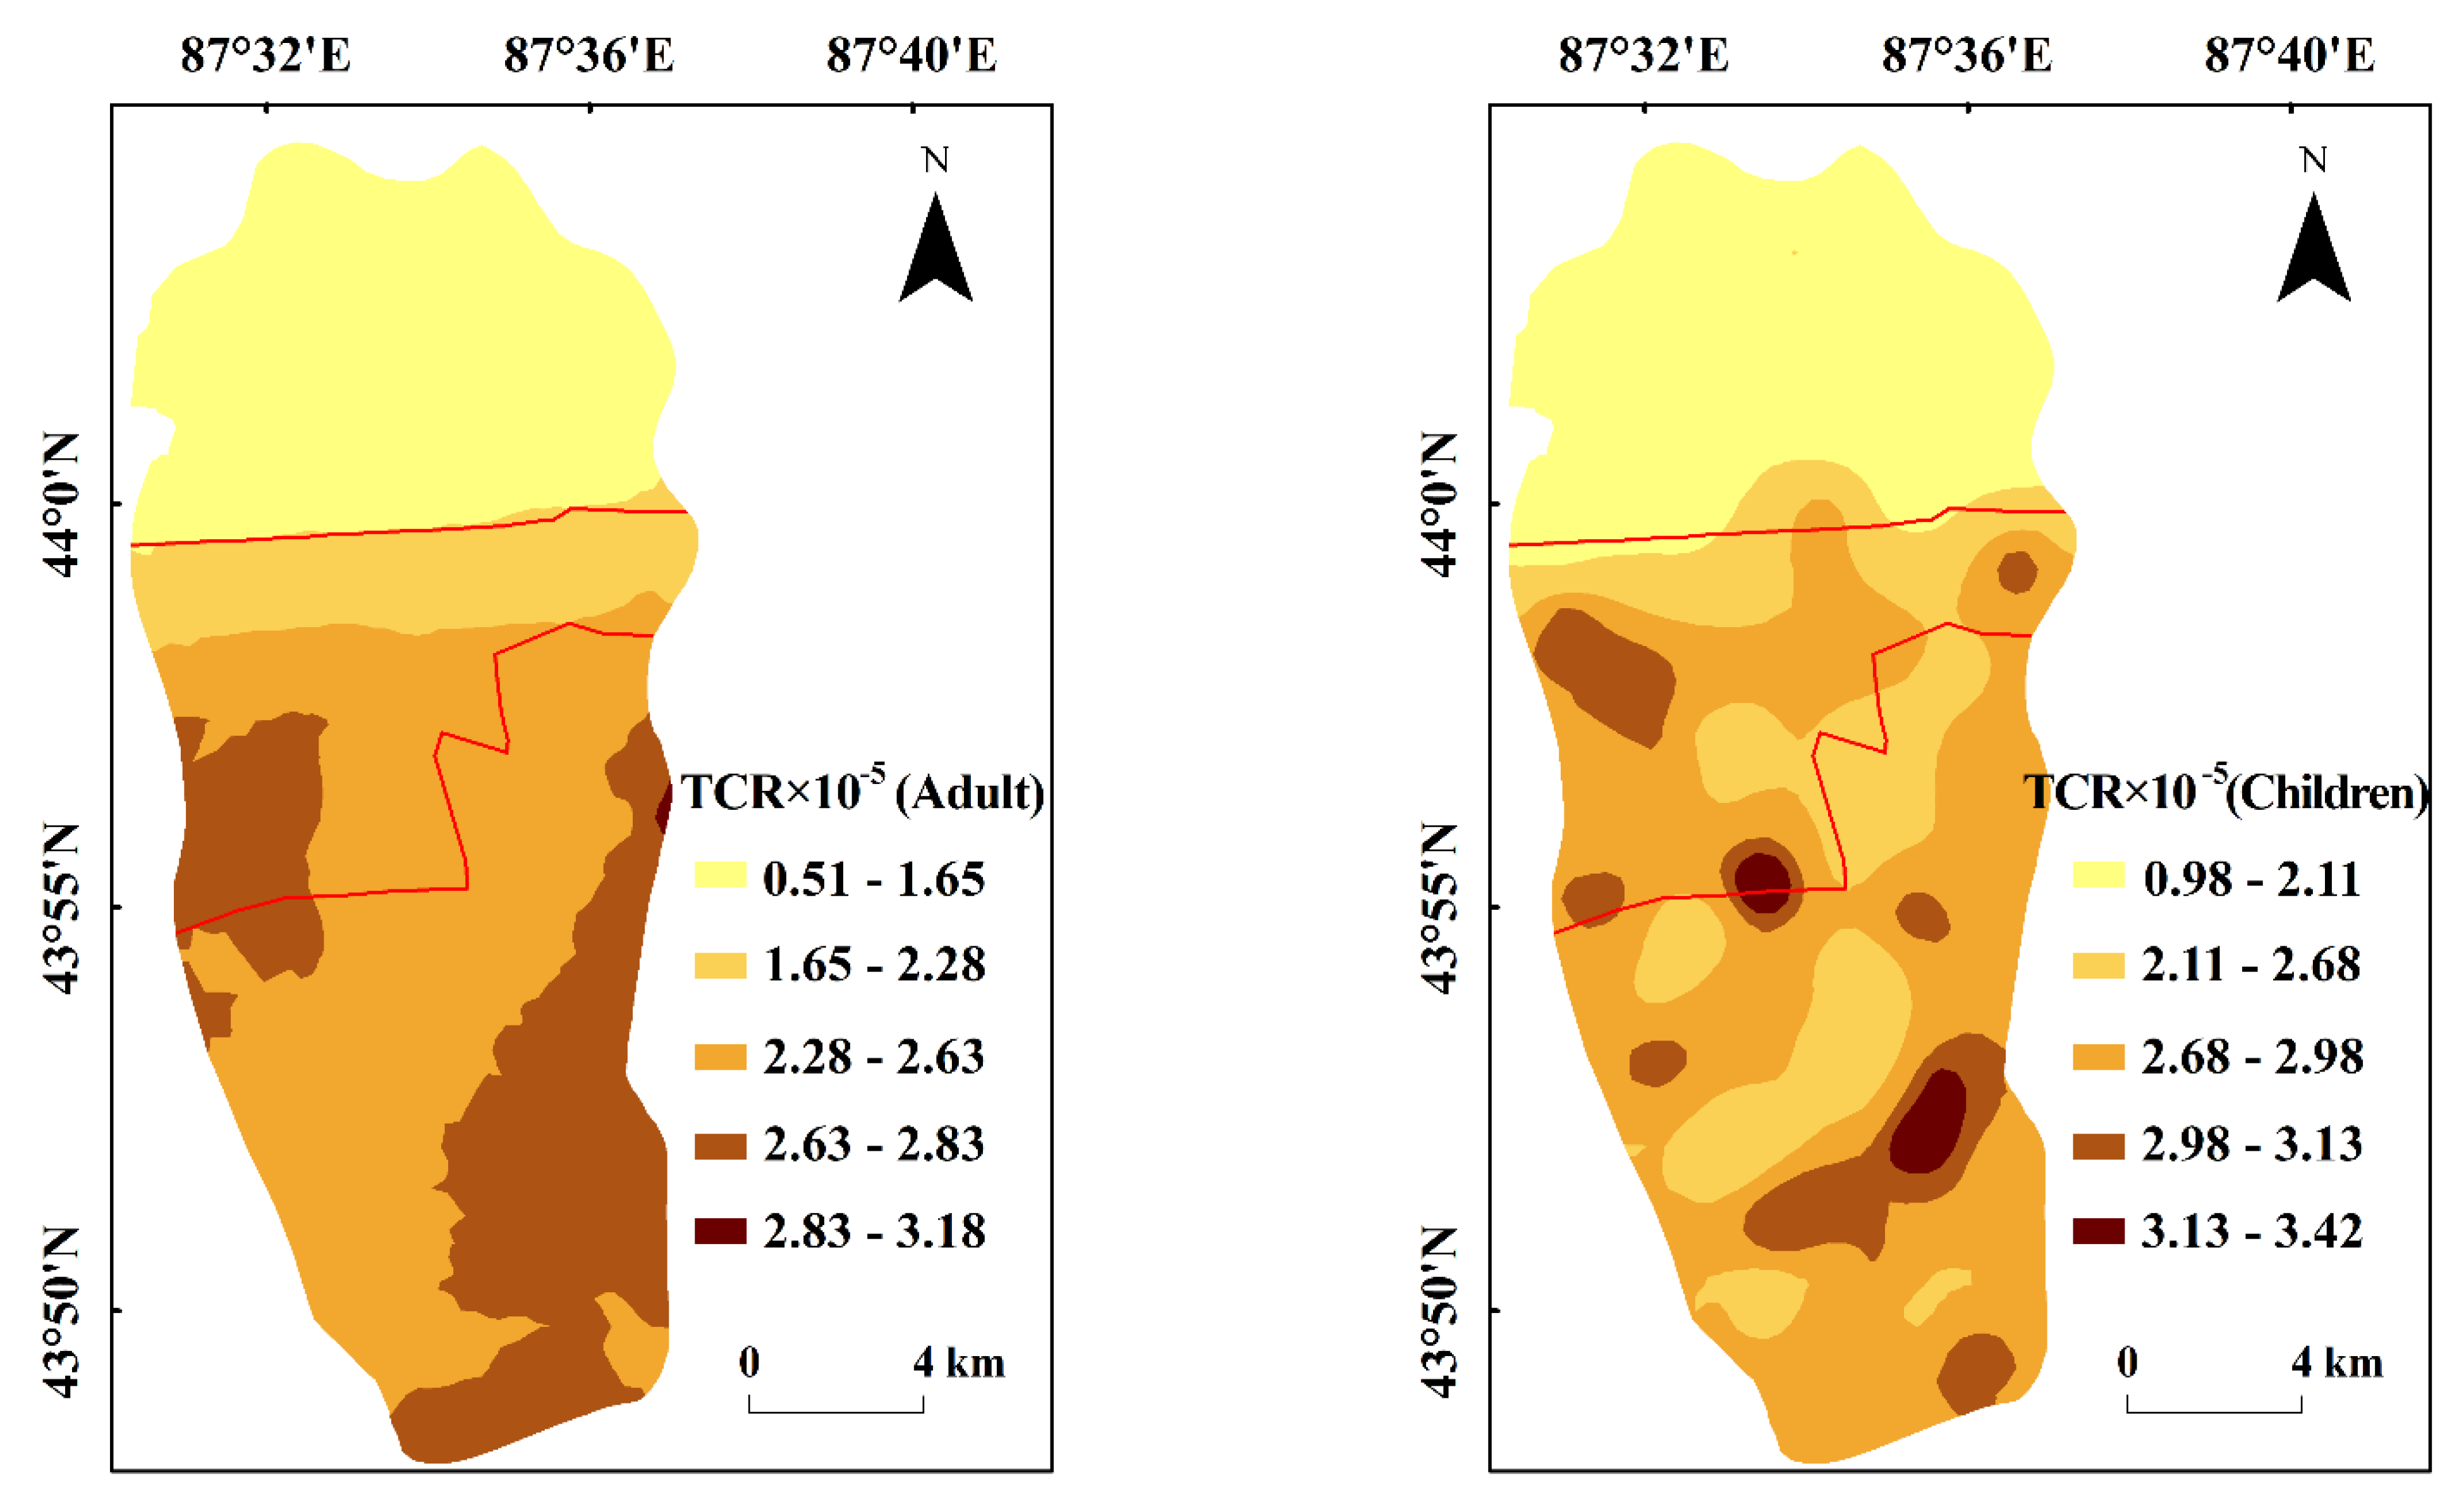
Figure 4 depicts the spatial distribution patterns of the calculated TCR values for both children and adults. As shown in Figure 4, the spatial distribution patterns of the TCR values for adults and children are basically the same, with relatively higher risk areas. The areas with higher TCR values are mainly distributed in the southern parts of Urumqi, while the areas with lower TCR values are mainly distributed in the northern parts of Urumqi. The contamination of soil with As was higher in the samples from the high-risk area highlighted by the TCR values, which was consistent with the spatial distribution of HI values.
Based on the results discussed above, As is identified as a priority control element in topsoil in the Urumqi city area, due to its toxicity and higher potential carcinogenic and non-carcinogenic health risk. Knowing that As is mainly emitted by anthropogenic sources [63], it is necessary to control its production so as to eliminate any potential threats to human health. High concentrated areas of As were observed in both urban and suburban gradient zones in the study area. For As, a clear distinction in its concentrations between the urban and rural gradients indicate that urbanization has preferentially increased the As contents in the soils closer to urbanized areas. Deng et al. reported that high contents of As are associated with coal combustion [64]. In particular, the As has been identified as the traces of coal-burning [65]. The previous study also revealed that atmospheric depositions (such as cement, coal, and oil combustion dust, metallurgic dust, and vehicle exhaust particles) are the main sources of As enrichment [66,67]. Other research showed that industrial manufacturing could increase the concentration of As and Ni in soil [68]. There is a waste incineration plant about 10 km far away from the northeastern parts of the study area, and there is also a continuous industrial belt in the northern part of the urban area; therefore it can be concluded that atmospheric deposition is the main source of As in soils in the study area. Therefore, the control of industrial contamination is vital for the mitigation of toxic element contamination in the urban area. Additionally, a well-managed waste disposal system is necessary to control the serious contamination caused by potentially toxic elements. Here again, a potential human health risk assessment procedure or, at least, the specific monitoring of the As contamination of topsoil in all urbanization gradient zones in Urumqi will be necessary.
Our results also suggest that the potential human health risk assessment is useful to study the effects of urbanization on trace element contamination of topsoil. However, the obtained non-carcinogenic and carcinogenic health risks of trace element contamination in topsoil in the study area were influenced by several uncertainty factors. The exposure assessment parameters determined for this study were obtained from the US EPA exposure handbook and other related references, which may not be very suitable for the Urumqi city area. Besides this, the total concentration of trace elements was considered for estimating the non-carcinogenic and carcinogenic health risks in this study. It may cause an overestimation of the actual potential health risks that they pose to humans. Therefore, more precise exposure assessment parameters should be defined. We also suggest that multiple profiles of the urbanization gradient of the study area would render this study even more meaningful.

10. Conclusions

In summary, the results suggest that the concentrations and contamination levels of trace elements differ among the investigated urbanization gradients. The total contamination level of trace elements in the topsoil of the Urumqi area can be ranked as urban > rural > suburban. The topsoil in the urban gradient zone, where the population density and traffic flow are relatively higher, is more heavily contaminated by trace elements, especially Cd, Cu, Hg, Ni, Pb, and Zn, than the topsoil in suburban and rural gradient zones. However, the distribution patterns of the contamination levels of trace elements in the topsoil in the study area are quite different. Health risk assessments indicate that dermal contact is the main route of exposure to the potential health risks of trace elements in topsoil in all urbanization gradients, and trace elements in topsoil present more potential health risks to children than to adults. A relatively higher non-carcinogenic health risk to the local children is observed in the topsoil in the urban gradient zone. However, trace elements in the topsoil in all urbanization gradients in Urumqi do not pose a carcinogenic health risk. Overall, As is the main non-carcinogenic and carcinogenic element among the investigated metals in topsoil in all urbanization gradients in Urumqi. Therefore, specific measures should be adopted to reduce environmental exposure risks and to ensure the protection of human health. Our results also suggest that a potential human health risk assessment is useful to study the effects of urbanization on the contamination of topsoil.

Author Contributions

N.S. and M.E. designed the study and collected the soil samples. N.S. statistically analyzed the data and wrote the manuscript. X.L. and Y.W. revised the manuscript. All authors have read and agreed to the published version of the manuscript.

Funding

This work was supported jointly by the National Natural Science Foundation of China (No. U2003301, No. 41867067, and No. 41661047).

Institutional Review Board Statement

Not applicable.

Informed Consent Statement

Not applicable.

Data Availability Statement

Data will be available upon request to the corresponding author.

Conflicts of Interest

The authors declare that they have no conflict of interest.

References

  1. Bai, Y.; Wang, M.; Peng, C.; Alatalo, J.M. Impacts of urbanization on the distribution of heavy metals in soils along the Huangpu River, the drinking water source for Shanghai. Environ. Sci. Pollut. Res. 2016, 23, 5222–5231. [Google Scholar] [CrossRef] [PubMed] [Green Version]
  2. Zhao, H.T.; Li, X.Y. Risk assessment of metals in road-deposited sediment along an urban–rural gradient. Environ. Pollut. 2013, 174, 297–304. [Google Scholar] [CrossRef]
  3. Hamed, A.; Adel, R.; Abdullah, S.; Mohammad, A.; Munir, A.; Abdulelah, A. Sources, toxicity potential, and human health risk assessment of heavy metals-laden soil and dust of urban and suburban areas as affected by industrial and mining activities. Sci. Rep. 2022, 12, 8972–8989. [Google Scholar]
  4. De Silva, S.; Ball, A.S.; Huynh, T.; Reichman, S.M. Metal accumulation in roadside soil in Melbourne, Australia: Effect of road age, traffic density and vehicular speed. Environ. Pollut. 2016, 208, 102–109. [Google Scholar] [CrossRef] [PubMed]
  5. De Oliveira, L.M.; Das, S.; da Silva, E.B.; Gao, P.; Gress, J.; Liu, Y.; Ma, L.Q. Metal concentrations in traditional and herbal teas and their potential risks to human health. Sci. Total Environ. 2018, 633, 649–657. [Google Scholar] [CrossRef]
  6. Jiang, Y.; Chao, S.; Liu, J.; Yang, Y.; Chen, Y.; Zhang, A.; Cao, H. Source apportionment and health risk assessment of heavy metals in soil for a township in Jiangsu Province, China. Chemosphere 2017, 168, 1658–1668. [Google Scholar] [CrossRef]
  7. Wu, J.; Lu, J.; Li, L.; Min, X.; Luo, Y. Pollution, ecological-health risks, and sources of heavy metals in soil of the northeastern Qinghai-Tibet Plateau. Chemosphere 2018, 201, 234–242. [Google Scholar] [CrossRef]
  8. Nabulo, G.; Young, S.D.; Black, C.R. Assessing risk to human health from tropical leafy vegetables grown on contaminated urban soils. Sci. Total Environ. 2010, 408, 5338–5351. [Google Scholar] [CrossRef]
  9. Doabi, S.A.; Karami, M.; Afyuni, M.; Yeganeh, M. Pollution and health risk assessment of heavy metals in agricultural soil, atmospheric dust and major food crops in Kermanshah province, Iran. Ecotoxicol. Environ. Saf. 2018, 163, 153–164. [Google Scholar] [CrossRef]
  10. Itoh, H.; Iwasaki, M.; Sawada, N.; Takachi, R.; Kasuga, Y.; Yokoyama, S.; Onuma, H.; Nishimura, H.; Kusama, R.; Yokoyama, K.; et al. Dietary cadmium intake and breast cancer risk in Japanese women: A case-control study. Int. J. Hyg. Environ. Health 2014, 217, 70–77. [Google Scholar] [CrossRef]
  11. Luo, X.S.; Ding, J.; Xu, B.; Wang, Y.-J.; Li, H.-B.; Yu, S. Incorporating bioaccessibility into human health risk assessments of heavy metals in urban park soils. Sci. Total Environ. 2012, 424, 88–96. [Google Scholar] [CrossRef] [PubMed]
  12. Zhao, Q.; Wang, Y.; Cao, Y.; Chen, A.; Ren, M.; Ge, Y.; Yu, Z.; Wan, S.; Hu, A.; Bo, Q.; et al. Potential health risks of heavy metals in cultivated topsoil and grain, including correlations with human primary liver, lung and gastric cancer, in Anhui Province, eastern China. Sci. Total Environ. 2014, 470, 340–347. [Google Scholar] [CrossRef] [PubMed]
  13. Gábor, S.; Ágnes, L.; Veronika, B.; László, C. Quantifying the urban gradient: A practical method for broad measurements. Land Urban Plan 2014, 131, 42–50. [Google Scholar]
  14. Lee, C.S.L.; Li, X.; Shi, W.; Cheung, S.C.-N.; Thornton, I. Metal contamination in urban, suburban, and country park soils of Hong Kong: A study based on GIS and multivariate statistics. Sci. Total Environ. 2006, 356, 45–61. [Google Scholar] [CrossRef] [PubMed] [Green Version]
  15. Lu, S.G.; Wang, H.Y.; Bai, S.Q. Heavy metal contents and magnetic susceptibility of soils along an urban-rural gradient in rapidly growing city of Eastern China. Environ. Monit. Assess. 2009, 155, 91–101. [Google Scholar] [CrossRef]
  16. Li, J.; Pu, L.; Zhu, M.; Liao, Q.; Wang, H.; Cai, F. Spatial pattern of heavy metal concentration in the soil of rapid urbanization area: A case of Ehu Town, Wuxi City, Eastern China. Environ. Earth Sci. 2014, 71, 3355–3362. [Google Scholar] [CrossRef]
  17. Islam, S.; Ahmed, K.; Al-Mamun, H. Distribution of trace elements in different soils and risk assessment: A case study for the urbanized area in Bangladesh. J. Geochem. Explor. 2015, 158, 212–222. [Google Scholar] [CrossRef]
  18. Xie, T.; Wang, M.; Chen, W.; Uwizeyimana, H. Impacts of urbanization and landscape patterns on the accumulation of heavy metals in soils in residential areas in Beijing. J. Soils Sediments 2019, 19, 148–158. [Google Scholar] [CrossRef]
  19. Streeter, M.T.; Schilling, K.E.; Demanett, Z. Soil health variations across an agricultural-urban gradient, Iowa, USA. Environ. Earth Sci. 2019, 78, 691–700. [Google Scholar] [CrossRef]
  20. Sheng, D.; Zhu, L.B.; Ma, L. Ecological hazard and health risk assessment of trace elements in urban topsoil of Anhui province, China. Fresenius Environ. Bull. 2020, 29, 5321–5330. [Google Scholar]
  21. De Nicola, F.; Baldantoni, D.; Sessa, L.; Monaci, F.; Bargagli, R.; Alfani, A. Distribution of heavy metals and polycyclic aromatic hydrocarbons in holm oak plant-soil system evaluated along urbanization gradients. Chemosphere. 2015, 134, 91–97. [Google Scholar] [CrossRef] [PubMed]
  22. Becker, D.F.P.; Linden, R.; Schmitt, J.L. Richness, coverage and concentration of trace elements in vascular epiphytes along an urbanization gradient. Sci. Total Environ. 2017, 584, 48–54. [Google Scholar] [CrossRef] [PubMed]
  23. Wei, B.; Jiang, F.; Li, X.; Mu, S. Heavy metal induced ecological risk in the city of Urumqi, NW China. Environ. Monit. Assess. 2010, 160, 33–45. [Google Scholar] [CrossRef] [PubMed]
  24. Li, J.M.; Zhang, Y.T. Characteristics of heavy metal pollution in forest belt soil of different functional zones in Urumqi, Xinjiang. Ecol. Environ. Sci. 2019, 28, 1859–1866. (In Chinese) [Google Scholar]
  25. Gulbanu, H.; Mamattursun, E.; Wang, W.W.; Ili, A.; Li, X.G. Spatial distribution, contamination levels, sources, and potential health risk assessment of trace elements in street dusts of Urumqi city, NW China. Hum. Ecol. Risk Assess. 2020, 26, 2112–2128. [Google Scholar]
  26. Yao, X.D.; Wang, J.; Wang, Y.M.; Fu, J.H.; Xu, T. Potential ecological risk assessment on heavy metals in the soil of an industrial park in Urumqi, China. Nonferr. Metal. Eng. 2022, 12, 160–166. (In Chinese) [Google Scholar]
  27. Wang, Y. Urban Spatial Morphological Evolution Based on GIS Analysis of Remote Sensing Data—A Case Study of Urumqi. Master’s Thesis, Xinjiang University, Urumqi, China, 2019. (In Chinese). [Google Scholar]
  28. HJ/T 166–2004; Technical Specification for Soil Environmental Monitoring. CEPA (Chinese Environmental Protection Administration); China Environmental Press: Beijing, China, 2004. (In Chinese)
  29. HJ 803–2016; Soil and Sediment—Determination of Aqua Regia Extracts of 12 Metal Elements—Inductively Coupled Plasma Mass Spectrometry. CMEPRC (Ministry of Environmental Protection of the People’s Republic of China): Beijing, China, 2016. (In Chinese)
  30. GB/T 22105.2–2008; Soil Quality—Analysis of Total Mercury, Arsenic and Lead Contents—Atomic Fluorescence Spectrometry—Part 2: Analysis of Total Arsenic Contents in Soils. MAPRC (Ministry of Agriculture of the People’s Republic of China): Beijing, China, 2008. (In Chinese)
  31. Dung, T.T.T.; Cappuyns, V.; Swennen, R.; Phung, N.K. From geochemical background determination to pollution assessment of heavy metals in sediments and soils. Rev. Environ. Sci. Biotechnol. 2013, 12, 335–353. [Google Scholar] [CrossRef]
  32. Jaffar, S.T.A.; Luo, F.; Ye, R.; Younas, H.; Hu, X.-F.; Chen, L.-Z. The extent of heavy metal pollution and their potential health risk in topsoils of the massively urbanized district of Shanghai. Arch. Environ. Contam. Toxicol. 2017, 73, 362–376. [Google Scholar] [CrossRef]
  33. Li, X.P.; Feng, L.N. Spatial distribution of hazardous elements in urban topsoils surrounding Xi’an industrial areas, (NW China): Controlling factors and pollution assessments. J. Hazard. Mater. 2010, 174, 662–669. [Google Scholar] [CrossRef]
  34. Zhong, L.Y.; Liu, L.; Yang, J.W. Characterization of heavy metal pollution in the paddy soils of Xiangyin County, Dongting lake drainage basin, central south China. Environ. Earth Sci. 2012, 67, 2261–2268. [Google Scholar] [CrossRef]
  35. EPA/630/R–98/002; Guidelines for the Health Risk Assessment of Chemical Mixtures. The U.S. Environmental Protection Agency: Washington, DC, USA, 1986.
  36. EPA/540/1–89/002; Risk Assessment Guidance for Superfund. Part A—Human Health Evaluation Manual. Office of Emergency and Remedial Response: Washington, DC, USA, 1989; Volume 1.
  37. OSWER9355.4–24; Supplemental Guidance for Developing Soil Screening Levels for Superfund Sites. Office of Solid Waste and Emergency Response: Washington, DC, USA, 2001.
  38. Fairbrother, A.; Wenstel, R.; Sappington, K.; Wood, W. Framework for metals risk assessment. Ecotoxicol. Environ. Saf. 2007, 68, 145–227. [Google Scholar] [CrossRef] [PubMed]
  39. Wang, L.H.; Li, M.M.; Zhang, Y.; Ma, W.M.; Cui, K.P.; Wang, Z.Q. Pollution characteristics and health risk assessment of heavy metals in soil of a vegetable base in north China. Acta Geosci. Sin. 2014, 35, 191–196. (In Chinese) [Google Scholar]
  40. Liang, Q.; Xue, Z.-J.; Wang, F.; Sun, Z.-M.; Yang, Z.-X.; Liu, S.-Q. Contamination and health risks from heavy metals in cultivated soil in Zhangjiakou City of Hebei Province, China. Environ. Monit. Assess. 2015, 187, 754. [Google Scholar] [CrossRef] [PubMed]
  41. Yang, M.; Teng, Y.; Ren, W.J.; Huang, Y.; Xu, D.F.; Fu, Z.C.; Ma, W.T.; Luo, Y.M. Pollution and health risk assessment of heavy metals in agricultural soil around Shimen Realgar Mine. Soils 2016, 48, 1172–1178. (In Chinese) [Google Scholar]
  42. IARC (International Agency for Research on Cancer). Agents Classified by the IARC Monographs: 1–109; IARC (International Agency for Research on Cancer): Lyon, France, 2014. [Google Scholar]
  43. Praveena, S.M.; Aris, A.Z. Status, source identification, and health risks of potentially toxic element concentrations in road dust in a medium-sized city in a developing country. Environ. Geochem. Health 2017, 40, 749–762. [Google Scholar] [CrossRef]
  44. Tong, J.T.; Wei, C.; Guo, H.M. Detection and health risk of arsenic species in crops from arsenic-affected areas of Hetao Plain, Inner Mongolia. Asian J. Ecotoxicol. 2013, 8, 426–434. (In Chinese) [Google Scholar]
  45. Lei, L.; Liang, D.; Yu, D.; Chen, Y.; Song, W.; Li, J. Human health risk assessment of heavy metals in the irrigated area of Jinghui, Shaanxi, China, in terms of wheat flour consumption. Environ. Monit. Assess. 2015, 187, 647–659. [Google Scholar] [CrossRef]
  46. Li, J.; Zheng, C.J. Environmental Background Values Data Manual; China Environmental Science Press: Beijing, China, 1989. [Google Scholar]
  47. Mamattursun, E.; Anwar, M.; Ajigul, M.; Gulbanu, H. A human health risk assessment of heavy metals in agricultural soils of Yanqi Basin, Silk Road Economic Belt, China. Hum. Ecol. Risk Assess. 2018, 24, 1352–1366. [Google Scholar]
  48. Luo, X.-S.; Yu, S.; Zhu, Y.-G.; Li, X.-D. Trace metal contamination in urban soils of China. Sci. Total Environ. 2012, 421–422, 17–30. [Google Scholar] [CrossRef]
  49. Wang, J.; Chen, Z.; Sun, X.; Shi, G.; Xu, S.; Wang, D.; Wang, L. Quantitative spatial characteristics and environmental risk of toxic heavy metals in urban dusts of Shanghai, China. Environ. Earth Sci. 2009, 59, 645–654. [Google Scholar] [CrossRef]
  50. Lin, M.; Gui, H.; Wang, Y.; Peng, W. Pollution characteristics, source apportionment, and health risk of heavy metals in street dust of Suzhou, China. Environ. Sci. Pollut. Res. 2017, 24, 1987–1998. [Google Scholar] [CrossRef] [PubMed]
  51. Shi, G.; Chen, Z.; Bi, C.; Li, Y.; Teng, J.; Wang, L.; Xu, S. Comprehensive assessment of toxic metals in urban and suburban street deposited sediments (SDSs) in the biggest metropolitan area of China. Environ. Pollut. 2010, 158, 694–703. [Google Scholar] [CrossRef] [PubMed]
  52. Johansson, C.; Norman, M.; Burman, L. Road traffic emission factors for heavy metals. Atmos. Environ. 2009, 43, 4681–4688. [Google Scholar] [CrossRef]
  53. Napier, F.; D’Arcy, B.; Jefferies, C. A review of vehicle related metals and polycyclic aromatic hydrocarbons in the UK environment. Desalination 2008, 226, 143–150. [Google Scholar] [CrossRef]
  54. Ajmone-Marsan, F.; Biasioli, M. Trace elements in soils of urban areas. Water Air Soil Pollut. 2010, 213, 121–143. [Google Scholar] [CrossRef]
  55. Lu, A.; Wang, J.; Qin, X.; Wang, K.; Han, P.; Zhang, S. Multivariate and geostatistical analyses of the spatial distribution and origin of heavy metals in the agricultural soils in Shunyi, Beijing, China. Sci. Total Environ. 2012, 425, 66–74. [Google Scholar] [CrossRef]
  56. Guo, S.; Niu, X.; Zhai, J. Mercury release during thermal treatment of two Chinese coal gangues. Environ. Sci. Pollut. Res. 2017, 24, 23578–23583. [Google Scholar] [CrossRef]
  57. Mireade, L.; Maihemuti, B.; Ismayil, A.; Rukeya, S.; Mukadas, A.; Sheng, Y.C. Chracteristics and ecological risk assessment of heavy metals in soil of the Anningqu vegetable base in Urumqi. Earth Environ. 2019, 4, 485–494. (In Chinese) [Google Scholar]
  58. Qian, Y.; Yu, H.; Wang, L. Spatial distribution of heavy metal content in the farm lands from Midong district of Urumqi. Arid Land Geo. 2013, 36, 303–310. (In Chinese) [Google Scholar]
  59. Filzek, P.D.B.; Spurgeon, D.J.; Broll, G.; Svendsen, C.; Hankard, P.K.; Kammenga, J.E.; Donker, M.H.; Weeks, J.M. Pedological characterization of sites along a transect from a primary cadmium/lead/zinc smelting works. Ecotoxicology 2004, 13, 725–737. [Google Scholar] [CrossRef]
  60. Ogiyama, S.; Sakamoto, K.; Suzuki, H.; Ushio, S.; Anzai, T.; Inubushi, K. Accumulation of zinc and copper in an arable field after animal manure application. Soil Sci. Plant Nutr. 2005, 51, 801–808. [Google Scholar] [CrossRef] [Green Version]
  61. Rasmussen, P.; Subramanian, K.; Jessiman, B. A multi-element profile of house dust in relation to exterior dust and soils in the city of Ottawa, Canada. Sci. Total Environ. 2001, 267, 125–140. [Google Scholar] [CrossRef]
  62. Pan, L.; Ma, J.; Hu, Y.; Su, B.; Fang, G.; Wang, Y.; Wang, Z.; Wang, L.; Xiang, B. Assessments of levels, potential ecological risk, and human health risk of heavy metals in the soils from a typical county in Shanxi Province, China. Environ. Sci. Pollut. Res. 2016, 23, 19330–19340. [Google Scholar] [CrossRef]
  63. Zhou, Y.; Niu, L.; Liu, K.; Yin, S.; Liu, W. Arsenic in agricultural soils across China: Distribution pattern, accumulation trend, influencing factors, and risk assessment. Sci. Total Environ. 2018, 616, 156–163. [Google Scholar] [CrossRef] [PubMed]
  64. Deng, S.; Shi, Y.; Liu, Y.; Zhang, C.; Wang, X.; Cao, Q.; Li, S.; Zhang, F. Emission characteristics of Cd, Pb and Mn from coal combustion: Field study at coal-fired power plants in China. Fuel Process. Technol. 2014, 126, 469–475. [Google Scholar] [CrossRef]
  65. Mokhtara, M.M.; Taiba, R.M.; Hassima, M.H. Understanding selected trace elements behavior in a coal-fired power plant in Malaysia for assessment of abatement technologies. J. Air Waste Manag. Assoc. 2014, 64, 867–878. [Google Scholar] [CrossRef] [PubMed]
  66. Duan, J.; Tan, J. Atmospheric heavy metals and arsenic in China: Situation, sources and control policies. Atmos. Environ. 2013, 74, 93–101. [Google Scholar] [CrossRef]
  67. Sun, L.; Carey, M.; Yang, L.; Chen, L.-D.; Li, S.-J.; Zhao, F.-K.; Zhu, Y.-G.; Meharg, C.; Meharg, A.A. Source Identification of Trace Elements in Peri-urban Soils in Eastern China. Expo. Health 2018, 11, 195–207. [Google Scholar] [CrossRef]
  68. Gan, Y.; Miao, Y.; Wang, L.-H.; Yang, G.; Li, Y.C.; Wang, W.; Dai, J. Source contribution analysis and collaborative assessment of heavy metals in vegetable-growing soils. J. Agric. Food Chem. 2018, 66, 10943–10951. [Google Scholar] [CrossRef]
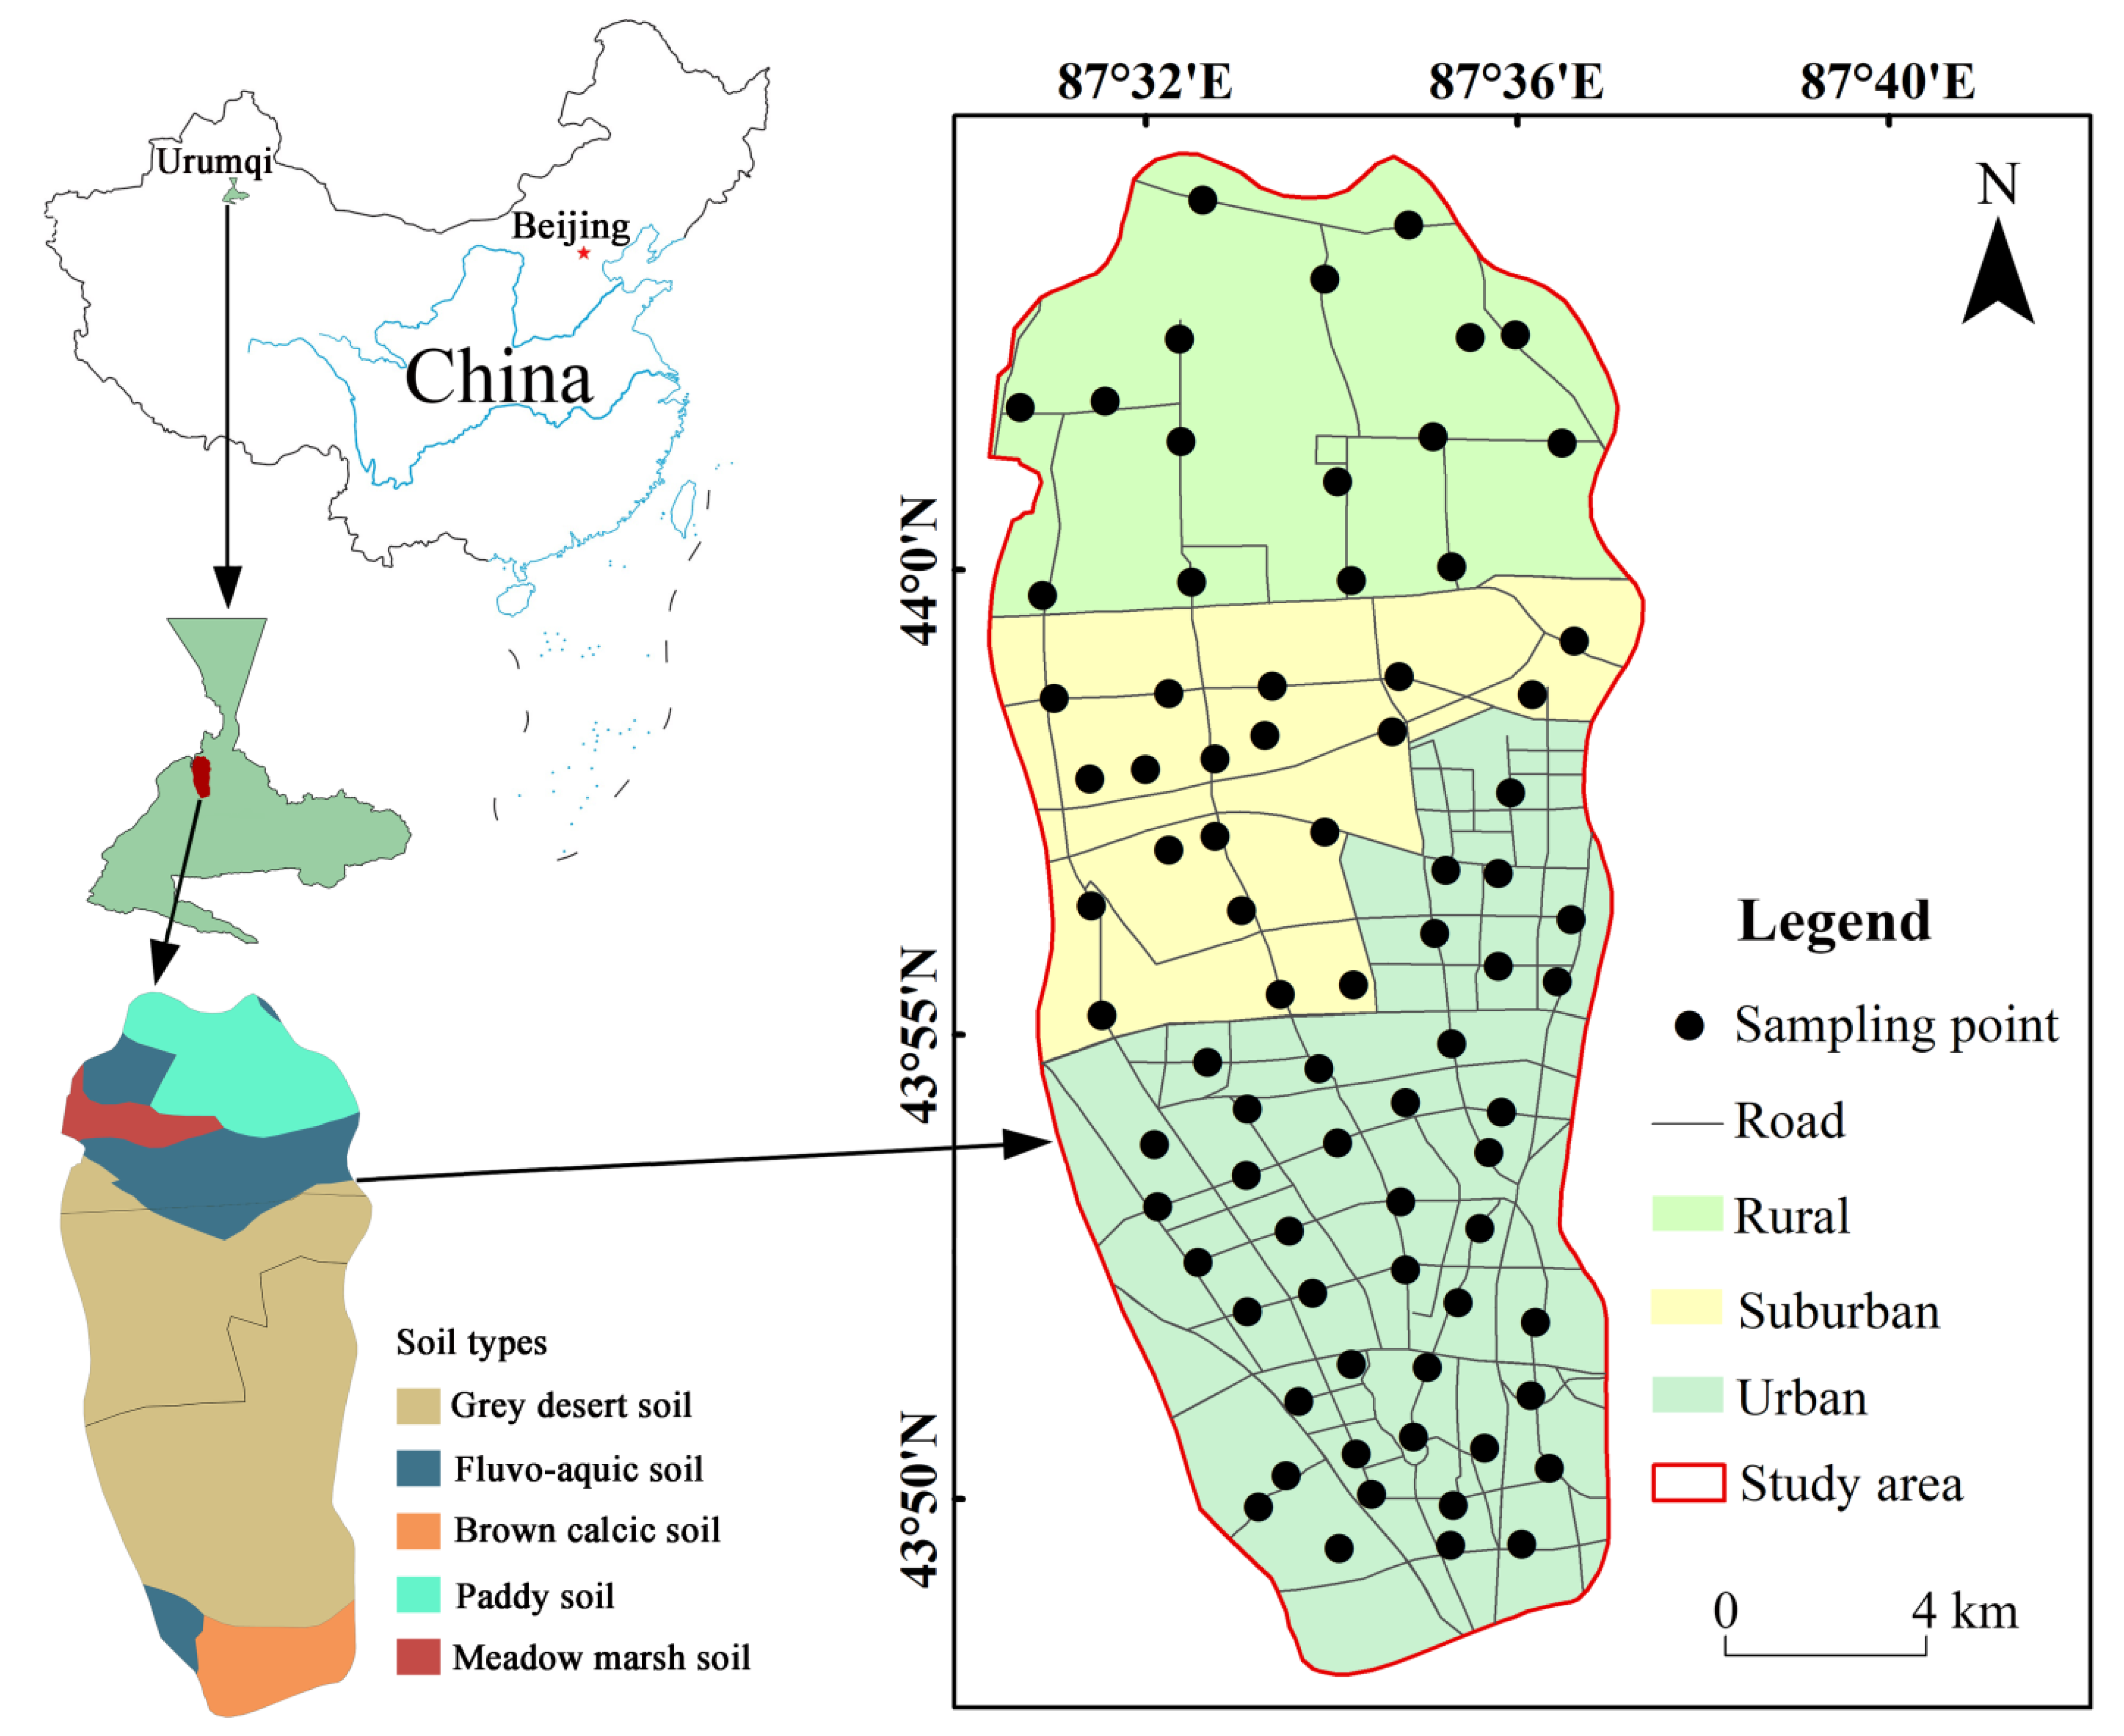
Figure 1. Map of the study area and sampling points.
Sustainability 14 12646 g001
Figure 2. Spatial distribution of the Pi and NPI values of trace elements in the soil.
Sustainability 14 12646 g002aSustainability 14 12646 g002b
Figure 3. Spatial distribution of the non-carcinogenic risk (HI) of trace elements in the soil.
Sustainability 14 12646 g003
Figure 4. Spatial distribution of the carcinogenic risk (TCR) of trace elements in soil.
Sustainability 14 12646 g004
Table 1. The exposure parameters used to estimate CDI.
FactorMeaning and UnitsValues
AdultChildren
IngRDust ingestion rate (mg/d)100200
InhRDust inhalation rate (m3/d)207.65
CFUnit conversion factor (kg/mg)1 × 10−61 × 10−6
EFExposure frequency (d/a)350350
EDExposure duration (year)246
SAExposed skin area (cm2)0.1530.086
AFSkin adherence factor (mg/cm2/d)0.490.65
ABSDermal absorption factor (unitless)0.0010.001
PEFParticle emission factor (m3/kg)1.36 × 1091.36 × 109
BWAverage body weight (kg)56.815.9
ATncAverage exposure time for non-carcinogens (d)ED × 365ED × 365
ATcaAverage exposure time for carcinogens (d)70 × 36570 × 365
Table 2. The RfD and SF values of non-carcinogenic and carcinogenic trace elements.
ElementsRfDSF
IngestInhaleDermalIngestInhaleDermal
As0.00030.300.0001231.5015.103.66
Cd0.0010.0010.000016.106.30/
Ni0.020.02060.0054///
Pb0.00350.003520.000525///
Hg0.00030.00030.000024///
Cu0.0400.0400.012///
Zn0.300.300.06///
Table 3. Descriptive statistics of trace element concentrations in the soil at different gradients.
GradientsStatisticsAsCdNiPbHgCuZn
Urban
(n = 42)
Minimum (mg/kg)7.790.0714.004.000.2511.0042.0
Maximum (mg/kg)12.600.2429.0054.000.8761.50200.00
Average (mg/kg)10.360.1420.2115.860.5022.6568.79
Median (mg/kg)10.300.1420.0014.000.4521.7059.00
St.D (mg/kg)1.050.042.978.820.178.2131.99
CV0.100.290.150.560.340.360.47
Suburban
(n = 19)
Minimum (mg/kg)9.700.0811.08.00.2315.034.0
Maximum (mg/kg)12.700.2222.017.00.7527.1076.0
Average (mg/kg)10.680.1416.3711.950.4021.9753.16
Median (mg/kg)10.300.1216.012.00.3922.5052.0
St.D (mg/kg)0.860.052.542.010.153.0610.58
CV0.080.360.160.170.380.140.20
Rural
(n = 16)
Minimum (mg/kg)5.410.0810.07.00.2118.644.0
Maximum (mg/kg)16.600.2619.017.00.8037.5093.0
Average (mg/kg)9.180.1315.3111.560.4622.5755.69
Median (mg/kg)9.390.1316.012.00.4021.9052.0
St.D (mg/kg)2.650.052.732.250.214.4812.42
CV0.290.380.180.190.460.200.22
Background values in soil in Urumqi (mg/kg)9.990.2329.9014.100.07624.0064.20
Table 4. Statistics of the contamination levels of trace elements in soil in different gradients.
GradientsStatisticsPiNPI
AsCdNiPbHgCuZn
Urban (n = 42)Minimum0.780.300.470.283.330.460.652.46
Maximum1.261.040.973.8311.492.563.128.36
Average1.040.610.681.136.560.941.074.85
Suburban (n = 19)Minimum0.970.350.370.573.000.630.532.24
Maximum1.270.960.741.219.861.131.187.16
Average1.070.590.550.855.270.920.833.87
Rural (n = 16)Minimum0.540.350.330.502.820.780.692.12
Maximum1.661.130.641.2110.461.561.457.55
Average0.920.570.510.826.100.940.874.45
Table 5. The non-carcinogenic health risk of trace elements in soil in different gradients.
GradientElementHQingestHQinhaleHQdermalHQHI
AdultsChildrenAdultsChildrenAdultsChildrenAdultsChildrenAdultsChildren
Urban (n = 42)As5.83 × 10−24.17 × 10−18.58 × 10−91.17 × 10−81.07 × 10−12.84 × 10−11.65× 10−17.01× 10−10.261.02
Cd2.36 × 10−41.69 × 10−33.48 × 10−84.75 × 10−81.77 × 10−24.72 × 10−21.80× 10−24.89× 10⁻²
Ni1.71 × 10−31.22 × 10−22.44 × 10−73.33 × 10−74.74 × 10−31.26 × 10−26.44 × 10−32.48× 10⁻²
Pb7.65 × 10−35.47 × 10−21.12 × 10−61.53 × 10−63.82 × 10−21.02 × 10−14.59× 10−21.57× 10⁻¹
Hg2.80 × 10−32.00 × 10−24.12 × 10−75.64 × 10−72.63 × 10−27.00 × 10−22.91 × 10−29.00 × 10⁻²
Cu9.56 × 10−46.83 × 10−31.41 × 10−71.92 × 10−72.39 × 10−36.36 × 10−33.34 × 10−31.32 × 10⁻²
Zn3.87 × 10−42.77 × 10−35.69 × 10−87.78 × 10−81.45 × 10−33.86 × 10−31.84 × 10−36.63 × 10⁻³
Suburban (n = 19)As6.01 × 10−24.29 × 10−18.83 × 10−91.21 × 10−81.10 × 10−12.93 × 10−11.70 × 10−17.22 × 10−10.250.99
Cd2.30 × 10−41.64 × 10−32.85 × 10−84.62 × 10−81.72 × 10−24.59 × 10−21.75 × 10−24.76 × 10⁻²
Ni1.38 × 10−39.87 × 10−31.97 × 10−72.70 × 10−73.84 × 10−31.02 × 10−25.22 × 10−32.01 × 10⁻²
Pb5.76 × 10−34.12 × 10−28.43 × 10−71.15 × 10−62.88 × 10−27.67 × 10−23.46 × 10−21.18 × 10⁻¹
Hg2.25 × 10−31.61 × 10−23.32 × 10−74.53 × 10−72.11 × 10−25.63 × 10−22.34 × 10−27.24 × 10⁻²
Cu9.27 × 10−46.63 × 10−31.36 × 10−71.86 × 10−72.32 × 10−36.17 × 10−33.25 × 10−31.28 × 10⁻²
Zn2.99 × 10−42.14 × 10−34.40 × 10−86.01 × 10−81.12 × 10−32.99 × 10−31.42 × 10−35.12 × 10⁻³
Rural (n = 16)As5.17 × 10−23.69 × 10−17.60 × 10−91.04 × 10−89.45 × 10−22.52 × 10−11.46 × 10−16.21 × 10−10.230.90
Cd2.22 × 10−41.58 × 10−33.26 × 10−84.45 × 10−81.66 × 10−24.42 × 10−21.68 × 10−24.58 × 10⁻²
Ni1.29 × 10−39.23 × 10−31.85 × 10−72.52 × 10−73.59 × 10−39.56 × 10−34.88 × 10−31.88 × 10⁻²
Pb5.58 × 10−33.98 × 10−28.16 × 10−71.11 × 10−62.79 × 10−27.42 × 10−23.35 × 10−21.14 × 10⁻¹
Hg2.61 × 10−31.86 × 10−23.84 × 10−75.24 × 10−72.44 × 10−26.51 × 10−22.71 × 10−28.38 × 10⁻²
Cu9.53 × 10−46.81 × 10−31.40 × 10−71.91 × 10−72.38 × 10−36.34 × 10−33.33 × 10−31.31 × 10⁻²
Zn3.13 × 10−42.24 × 10−34.61 × 10−86.30 × 10−81.17 × 10−33.13 × 10−31.49 × 10−35.37 × 10⁻³
Table 6. The carcinogenic health risks of trace elements in the soil in different gradients.
GradientElementCRingestCRinhaleCRdermalCRTCR
AdultsChildrenAdultsChildrenAdultsChildrenAdultsChildrenAdultsChildren
Urban (n = 42)As9.00 × 10−61.61 × 10−51.33 × 10−84.55 × 10−91.65 × 10−51.10 × 10−52.55 × 10−52.70 × 10−52.60 × 10−52.79 × 10⁻⁵
Cd4.94 × 10−78.83 × 10−77.51 × 10−112.56 × 10⁻¹¹//4.94 × 10−78.83 × 10−7
Suburban (n = 19)As9.27 × 10−61.66 × 10−51.37 × 10−84.69 × 10−91.70 × 10−51.13 × 10−52.62 × 10−52.79 × 10−52.66 × 10−52.88 × 10⁻⁵
Cd4.81 × 10−78.59 × 10−77.31 × 10−112.50 × 10⁻¹¹//4.05 × 10−78.59 × 10−7
Rural (n = 16)As7.97 × 10−61.42 × 10−58.48 × 10−92.90 × 10−95.29 × 10−131.16 × 10−67.98 × 10−61.54 × 10−58.44 × 10−61.62 × 10⁻⁵
Cd4.63 × 10−78.28 × 10−75.06 × 10−111.73 × 10⁻¹¹//4.63 × 10−78.28 × 10−7
Publisher’s Note: MDPI stays neutral with regard to jurisdictional claims in published maps and institutional affiliations.