1. Introduction
With the continuous optimization and upgrading of China’s industrial infrastructure, the service-oriented tertiary industry has become the industry with the highest output value and the most employees in China, adding new impetus to its high-quality economic development. For the service industry, against the background of increasing economic globalization and the deepening regional division of labor, spatial agglomeration is an important route of continuous development and expansion. As the most active spatial configuration leading China’s economic development, urban agglomeration is a key platform to promote the agglomeration and development of the service industry, especially the producer service industry. The Yangtze River Delta urban agglomeration, with Shanghai as its center and Nanjing, Hangzhou, and Hefei as its sub-centers, is one of the regions with the most dynamic economy, the highest degree of openness, the strongest innovation capacity, the largest number of migrants, and the densest high-speed rail network in China [
1,
2]. It plays a pivotal strategic role in the construction of the all-round opening pattern. The Yangtze River Delta urban agglomeration has a relatively complete service industry system, especially in regard to its producer service industry system. In 2020, the service industry in the Yangtze River Delta urban agglomeration accounted for far more of the GDP than other industries, and the proportion of the added value of the whole service industry supplied by producer services increased steadily. The agglomeration development of producer services in urban agglomerations is conducive to promoting resource integration and cultivating advantageous industries in cities to enhance the competitiveness of urban agglomerations and to promote the high-quality development of regional economies [
3,
4].
The comprehensive three-dimensional transportation networks of urban agglomeration are closely related to regional development [
5]. The planning and layout of a comprehensive transportation network determines the morphological changes and development path of urban agglomeration to a certain extent [
6]. In the past decade, the construction of the high-speed railway network in the Yangtze River Delta with spatiotemporal compression and networking effects has developed rapidly, representing significant achievements that have attracted the attention of the world. The comprehensive three-dimensional transportation network of the Yangtze River Delta urban agglomeration, with high-speed railways and expressways as the main framework, has taken its initial shape, and public transit operations have been implemented on the inter-city high-speed railways between the core cities of Shanghai and Nanjing, Shanghai and Hangzhou, and Hangzhou and Ningbo. With the prominent economic agglomeration effect and network connectivity of the transportation infrastructure in the Yangtze River Delta urban agglomeration, the accessibility between cities has gradually improved [
7], and the scale of travel has increased. The altered layout and division of labor of the production factors and productive forces within the urban agglomeration, and the adjustment of the industrial structure and spatial layout have triggered large-scale cross-city commuting, business travel, private travel, and other normalized travel demands. Alterations to the division of labor and the cooperative operation of passenger transport hubs in urban agglomerations also introduce external travel demands for inter-city hub transfer. The development of transportation integration in the Yangtze River Delta urban agglomeration has had a profoundly positive impact on the evolution of an integrated Yangtze River Delta as well as on China’s regional economic development pattern and industrial spatial layout.
Does the development of transportation integration in urban agglomerations promote the agglomeration of the service industries in these areas? Furthermore, what is the mechanism of action behind this? The answers to the above questions have great theoretical significance in regard to the supporting, guiding, and promoting roles of comprehensive three-dimensional transportation networks in urban agglomerations, which promote the agglomeration of service industries and thus encourage the high-quality development of these areas. Against the background of the new development pattern, evaluating the integrated development of transportation in the Yangtze River Delta urban agglomeration and empirically exploring the supporting role played by the high-speed transportation network in relation to the industries in this area are conducive to deepening our understanding of transportation networks in urban agglomerations, integrating core urban resources, and optimizing regional spatial order. This study has great practical significance in relation to the pilot task of building a powerful transportation system in our country and advancing the development of higher-quality integrated transportation in the Yangtze River Delta urban agglomeration.
In this paper, the Yangtze River Delta urban agglomeration was taken as the research area, and the land transportation infrastructure, mainly railways and highways, was taken as the research object. We examined the impact of transport infrastructure on service agglomeration from the perspective of land transport integration in urban agglomerations. The influence mechanism of urban agglomeration land transportation integration on service industry agglomeration was also studied. The rest of this paper is organized as follows. In
Section 2, we review the relevant literature and propose research hypotheses.
Section 3 introduces the research background, including the rapid development of land transportation infrastructure and the trend of service industry agglomeration in the Yangtze River Delta urban agglomeration.
Section 4 describes how we prepared the data and our methodology for empirical research.
Section 5 investigates the impact of urban agglomeration land transportation integration on service industry agglomeration in the Yangtze River Delta, examines the impact mechanism of urban agglomeration land transportation integration on service industry agglomeration, and reports our analysis results.
Section 6 discusses the model’s estimation results based on
Section 5.
Section 7 summarizes the main findings of the study and provides a conclusion. In the final section, we also discuss the contributions, impacts, limitations, and opportunities for future work in the topic under study.
2. Literature Review and Research Hypothesis
Industrial agglomeration refers to the phenomenon of some industries being concentrated in a specific area. The externality theory proposed by Marshall lays a theoretical foundation for the study of the causes of industrial agglomeration. His view is that the driving force of industrial agglomeration mainly reduces to three aspects: the skilled labor market, the input of intermediate products, and knowledge spillover [
8]. With the rise in a new economic geography, the theoretical research on industrial agglomeration has made a breakthrough. Krugman incorporated spatial factors such as “iceberg” transportation costs and increasing returns to scale into the framework of general equilibrium analysis and established the “center–periphery” model [
9], which further explains the formation motivation of industrial agglomeration. The industrial agglomeration theory, developed on the basis of urban economics theory [
10], holds that the expansion of city scale, on the one hand, is conducive to accelerating the transfer of labor force among industries; on the other hand, along with the increase in urbanization rate, it is conducive to the adjustment of industrial structure within the city and the realization of optimization and upgrading. These classical industrial agglomeration theories mainly take industry or manufacturing as the research object [
11]. However, the service industry and manufacturing industry have different industrial characteristics, and are engaged in different production activities, so these classical theories cannot be directly used to study the agglomeration of the service industry, especially the agglomeration of producer services.
In recent years, scholars have linked the agglomeration of the service industry with high-speed transportation networks, especially high-speed railway networks. From the perspective of the economic effect of high-speed railway networks, they have analyzed the factors leading to the agglomeration of the service industry and their effects [
12,
13]. At present, a large number of studies have confirmed that the high-speed transportation network, especially the “eight vertical and eight horizontal” high-speed railway network, has a significant impact on reshaping the spatial layout of China’s industrial economy [
14,
15]. A rapid transit network is a network that links together the city, as the track of urban agglomeration is becoming more and more refined, to enhance the degree of urban agglomeration of a high-speed railway network. As a result, urban agglomeration internal economic exchanges and cooperation between cities and regions would increase greatly, which is conducive to breaking market segmentation [
16] and expanding the size of the market, which will change the pattern of regional development. The opening of a high-speed railway has produced the “factor integration effect”, which makes the factor resources of producer services integrated and significantly improves the agglomeration degree of producer services.
Through a review of the existing literature, this paper finds that many scholars have conducted studies on the impact of transportation infrastructure on the agglomeration of service industries [
17]. However, most of these studies start from the perspective of transportation cost reduction [
18,
19] and transportation accessibility improvement [
20] caused by the development of a single transportation mode, and make empirical analyses using relevant data at the provincial and municipal levels.
At the same time, scholars believe that comprehensive three-dimensional transportation networks include railways, highways, water transport, civil aviation, and other transportation infrastructures, which are important foundations of modern comprehensive transportation systems [
21]. The transportation integration of urban agglomerations mainly includes planning integration, system and mechanism integration, basic network integration, transportation organization integration, and so on [
21,
22]. In terms of quantitative research, scholars have proposed a topology model of a physical network and a virtual network with “multi-network integration” covering railways and highways [
23], and constructed a comprehensive index reflecting the transportation infrastructure of urban agglomeration mainly through the entropy weight method [
5]. On the whole, research on the integration of urban agglomeration still lacks the analysis technology of integrated transportation.
From the perspective of transport integration, no consensus has been reached on the mechanism of service agglomeration induced by transport infrastructure in urban agglomerations, and the corresponding empirical tests have room for expansion. Therefore, based on the Yangtze River Delta urban agglomeration from 2011 to 2020, and 41 above-ground areas as well as the panel data of the city, using the spatial econometric method from the perspective of the integration of urban agglomeration land transportation, this paper studies the transportation network service industry agglomeration effect, to explore how the land transportation network here affects the mechanism of action of service development.
The spatiotemporal compression effect caused by the opening of high-speed railways in urban agglomerations can effectively shorten the spatiotemporal distance between urban agglomerations [
24], reduce inter-regional transportation costs, improve inter-regional accessibility [
20], and accelerate the circulation speed of production factors and resources. The trade between cities and the external radiation ability of producer service enterprises are continuously enhanced, thus expanding the local market scale, affecting the spatial location choice of enterprises, and promoting the agglomeration development of the regional producer service industry [
25]. To be specific, after the opening of the high-speed railway in the urban agglomeration, the transportation cost of service enterprises decreases, and at the same time, they have more choices of transportation modes to reach foreign markets. In terms of product production, enterprises in high-accessibility locations have more opportunities to communicate and cooperate with other markets, find better-quality inputs at lower costs to produce products, help producer service enterprises (which used to rely more on the size of the local market) reduce costs and increase efficiency, and continuously expand the market size [
2]. In terms of trade enterprises, enterprises can develop more frequent and faster trade activities, expand their spatial service scope, pay lower transport costs in sales to foreign markets and in providing various services to local and surrounding market customers, stimulate more market potential, encourage more potential producer services enterprises to become involved, and strengthen the agglomeration trend of the service industry in the urban agglomeration.
Hypothesis 1. The development of land transport integration in the Yangtze River Delta urban agglomeration has a certain inhibitory effect on the agglomeration of service industry, especially the producer service industry. This effect has regional heterogeneity.
According to traditional location theory and the new economic geography theory model, the location advantage is closely related to transportation costs and production factor costs [
26]. Producer service enterprises are mostly knowledge-intensive enterprises, which are highly dependent on knowledge information and human capital. Knowledge intensity, human capital level and labor cost are all important factors affecting the agglomeration of producer services. The rapid transit network expansion of urban agglomeration is conducive to expanding the scope of high-quality innovative talent districts, enlarging the radius of the innovation talent service, improving the labor supply and demand match, strengthening the talent links between the city [
27], and enhancing the competitiveness of cities while providing more face-to-face communication opportunities and routes of transmission of knowledge in the industry, so as to promote the development of producer service clusters. The free flow of a high-quality labor force in the urban agglomeration improves the frequency of talent interaction and promotes the flow and sharing of knowledge within the industry, thus improving the mutual learning and mutual imitation, inducing a knowledge spillover effect. Knowledge spillover is conducive to spreading highly personalized tacit knowledge based on experience; promoting knowledge exchange; strengthening regional advantages; and attracting tertiary industries with strong knowledge, such as the high-tech, financial, and cultural and creative industries. The improvement of the urban agglomeration transportation integration level reduces the inter-city temporal and spatial “distance”, strengthens the face-to-face communication between people, improves the interpersonal communication frequency [
28], reduces the cost of information, reduces barriers to information, improves the urban agglomeration of cross-regional enterprises, reduces obstructions to interpersonal information communication [
29], expands the scope of potential knowledge spillovers, and promotes the agglomeration of related industries.
Hypothesis 2. The integration of land transport in urban agglomeration affects the agglomeration of the service industry through the knowledge spillover effect caused by the improvement of accessibility, and the impact is heterogeneous.
3. Background
The urban agglomeration of the Yangtze River Delta, which includes Shanghai, Jiangsu, Zhejiang, and Anhui provinces, is one of the regions with the most dynamic economy, and it also has the highest degree of openness, the strongest innovation ability, and the largest absorption of foreign populations in China. It plays an important strategic role in the overall construction and all-round opening up pattern of China. In 2020, the land area of the Yangtze River Delta urban agglomeration was 358,000 square kilometers, accounting for 3.73% of the national land area. The permanent population was 235 million, accounting for 16.64% of the national population. According to
Table 1, the GDP of the Yangtze River Delta urban agglomeration in 2020 was CNY 24.47 trillion, accounting for 24.09% of the national GDP.
3.1. Transportation Development of Urban Agglomeration in the Yangtze River Delta
In 2011, the 1318 km Beijing–Shanghai high-speed railway opened, which was the first high-speed railway line in the Yangtze River Delta urban agglomeration. The Yangtze River Delta urban agglomeration had thus entered the era of high-speed rail. In 2020, the length of high-speed railway in operation in the Yangtze River Delta urban agglomeration was about 6100 km, and the density of high-speed railway was 170.39 km/10,000 square km—4.3 times that of the national high-speed railway density. The Yangtze River Delta urban agglomeration has the densest high-speed railway network in China. The Yangtze River Delta urban agglomeration initially developed a multi-center 0.5–3 h high-speed rail metropolitan circle, with Shanghai, Nanjing, and Hangzhou as the center.
In 2020, the highway mileage of the Yangtze River Delta urban agglomeration was 530,581 km, of which the mileages of expressways, primary roads, and secondary roads were 15,770 km, 29,822 km, and 51,912 km, respectively, accounting for 2.97%, 5.62%, and 21.96%, respectively, of the highway mileage of the Yangtze River Delta urban agglomeration. In other words, the highway mileage that was above grade II in the Yangtze River Delta urban agglomeration accounted for 30.55% of the highway mileage in the Yangtze River Delta urban agglomeration, or 2.26 times the national proportion. The spatial distributions of highway and expressway mileage in the Yangtze River Delta Urban agglomeration in 2020 are shown in
Figure 1 and
Figure 2.
In 2020, the road network density, expressway network density, and first-level highway network density of the Yangtze River Delta urban agglomeration were 1.48 km/square km, 440.50 km/10,000 square km and 833.02 km/10,000 square km, which are 2.73, 2.63, and 6.50 times the national road network density, expressway network density, and first-level highway network density, respectively.
The Yangtze River Delta urban agglomeration has essentially formed a network of five vertical and five horizontal expressways, including the Shanghai–Nanjing expressway, the Shanghai–Hangzhou expressway, and the Hangzhou–Ningbo expressway. From 2011 to 2020, the 1-h accessibility of all of the central cities of the Yangtze River Delta—Shanghai, Nanjing, Hangzhou, and Hefei—expanded.
According to
Table 2, from 2011 to 2020, road transportation was the most important mode of transportation in the Yangtze River Delta urban agglomeration. In 2020, the highway passenger volume in the Yangtze River Delta urban agglomeration accounted for 70.62% of the total passenger volume. In 2020, the highway freight volume of the Yangtze River Delta urban agglomeration accounted for 59.97% of the total freight volume.
3.2. Overview of Service Industry Development in Yangtze River Delta Urban Agglomeration
According to
Table 3, the GDP of the service industry in the Yangtze River Delta urban agglomeration was CNY 13,811.88 billion in 2020, accounting for 24.93% of the national total. That is 2.7 times the value in 2011. The service GDP of Shanghai was CNY 2,830.75 billion, accounting for 20.5% of the service GDP of the Yangtze River Delta urban agglomeration, which is 2.54 times that in 2011. The GDP of the service industry in Jiangsu Province was CNY 5,395.58 billion, accounting for 39.06% of the GDP of the Yangtze River Delta urban agglomeration, which is 2.59 times that in 2011. The GDP of the service industry in Zhejiang Province was CNY 360.32 billion, accounting for 26.09% of the GDP of the service industry in the Yangtze River Delta urban agglomeration, which is 2.54 times that in 2011. The GDP of Anhui’s service industry was CNY 1,982.43 billion, accounting for 14.35% of the GDP of the Yangtze River Delta urban agglomeration—3.98 times that in 2011.
4. Methods
4.1. Land Transportation Integration Evaluation Index System of Yangtze River Delta Urban Agglomeration
According to relevant studies, the transportation integration of urban agglomerations mainly includes the integration of planning, systems and mechanisms, as well as basic network and transportation organization [
21,
22]. Based on the analysis of the characteristics and functions of the highway and railway network transport capacity in the Yangtze River Delta urban agglomeration in
Section 3, and considering the influence of data availability, computability and other factors, we constructed an index system based on the integration of a basic network. We have studied the integrated development level of land transportation in the Yangtze River Delta urban agglomeration from the traffic network structure and traffic network function. Then, according to
Table 4, we chose corresponding indicators [
30].
Specific indicators are described as follows:
In-degree centrality and out-degree centrality are measured by degree centrality. The formula is
, where
is the degree of city
, which generally refers to the number of cities
with direct rail connections in this study. Degree centrality refers to the number of points directly connected to a specific point, and measures the central position of a node in the network. The higher the degree centrality, the more nodes that are directly connected to the point, and the more central the point is. When the connection has a given direction, degree centrality can be divided into in-degree centrality and out-degree centrality [
13].
The formula of eigenvector centrality is
, where
is the degree of city
[
13].
The formula of betweenness centrality is
, where
is the number of shortest paths between cities,
is the number of shortest paths through city
between city
and city
, and
refers to the mediations of city
relative to city
and city
[
13].
The formula of closeness centrality is
, where
is the shortest path length between city
and city
[
13].
Highway passenger capacity and highway freight volume can be obtained according to the statistical yearbook.
The formula of effective average travel time [
31] is
, where
is the shortest travel time between two cities based on the land transport network, and
is the economic quality of city
, which is measured by the square root of the product of the city’s GDP and population.
The formula of economic potential is , where is the shortest travel time between two cities based on the land transport network, and is the economic quality of city , which is measured by the square root of the product of the city’s GDP and population.
According to the actual situation of this study and the entropy weight method, the calculation steps of the transportation integration index of the Yangtze River Delta urban agglomeration are as follows:
First, all indicators need to be de-dimensionalized;
Then, we use the entropy weight method to assign weights to the traffic network structure index and the traffic network function index and calculate the traffic network structure index and the traffic network function index;
The weighted equalization method is used to calculate the traffic integration index. The weight of both the traffic network structure index and the traffic network function index is 0.5.
4.2. The Spatial Durbin Model for Hypothesis 1
The Spatial Durbin Model is set as follows:
where
is the spatial weight matrix,
is the spatial autocorrelation term of the dependent variable,
is the spatial autocorrelation term of the independent variable,
is the spatial lag coefficient of the dependent variable, and
is the spatial spillover effect of the independent variable, which refers to the influence of independent variables on dependent variables in neighboring areas.
The selected variables in this study are as follows:
Explained variable. The main indicators to measure the level of industrial agglomeration include location entropy, Herfindahl index and Gini coefficient, etc. Considering the availability and computability of statistical data, service industry location entropy (SE) is adopted in this study to reflect the degree of urban industrial agglomeration. The SE calculation formula is
, where
is the service industry GDP of city
in year
,
is the GDP of city
in year
,
is the national service industry GDP in year
, and
is the national GDP in year
. According to the requirements of the relevant state documents for service industry classification (
http://www.gov.cn/zhengce/content/2012-12/12/content_3943.htm, accessed on 31 December 2020) and the development of the Yangtze River Delta urban agglomeration’s producer service industries, we choose the wholesale and retail services (WH), transportation, warehousing and postal services (TR), information transmission, software and information technology services (In), scientific research and technical services (SC), finance (FI), and the leasing and commercial services industry (LE) as the area of research of producer service industries. To explore the producer service industries’ locational entropy, we take the wholesale and retail services (WH) as an example:
, where
is the number of people employed in the wholesale and retail services of city
in year
,
is the number of people employed in the producer service industries of city
in year
,
is the national number of people employed in the wholesale and retail services in year
, and
is the national number of people employed in producer service industries in year
.
Core explanatory variable. The urban agglomeration transportation integration level (TI) is the core explanatory variable, and its related definition and calculation formula are detailed in
Section 4.1.
Control variables. The control variables include government investment intensity (Fin), level of market size (Ma), level of labor (Wo), and level of foreign trade (Ex). In this study, these control variables are measured by the ratio of general public financial expenditure to GDP of each city, the ratio of total retail sales of consumer goods to GDP in each city, the value of labor force in each city, and the ratio of total export to GDP in each city [
32].
Spatial weight matrix. In this study, the geographical adjacency spatial weight matrix is constructed as follows:
[
33].
Then, we can obtain the Spatial Durbin Model [
34] for Hypothesis 1:
where
is measured by the above control variables.
The Spatial Durbin Model for producer service industries is as follows:
where
is the producer service industries’ locational entropy, and
is the three control variables.
4.3. The Spatial Durbin Model for Hypothesis 2
This section introduces variables to measure knowledge spillovers, to construct the spatial matrix of economic distance and the corresponding spatial econometric model, and to study the impact of knowledge spillovers caused by transportation integration in urban agglomeration on the agglomeration of service industries, in the context of Hypothesis 2. The model is as follows:
where
is the ratio of the research and experimental development funds of the whole society to the GDP of city
in year
. It is used to measure the level of knowledge spillover in cities in this study.
is the interaction term between transportation integration and knowledge spillover level.
and
will be used to reflect the impact of knowledge spillovers caused by local and foreign transport integration on local service industry agglomeration. The economic distance spatial weight matrix is constructed as follows:
, where
is the GDP of city
in year
.
4.4. Data Set
Railway time data. In terms of time scale, since the high-speed rail in the Yangtze River Delta urban agglomeration was rolled out year by year at the municipal level from 2011, and considering the impact of COVID-19, the time ranges of this study were selected as 2011–2019 and 2011–2020. The relevant data from the high-speed railway were partly derived from the National Railway Passenger Train Schedule from 2011 to 2016, and the railway time data from 2017 to 2020 were taken from the official website of the National Railway Corporation (
www.12306.cn, accessed from 1 January 2017 to 31 December 2020).
Road time data. The road time used came from the Baidu-related database.
Highway passenger capacity and highway freight volume were obtained from the Statistical Yearbook of Chinese Cities (2012–2021) and the statistical yearbook of provinces and cities.
Economic data. The economic data used were the economic data of 41 cities at the prefecture level or above from 2011 to 2020, all from the database of the National Bureau of Statistics, China Urban Statistical Yearbook (2012–2021) and the relevant provincial statistical yearbook from 2011 to 2020.
In order to eliminate the heteroscedasticity of the original data and to reduce the unsteadiness of the data, all data were logarithmically processed.
5. Results
5.1. Result of the Land Transportation Integration Index
According to the relevant statistical data, the structure index, the function index, and the transportation integration index of the transportation network in the Yangtze River Delta can be obtained through calculation, which can directly reflect the development level of the transportation integration of the Yangtze River Delta.
According to
Table 5, the transportation network structure index of the Yangtze River Delta urban agglomeration in 2020 was 0.5723, an increase of 8.16% compared with 2011. On the whole, the transportation network structure index of the Yangtze River Delta urban agglomeration showed an upward trend from 2011 to 2020. In 2019 and 2020, the transportation network function index of the Yangtze River Delta urban agglomeration was 0.3958 and 0.3742, respectively, showing a decrease of 5.45% in 2020 compared with 2019. On the whole, the transportation network function index of the Yangtze River Delta urban agglomeration showed a certain upward trend from 2011 to 2020.
In 2019 and 2020, the transportation integration index of the Yangtze River Delta urban agglomeration was 0.5871 and 0.5772, respectively, increasing by 4.17% and 2.14% compared with 2011. Due to the impact of COVID-19, passenger and cargo transportation in the Yangtze River Delta urban agglomeration in 2020 was impacted to a certain extent, but overall, the transportation integration index of the Yangtze River Delta urban agglomeration from 2011 to 2020 showed a certain upward trend.
According to
Table 6, Shanghai, Nanjing, Hangzhou, Xuzhou, Jiaxing, and Hefei were the top six cities in the Yangtze River Delta urban agglomeration in 2020 in terms of transportation network structure index. In 2020, Quzhou, Maanshan, Suqian, Yancheng, and Zhoushan ranked as the lowest five cities in the transportation network structure index of the Yangtze River Delta urban agglomeration.
In 2020, Shanghai, Suzhou, Hangzhou, Hefei, Ningbo, and Nanjing ranked as the top six cities in the transportation network function index of Yangtze River Delta urban agglomeration. In 2020, Tongling, Huangshan, Lishui, Huaibei, and Zhoushan ranked as the bottom five cities in the transportation network function index of the Yangtze River Delta urban agglomeration.
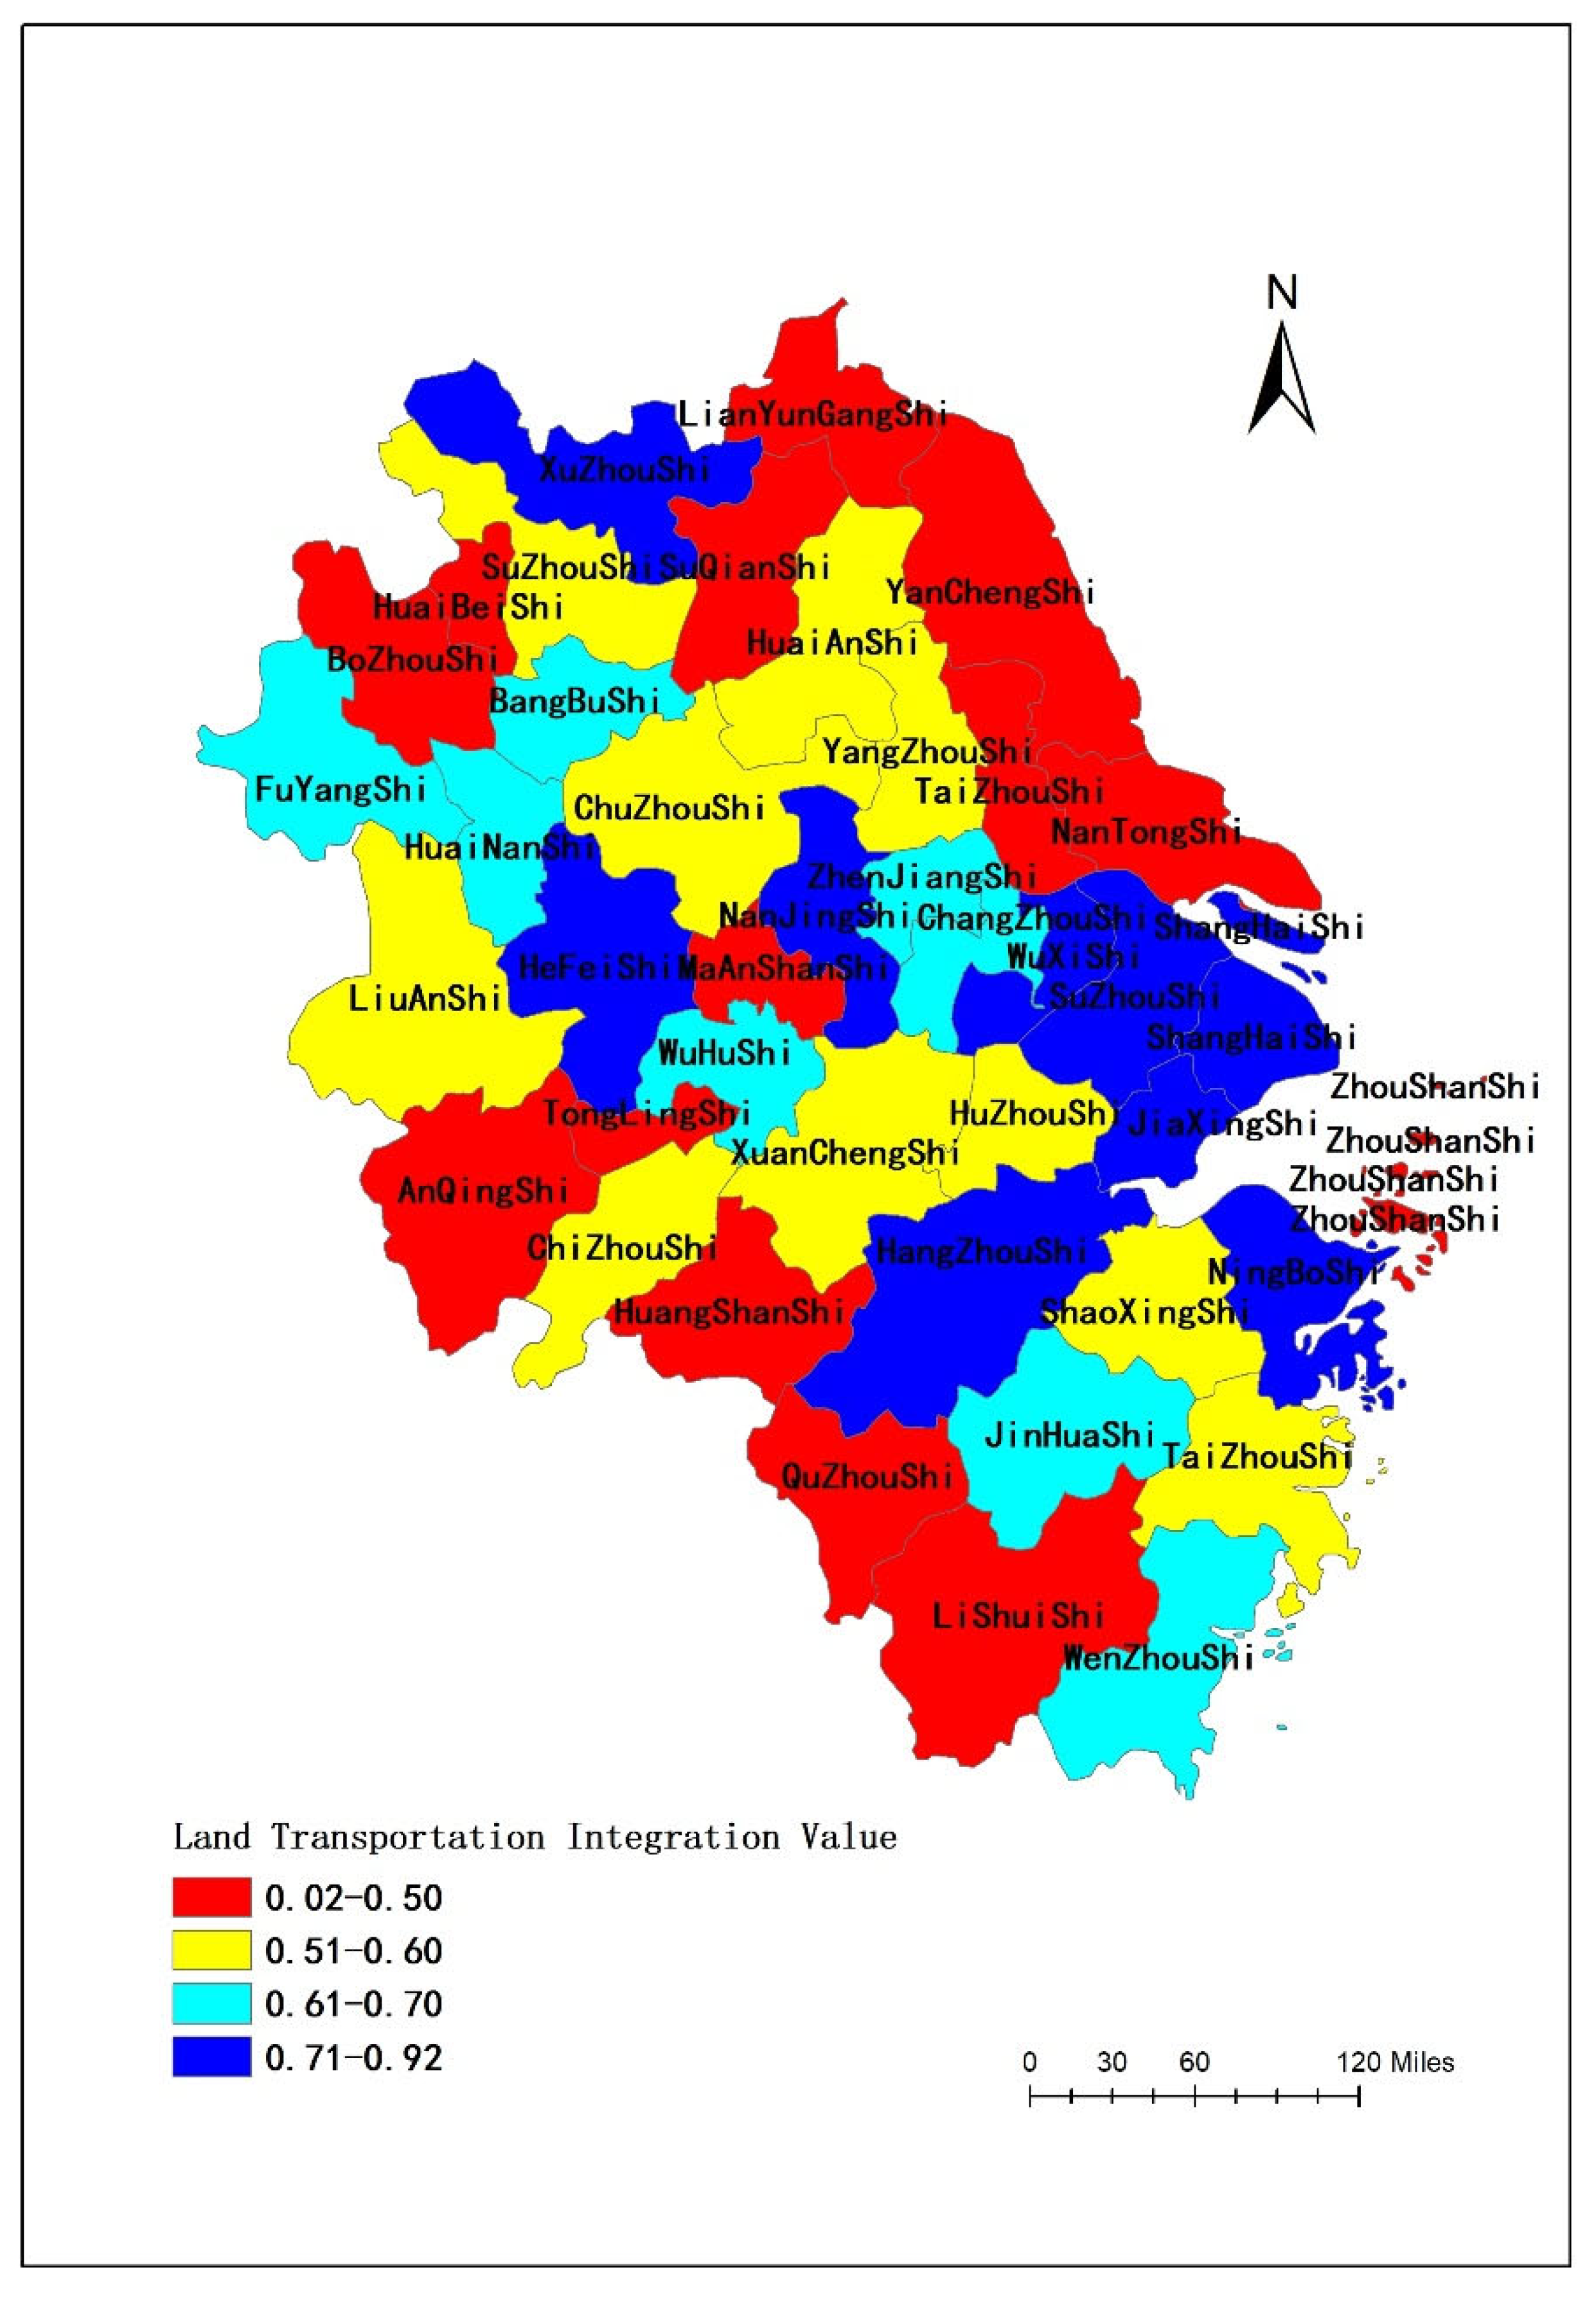
The spatial distributions of the transportation integration index value of the Yangtze River Delta urban agglomeration in 2020 are shown in
Figure 3. In 2020, the top five cities in terms of this value were Shanghai, Hangzhou, Hefei, Suzhou, and Nanjing. The cities with the lowest transportation integration index values in the Yangtze River Delta in 2020 were Huangshan, Huaibei, Yancheng, Suqian, and Zhoushan.
5.2. Result of the Spatial Durbin Model for Hypothesis 1
This section details the spatial autocorrelation analysis and LM test that was carried out on relevant data via Excel and R software to determine the spatial model (2). Then, R software was used for the spatial metering operation and case analysis.
This section first studies the impact of the integrated development level of transportation in the urban agglomeration on the agglomeration of the service industry as a whole and then further studies the impact of the integrated development level of transportation in the urban agglomeration on the agglomeration of different subsectors of the production line service industry.
5.2.1. Spatial Autocorrelation Test
This study first used the Moran index to test the spatial correlation of service industry location entropy in the Yangtze River Delta urban agglomeration as a whole, and the corresponding Moran index was thus obtained, as shown in
Table 7. As can be seen from the table, the Moran index of the service industry location entropy of urban agglomerations in the Yangtze River Delta from 2011 to 2018 was significant at the level of 10%, and the Moran index from 2019 to 2020 failed to pass the significance test, revealing that the industrial location entropy of urban agglomerations in the Yangtze River Delta from 2011 to 2020 had obvious spatial autocorrelation. Overall, the degree of spatial agglomeration of industrial location entropy in the Yangtze River Delta Urban agglomeration improved. The industrial location entropy of the urban agglomeration of the Yangtze River Delta was not completely random, but it was affected by the economic behaviors of other regions with similar spatial characteristics, revealing a certain phenomenon of agglomeration in geographical space. Therefore, in order to study and analyze the impact of transportation integration on industrial agglomeration in the Yangtze River Delta, the spatial factors should not be ignored.
5.2.2. LM Test
In this study, LM statistics and Robust LM statistics were tested on the corresponding spatial econometric models using R software.
According to
Table 8, based on the data of the Yangtze River Delta urban agglomeration from 2011 to 2020, the LM-ERR and LM-LAG tests both passed the significance test at the 10% level, indicating that the lag term and residual series of the dependent variable both had spatial autocorrelation. Furthermore, the Robust LM test was performed, and the results show that the Robust LM-ERR passed the significance test at the 10% level, while the Robust LM-LAG did not. Based on the data of the Yangtze River Delta urban agglomeration from 2011 to 2019, both LM-LAG and Robust LM-LAG passed the significance test at the 10% level, while neither LM-ERR nor Robust LM-ERR did.
In view of the above test results, this study adopted the Spatial Durbin Model (2) to study the impact of transportation integration on service industry agglomeration in urban agglomerations.
5.2.3. The Empirical Analysis
This section examines the impact of transportation integration in urban agglomerations on service industry agglomeration. Based on statistical data at the municipal level, 41 cities in urban agglomerations in the Yangtze River Delta were selected as research samples, and the spatial Durbin model (2) was used to conduct regression analyses from 2011 to 2019 and 2011 to 2020, considering the impact of COVID-19. The model estimation results are shown in the table below.
As
Table 9 suggests,
had ideal statistics, indicating that SDM can accurately reflect the spatial correlation between the transportation integration of urban agglomerations and service industry agglomeration. According to SDM’s spatial regression coefficient, the estimation results of
passed the test of significance, indicating that the service industry agglomeration of other cities plays an important role in the development of local service industry agglomeration. When the spatial effect was considered, the improvement of service industry agglomeration in neighboring regions had a positive spillover effect on service industry agglomeration in the region. By comparing the model estimation results of the two time periods, the statistical value of the period from 2011 to 2020 is larger than that of the period from 2011 to 2019. The results show that there is a strong spillover effect in geospatial or relatively developed areas of service industry. The results of the comparison between the two periods show that the impact of COVID-19 was actually negligible.
The estimation results of the TI of the two models are negative and fail to pass the significance test. The estimation results of the W*TI of the two models pass the significance test and are negative. This shows that, at the present stage, in the Yangtze River Delta urban agglomeration, the development of the integration level of local and foreign transportation has a certain inhibiting effect on the agglomeration of the local tertiary industry.
The estimated coefficients of Con and W*Con are both significantly positive. This indicates that the consumption market development in local and other regional markets has a significant role in promoting service industry agglomeration.
The estimated coefficients of Wo are all positive but failed to pass the significance test. The estimated coefficients of W*Wo are all negative and pass the significance test. This indicates that the increase in local labor force promotes the agglomeration of the local service industry to some extent, but it is not significant. The increase in labor force in other regions has a significant inhibitory effect on local service industry agglomeration.
The estimated coefficients of Fin are all significantly positive, and those of W*Fin are all significantly negative. This shows that the local tertiary industry agglomeration is significantly affected by local and other regional financial inputs, and the local financial input will significantly promote local tertiary industry agglomeration. The estimated coefficients of Ex are all significantly positive, while the estimated coefficients of W*Ex are negative and fail the significance test. This shows that the local foreign trade level has a significant positive impact on the local tertiary industry agglomeration, while the foreign trade level of other regions has a certain negative impact on the local tertiary industry agglomeration.
The impacts of transportation integration on the agglomeration of different producer services in the Yangtze River Delta urban agglomeration are different. According to
Table 10 and
Table 11, the empirical results show that the estimated TI coefficients of wholesale and retail trade, transportation, storage, and postal services are significantly positive, which means that the transportation integration of the Yangtze River Delta urban agglomeration has a significant promoting effect on the agglomeration of local wholesale and retail trade, transportation, storage, and postal services. The estimated coefficient of TI in the financial industry is positive and fails the significance test. The estimated TI coefficients of leasing and business services are significantly negative, while those of information transmission, software and information technology services, and scientific research and technology services are negative and fail to pass the significance test. The transportation integration of the Yangtze River Delta urban agglomeration has a restraining effect on the agglomeration of local leasing and business services, information transmission, software and information technology services, and scientific research and technology services to varying degrees.
According to
Table 11, the space regression coefficient estimation results of wholesale and retail trade, information transmission, software and information technology services, scientific research and technical services, finance, and leasing and business services show, through the test of significance level, that other cities of the industrial agglomeration play an important role in the development of local industry agglomeration.
5.3. Result of the Spatial Durbin Model for Hypothesis 2
5.3.1. Spatial Autocorrelation Test
According to
Table 12, the Moran index of the location entropy of the service industry in the Yangtze River Delta urban agglomeration from 2011 to 2016 is significant at the level of 10%, and the Moran index from 2017 to 2020 fails to pass the significance test, indicating that the location entropy of the service industry in the Yangtze River Delta urban agglomeration from 2011 to 2020 shows obvious spatial autocorrelation on the whole. Therefore, an SDM model based on the economic distance spatial matrix can be built for use in relevant research.
5.3.2. LM Test
According to
Table 13, both the LM-ERR and LM-LAG passed the significance test at the 10% level, indicating that the lag term and residual sequence of dependent variables are spatially autocorrelated. The results show that the Robust LM-Err passed the significance test at the 10% level, while the Robust LM-lag failed the significance test at the 10% level.
Considering the above test results, we adopted Spatial Durbin Models (5) and (6) to study the impact of transportation integration on industrial agglomeration in urban agglomerations.
5.3.3. The Empirical Analysis
In this study, 41 cities in the Yangtze River Delta urban agglomeration were taken as research samples, and the Spatial Durbin Models (5) and (6) were used for regression analysis. The model estimation results are shown in the table below.
According to
Table 14, knowledge spillovers caused by local transport integration have a positive impact on service industry agglomeration. The regression results show that, under the geographical adjacency matrix, the TI*RD term of model (5) has a positive impact at the 1% level, and the estimated coefficient of the TI*RD term of model (6) fails to pass the significance level test. According to the economic distance spatial matrix, the estimated coefficients of TI*RD pass the significance level test. Knowledge spillovers caused by transport integration in other regions have a negative impact on service industry agglomeration. The regression results show that the TI*RD terms are negative under the geographical adjacency matrix and economic matrix. Only model (6) under the geographical adjacency matrix passes the significance test at the 10% level.
The level of local knowledge spillover has a positive effect on service industry agglomeration. The regression results show that, under the geographical adjacency matrix and economic matrix, the estimated coefficient of RD term in model (5) has a positive impact at the 1% level, while the estimated coefficient of RD in model (6) fails to pass the significance level test. The effect of knowledge spillover level on service agglomeration in other regions is different. The regression results show that, under the geographical adjacency matrix, the W*RD term of model (5) has a positive influence at the 1% level, and the estimated coefficient of the W*RD term of model (6) is negative, which thus does not pass the significance level test. Under the economic matrix, the estimated coefficients of the W*RD terms are all significantly positive.
6. Discussion
The first experimental study shows that the transportation integration index of the Yangtze River Delta urban agglomeration shows an upward trend from 2011 to 2020, and the transportation network of the Yangtze River Delta urban agglomeration is being increasingly optimized. The total running time of high-speed railways and expressways in the Yangtze River Delta urban agglomeration has been shortened, and the frequency of high-speed trains and the traffic flow of expressways between Shanghai and Suzhou, Jiaxing, Nanjing and Suzhou, Danyang, Changzhou, Kunshan, and other cities have significantly increased, accelerating the flow of factors. In 2020, passenger and cargo transportation in the Yangtze River Delta urban agglomeration was affected by the COVID-19 epidemic to a certain extent. With the support of national policies, the transportation integration level of the Yangtze River Delta urban agglomeration has been improved, and the high-speed transportation network has manifested a time compression effect, forming an overall development pattern of linkage between core cities and daily communication around them.
The results of
Table 6 and
Figure 3 show that the transportation networks of urban agglomerations in the Yangtze River Delta mainly took “Shanghai–Nanjing–Hangzhou” as the core, and Suzhou and Hefei as the secondary cores in the periphery, presenting a multi-centered spatial structure. The level of transportation integration in the marginal regions of the Yangtze River Delta urban agglomeration is low. These regions need to accelerate the construction of relevant transportation infrastructure and improve regional accessibility to improve the quality of the integrated development of transportation in the Yangtze River Delta urban agglomeration.
The first model experiment focusing on Hypothesis 1 shows that the transportation integration level of the Yangtze River Delta urban agglomeration has been continuously improved via the promotion of various national policies, which has accelerated the flow of relevant factors, enabled the development of relevant enterprises to break through geographical restrictions and administrative barriers, promoted the formation of a service industry chain, and boosted the transformation and upgrading of the service industry in the Yangtze River Delta urban agglomeration. The service industries of different cities in the Yangtze River Delta urban agglomeration are highly connected and interdependent, showing a positive effect of mutual promotion.
The TI estimations indicate that the agglomeration of the service industry would produce a diffusion effect with the development of the integration of the Yangtze River Delta urban agglomeration. The supporting materials, talents, technology, capital, and other factors related to the service industry in the Yangtze River Delta urban agglomeration spread from the core cities to the surrounding cities through the transportation network of the urban agglomeration, promoting the diffusion and development of related industries and constantly expanding the boundary between industries and the urban agglomeration. At the same time, the relationships among industries and cities are becoming closer, which will further promote the deepening of the industrial division of labor in the urban agglomeration and the high-quality development of the economy.
The estimated coefficients of Con and W*Con indicate that the development of local and other regional consumer markets has contributed to the agglomeration of local service industries in the Yangtze River Delta urban agglomeration. On the one hand, the development of the local consumer market increases the market demand of the local service industry, thus promoting the development and agglomeration of the service industry. On the other hand, thanks to the convenient land transportation network of the Yangtze River Delta urban agglomeration, the service industries in the Yangtze River Delta learn from each other and thus improve the labor productivity of related industries, which also promotes the development of the local service industry.
The estimated coefficients of Wo and W*Wo indicate that the impact of local and other regional labor force changes on local service agglomeration is not consistent in the Yangtze River Delta urban agglomeration. The increase in local labor force will provide corresponding labor force for the development of the local service industry and promote its agglomeration. The increase in labor force in other regions will reduce the matched labor force required by local related industries and, thus, exert a certain inhibitory effect on the agglomeration of local service industries. At the same time, most service industries are knowledge- and technology-intensive enterprises, which need to invest a large amount of high-quality talent with abundant professional knowledge in the operation process. The increase in the amount of labor force does not represent an increase in the quantity of high-quality talent, so its impact on the agglomeration of local service industries is not significant.
The second model experiment focusing on Hypothesis 1 shows that wholesale and retail are the industries that are most closely related to the daily lives of residents and will gather with the agglomeration of consumers. The wholesale and retail industries are characterized by decentralized transactions, low turnover, and low relocation costs. The wholesale and retail industries are more affected by traffic conditions than other industries. The integrated development of transportation in the Yangtze River Delta urban agglomeration enables producers and consumers to flow more freely and promotes the agglomeration of wholesale, retail, and related supporting industries attracted by the huge potential consumer market. Local transportation, storage, and postal services have converged with the development of transportation infrastructure. The integrated development of transportation in the Yangtze River Delta has reduced the inter-regional transportation cost and promoted the trade between different regions. The financial demand brought by these trades has caused the financial human capital to accumulate in the core areas and promoted the financial industry agglomeration to a certain extent.
The estimation results of the spatial coefficient show that the development of the wholesale and retail industry, the information transmission, software and information technology services, the scientific research and technology services, the financial industry, and the leasing and business services have broken through the geographical restrictions and administrative barriers via the integrated development of transportation in the Yangtze River Delta urban agglomeration. This has made the upstream and downstream enterprises of different cities in the urban agglomeration interdependent and facilitated coordinated development.
The model experiments on Hypothesis 2 show that the development of transportation integration in urban agglomeration leads to a knowledge spillover effect, and local knowledge spillovers can drive and lead the development of the service industry. Relevant knowledge helps industries exploit the transportation network of the urban agglomeration to break through the geographical restrictions and spreads from the core cities to the surrounding cities, promoting the diffusion and development of relevant industries. The boundaries of industries are constantly expanding, and the service industry is being further encouraged to gather locally. The development of the service industry in the Yangtze River Delta urban agglomeration has entered the industry chain era. The extension of the industry chain is consistent with knowledge learning and the dissemination of scientific and technological innovation to a certain extent, which has a positive impact on the agglomeration of the service industry. All regions in the Yangtze River Delta urban agglomeration are vigorously promoting the transformation and upgrading of the service industry. The development of the service industry is moving it towards deep integration, and the industrial chain of related industries is gradually developing and improving, thus promoting the aggregation of related industries. At the same time, this kind of aggregation will also have a siphon effect on other cities in the urban agglomeration region.
7. Conclusions
From the perspective of transportation integration, this study explores the effects and mechanisms of transportation infrastructure on service industry agglomeration in urban agglomeration. This study selected the Yangtze River Delta urban agglomeration as the research area and, combined with the current situation of traffic development in the Yangtze River Delta urban agglomeration, constructed an index system of land transportation integration in the urban agglomeration and evaluated the current situation of land transportation integration in the Yangtze River Delta urban agglomeration. This study constructed spatial econometric models to quantitatively analyze the impact of transportation integration in urban agglomeration on service industry agglomeration and to explore the impact mechanisms of land transportation integration in urban agglomeration on service industry agglomeration.
The transportation integration index of the Yangtze River Delta urban agglomeration in 2019 and 2020 was 0.3937 and 0.3906, respectively—4.62% and 3.8% higher than that in 2011. In 2020, both passenger and freight transportation in the Yangtze River Delta urban agglomeration were affected by the COVID-19 epidemic. However, on the whole, the land transportation integration index of the Yangtze River Delta urban agglomeration showed an obvious upward trend from 2011 to 2020. The top five cities in the transportation integration index of the Yangtze River Delta urban agglomeration in 2020 were Shanghai, Hangzhou, Hefei, Suzhou, and Nanjing. This indicates that the transportation network of urban agglomerations in Yangtze River Delta mainly takes “Shanghai–Nanjing–Hangzhou” as the core, and Suzhou and Hefei as the secondary cores in the periphery, presenting a multi-center spatial structure. The cities with TI values in the Yangtze River Delta in 2020 were Huangshan, Huaibei, Yancheng, Suqian, and Zhoushan. These cities are located at the edges of Shanghai, Hangzhou, Nanjing, Hefei, and other metropolitan areas, and their transportation integration level is low.
The development of the local transport integration level has a certain inhibitory effect on the agglomeration of the local service industry. The development of transport integration in other regions has a significant impact on the agglomeration of local service industries. Considering the spatial effect, the improvement in the level of service industry agglomeration in neighboring regions has a positive spillover effect on the level of service industry agglomeration in the region. The comparison between the two periods shows that the impact of COVID-19 is negligible.
The impacts of land transportation integration on the agglomeration of different producer services in the Yangtze River Delta urban agglomeration are different. The transportation integration of the Yangtze River Delta urban agglomeration plays a significant role in promoting the agglomeration of the local wholesale and retail industry, as well as the transportation, storage, and postal industry. It inhibits the agglomeration of local rental and business services, information transmission, software and information technology services, and scientific research and technology services to varying degrees. The estimation results of the spatial regression coefficient indicate that the industrial agglomeration of wholesale and retail, information transmission, software and information technology services, scientific research and technology services, the financial industry, and leasing and business services in other cities has spillover effects on the development of related local industry agglomeration. Labor force and market size also have a significant impact on service agglomeration.
The integration of land transport in urban agglomeration affects the agglomeration of the service industry through the knowledge spillover effect caused by the improvement of accessibility, and the impact is heterogeneous. The knowledge spillover effect caused by local transportation integration can promote the agglomeration of local service industry to a certain extent. The knowledge spillover effect caused by transportation integration in other regions has a restraining effect on local service industry agglomeration to a certain extent.
The peripheral areas located near Shanghai, Hangzhou, Nanjing, Hefei, and other metropolitan areas urgently need to accelerate the construction of their transportation infrastructure to promote the higher-quality development of transportation in the Yangtze River Delta urban agglomeration.


