Article

Realization and Prediction of Ecological Restoration Potential of Vegetation in Karst Areas

1
Guangxi Institute of Meteorological Science, Nanning 530022, China
2
Guangxi Ecological Meteorology and Satellite Remote Sensing Center, Nanning 530001, China
3
College of Resources and Environmental Science, China Agricultural University, Beijing 100193, China
*
Author to whom correspondence should be addressed.
Devoted to the application of ecological remote sensing monitoring and evaluation.
Devoted to the research on ecological meteorology and environmental remote sensing.
Sustainability 2022, 14(19), 12525; https://doi.org/10.3390/su141912525
Submission received: 11 July 2022 / Revised: 5 August 2022 / Accepted: 23 September 2022 / Published: 30 September 2022
(This article belongs to the Section Environmental Sustainability and Applications)

Abstract

:
Based on the vegetation ecological quality index retrieved by satellite remote sensing in the karst areas of Guangxi in 2000–2019, the status of the ecological restoration of the vegetation and the influencing factors of the ecological restoration potential of the vegetation were analyzed. Then, habitats with a similar ecological restoration potential were categorized and the maximum ecological restoration potential of the vegetation was estimated. Finally, realization and prediction models of the ecological restoration potential of the vegetation were constructed to evaluate the realization degree and provide predictions. The quality of the ecological restoration was good in the study region, and the vegetation ecological quality index showed a fluctuating increasing trend. In the study region, 96.25%, 92.92%, 97.14%, and 99.07% of the total area was shown to have good ecological quality of the vegetation in 2000–2004, 2005–2009, 2010–2014, and 2015–2019, respectively. Terrain, soil, vegetation types, and climatic conditions had significant impacts on the ecological restoration of the vegetation. With the increase in the soil sand content, the changes in the vegetation ecological quality indexes were significant at altitudes of 200 m, 400 m, and 800 m and slopes of 15°, 25°, and 35°. The ecological restoration potential was the highest for forests, peaking at 87.5, followed by shrubs and grasses (87.4), and farmland (85.4). The partial and multiple correlations of the temperature, precipitation, and vegetation ecological quality index were significant, and the climate driving zones were divided into the strong driving zone of temperature and precipitation, temperature-dominated driving zone, precipitation-dominated driving zone, weak driving zone of temperature and precipitation, and non-climate driving zone. There was a high realization of the ecological restoration potential of the vegetation. The vegetation ecological quality in 97.95% of the area was restored, of which regions classified as maintaining growth, having slow growth, and having rapid growth accounted for 79.73%, 18.09%, and 0.13%, respectively, indicating that projects of rocky desertification control and ecological poverty alleviation were well implemented. In the future, the ecological restoration potential of the vegetation is predicted to be mainly low and medium. The areas with low potential are predicted to be mainly distributed in the north and southeast of Hechi, the northwest of Baise, and the west of Chongzuo, where the vegetation ecological quality and ecological restoration of the vegetation are predicted to be good, thus the restoration gap is predicted to be small. The areas with medium potential are predicted to be mainly distributed in the south of Hechi, the south of Baise, and the north of Chongzuo, where the vegetation ecological quality was restored well but further restoration could be beneficial. This research can provide technical support for future evaluations of the ecological restoration of vegetation, as well as construction, in the karst areas in the future.

1. Introduction

The ecological environment is essential for human development. Vegetation is important for the ecological environment and can reflect the quality of the regional ecological environment. Karst is the name given to the limestone plateau on the Istria of northwestern Yugoslavia, meaning a place where rocks are exposed. Karst areas are the most widely distributed region type in China and are concentrated in Guangxi, Guizhou, and Yunnan provinces. In the rest of the world, karsts are found mainly in the Dinara Mountains of Bosnia and Herzegovina, the Massif Central, the Russian Urals, southern Australia, the mid-eastern US, the Greater Antilles, and north-central Vietnam. In karst areas, vegetation mainly includes shrubs, brush, and grasslands. The land is barren with low-fertility soil and a fragile ecological environment, and soil and water conservation abilities are poor. Rocky desertification in karst areas caused by vegetation destruction has become a scientific, economic, and social problem, with difficulties comparable to northern desertification (desertification is land degradation in arid, semi-arid, and dry sub-humid areas caused by various factors including climate variability and human activities). Implementing ecological restoration and preventing the degradation of the ecosystem in karst areas plays a key role in maintaining ecological balance, protecting biodiversity, and promoting ecological poverty alleviation projects. Ecological restoration potential refers to the ability of a degraded ecosystem to restore according to certain targets and reflects the sustainable growth ability of vegetation in a region during the disturbance process and under purely natural conditions. Evaluations and predictions of the ecological restoration of vegetation in karst areas are vital for the optimization of control policies in karst areas.
Quantitative evaluation indicators and universal evaluation methods are key to the evaluation of vegetation restoration potential. Vegetation restoration in karst areas is a comprehensive project and its evaluation index system needs to consider the site conditions of the vegetation [1,2,3,4], soil physical and chemical properties [5,6], plant communities [7,8,9,10], and other factors. However, due to the differences in scholars’ professional backgrounds and research priorities, there are big differences between the established evaluation index systems. In view of the diversity and complexity of the indicators, previous studies have constructed complex indices, such as the community integrity index and vegetation quality index, which integrate multiple variables for evaluation. Multi-index comprehensive evaluation methods, such as the Delphi method, analytic hierarchy process (AHP), comprehensive index method, principal component analysis method, and fuzzy mathematics method, have been developed [11]. However, these multi-index comprehensive evaluation methods have defects in data subjectivity and balance in the steps of the index weightings and mathematical calculations [10]. The law of geographic regional differentiation [12] revealed that the distance between regions affects the degree of landscape differences. The academic community further confirmed [13] that local windows were theoretically smaller spatial units, and within these smaller spatial units, the climate, landforms, and geological structures, as well as some unknown environmental variables or environmental variables that were difficult to quantify, have the same (or similar) values. To avoid the risk of missing important variables, it is necessary to consider the variable indicators on a small scale and replace global models with local models.
With the development of “3S” technology (RS, GIS, and GPS), in view of the above problems, scholars [13,14,15] have proposed vegetation coverage based on remote sensing inversion and have used the similar habitat method to evaluate the ecological restoration potential of the vegetation. However, Qian Shuan et al. [16] pointed out that vegetation coverage or vegetation net primary productivity (NPP) can only reflect on one aspect, which is the function of the terrestrial index of ecosystem integrity and the ecological quality of vegetation indexes. Ji Yuhe et al. [17] also suggested that the ecological quality of vegetation index is a comprehensive reflection of the geographical distribution, productivity, and ecological services of vegetation. Therefore, results using only the vegetation coverage and vegetation NPP to evaluate the ecological restoration potential of the vegetation could be incomplete.
The diversity of the natural environment and the temporal and spatial differences of its influencing factors in karst areas have led to complex changes in the ecological environment of the vegetation in these areas, and the ecological restoration of the vegetation has been difficult. From the perspective of similar habitats, there is little detailed research on the realization and prediction of the ecological restoration potential of the vegetation based on comprehensive ecological remote sensing data in karst areas. Therefore, based on the vegetation coverage and net primary productivity data retrieved by satellite remote sensing in the karst areas of Guangxi in 2000–2019, a comprehensive vegetation ecological quality index was established to analyze the status of the ecological restoration of the vegetation and the influencing factors of the ecological restoration potential of the vegetation. GIS technology and geostatistical analysis methods were used to categorize habitats with similar ecological restoration potential and estimate the maximum ecological restoration potential of the vegetation. A similar habitat method was used to construct the realization and prediction models of the ecological restoration potential of the vegetation, calculate the realization degree of the ecological restoration potential of the vegetation, and predict the future ecological restoration potential of the vegetation. This study can provide technical support for the evaluation of the practical effects of the ecological restoration of the vegetation and provide a scientific basis for future ecological construction and soil erosion control in karst areas.

2. Data and Methods

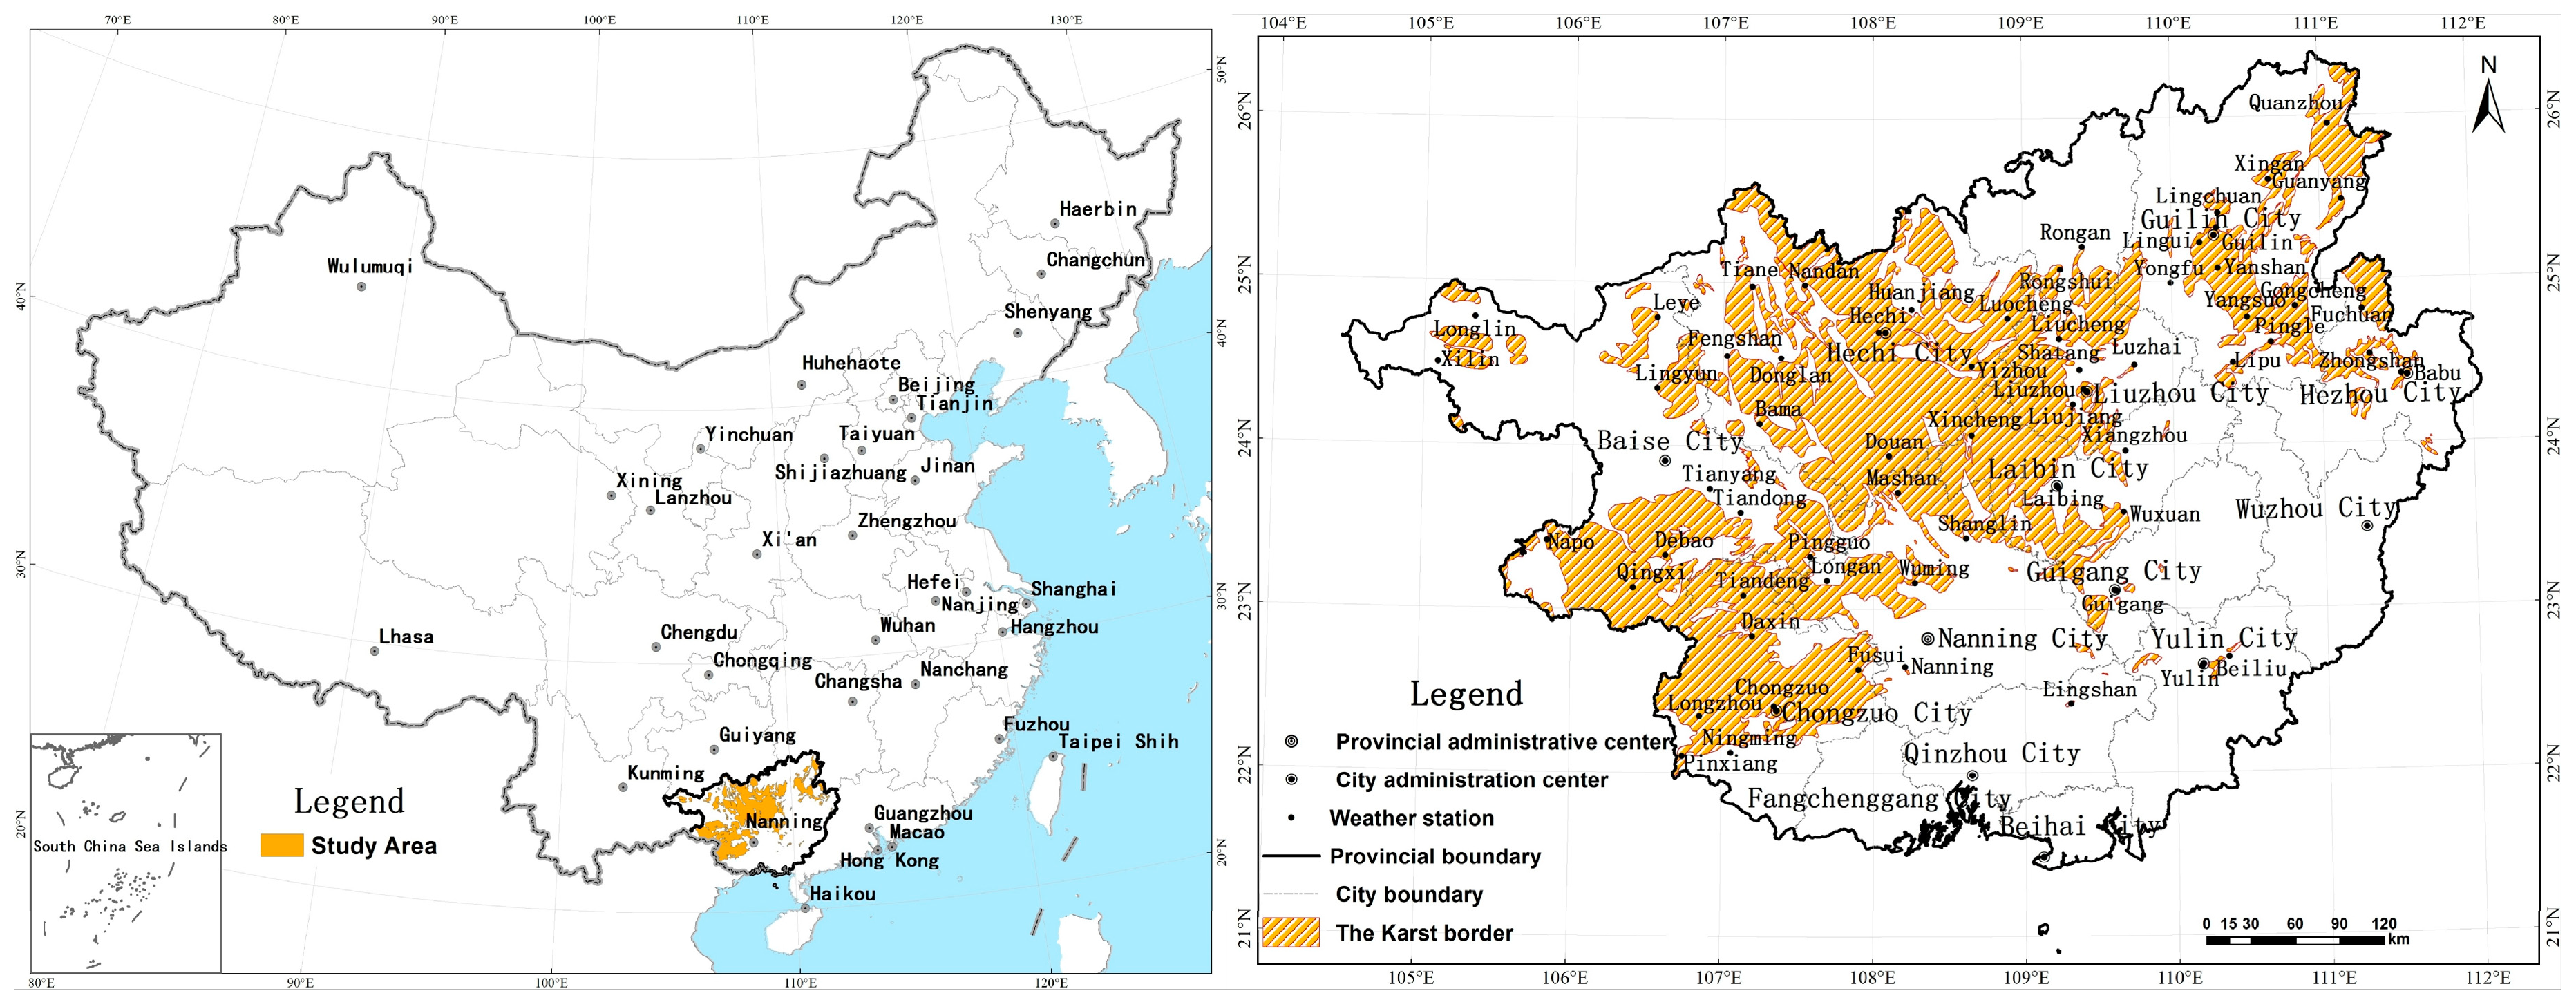
2.1. Overview of the Study Area

In the karst areas of Guangxi, karst landforms are typical and widely distributed, with a total area of 8.334 million hm2, accounting for 18.9% of the total area of karst land in southwestern China and 35.1% of the total land area in Guangxi. The study area (21°57′–26°06′ N and 105°02′–111°43′ E) mainly included Hechi, Baise, Guilin, Chongzuo, Nanning, and other mountainous areas. The landforms are mainly composed of peak-cluster depressions, peak-forest valleys, isolated peaks, and residual hills. The terrain slopes from the northwest to the southeast and forms the transition zone of the slope of the Yunnan-Guizhou Plateau, with an altitude of 30–1900 m. The vegetation mainly includes forests, shrubs and grasses, and farmland vegetation. Among them, forests include tropical rainforest evergreen broad-leaved forests, mid-subtropical typical evergreen broad-leaved forests, and south subtropical monsoonal evergreen broad-leaved forests The arbor species include Pinus massoniana Lamb., Cupressus funebris Endl., oaks, etc.; the shrubs include Rosa cymosa Tratt., Pyracantha fortuneana (Maxim.) Li, Bauhinia championii (Benth.) Benth., etc.; and the grasses are mainly ferns, Heteropogon contortus (Linn.) Beauv., Juncus effusus, and so on. The soil is mainly limestone soil, which is divided into black, brown, yellow, and red soil. It has a subtropical monsoon climate, with rain and heat events in the same period. The annual average temperature is 17–23 °C and the annual average precipitation is 1100–1500 mm, with uneven spatial and temporal distributions. Heavy rains and rainstorms occur frequently, which can easily lead to soil erosion, drought, floods, and other disasters, seriously affecting the ecological quality of the regional vegetation. The population accounts for about half of Guangxi’s total population, and its economy is relatively underdeveloped. It is an important area in Guangxi for ecological protection, ecological restoration, and control (Figure 1).

2.2. Data and Processing

The research data mainly included geographic information, meteorology, soil, vegetation types, vegetation ecological parameters, etc. All data were converted into raster format using GIS, with a spatial resolution of 250 m.

2.2.1. Geographic Information

The basic geographic information data were the data of the 1:250,000 Guangxi administrative boundary, administrative center, and karst area boundary provided by the Guangxi Meteorological Information Center. The Guangxi Digital Elevation Model (DEM) was obtained from the geospatial data cloud, with a spatial resolution of 30 m.

2.2.2. Meteorological Data

Meteorological data were from the Guangxi Meteorological Information Center, including the daily average temperature and precipitation of 62 meteorological stations in and around the karst areas of Guangxi from 2000 to 2019, and their monthly and annual averages were calculated. The inverse distance weighting method was used to interpolate to generate the 250 m × 250 m meteorological element raster data.

2.2.3. Soil Types

Soil data included soil types and textures from the Harmonized World Soil Database (HWSD), and the data of the soil types and textures in the karst areas of Guangxi were obtained through clipping and projection transformation.

2.2.4. Vegetation Types

Based on the Landsat8 OLI satellite remote sensing data, referring to the spectral characteristics of different types of vegetation, the remote sensing classification characteristic parameters of different types of vegetation were determined, and the maximum likelihood method [18], decision-tree layering, and other extraction methods were used to obtain the data of forests, shrubs and grasses, and farmland vegetation in the karst areas of Guangxi in 2019.

2.2.5. Vegetation Ecological Parameters

Based on the MODIS NDVI data set from 2000 to 2019, the maximum value composite (MVC) method was used to synthesize the monthly NDVI data, and the cubic spline interpolation method was used to process the cloud pollution pixels and reconstruct the high-quality NDVI data sequence. The pixel linear decomposition model [19] was used to calculate the fraction of vegetation coverage (FVC) in the karst areas of Guangxi from 2000 to 2019. Based on the principle of light energy utilization [20], the vegetation NPP was estimated using reconstructed high-quality NDVI data and surface meteorological observation data.

2.3. Data Analysis

According to the principle of “the more similar the vegetation, habitat is, the closer the vegetation ecological restoration is”, the information of the reference system was used to define the restoration goal, and the restoration potential was determined by measuring the “distance” between the degraded community and the reference community [21,22,23]. Firstly, based on the ecological parameters of the vegetation retrieved by satellite remote sensing, a comprehensive vegetation ecological quality index was constructed and the vegetation ecological quality index in the karst areas of Guangxi was calculated. Then, the correlation between the vegetation ecological quality index and factors such as the terrain, soil, and climate was analyzed, the influencing factors of the ecological restoration potential of the vegetation were clarified, and habitats with similar ecological restoration potential of the vegetation were categorized. Secondly, statistical methods were used to calculate the maximum of the vegetation ecological quality index in each habitat zone and determine the theoretical maximum ecological restoration potential of the vegetation in the different habitats. Finally, a similar habitat method was used to establish the realization and prediction models of the ecological restoration of the vegetation, calculate the realization degree of the ecological restoration potential of the vegetation, and predict the future ecological restoration potential of the vegetation (Figure 2).

2.3.1. Vegetation Ecological Quality Index

Based on the vegetation coverage and net primary productivity, the weighted method was used to construct the vegetation ecological quality index [16]. The formula is as follows:
Q i = 100 ( f 1 × N P P i N P P m + f 2 × F V C i )
where Qi is the vegetation ecological quality index in the ith year; FVCi is the monthly average vegetation coverage in the ith year; NPPi is the vegetation NPP in the ith year; NPPm is the historically highest value of the annual vegetation NPP, namely the annual vegetation NPP under the best climatic conditions in the corresponding time period within a spatial region; and f1 and f2 are the weight coefficients (f1 = 0.5, f2 = 0.5).
The studied years, from 2000 to 2019, were divided into four periods, T1 (2000–2004), T2 (2005–2009), T3 (2010–2014), and T4 (2015–2019). The average vegetation ecological quality index in the different periods was calculated to analyze the status of the ecological restoration of the vegetation.

2.3.2. Analysis Method of the Influencing Factors of Ecological Restoration of Vegetation

Using GIS technology, the spatial distribution map of the vegetation ecological quality index in each period corresponded to the terrain elevation map and slope map. The step length of the elevation was 10 m, and the step length of the slope was 1°. The average of the vegetation ecological quality index in each period at 10 m and 1° intervals was calculated to analyze the impact of the terrain conditions on the vegetation ecological quality. Similarly, the spatial distribution map of the vegetation ecological quality index corresponded to the soil type and texture maps, and the average vegetation ecological quality index for each soil type and texture in each period was calculated to analyze the effects of the soil conditions on the vegetation ecological quality. Based on the annual average vegetation ecological quality and temperature and precipitation data, the correlation between the interannual changes in vegetation ecological quality and the various climatic factors based on the pixel scale was analyzed, and the significance of the climate impact on the vegetation ecological changes was divided. The pixel-based partial correlation and multiple correlation analysis methods [24] were used to explore the effects of temperature and precipitation on the changes in the vegetation ecological quality. The significance of the partial correlation coefficient and multiple correlation coefficient was tested using the t and F tests. According to results from Cao [25], if the correlation coefficient between two elements passes the significance test at the 0.05 level, the correlation between the two elements is significant; if the correlation coefficient passes the significance test at the 0.01 level, the correlation is extremely significant.

2.3.3. Calculation Method for the Maximum Ecological Restoration Potential of the Vegetation

Based on the influencing factors of the ecological restoration of the vegetation, habitats with similar ecological restoration potential were categorized, and the average, 90th percentile, 95th percentile, and maximum of the multi-year vegetation ecological quality index in each zone were calculated. According to the principle of “similar habitats”, the vegetation ecological quality under similar habitat conditions should be similar and the maximum ecological restoration potential of the vegetation could be determined. The formula of percentile is as follows:
p p = L p + p 100 × N F p f × i
where Pp is the percentile; N is the total frequency; Lp is the lower limit of the percentile group; n is the sum of the frequency of the percentile group; f is the frequency of the group; Fp is the cumulative frequency of groups less than Lp; and i is the distance between groups.

2.3.4. Realization and Prediction Models of Ecological Restoration Potential of Vegetation

Based on the theory of similar habitats, the ratio and difference between the actual value of the vegetation ecological quality index and the theoretical maximum potential value were used to construct the realization and prediction models of the ecological restoration potential of the vegetation. The formulas are as follows:
Q R i = Q i Q max
Q P i = Q max Q i Q max
where QRi is the realization degree of the ecological restoration potential of the vegetation in the ith year; QPi is the prediction index of the ecological restoration potential of the vegetation in the ith year; Qi is the current vegetation ecological quality index in the ith year; and Qmax is the maximum ecological restoration potential of the vegetation. In our study, the future ecological restoration potential of the vegetation was predicted based on the current vegetation ecological quality index in 2020. The closer the vegetation restoration potential index is to 1, the lower the vegetation ecological quality at a certain time, and the larger the future vegetation ecological restoration space; if the index is close to 0, the regional vegetation ecological restoration is close to the upper limit.

3. Results

3.1. Status of Ecological Restoration of Vegetation in the Karst Areas of Guangxi

In the karst areas of Guangxi, the vegetation ecological quality index ranged from 50 to 80, showing a fluctuating increasing trend from 2000 to 2019, with an annual growth rate of 0.47, and the condition of the ecological restoration of the vegetation was good (Figure 3). According to the actual situation of the vegetation ecological quality in the studied area, as well as the classification of meteorological industry standard grades in the Grade of Monitoring and Evaluating for Terrestrial Vegetation Meteorology and Ecological Quality (QX/T 494-2019) [26], the indicators of the monitoring and evaluation of the vegetation ecological quality in the karst areas of Guangxi were determined (Table 1).
From 2000 to 2004, the vegetation ecological quality was normal, better, or good in 96.25% of the total studied area, mainly distributed in the northwest of Hechi, the middle of Liuzhou, and the north of Chongzuo (Table 1 and Figure 4). Compared with 2000–2004, the overall vegetation ecological quality decreased slightly during 2005–2009 due to the influence of natural disasters (drought, snow), and the vegetation ecological quality was normal, better, or good in 92.92% of the total area, mainly distributed in the south of Baise and the north of Chongzuo. There was a severe drought in the karst areas of Guangxi in 2004, 2005, 2006, and 2009 [27]. They also suffered from the historically rare cold rain and snow freezing event, a large number of trees were damaged, and the ecological environment was seriously affected at the beginning of 2008 [28]. From 2010 to 2014, the vegetation ecological quality gradually recovered and was normal, better, or good in 97.14% of the total area, mainly distributed in the west and north of Hechi, the south of Baise, and the north of Chongzuo. During 2015–2019, the vegetation ecological quality was normal, better, or good in 99.07% of the total area, among which the proportions of better and good vegetation ecological quality were 42.21% and 49.80%, and most of the vegetation ecological quality tended to be better.

3.2. Influencing Factors of Ecological Restoration of Vegetation in the Karst Areas of Guangxi

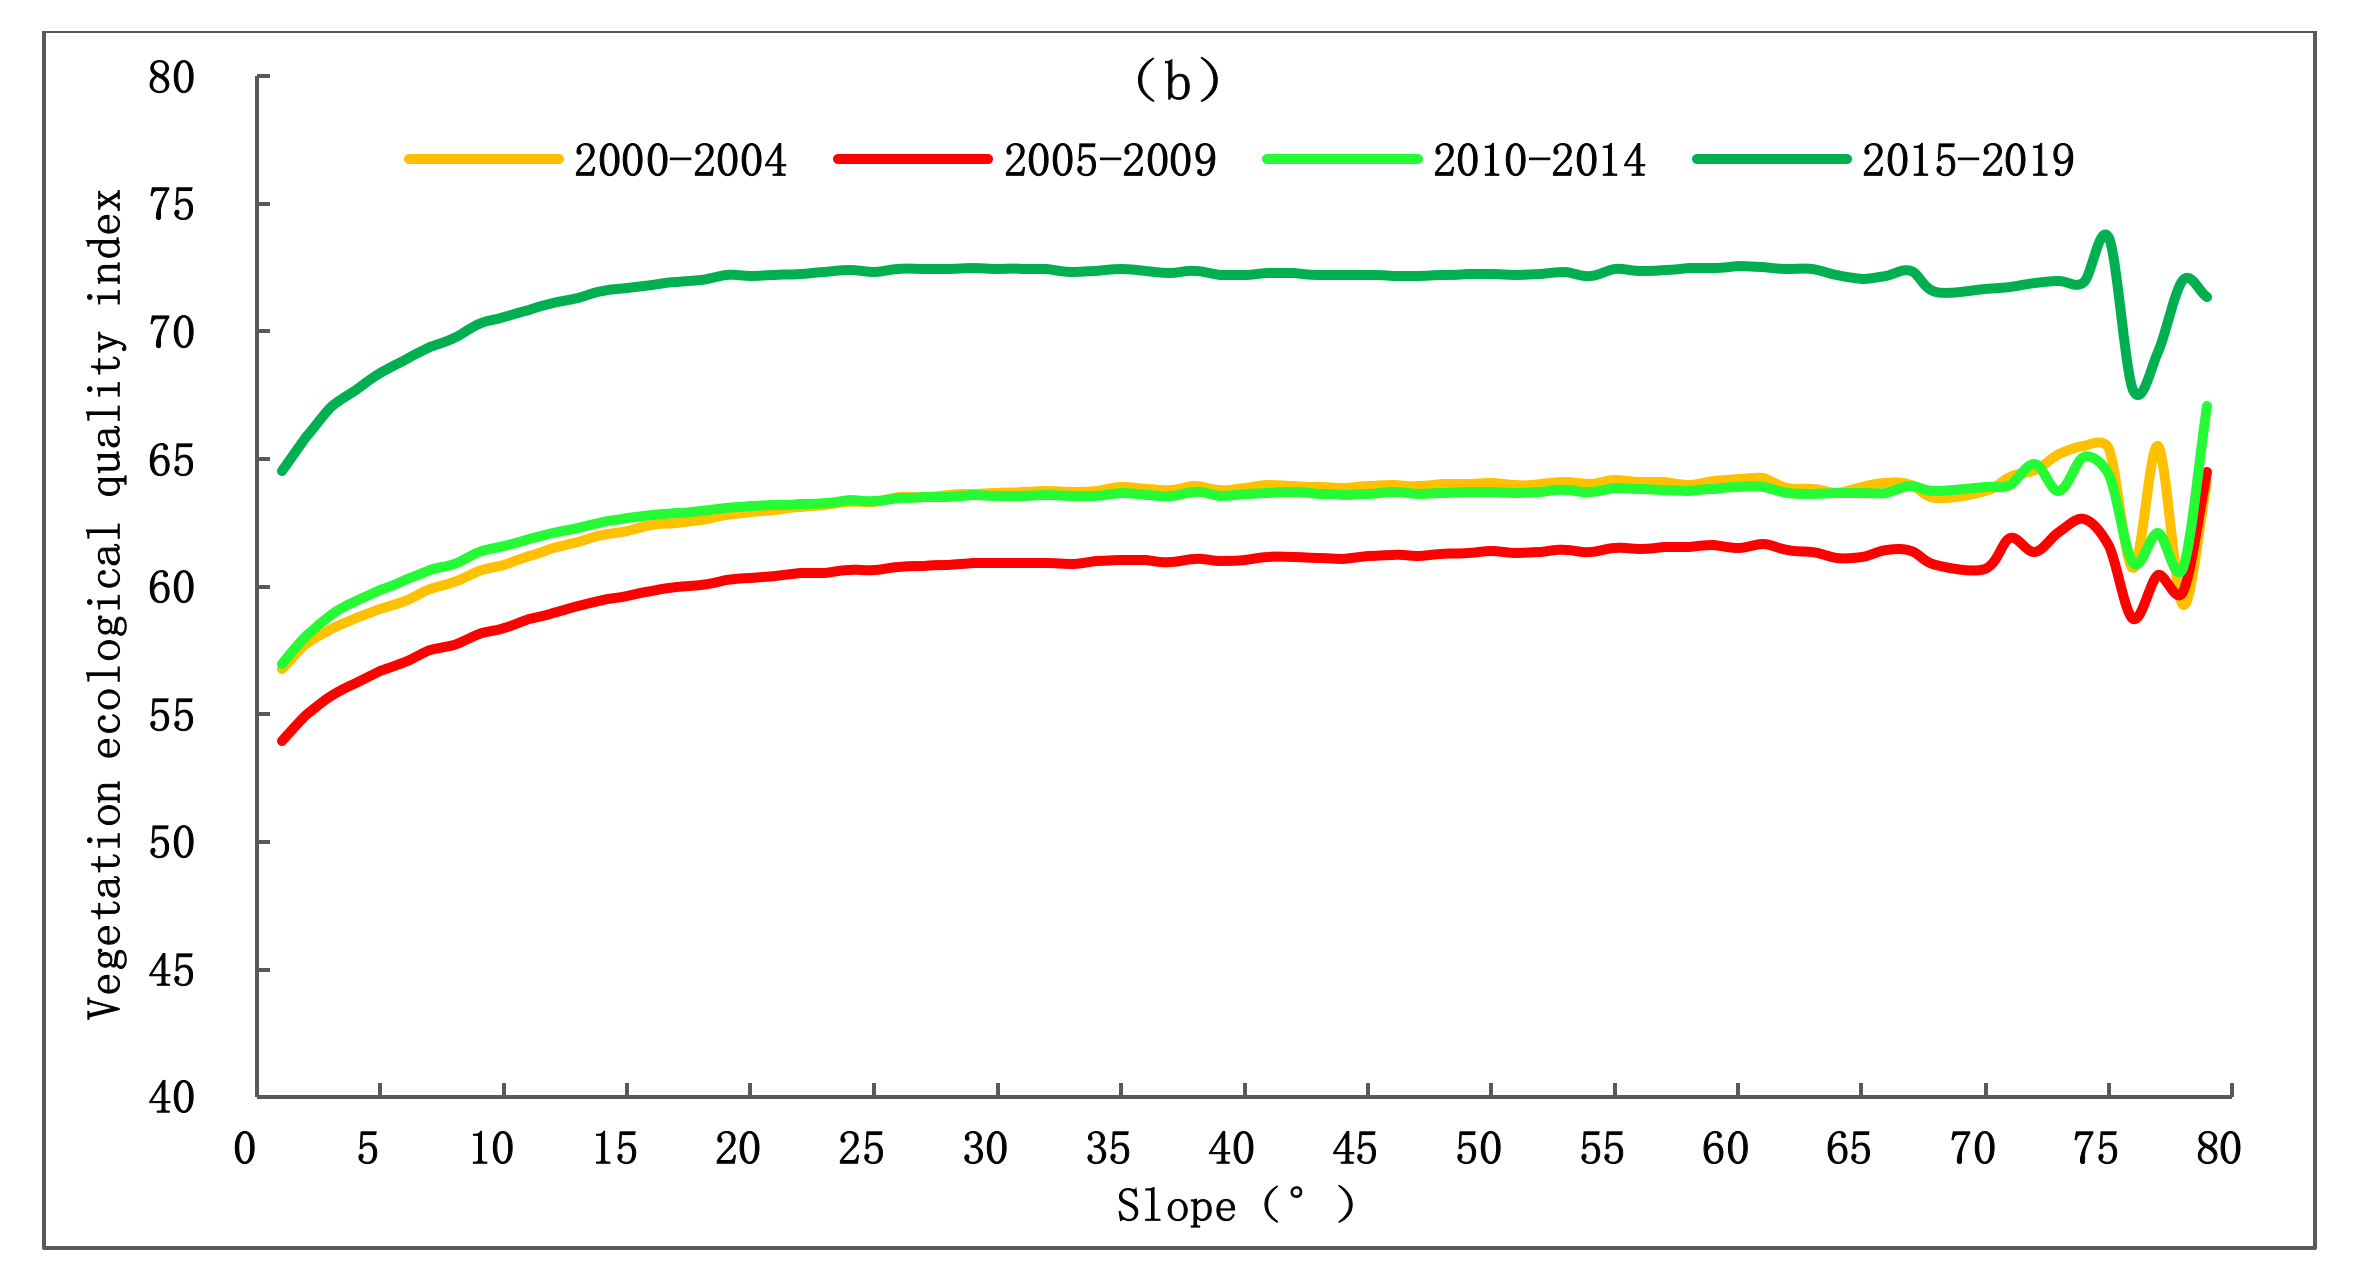
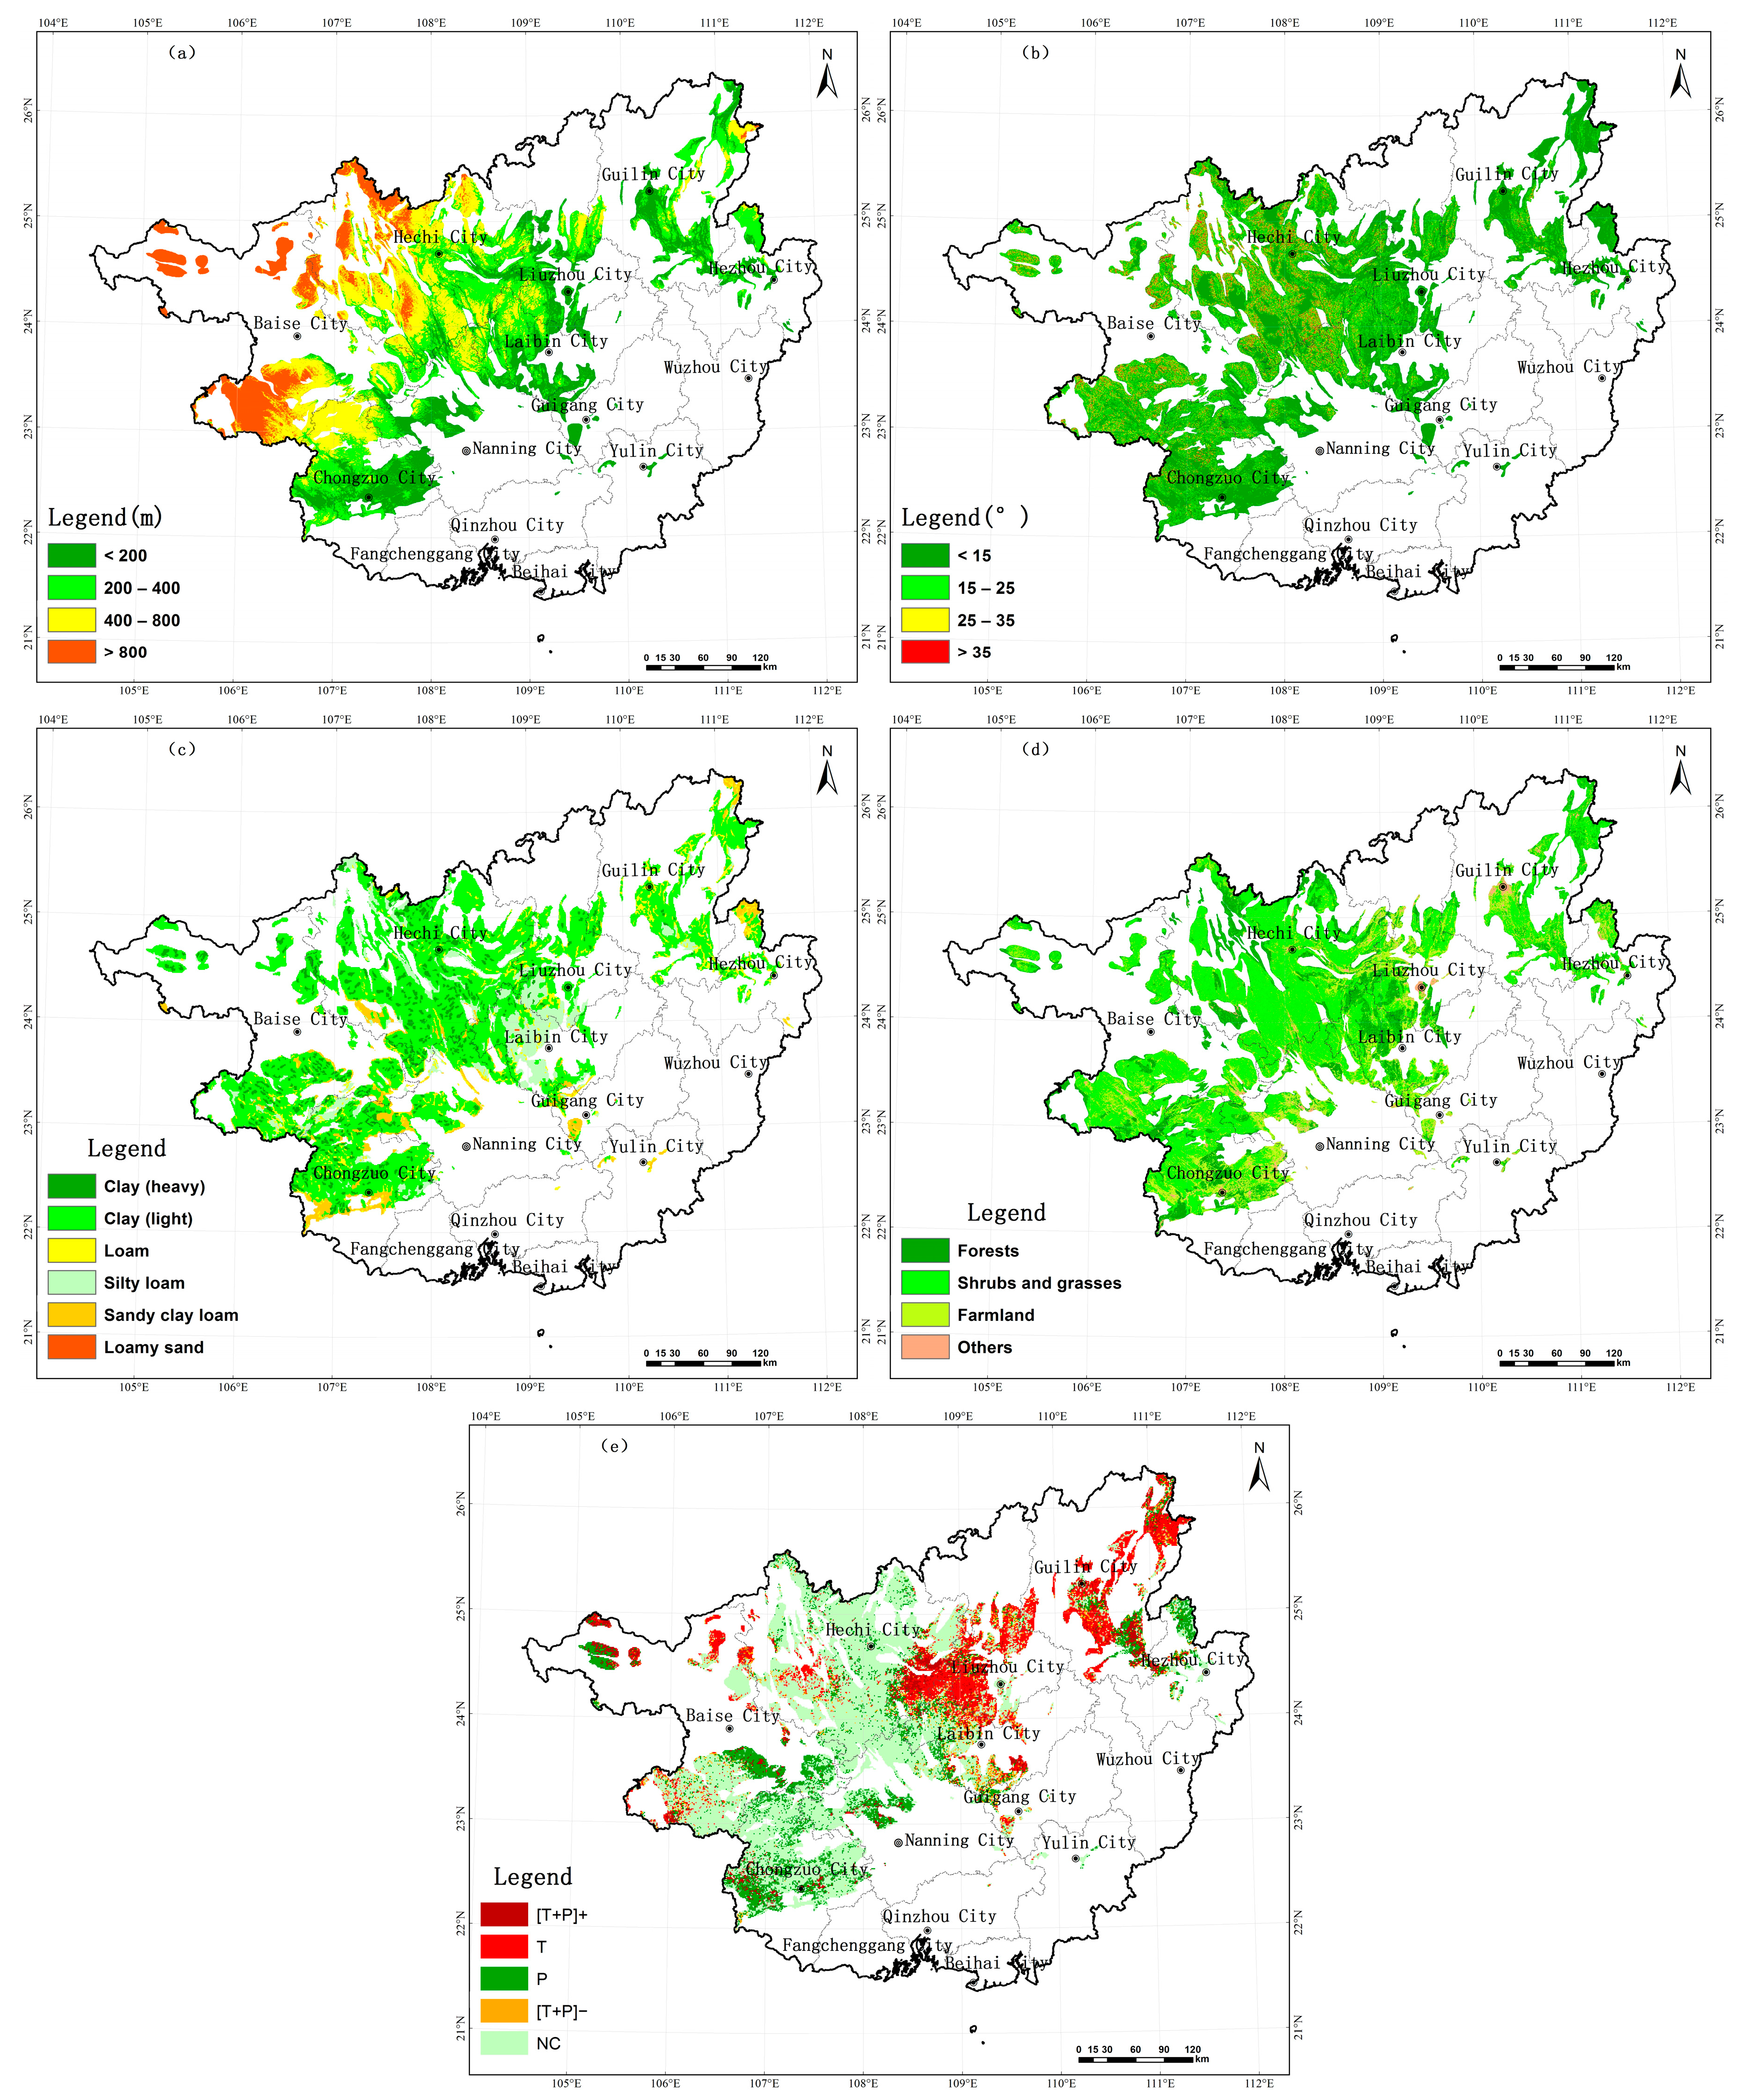
3.2.1. Impact of Terrain on Ecological Restoration of Vegetation

Altitude and slope had a significant impact on the ecological restoration of the vegetation in the karst areas of Guangxi (Figure 5). From 2000 to 2019, with the increase in altitude from 0 to 200 m, the vegetation ecological quality increased the fastest; with the increase in altitude from 200 to 400 m, the vegetation ecological quality showed a slow upward trend; when the altitude rose from 400 to 800 m, the vegetation ecological quality tended to decrease; the vegetation ecological quality almost remained unchanged with the increase in altitude from 800 to 1600 m; and as the altitude increased from 1600 to 1900 m, the vegetation ecological quality showed a significant increasing trend with fluctuations. When the slope increased from 0 to 15°, the vegetation ecological quality tended to increase significantly; with the increase in the slope from 15° to 25°, the vegetation ecological quality changed slightly; as the slope rose from 25° to 35°, the vegetation ecological quality was almost unchanged; the vegetation ecological quality showed a slight decreasing trend with the increase in the slope from 35° to 55°; and when the slope changed from 55° to 80°, the vegetation ecological quality initially increased, then decreased, and finally increased again. Over the four periods, the vegetation ecological quality index during 2005–2009 tended to decrease significantly compared to during 2000–2004. From 2010 to 2014, at an altitude of 0–1000 m and a slope of 0–25°, the vegetation ecological quality was mostly recovered. However, at an altitude of 1000–1900 m and a slope of more than 70°, due to the complex terrain and environment, it was difficult to restore the vegetation ecological quality. From 2015 to 2019, the vegetation ecological quality was greatly improved in the whole region.

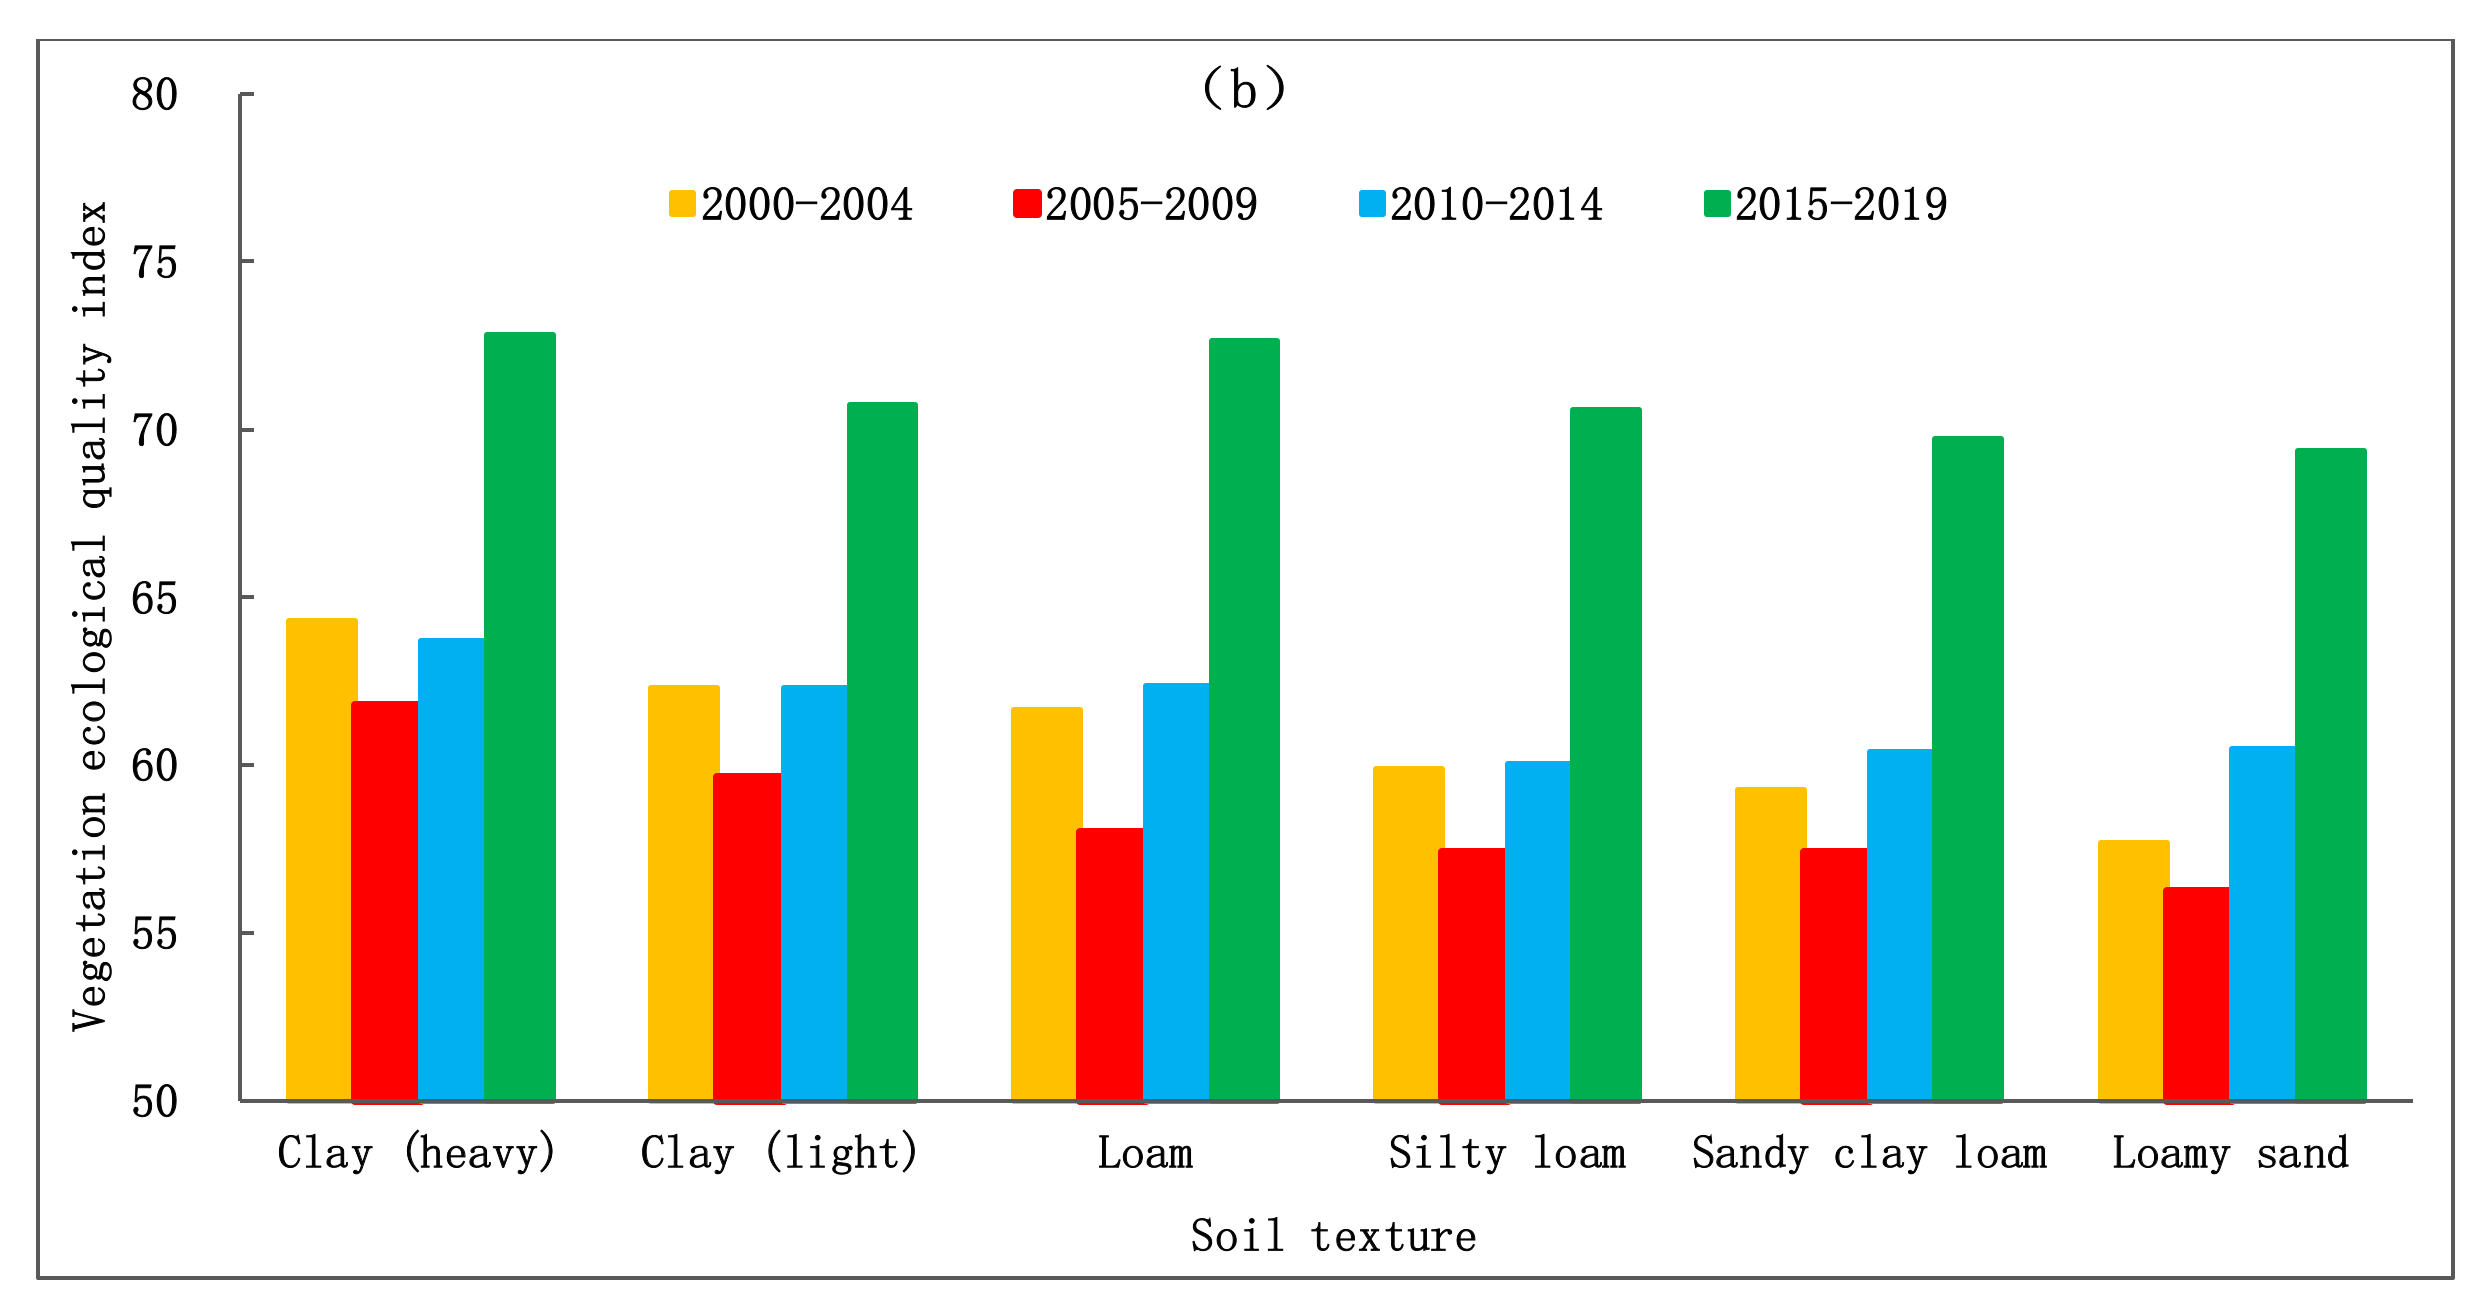
3.2.2. Impact of Soil on Ecological Restoration of Vegetation

Soil types and textures had a significant impact on the ecological restoration of the vegetation in the karst areas of Guangxi (Figure 6). For the soil types, the average vegetation ecological quality index of lime soil was the highest at 64.6, followed by clay (63.9), and red-yellow soil and purple soil had the same index (61.9), whereas those of fluvo-aquic soil and paddy soil were lower at only 59.7 and 58.1. For the soil textures, the average vegetation ecological quality index of clay (heavy) was the highest (65.6), followed by clay (light) (63.7), whereas that of loamy sandy soil was the lowest (up to 60.9). Overall, the vegetation ecological quality index tended to decrease with the increase in the soil sand content. For different periods, the vegetation ecological quality indexes of all soil types and textures in 2005–2009 showed a significant reduction compared to those in 2000–2004. In 2010–2014, the vegetation ecological quality indexes of all soil types and textures were somewhat restored. From 2015 to 2019, the vegetation ecological quality indexes of all soil types and textures in the whole region were significantly improved.

3.2.3. Impact of Vegetation Types on Ecological Restoration of Vegetation

It can be seen in Table 2 that there were significant differences in the ecological restoration of forests, shrubs and grasses, and farmland vegetation in the karst areas of Guangxi. From the average vegetation ecological quality index, it can be seen that the average ecological quality of forests was higher (with an ecological quality index of 73.5), followed by shrubs and grasses (71.6), whereas that of farmland vegetation was lower (63.4). As can be seen from the annual average growth rate of the vegetation ecological quality index from 2000 to 2019, the annual average growth rate of the ecological quality index of forests, shrubs and grasses, and farmland vegetation was the same at 0.8. During 2000–2009, the ecological quality of forests increased rapidly, followed by farmland vegetation, whereas that of shrubs and grasses increased slowly. From 2010 to 2014, the ecological quality of shrubs and grasses increased the fastest, followed by forests, and that of farmland vegetation increased slowly. In 2015–2019, the ecological quality of forests increased faster, and those of farmland vegetation and shrubs and grasses were close to each other.

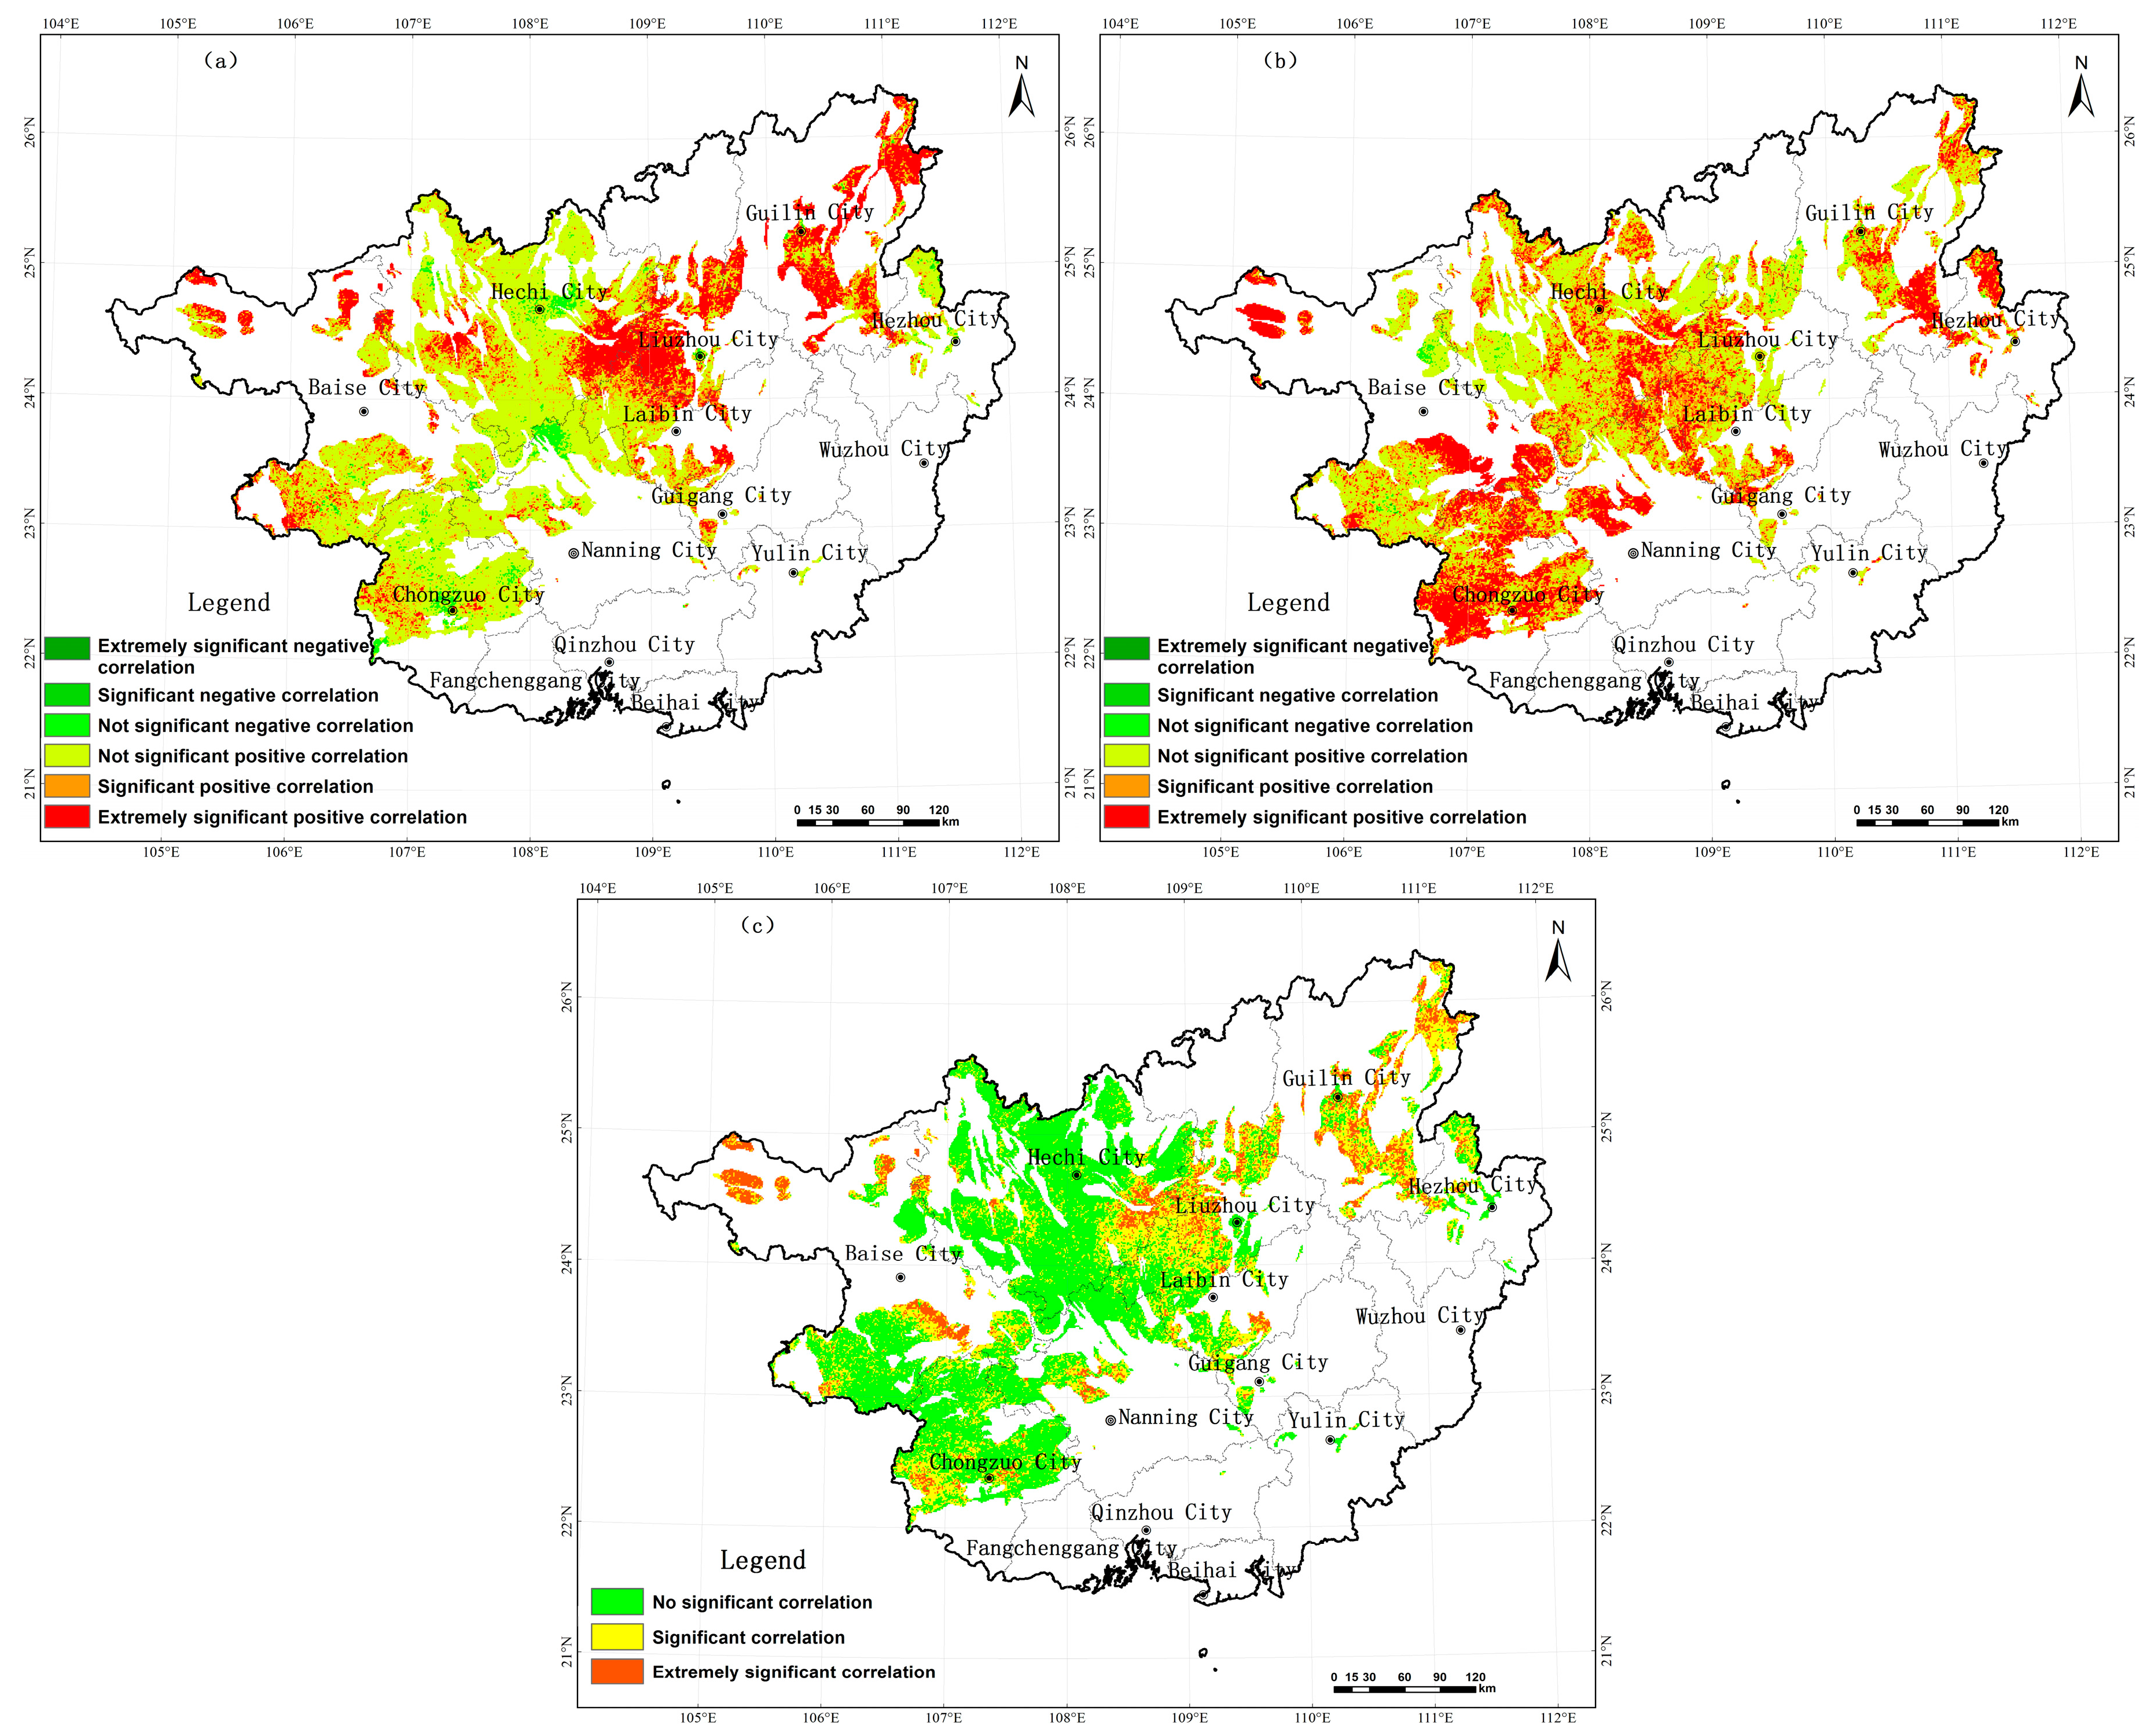
3.2.4. Impact of Climate on Ecological Restoration of Vegetation

Temperature and precipitation had a significant impact on the ecological restoration of the vegetation in the karst areas of Guangxi (Figure 7). The partial correlation between the temperature, precipitation, and vegetation ecological quality was mainly significantly positive. Among them, the areas with significant temperature correlations accounted for 35.57% of the total area and were mainly distributed in Guilin, Liuzhou, and the east and west of Hechi in northeastern Guangxi, as well as the north of Baise in northwestern Guangxi. The areas with significant precipitation correlations accounted for 52.42% of the total area and were mainly distributed in the south and northwest of Baise, most of Chongzuo, the north of Nanning, the southeast of Hechi, the southeast and northeast of Guilin, and the north of Hezhou in northeastern Guangxi. The areas with significant multiple correlations between the temperature, precipitation, and vegetation ecological quality accounted for 42.06% of the total area and were mainly distributed in the east of Hechi, Liuzhou, and Guilin; the northwest and south of Baise; the west of Chongzuo; and the northwest of Nanning.

3.2.5. Zoning of Comprehensive Influencing Factors of Ecological Restoration of Vegetation

Based on the influencing factors of the ecological evolution of the vegetation in the karst areas of Guangxi, an index system for the zoning of habitats with similar ecological restoration potential of the vegetation was constructed (Table 3, Figure 8). Analysis of terrain conditions showed that the karst areas of Guangxi had significant differences in the vegetation ecological quality index at altitudes of 200 m, 400 m, and 800 m, and slopes of 15°, 25°, and 35°. The altitudes and slopes were divided into four intervals, namely <200 m, 200–400 m, 400–800 m, >800 m (altitude), and <15°, 15°–25°, 25°–35°, >35° (slope). Analysis of the soil conditions showed that the vegetation ecological quality index in the studied region increased significantly with the increase in the soil sand content. Soil was categorized according to texture, i.e., clay (heavy), clay (light), loam, silty loam, sandy clay loam, and loamy sand. Vegetation was categorized according to type, i.e., forests, shrubs and grasses, and farmland vegetation. According to the principle of the driving zones of ecological evolution (Chen Yunhao, 2001), using the significances of the partial and multiple correlations between the vegetation ecological quality index and the climate (temperature and precipitation), the climate driving zones were divided into the strong driving zone of temperature and precipitation (|Ttemperature| > Ta=0.01, |Tprecipitation| > Ta=0.01, Ftemperature and precipitation > Fa=0.05), temperature-dominated driving zone (|Ttemperature| > Ta=0.01, Ftemperature and precipitation > Fa=0.05), precipitation-dominated driving zone (|Tprecipitation| > Ta=0.01, Ftemperature and precipitation > Fa=0.05), weak driving zone of temperature and precipitation (|Ttemperature| ≤ Ta=0.01, |Tprecipitation| ≤ Ta=0.01, Ftemperature and precipitation > Fa=0.05), and non-climate driving zone (F ≤ Fa=0.05). Using the GIS spatial overlay analysis method, the terrain conditions, soil conditions, vegetation distribution, and climate driving zones were divided into the 1440 areas with comprehensive influencing indicators of vegetation ecological restoration.

3.3. Realization and Prediction Evaluation of Ecological Restoration Potential of the Vegetation in the Karst Areas of Guangxi

3.3.1. Estimation of the Maximum Ecological Restoration Potential of Vegetation

Under average conditions, the vegetation ecological quality index in the karst areas of Guangxi was between 70 and 90, of which between 75 and 80 were concentrated in 66.77% of areas, mainly in Hechi in northern Guangxi and Baise in northwestern Guangxi. The areas with vegetation ecological quality indexes lower than 75 were mainly distributed in the center of Liuzhou and Guilin in northeastern Guangxi, the south of Laibin in central Guangxi, and the east of Chongzuo in western Guangxi, accounting for about 27.88% (Figure 9). The spatial difference of the vegetation ecological quality index under the conditions of the 90th and 95th percentiles was slight, and the vegetation ecological quality index of about 94% of the total area was between 80 and 90; the spatial difference of the vegetation ecological quality index under the condition of maximum was the least significant, and the vegetation ecological quality index in 93.53% of areas was between 95 and 100. In order to avoid errors in the results, the vegetation ecological quality index of the 95th percentile was selected as the ecological restoration potential of the vegetation under a certain site condition in the study area. Therefore, it can be determined that the maximum ecological restoration potential of the vegetation in the karst areas of Guangxi was between 70 and 95, the maximum average of the ecological restoration potential of the vegetation was 86.7 in 95.59% of areas, and the maximum of the ecological restoration potential of the vegetation was greater than 80. Among them, the maximum for the forest ecological restoration potential was the largest, peaking at 87.5, followed by the maximum for the shrubs and grasses ecological restoration potential (87.4), whereas that for the farmland ecological restoration potential was the lowest at only 85.4.

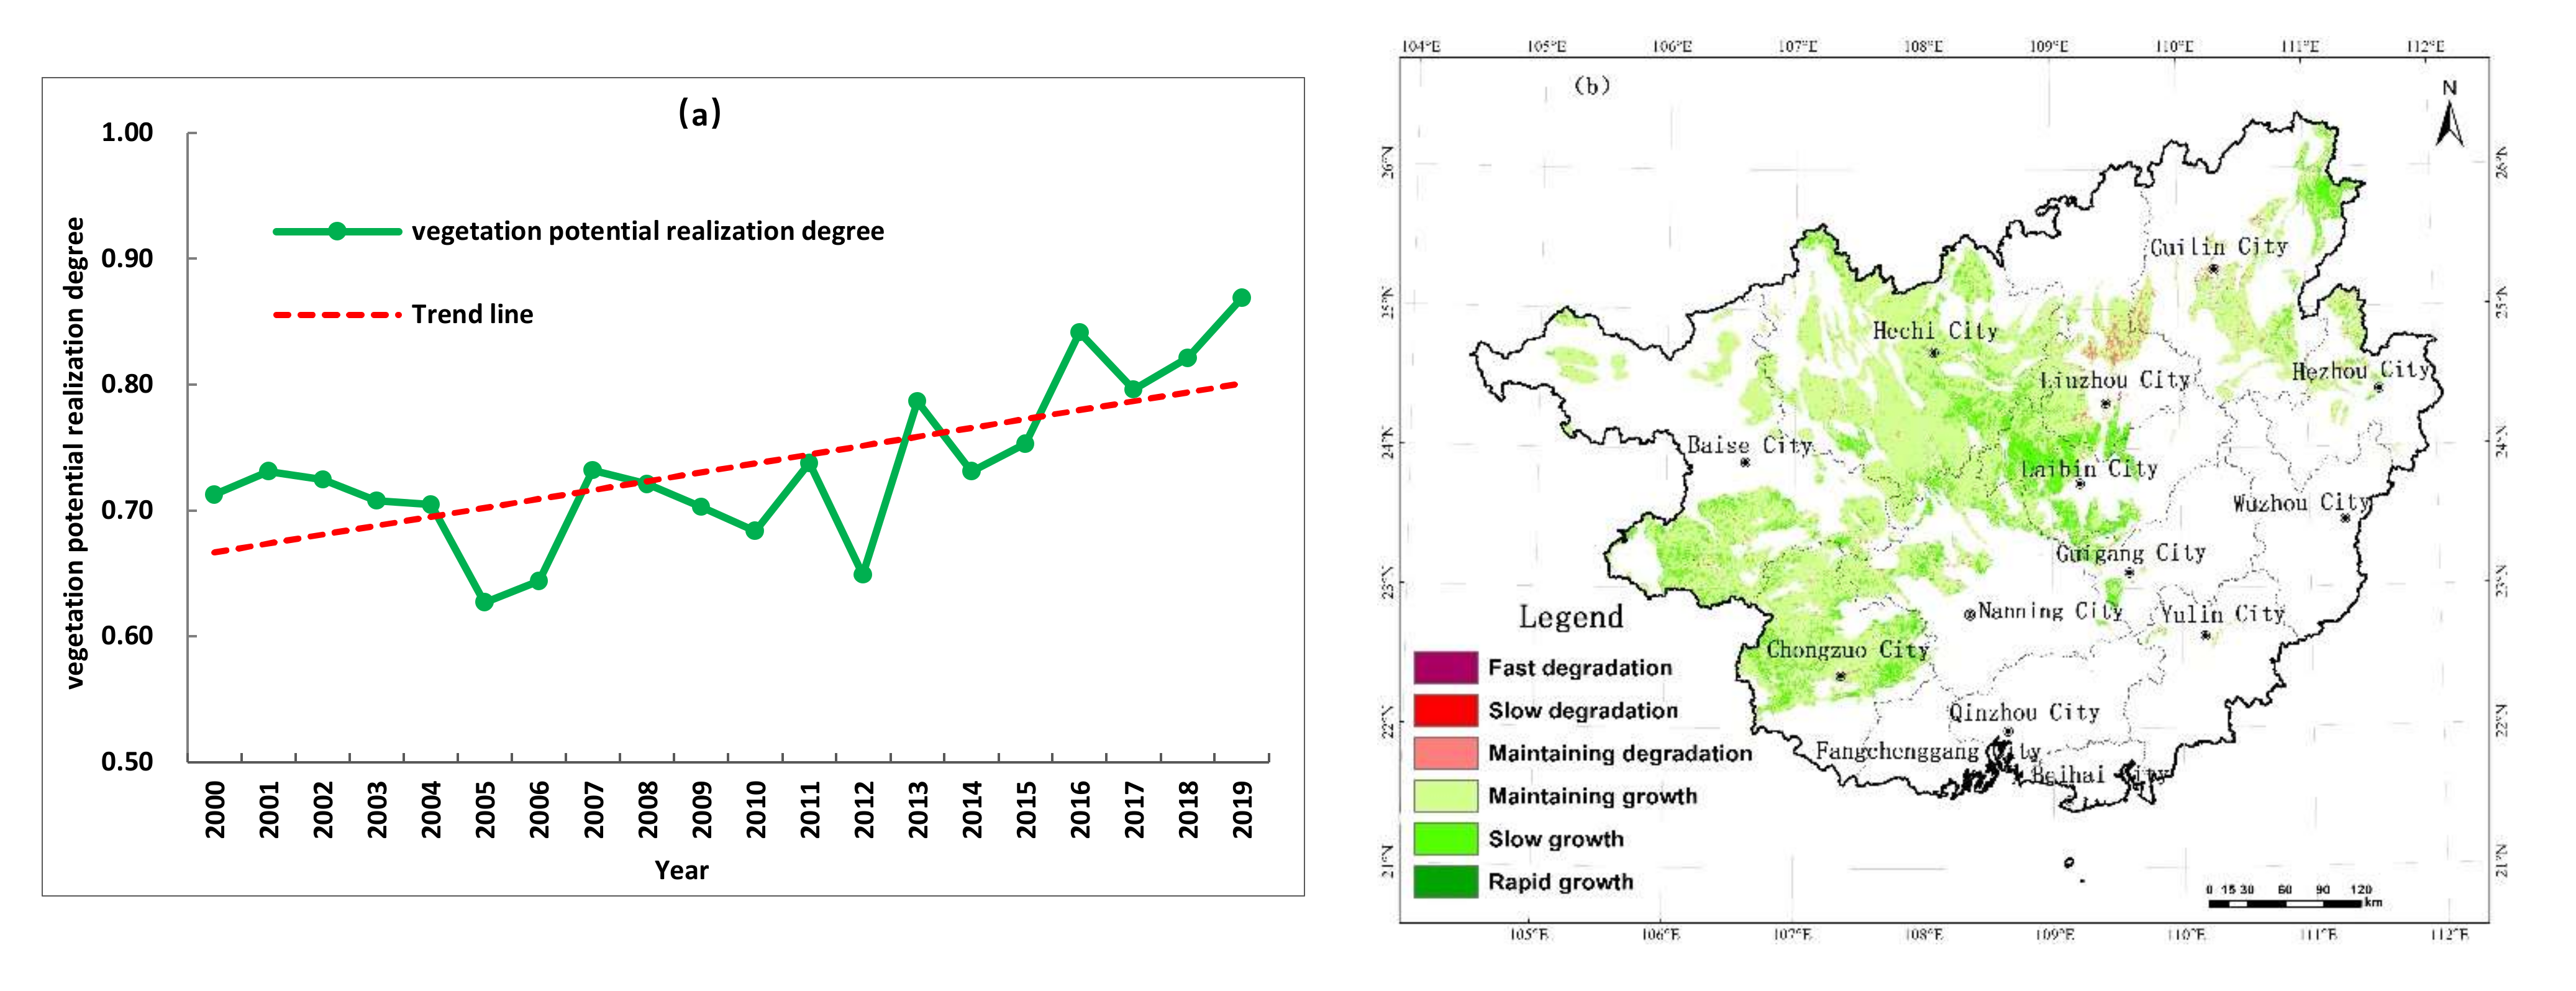
3.3.2. Evaluation of Realization Degree of Ecological Restoration Potential of the Vegetation

As shown in Figure 10a, the realization level of the ecological restoration potential of the vegetation in the karst areas of Guangxi was relatively high from 2000 to 2019, ranging from 60% to 90%, and showed an increasing trend. This indicated that under the background of the implementation of national rocky desertification control projects, the ecological restoration of the vegetation had achieved considerable results. Using the natural breakpoint method, the spatial changing trend in the realization degree of the ecological restoration potential of the vegetation in the studied region was divided into six grades, including rapid degradation (slope < −0.02), slow degradation (−0.02 ≤ slope < −0.01), maintaining degradation (−0.01 ≤ slope < 0), maintaining growth (0 ≤ slope < 0.01), slow growth (0.01 ≤ slope < 0.02), and rapid growth (slope ≥ 0.02). In Figure 10b, it can be seen that from 2000 to 2019, the overall vegetation ecological quality improved, and the vegetation ecological quality in 97.95% of areas was restored, of which the proportions of maintaining growth, slow growth, and rapid growth areas were 79.73%, 18.09%, and 0.13%, respectively. The vegetation ecological quality in only 2.04% of areas degraded and was mainly distributed in the central part of Liuzhou in northeastern Guangxi. This area was mainly cultivated land, and the degradation may be related to the reduction in cultivated land caused by construction projects in the process of urbanization, non-agricultural activities, or the migration of rural laborers.

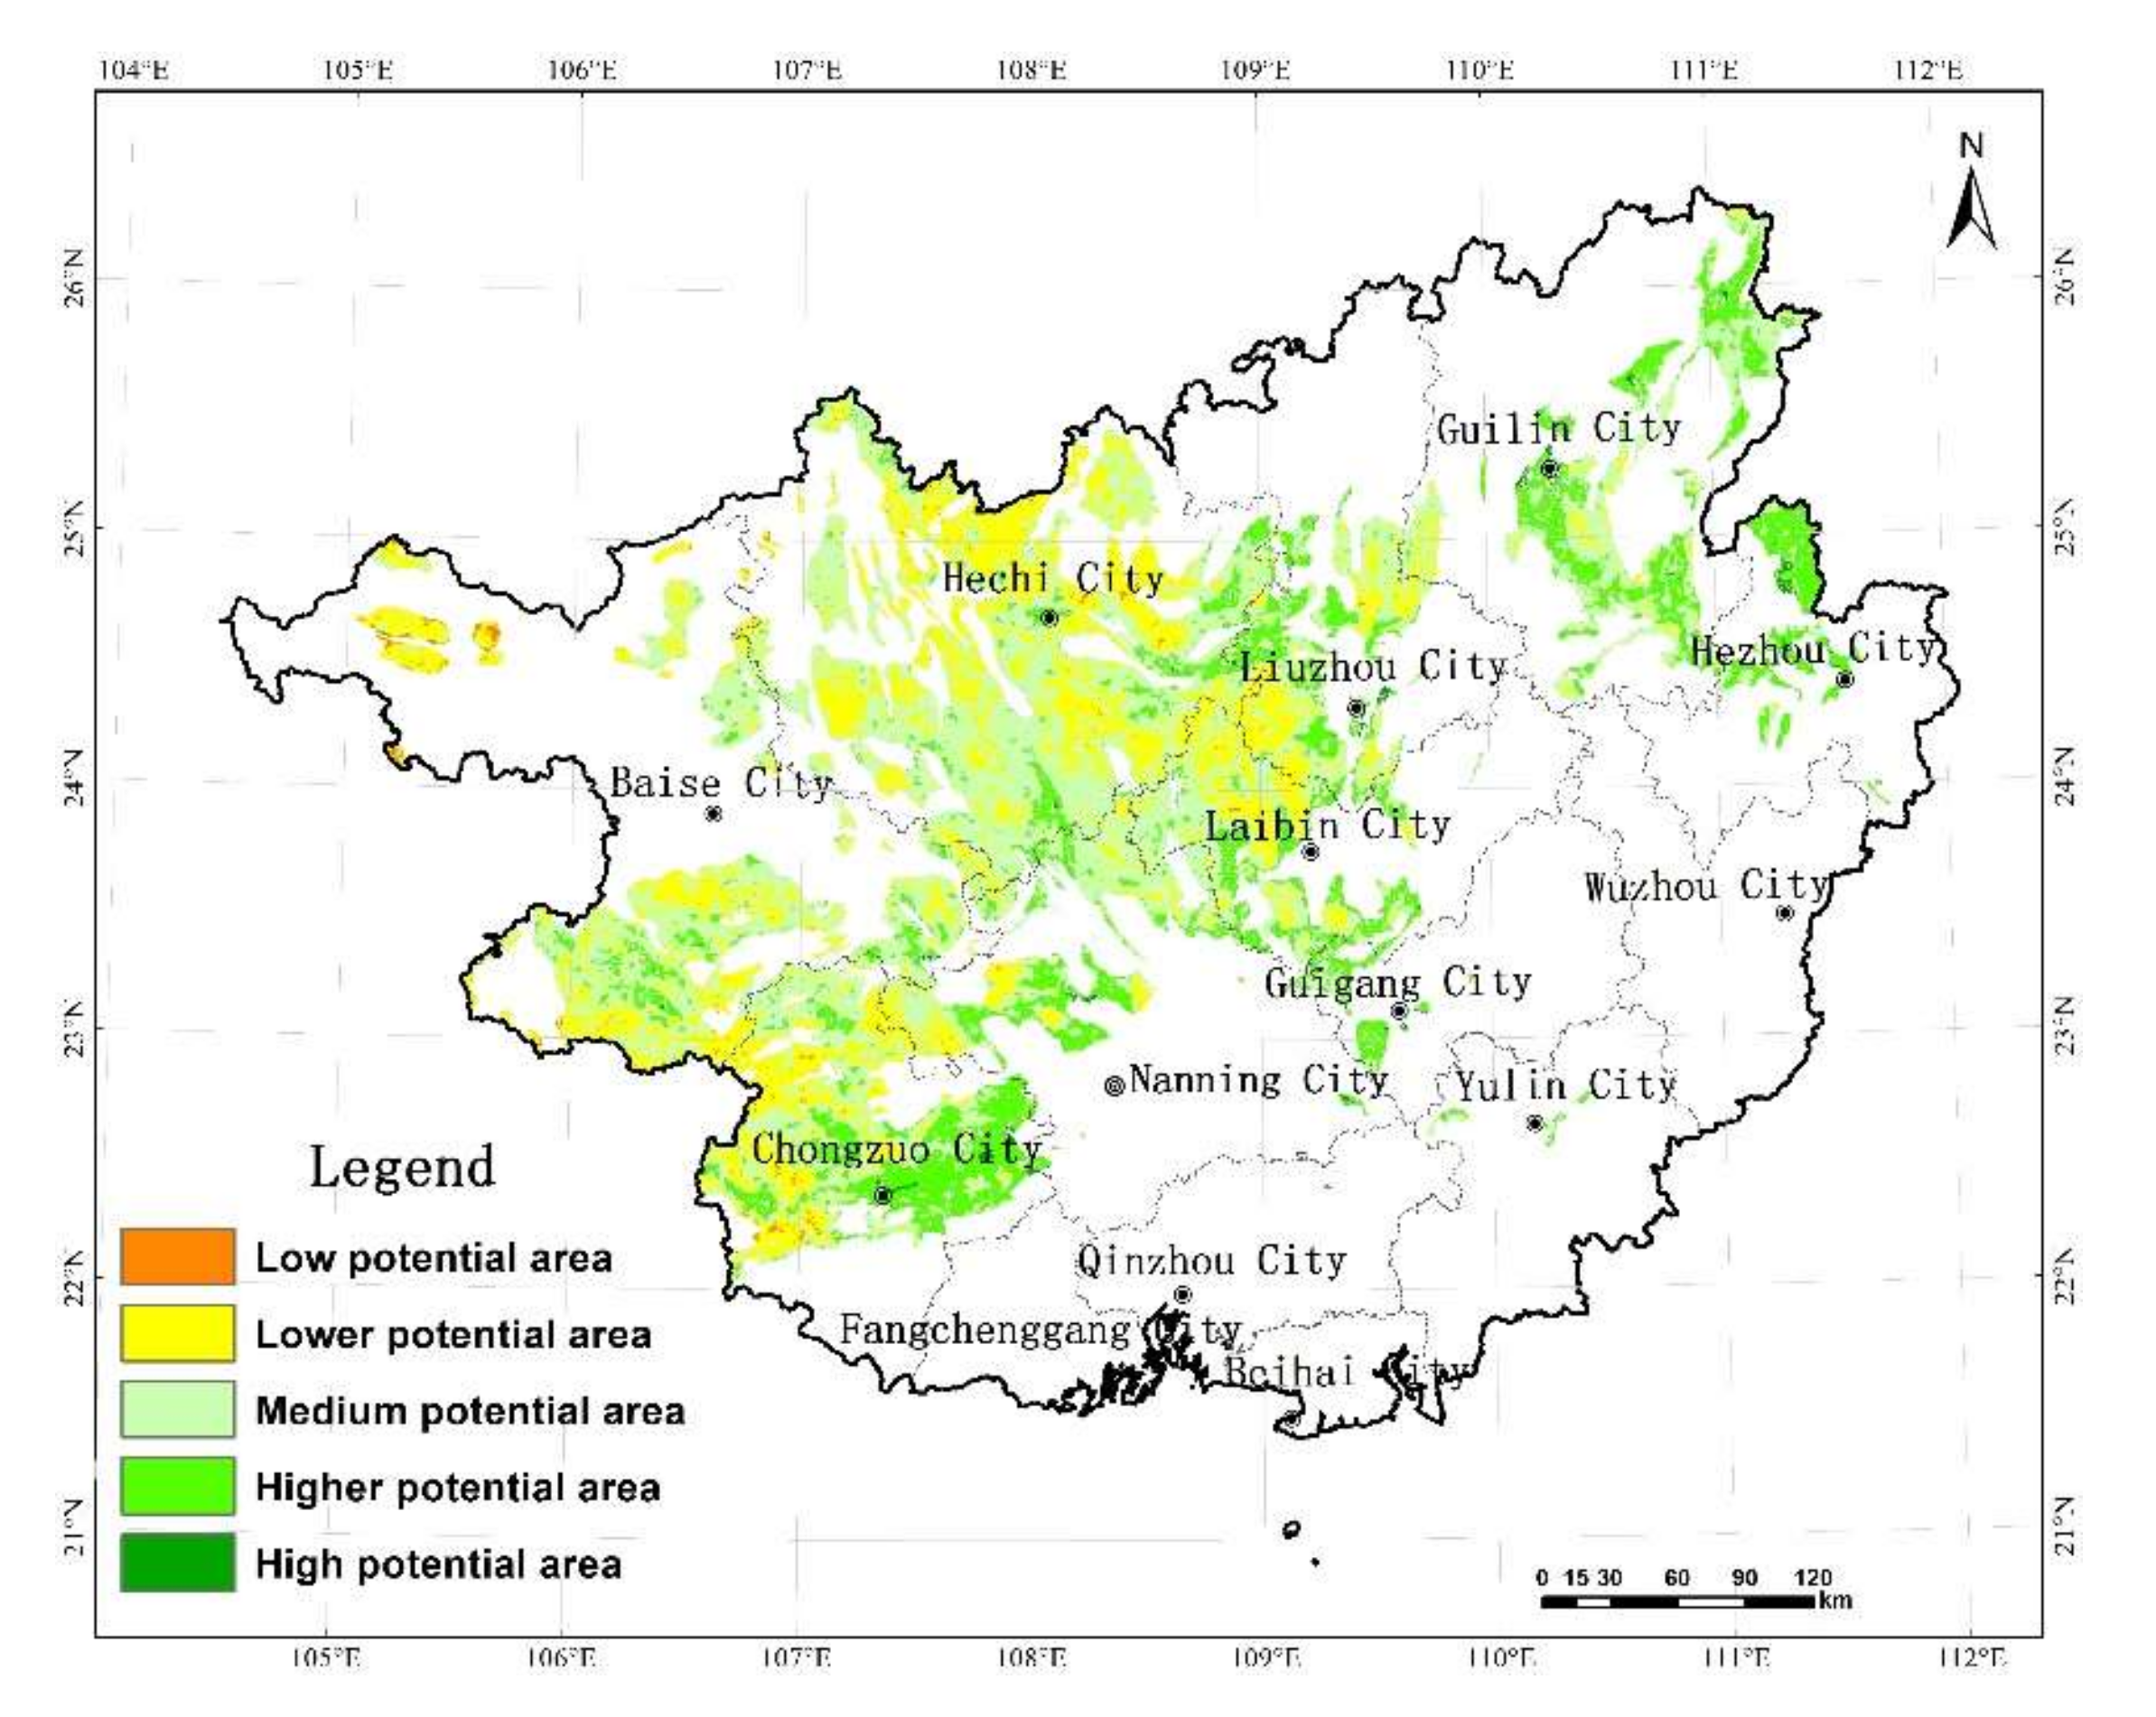
3.3.3. Prediction of Ecological Restoration Potential of Vegetation

According to the prediction index of the ecological restoration potential of the vegetation in the karst areas of Guangxi combined with the natural breakpoint method, the predicted ecological restoration potential of the vegetation was divided into five grades, which were low potential (0 < QPi < 0.1), lower potential (0.1 ≤ QPi < 0.2), medium potential (0.2 ≤ QPi < 0.3), higher potential (0.3 ≤ QPi < 0.5), and high potential (0.5 ≤ QPi < 1). The ecological restoration potential of the vegetation in the karst areas of Guangxi is predicted to be mainly low and medium in 78.83% of karst areas (Figure 11, Table 4). The proportion of areas with medium potential is predicted to be the largest, reaching 50.60%, and the proportion of areas with high potential is predicted to be the smallest at only 0.58%. From the perspective of the spatial distribution patterns, the ecological restoration potential of the vegetation is predicted to be low or lower in the north and southeast of Hechi, the northwest of Baise, and the west of Chongzuo, accounting for 11.24%, 6.41%, and 4.52% of total karst areas, respectively. In these areas, the vegetation ecological quality is predicted to be good and the ecological restoration of the vegetation is predicted to be very good. It is predicted to be close to the upper limit of the ecological restoration potential of the vegetation leaving no room for further restoration. The ecological restoration potential of the vegetation is predicted to be medium in the south of Hechi, the south of Baise, and the north of Chongzuo, accounting for 17.23%, 9.21%, and 6.15% of total karst areas, respectively. In these areas, the vegetation ecological quality is predicted to be restored well, leaving room for restoration in some local areas. The ecological restoration potential of the vegetation is predicted to be higher or high in the east of Chongzuo, the northeast of Guilin, the northwest of Guigang, and the north of Hezhou, accounting for 4.62%, 4.03%, 2.16%, and 1.95% of total karst areas, respectively. In these areas, the vegetation ecological quality is predicted to be normal, leaving room for improvements and high restoration potential.

4. Discussion

Karst areas are typical ecologically fragile areas in Guangxi and the potential ecological restoration of the vegetation in these areas is closely related to the effectiveness of rocky desertification control and vegetation restoration. In this study, by analyzing the influence of topography, soil, and climate on the vegetation ecological quality index in the karst areas, habitats with similar vegetation ecological restoration were grouped. Finally, the 95th-percentile threshold was used to determine the maximum ecological restoration potential of the vegetation, and the realization degree and prediction of the ecological restoration potential of the vegetation in the karst areas were evaluated by grades.
The choice of the vegetation ecological quality index directly affects the results of ecological restoration evaluations. The traditional evaluation of the vegetation ecological quality mostly adopts a single index method. Because an index representing vegetation productivity [29,30] or vegetation growth [31,32] was used to evaluate the vegetation ecological quality, the results may not be comprehensive. With developments in remote sensing and geographic information technology, evaluations of the vegetation ecological quality now utilize multi-index comprehensive quantitative evaluations, which greatly improve the limitations of traditional single-index qualitative evaluations. In this study, the vegetation ecological quality index constructed based on the vegetation coverage and net primary productivity was more objective in characterizing the vegetation status and has been proved to be appropriate for the monitoring and evaluation of national vegetation ecological quality [16].
The division of similar habitats is an important premise and key to the evaluation and prediction of vegetation ecological restoration in the karst areas. The vegetation ecological quality index in the karst areas varies significantly under different terrain conditions. Studies have found that terrain factors such as elevation, slope, and slope aspect have an important impact on vegetation coverage [33] and vegetation NPP [34]. However, the topographic factors that dominate vegetation changes have regional differences, which is consistent with the conclusion of this study. There is a certain relationship between the micro landforms and the altitude and slope in the karst areas, but we did not quantitatively identify the spatial distribution of the micro landforms in this area. In further studies, we would like to use high-resolution satellite remote sensing data to extract the spatial distribution of the micro landforms and quantify the impact of the micro landforms on ecological restoration. Soil types in the karst areas are diverse and heterogeneous. The organic matter and nutrients in soil are the basis of vegetation growth and determine the development direction of vegetation system succession [35]. The virtuous cycle of the soil–vegetation system is accompanied by a significant increase in soil organic matter content, which has an important impact on vegetation restoration in the karst areas [36]. In this study, we also found that the vegetation ecological quality index under different soil conditions in the karst areas was significantly different. The vegetation ecological quality indexes of lime soil and clay areas were significantly higher than those of the other soil types. The vegetation ecological quality index showed a declining trend with the increase in the soil sand content. In fact, soil is one of the important indicators in studies on the evaluation of vegetation restoration potential in karst areas [4,9,37]. The ecological restoration potential of the vegetation is closely related to vegetation type, and the restoration capabilities of different tree species are quite different [38]. In this study, there were significant differences in the ecological qualities of the various vegetation types, and there were certain differences in the growth rates of the vegetation in different periods. Medium-resolution Landsat 8 satellite remote sensing images were used, and only the first-class classification results of the vegetation cover types (forest, shrub, grassland, and cultivated land) could be obtained so it is difficult to classify arbor, shrubs, and other vegetation types in more detail. In the future, we would like to use satellite remote sensing images with higher variabilities to obtain more detailed information on the vegetation types such as trees and shrubs, then analyze the impact of the vegetation type on ecological restoration. The impact of climatic factors on vegetation in the southwestern karst areas has been confirmed [33,39,40]. We also found that the proportion of areas where the vegetation ecological quality index was significantly correlated with the temperature and precipitation was relatively high. Therefore, the selection of terrain, soil, vegetation type, and climate factors in the division of similar habitats in the karst areas was reasonable in this study. However, the different soil properties can also change due to differences in vegetation restoration. The world soil data set HWSD used in the study were static data, and the dynamic relationship between vegetation ecological quality and soil conditions cannot be deeply analyzed. In addition, the impact of only the precipitation and temperature on the vegetation in the karst areas was considered, and the comprehensive impact of more climate factors on the vegetation in the karst areas can be considered in further studies.
A variety of methods for the evaluation of the ecological restoration potential of the vegetation have been developed to adapt to the diversity and complexity of the evaluation indicators [11]. However, due to index weighting and other factors, the evaluation results have the defects of greater subjectivity and balance [10].
In this study, the percentile method was used to assign the upper limit of the ecological restoration potential of the vegetation based on similar habitat areas, and the natural breakpoint method was used in the grading evaluation. The calculation was simple and the results are consistent with the implementation effect of rocky desertification control projects. Previous studies have also shown that since 2000, under the background of ecological engineering implementation, the vegetation index, productivity, and biomass of the karst areas in southwest China have increased significantly, especially in northwest Guangxi and other areas [27]. It can be seen that using “3S” technology and similar habitat analysis methods to evaluate the realization effects of vegetation ecological restoration can provide technical support for ecological protection in the karst areas and has a good application future in evaluation methods of vegetation ecological restoration. In further studies, if the field data of vegetation ecosystem types can be used to adjust the division of the thresholds using the natural breakpoint method, the results would be more objective.

5. Conclusions

(1)
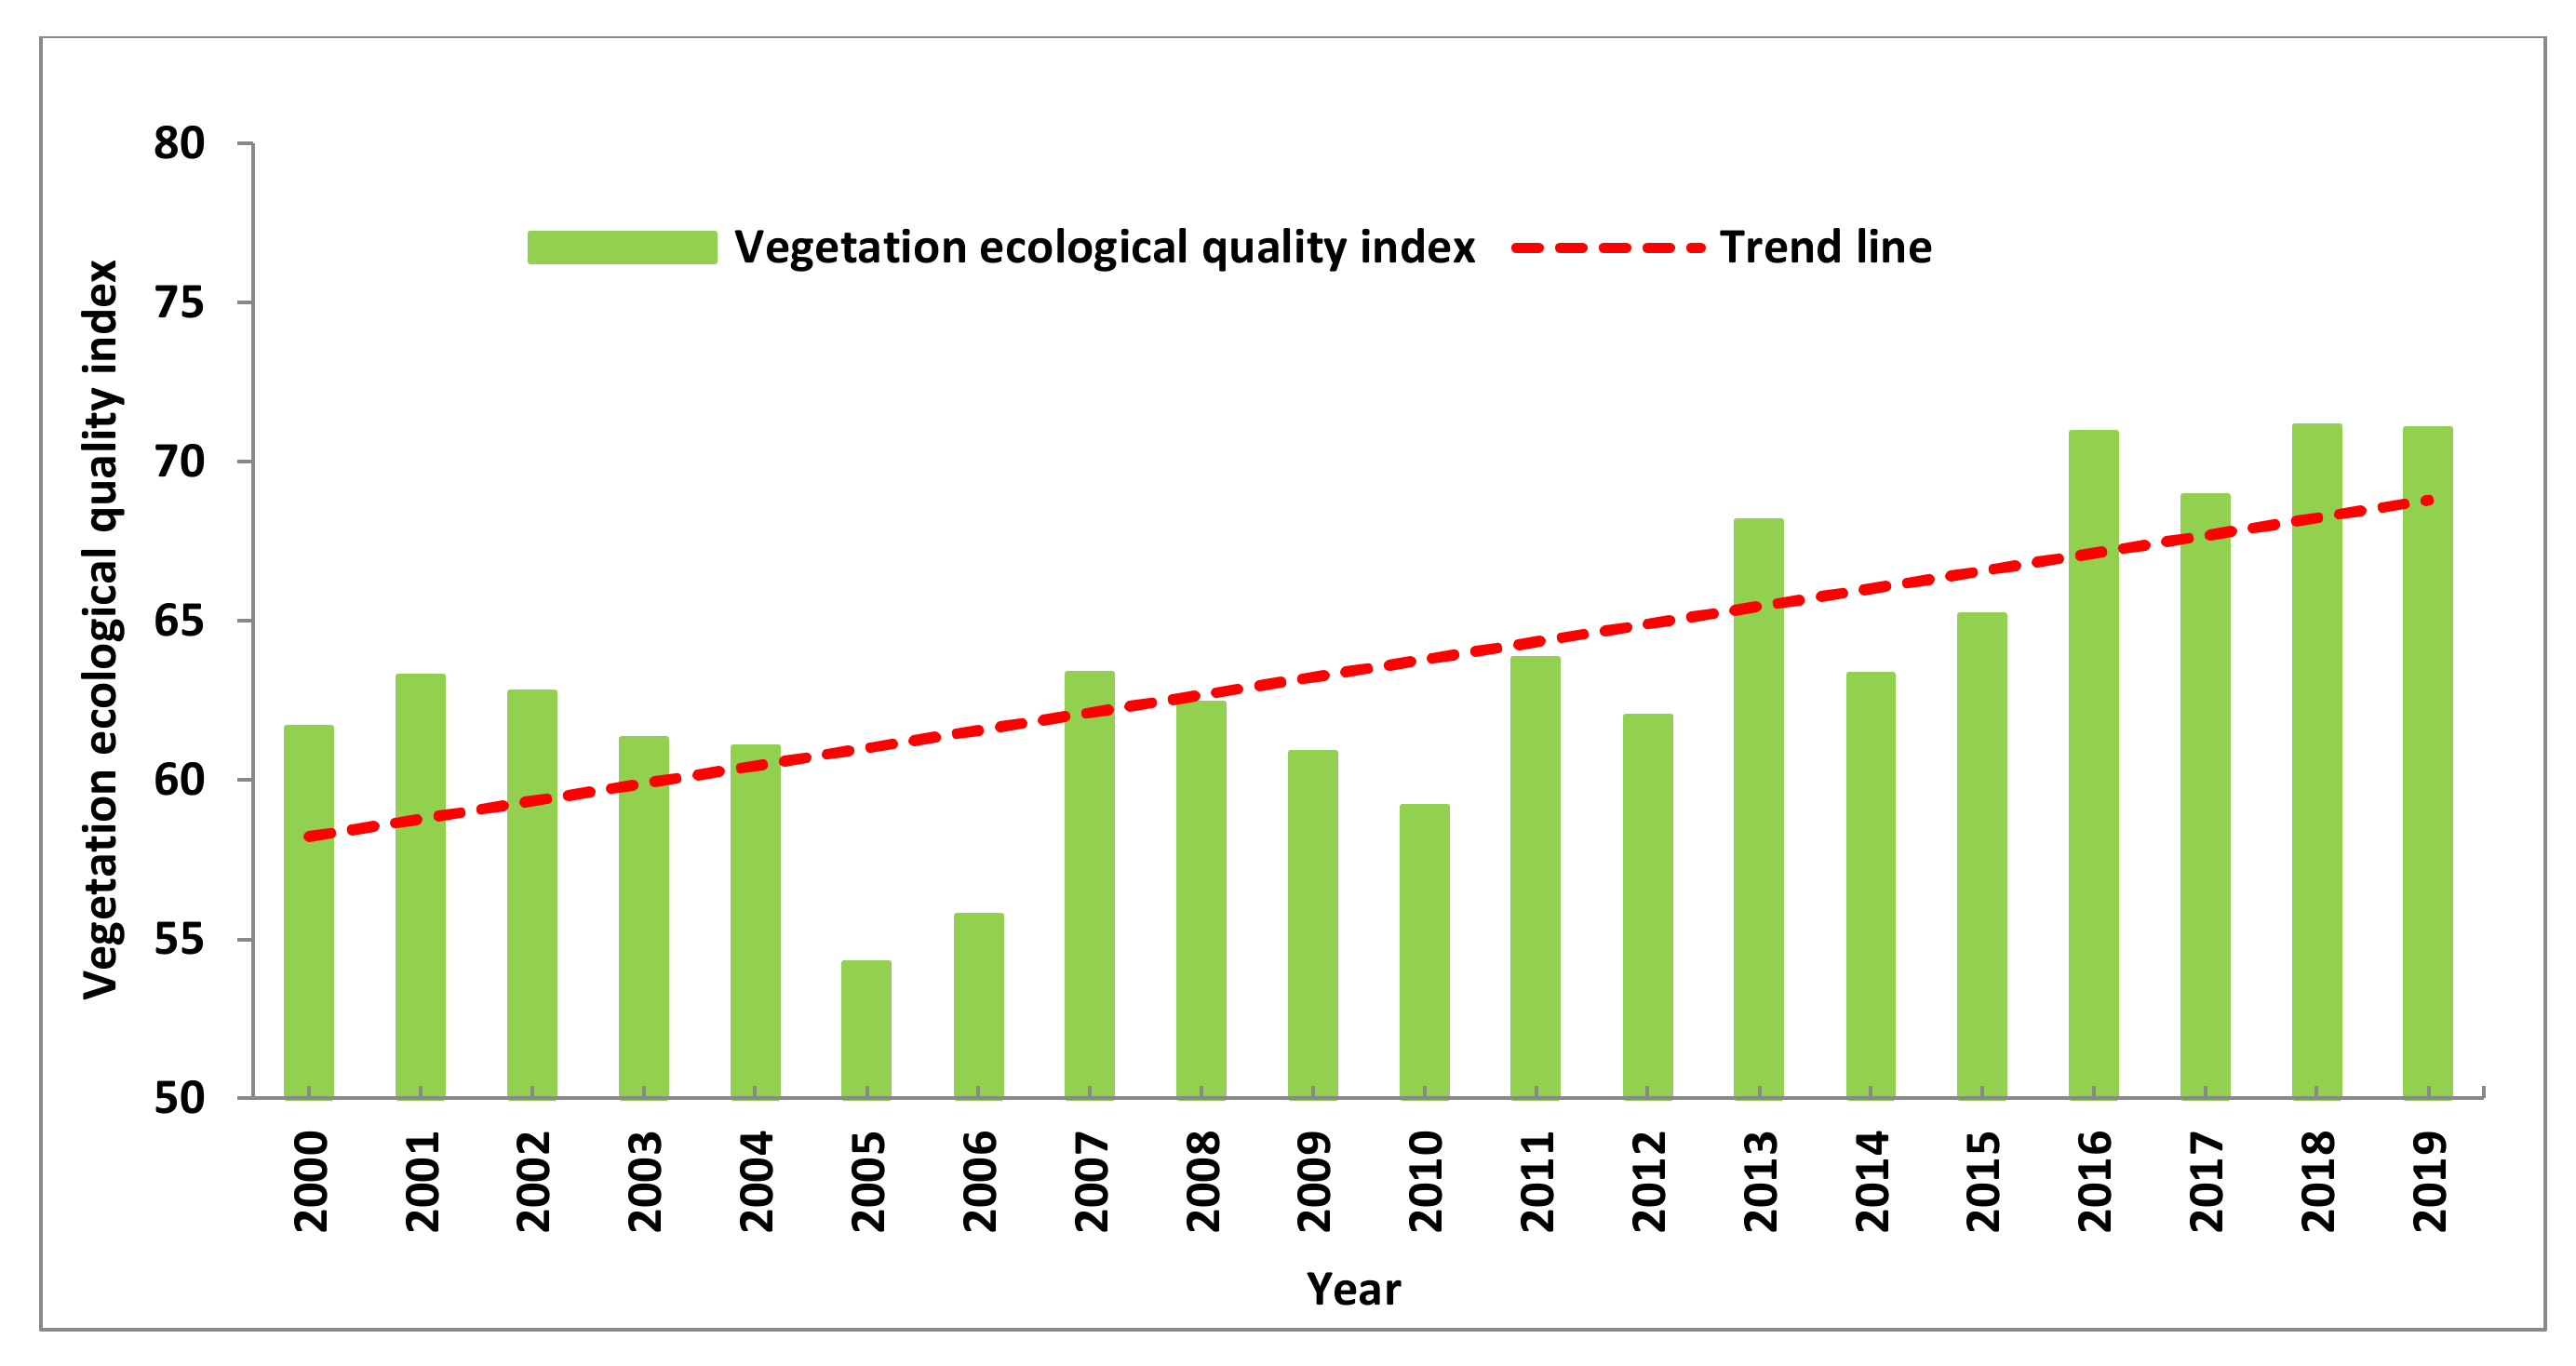
In the karst areas of Guangxi, the level of the vegetation ecological quality was high from 2000 to 2019, with a fluctuating increasing trend.
(2)
The terrain, soil, vegetation type, and climatic conditions had a significant impact on the vegetation ecological restoration in the study area. With the increase in the soil sand content, the change in the vegetation ecological quality index was more significant at altitudes of 200–800 m and slopes of 15°–35°. The maximum of the forest ecological restoration potential was the highest. The precipitation was the most significant area of vegetation ecological restoration affected by climate.
(3)
The realization level of the ecological restoration potential of the vegetation was relatively high, and the implementation effect of ecological restoration projects was good, with a vegetation ecological quality index of 97.95% in the areas that were restored.
(4)
In the future, the ecological restoration potential of the vegetation in the karst areas of Guangxi is predicted to be mainly low (distributed in the north and southeast of Hechi, the northwest of Baise, and the west of Chongzuo) and medium (distributed in the south of Hechi, the south of Baise, and the north of Chongzuo).

Author Contributions

Conceptualization, J.M. and Y.C.; methodology, J.M. and Y.C.; software, J.M. and W.M.; validation, J.M.; formal analysis, J.M.; investigation, J.M.; resources, J.M. and Y.C.; data curation, J.M. and Y.C.; writing—original draft preparation, J.M.; writing—review and editing, Y.C. and Y.Z.; visualization, J.M.; supervision, Y.C.; project administration, Y.C.; funding acquisition, J.M. and Y.C. All authors have read and agreed to the published version of the manuscript.

Funding

The research was supported by the Key Research and Development Projects of Guangxi Science and Technology Department (Guike AB17292051; Guike AB20159022; Guike AB21238010).

Institutional Review Board Statement

Not applicable.

Informed Consent Statement

Written informed consent has been obtained from the patient(s) to publish this paper.

Data Availability Statement

Data sharing not applicable.

Conflicts of Interest

The authors declare no conflict of interest.

References

  1. Sun, S. Afforestation, 2nd ed.; China Forestry Press: Beijing, China, 1996; p. 224. [Google Scholar]
  2. Zhu, S.; He, J.; Zhu, X. An evaluation and dividing area on degree of planting difficulty in Karst region of Wujiang Watershed. J. Mt. Agric. Biol. 1998, 17, 129–134. [Google Scholar]
  3. Zhou, Y.; He, X.; Xie, Y.; Wang, M.; Wu, M.; Wu, D. Type classification for vegetation restoration of karst mountains in Bijie. Sci. Silvae Sin. 2008, 44, 123–128. [Google Scholar]
  4. Zhang, Z. Assessment of Soil Organic Carbon Distribution, Storage and Vegetation Restoration Potential in Karst Rocky Desertification; Guizhou University: Guizhou, China, 2017. [Google Scholar]
  5. Wang, Y.; Wang, K.L.; Zhou, D.S.; Li, L.; Chen, Z.H. Effects of vegetation succession on soil quality in karst region of Guangxi, China. J. Soil Water Conserv. 2007, 21, 130–134. [Google Scholar]
  6. Wang, M.C.; Zhang, X.C.; Li, H.J.; Zhou, H.Y.; Wei, X.H.; Guan, G.C. An analysis of soil quality changes in the process of ecological restoration in karst rocky desertification area:A case study in karst ecological restoration and rehabilitation region of Guzhou Village. Ecol. Environ. Sci. 2016, 25, 947–955. [Google Scholar]
  7. Yu, L.; Zhu, S.; Ye, J.; Wei, L.; Chen, Z. A study on evaluation of natural restoration for degraded karst forest. For. Sci. 2000, 36, 12–19. [Google Scholar]
  8. Zhu, S.; Chen, Z.; Wei, L. The process and pattern of natural restoration in degraded Karst forest. J. Guizhou Univ. Agric. Biol. Sci. Ed. 2002, 21, 19–25. [Google Scholar]
  9. Xu, X.; Yang, D.; Hu, T. Study on the adaptability of different plant species in the vegetation restoration of highway slopes. Highway 2004, 6, 157–161. [Google Scholar]
  10. Tang, Y.; Xie, Y.; Yu, G. Assessment of restoration potential of degraded karst vegetation in north-western of Guizhou, SW China. J. Mt. Sci. 2012, 30, 528–534. [Google Scholar]
  11. Xiang, Z. Distribution of Biomass and Nutrient Elements in Different Vegetation Restoration Models in the Rocky Desertification Area of Shaoyang County; Central South University of Forestry and Technology: Changsha, China, 2010. [Google Scholar]
  12. Tobler, W. A computer movie simulating urban growth in the Detroit region. Econ. Geogr. 1970, 46, 234–240. [Google Scholar] [CrossRef]
  13. Zhang, D.; Jia, Q.; Wang, P.; Zhang, J.; Hou, X.; Li, X.; Li, W. Analysis of spatial variability in factors contributing to vegetation restoration in Yan’an, China. Ecol. Indic. 2020, 113, 106–278. [Google Scholar] [CrossRef]
  14. Gao, H.; Pang, G.; Li, Z. Evaluating the potential of vegetation restoration in the Loess Plateau. Acta Geogr. Sin. 2017, 72, 863–874. [Google Scholar]
  15. Zhao, G.; Mu, X.; Tian, P. Prediction of vegetation variation and vegetation restoration potential in the loess plateau. J. Soil Water Conserv. 2021, 35, 205–212. [Google Scholar]
  16. Qian, S.; Yan, H.; Wu, M.X. Dynamic monitoring and evaluation model for spatio-temporal change of comprehensive ecological quality of vegetation. Acta Ecol. Sin. 2020, 40, 6573–6583. [Google Scholar]
  17. Ji, Y.H.; Zhou, G.S.; Wang, S.D.; Wang, L.X.; Zhou, M.Z. Evolution characteristics and its driving forces analysis of vegetation ecological quality in Qinling Mountains region from 2000 to 2019. Chin. J. Plant Ecol. 2021, 45, 617–625. [Google Scholar] [CrossRef]
  18. Sun, J. Principles and Applications of Remote Sensing; Wuhan University Press: Wuhan, China, 2003. [Google Scholar]
  19. Su, W.; Gan, S.; Yuan, X. Changes of vegetation coverage and its driving factors in Simao Basin in recent 30 years. J. Henan Univ. Nat. Sci. 2018, 48, 574–580. [Google Scholar]
  20. Yan, H.; Wang, S.Q.; Billesbach, D.; Oechel, W.; Bohrer, G.; Meyers, T.; Martin, T.A.; Matamala, R.; Phillips, R.P.; Rahman, F.; et al. Improved global simulations of gross primary product based on a new definition of water stress factor and a separate treatment of C3 and C4 plants. Ecol. Model. 2015, 297, 42–59. [Google Scholar] [CrossRef]
  21. Brewer, J.S.; Menzel, T. A method for evaluating outcomes of restoration when no references sites exist. Restor. Ecol. 2009, 17, 4–11. [Google Scholar] [CrossRef]
  22. Jiang, J.; Gao, D.Z.; DeAngelis, D.L. Towards a theory of ecotone resilience: Coastal vegetation on a salinity gradient. Theor. Popul. Biol. 2012, 82, 29–37. [Google Scholar] [CrossRef]
  23. Laughlin, D.C. Applying trait-based models to achieve functional targets for theory-driven ecological restoration. Ecol. Lett. 2014, 17, 771–784. [Google Scholar] [CrossRef]
  24. Mu, S.J.; Li, J.L.; Chen, Y.Z.; Gang, C.; Zhou, W.; Ju, W.M. Spatial differences of variations of vegetation coverage in Inner Mongolia during 2001–2010. Acta Geogr. Sin. 2012, 67, 1255–1268. [Google Scholar]
  25. Cao, L. Dynamic Changes of Vegetation NDVI in Jiangsu Province and Its Relationship with Climatic Factors; Nanjing Agricultural University: Nanjing, China, 2014. [Google Scholar]
  26. National Technical Committee of Agricultural Meteorology Standardization. Grade of Monitoring and Evaluating for Terrestrial Vegetation Meteorology and Ecological Quality: QX/T 494-2019; China Standard Press: Beijing, China, 2019. [Google Scholar]
  27. Chen, Y.; Meng, L.; Huang, X. Temporal and Spatial Distributions of Drought in Guangxi Karst Area During 1971–2017 Based on Standardized Precipitation Evapotranspiration Index. J. Arid. Meteorol. 2019, 37, 353–362. [Google Scholar]
  28. Wang, Z.; Yan, H.; Mo, M. Do a Good Job in Post- disaster Assessment Survey Scientific Organizations Reconstruction—Research Report on Forestry Restoration after Guangxi Zhuang Nature Reserve Disaster. For. Econ. 2008, 4, 21–24. [Google Scholar]
  29. Mao, L.; Li, C.; Hou, Y. China meteorologically-driven ecological monitoring and assessment in the first half of 2006. Meteorol. Mon. 2006, 32, 88–95. [Google Scholar]
  30. Qian, S.; Mao, L.; Hou, Y. Technology and application of ecology meteorological synthetic monitoring and predicting for northern grassland in China. Meteorol. Mon. 2008, 34, 62–68. [Google Scholar]
  31. Yuan, F.; Bauer, M.E. Comparison of impervious surface area and normalized difference vegetation index as indicators of surface urban heat island effects in Landsat imagery. Remote Sens. Environ. 2007, 106, 375–386. [Google Scholar] [CrossRef]
  32. Wright, C.K.; De Beurs, K.M.; Henebry, G.M. Combined analysis of land cover change and NDVI trends in the Northern Eurasian grain belt. Front. Earth Sci. 2012, 6, 177–187. [Google Scholar] [CrossRef]
  33. Tong, X.W.; Wang, K.L.; Yue, Y.M.; Liao, C.J.; Xu, Y.F.; Zhu, H.T. Trends in vegetation and their responses to climate and topography in northwest Guangxi. Acta Ecol. Sin. 2014, 34, 3425–3434. [Google Scholar]
  34. Feng, W.; Xie, S. Spatiotemporal characteristics and influencing factors of vegetation NPP in the Yangtze River Basin from 2000 to 2015. Res. Soil Water Conserv. 2022, 29, 176–183. [Google Scholar]
  35. Zhao, Z.; Hou, L.; Cai, Y. The process and mechanism of soil degradation in karst area in Southwest China. Earth Sci. Front. 2006, 3, 185–189. [Google Scholar]
  36. Wang, J.; Yin, G.X. Research status and problems of phytoremediation of contaminated soil. Guangdong Chem. Ind. 2010, 37, 83–97. [Google Scholar]
  37. Tang, Y.; Xie, Y.; Yu, G. Seasonal dynamics and strategies of soil seed banks in karst region of northwest Guizhou. Chin. J. Ecol. 2011, 30, 1454–1460. [Google Scholar]
  38. Xu, Y. Research on Remote Sensing Measurement Model of Vegetation Resilience; China University of Mining and Technology: Beijing, China, 2020. [Google Scholar]
  39. Chen, Y.; Li, X.; Shi, P. Variation in NDVI driven by climate factors across China during 1983–1992. Chin. J. Plant Ecol. 2001, 25, 716–720. [Google Scholar]
  40. Meng, J.; Wang, J. The response of vegetation dynamics to climate change in the southwestern karst region of China since the early 1980s. Geogr. Res. 2007, 26, 857–866. [Google Scholar]
Figure 1. Map of the studied area.
Sustainability 14 12525 g001
Figure 2. Technical flowchart.
Sustainability 14 12525 g002
Figure 3. Annual variation in vegetation ecological quality index in the karst areas of Guangxi from 2000 to 2019.
Sustainability 14 12525 g003
Figure 4. Spatial variation distribution of vegetation ecological quality in the karst areas of Guangxi from 2000 to 2019 ((a) 2000–2004; (b) 2005–2009; (c) 2010–2014; (d) 2015–2019).
Sustainability 14 12525 g004
Figure 5. Changes in vegetation ecological quality indexes under different terrains in the karst areas of Guangxi from 2000 to 2019 ((a) Altitude; (b) Slope).
Sustainability 14 12525 g005aSustainability 14 12525 g005b
Figure 6. Changes in vegetation ecological quality indexes under different soil conditions in the karst areas of Guangxi from 2000 to 2019 ((a) Soil type; (b) Soil texture).
Sustainability 14 12525 g006aSustainability 14 12525 g006b
Figure 7. Spatial distribution of correlations between vegetation ecological quality and climate in the karst areas of Guangxi ((a) Partial correlation of temperature; (b) Partial correlation of precipitation; (c) Multiple correlations of temperature and precipitation).
Sustainability 14 12525 g007
Figure 8. Zoning maps of similar habitats of ecological restoration of vegetation in the karst areas of Guangxi ((a) Elevation; (b) Slope; (c) Soil texture; (d) Vegetation type; (e) Climate driving).
Sustainability 14 12525 g008
Figure 9. Spatial distribution of the ecological restoration potential of the vegetation in the karst areas of Guangxi ((a) Average; (b) 90% quantile; (c) 95% quantile; (d) Maximum).
Sustainability 14 12525 g009
Figure 10. Temporal and spatial variations of the realization degree of the ecological restoration potential of the vegetation in the karst areas of Guangxi from 2000 to 2019 ((a) Time; (b) Space).
Sustainability 14 12525 g010
Figure 11. Spatial distribution of predicted ecological restoration potential of the vegetation in the karst areas of Guangxi.
Sustainability 14 12525 g011
Table 1. Area and proportion of different grades of vegetation ecological quality in the karst areas of Guangxi from 2000 to 2019.
Vegetation Ecological Quality IndexGrade2000–20042005–20092010–20142015–2019
Area/km2Proportion/%Area/km2Proportion/%Area/km2Proportion/%Area/km2Proportion/%
<20Poor217.320.32324.000.47254.860.37139.290.20
20–40Worse2353.643.434535.716.611709.942.49493.290.72
40–60Normal22,429.7132.7131,385.1445.7720,758.2930.274844.317.06
60–70Better 36,439.8353.1429,519.9043.0540,829.9859.5428,947.3442.21
>70Good7136.1910.402811.944.105023.637.3334,152.3849.80
Table 2. Annual average growth rate of ecological quality of different vegetation types in the karst areas of Guangxi from 2000 to 2019.
Vegetation Type2000–20192000–20042005–20092010–20142015–2019
AverageGrowth RateAverageGrowth RateAverageGrowth RateAverageGrowth RateAverageGrowth Rate
Forests73.50.870.40.871.11.273.61.180.40.8
Shrubs and grasses71.60.868.40.369.20.771.51.378.70.6
Farmland63.40.859.80.560.71.163.90.970.60.7
Table 3. Index system for the zoning of habitats with similar ecological restoration potential of the vegetation in the karst areas of Guangxi.
FactorIndicatorZones
Terrain conditionsAltitude≤200 m200~400 m400~800 m>800 m
Slope≤15°>15~25°>25~35°>35°
Soil conditionsSoil textureClay (heavy)Clay (light)LoamSilty loamSandy clay loamLoamy sand
Vegetation distributionVegetation typeForestsShrubs and grassesFarmland vegetation
Driving factorsClimate and non-climate[T + P]+TP[T + P]NC
Note: [T + P]+: Strong driving zone of temperature and precipitation; T: Temperature-dominated driving zone; P: Precipitation-dominated driving zone; [T + P]: Weak driving zone of temperature and precipitation; NC: Non-climate driving zone.
Table 4. Area and proportion of various grades of predicted ecological restoration potential of the vegetation in the karst areas of Guangxi.
Prefecture-LevelLow-Potential AreaLower-Potential AreaMedium-Potential AreaHigher-Potential AreaHigh-Potential Area
Area/km2Proportion/%Area/km2Proportion/%Area/km2Proportion/%Area/km2Proportion/%Area/km2Proportion/%
Guilin2.020.00537.110.793653.245.402651.253.9275.500.11
Hechi100.990.157503.4811.0911,654.4017.231333.811.9712.710.02
Hezhou7.490.011346.871.992353.983.481270.971.8849.130.07
Liuzhou0.000.0018.720.03335.690.501207.081.7880.050.12
Baise219.990.334119.936.096231.849.21875.371.2914.860.02
Laibin14.640.021519.772.252774.714.101192.221.763.960.01
Guigang9.270.011075.401.592854.204.221430.102.1131.910.05
Nanning0.070.0010.670.02166.010.25433.760.6418.710.03
Chongzuo96.630.142960.164.384163.856.153021.744.47101.210.15
Yulin0.000.005.050.0143.510.0668.310.100.430.00
Qinzhou0.000.000.000.000.000.000.930.002.420.00
Total451.100.6719,097.1628.2334,231.4350.6013,485.5519.93390.890.58
Publisher’s Note: MDPI stays neutral with regard to jurisdictional claims in published maps and institutional affiliations.

