Abstract
Recent advances in material science and self-sensing technology have enabled the development of cement-based nanocomposite sensors that detect the damage on their own by exhibiting piezoelectric properties corresponding to the response of the structures. The present study involves the development and implementation of these sensors in the structural components and monitors the response by correlating the piezoelectric properties of the sensors with the stress-strain response to identify the potential damage. For this purpose, the carbon fiber (CF) and multiwalled carbon nanotubes (MWCNT) are used as nanofiller in the cementitious matrix to develop the self-sensing sensors. These sensors possess high strength, large elastic modulus, and piezo resistivity properties, which make them promising smart sensor materials for structural health monitoring applications. Two example applications involving the beam and column as the structural components are used for the experimentation. After embedding the sensors into the structural components, the response is evaluated in the form of resistance versus load. The self-sensing sensor is capable of detecting the nanostructural cracks during the loading of the system. Based on the severity of loading, the resistivity will indicate the damage state of the structural component which helps in deciding the suitable retrofitting strategies for the maintenance of the structural component to elongate the service life of the structures. The developed sensors also possess good mechanical and electrical properties and hence they have promising characteristics for real-time health monitoring applications.
1. Introduction
Civil engineering infrastructures are vast assets of any country and require lots of investment in terms of money and time. Usually, the infrastructure will fail due to poor quality materials, poor construction, and lack of maintenance. Therefore, proper precautions need to be taken for the longevity of the structure and the safety of human beings. Various traditional sensors are available such as piezoelectric sensors, ultrasonic sensors, and optical sensors that detect the damages, cracks, and strains in prescribed locations [1,2,3,4]. Innovative methods such as tag recognition and pattern recognition techniques are employed for the measurement of cracks, and macro displacement is used for the monitoring of structures [5,6,7]. The recent era of material science has enabled the carrying out of studies on the development of a smart sensor that can sense on its own any change in load, stress, and strain.
Nanotechnology has become the preferred research area to develop such smart self-sensing composites. Nanomaterials behave as nanofillers in composites, making them self-sensing composite sensors. Nanomaterials such as MWCNT, nanocarbon fiber, nanowires, and graphene possess good electrical properties [7,8,9]. Nanomaterials exhibit electrical resistance or capacitance changes with respect to changes in physical and environmental factors [8,9,10,11,12]. The addition of nanomaterials into the matrix makes them smart self-sensing composites [13,14,15,16]. These nanofillers increase the sensing properties and mechanical strength of the composite. The addition of carbon fibers has an effect on the electrical properties of the composite, depending upon the conductivity of the matrix [17,18,19]. The piezoresistivity of the carbon nanotube (CNT) in the cement matrix is influenced by the various factors such as manufacturing procedure, loading patterns, resistance measurement, and environmental conditions. It has been found that conductive and non-conductive phases of the above composite significantly influence the piezoresistivity properties, depending upon the optimal content of the CNT [20,21,22]. Wenkui Dong et al. [23] revealed that impact load causes sudden resistivity growth for CNT/cementitious composites. The higher impact energy applied, the larger resistivity increase composites were observed. Similarly, the inclusion of MWCNT into the polymer and cement matrix improves the compression strength as well as the self-sensing properties [24,25,26,27]. The electrical resistance of cement based nano composite significantly influenced by the type of cement matrix used such as cement paste, concrete and cement mortar. Since the electrical resistance of these composites depends upon the type loading like compression, tensile and dynamic including width of cracks [28,29].
Reza F et al. [30] examined the magnitude of the change in resistance during elastic compression loading for carbon fiber cement composite. They revealed that variation in resistance depends upon stress-strain characteristics of the material, initial loading, and shrinkage effect. The temperature and moisture content of the materials have an impact on the variations of the electrical resistance, strain gage factors and crack sensitivities with repsect to applied loads [31,32]. Faizeah et al. [33] have studied the effect of the addition of CF and MWCNT. They observed that with an increase in compression load, the resistivity decreases. CF and MWCNT have piezoresistive and conductive properties, so these materials can sense microcracking in structures. O. Galao et al. [34] focused on the behaviors of carbon fiber in a cement matrix. They found that strain sensing properties in cement nanocomposite were observed at 28 days and that the loading rate did not affect the sensing properties of cement nanocomposite. The sensitivity (gage factor) of the cement nanocomposite increased with the maximum compressive load applied. The addition of carbon fiber into composite will act as a bridge between the cracks unless the crack width is of a critical flaw size [35,36]. If carbon fiber is reinforced into cement composite, it will behave as a damage sensor [37,38]. Hence, the presence of CF significantly increases the electrical conductivity of the cement [39,40,41].
From the literature review, it has found that the addition of nanomaterials into the cement paste modifies the self-sensing capability of cement, which can be used as a nano-modified cementitious sensor by correlating the electrical properties with the mechanical properties. However, grey areas still need to be addressed regarding the optimum dosage of nanomaterials to obtain the percolation threshold value of the mechanical and electrical properties. Limited studies have been conducted on the behavior of nanocomposite sensors embedded into structural elements. Hence, an attempt has been made in the present study to carry out a detailed analysis of the mechanical properties, electrical properties, and micro structural assessment of the self-sensing composite sensor by varying the percentage of nanofillers by weight of cement to understand their behavior in real time structural components. Based on the experimental results, it is concluded that a cement-based self-sensing nano composite is capable of predicting the health of structural components by exhibiting piezoresistivity properties corresponding to structural behavior. These results are very helpful in deciding suitable retrofitting strategies for maintenance, thereby increasing the service life of structures.
2. Experimental Campaign
This section presents materials and methodology adopted to develop the self-sensing cement-based nanocomposite sensors. The samples were prepared by adding MWCNT and carbon fiber into a cement matrix, and electromechanical tests were carried out to investigate the piezoresistivity properties of composites by applying the mechanical load.
2.1. Materials
Cement-based nanocomposites were prepared using ordinary Portland cement 43 grade as a matrix. Multi-walled carbon nanotube (MWCNT) and carbon fibers (CF) were used as nanofillers. The MWCNT was procured from M/n United Nanotech, India, and the carbon fiber was sourced from Arrow tex, India. The properties of Cf and MWCNT are listed in Table 1 and Table 2. Cement based nano composite cubes of size 50 mm × 50 mm × 50 mm and beams of size of 20 mm × 20 mm × 80 mm were casted using the above materials. Steel mesh was used as an electrode to measure the electrical resistivity of the composites during the electromechanical test.

Table 1.
Properties of Carbon fiber.

Table 2.
Properties of MWCNT.
2.2. Methodology
MWCNT and carbon fiber were used as nanofillers in the cement matrix. MWCNT particles are held by strong Van der Waals forces, hence the dispersion of MWCNT is necessary to reduce the Van der Waals forces between MWCNT for uniform mixing into the cement paste. The dispersion of MWCNT is carried out by a sonication method. Initially, the required amount of MWCNT is weighed and added to the calculated amount of distilled water (100 times of the weight of MWCNT) in a beaker. Due to the hydrophobic nature of MWCNT, it requires heating to reduce the surface tension. Therefore, the beaker was kept in an oven for approximately one minute. Thereafter, sonication was carried out with the help of a probe sonicator for approximately 4 min. The sonicated MWCNTs were added to the cement matrix by varying the percentage of the weight of the cement. The carbon fiber was chopped into 2 mm length and added to the above cement paste with the required amount of water. This mixture was poured into the prescribed molds to prepare the samples. The samples were prepared varying the percentage of MWCNT and carbon fibers by weight of cement as per Table 3 and Figure 1. The two numbers of steel mesh were used as electrodes and inserted with 1 cm distance between them at the center of the samples as shown in Figure 1b. Cement-based nanocomposite cube sensors with a size of 50 mm × 50 mm × 50 mm were prepared for a compression test as per ASTM C109. Similarly, the beam sensor samples with a size of 20 mm × 20 mm × 80 mm as per ASTM C293 were prepared for a flexural test. In the last step, the specimens were demolded after 24 h and kept for curing for 28 days; electro-mechanical and electrical tests were also conducted.

Table 3.
The various proportion of MWCNT and CF.
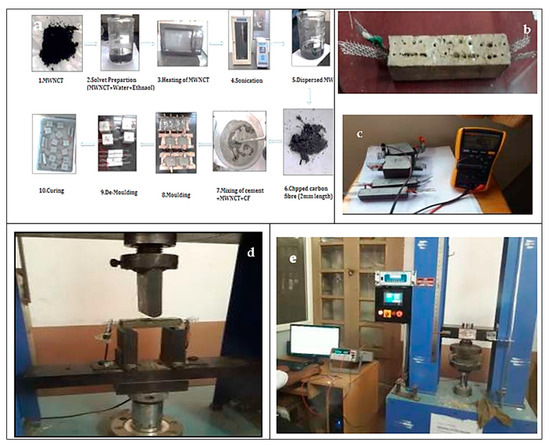
Figure 1.
(a) The preparation process of samples with MWCNT and CF; (b) Beam sensor with steel mesh as electrode; (c) Test setup for electrical resistance using digital multimeter; (d) Test set up for flexural test on beam sensors; (e) Test set up for compression test using UTM of 10-Ton capacity on cube sensors.
2.3. Electro-Mechanical Tests
The multimeter N- 115/138/30 was used to measure the resistance of the cement nanocomposite specimens during the curing period. The probes of the multimeter were connected to the electrodes by crocodile clips, as shown in Figure 1c. To study the electrical properties of the composite, the Agilent digital multimeter 34,401 A was used to measure the variation in resistance by applying the mechanical load to the specimen. The probes of the multimeter were connected to the steel mesh by crocodile clips. The mechanical tests, such as the compression test on the cube sensors and the flexural test on the beam sensors, were carried out using a UTM of 10-ton capacity with a loading rate of 1 mm/min. as shown in Figure 1b,c. Figure 2 illustrates the electromechanical test setup for specimens.
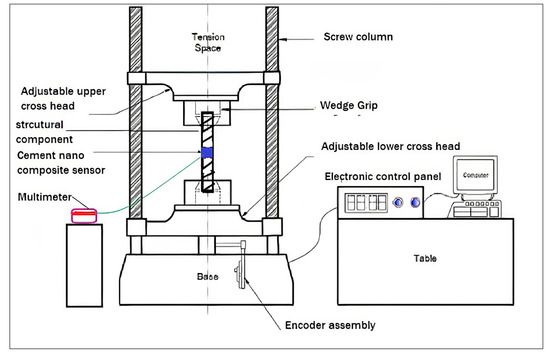
Figure 2.
Schematic diagram of electromechanical test set up.
2.4. Characterization’s Techniques
Microstructural analysis was carried out to ascertain the effect of the prepared samples of nanomaterials and carbon fibers on mechanical and electrical properties. Different characterization techniques were used to understand the morphology and elemental decomposition of the prepared sample. Scanning electron microscopy was performed on the sample using JEOL (Model: JSM-IT500) with an EHT of 10 kV and a working distance of 7.5 mm with a 2500× magnificent factor to obtain the morphological characteristics of the composition. X-ray diffraction was conducted using an (XRD) Phillips-3710 for powder by X-ray diffractometer in the 2θ range 10° to 100° using CuKα1 radiation (λ = 1.54056 Å) to analyze the elemental composition. Fourier transform infrared spectroscopy was performed on the sample using Nicolet 6700 with a resolution of 4.0 cm−1, obtaining peaks in the range of 400.1632 cm−1 to 3999.7039 cm−1.
3. Results and Discussions
3.1. Micro Structural Analysis
3.1.1. Scanning Electron Microscope
The scanning electron microscope (SEM) results with energy dispersive X-Ray spectroscopy EDS of Samples (1) to (5) are presented in Figure 3. The Figure 3 indicates, the dense formation of the matrix due to the addition of nanomaterials into the cement matrix. Since Portland cement is a porous material, the addition of nanomaterials into the matrix will fill all the pores of the cement matrix, hence the strength of the matrix increased and shrinkage cracks decreased. From images S1 to S5, it is observed that steering fillers are well dispersed and there is good bonding between the nanoparticles and the cement matrix. However, in some places, there is a formation of agglomerate and the presence of an identical slight quantity of MWCNT and CF, as shown in S1, S2, S3, and S4. This is due to the strong Van der Waals forces between the MWCNT particles, hence effecting the conductive networks. The sample S1 indicates the agglomerate of MWCNT around C-S-H gel in a few places compared to other samples, as it contains only cement paste and MWCNT. When carbon fibers are added into the cement matrix with the MWCNT provides better formation of the conductivity network. The Figure 3S6 sample shows the SEM image at 10 μm. From the EDS results, as per Figure 4 and Table 4, the higher percentage peaks were observed for the presence of Carbon (C), Silicon (S), and Oxides (O). The presence of a higher percentage of carbon content is responsible for inducing the conductivity properties in a composite.
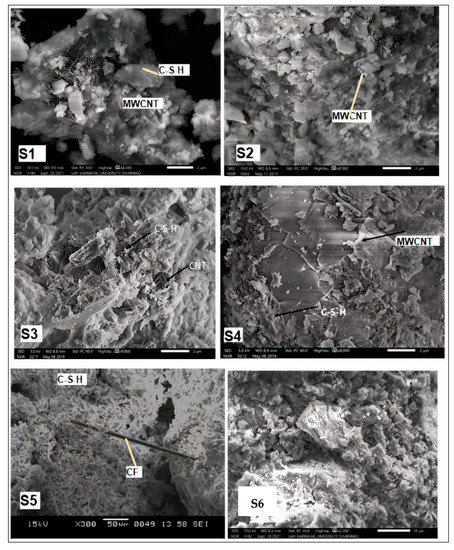
Figure 3.
Scanning electron microscope (SEM) images of Samples.
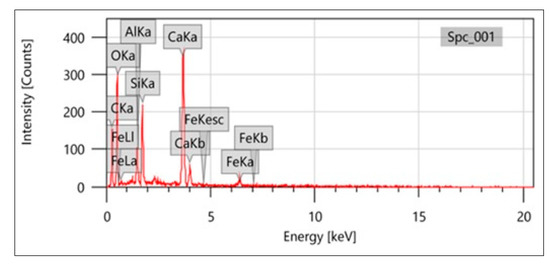
Figure 4.
EDS test result indicating the elemental composition.

Table 4.
Chemical characterization of composite.
3.1.2. X-ray Diffraction
X-ray diffraction (XRD) data for the cement nanocomposites are shown in Figure 5a. Initial comparison of the peak intensities between nanocomposite samples (S1 to S5) provides some insights on their relative compositions. The properties of intent specific phase groups are seen by the increased peak intensities in the cement composite. X-ray powder diffraction (XRD) graphs all samples (S1 to S5), relatively showing the similar composition of gypsum, carbon (MWCNT, CF), alite, calcite, ferrite, and oxides. The XRD graph Figure 5a. represents the fact that developed cement nanocomposites are amorphous in nature, hence these cement nanocomposites possess conductivity properties.
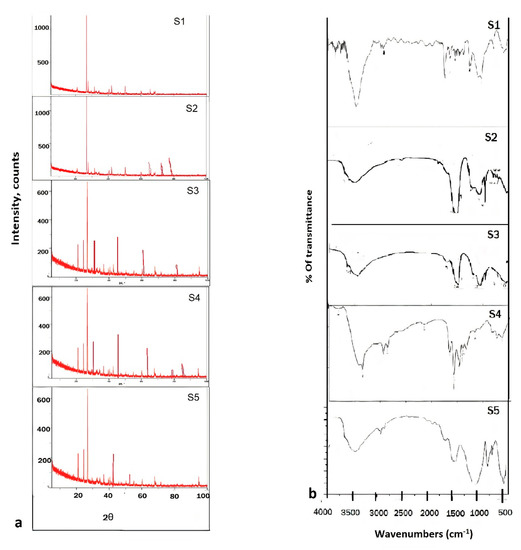
Figure 5.
(a) X-ray powder diffraction (XRD) graphs of Samples (S1 to S5) (b) Fourier-transform infrared spectra of Samples (S1 to S5).
3.1.3. Fourier-Transform Infrared Spectroscopy
Figure 5b presents the Fourier-transform infrared spectra (FTIR) of cement nanocomposite for samples S1 to S5, with peaks at 1480 cm−1 to 1684 cm−1. These are instigated by the twisting vibration of water in sulphates (SO2−4) and gypsum (CaSO. 4. 2H2O). The peaks at 3440 to 3500 cm−1 are instigated by the vibration of water in gypsum (CaSO. 4. 2H2O), and the peak at 3645 cm−1 is possibly basanite (CaSO. 12H2O or 2CaSO. H2O). The absorption intensities are owing to the vibration mode of OH at ~1790 cm−1. Spectral intensity alterations are observed after ~785 cm−1 towards ~988–1118 cm−1, neither connected by SO2−4 nor H2O, reminiscent of rearrangements in the silica subsystem. The peak at 3642–3890 cm−1 corresponds to Ca (OH)2, which is formed as silicate phases in the cement dissolve. The peaks at 1635 cm−1, 1793 cm−1, 2359 cm−1, and 2927 cm−1 are due to the portion of oxides.
3.2. Mechanical Properties
From the electromechanical tests, load vs. deflection graphs are plotted as shown in Figure 6c,d. Mechanical properties such as compressive strength, flexural strength, toughness index, and ductility index are calculated to ascertain the effect of nanomaterials on a prepared nanocomposite sensor. From the experimental results, the ductility and toughness index are calculated for prepared cement-based nanocomposite sensors by determining the area under the load deformation curve. Table 5 represents the ductility indices values for different compositions. It was observed that in the case of the beam sensor, the ductility index was found to be highest for cement paste + 0.1%CF composition (S1). Similarly, in the case of the cube sensor, the cement paste + 0.025% MWCNT + 0.075%CF (S4) composition possesses the highest ductility index compared to the others. From Table 6, it is observed that cement paste + 0.1%CF composition of cube sensor and cement + 0.05%MWCNT + 0.05%CF composition of beam sensor shows the highest toughness index among other combinations of sensors. It is also observed that the increase in ductility and toughness index for the above composite also increases the load carrying capacity and flexural strength, as shown in Figure 6a–d. This is due to the addition of nanomaterials, which fills up the gap between the pores of the cement matrix and increases the surface area of the matrix [18,19,20]. Therefore, the energy absorbing capacity of the composite increases as a greater amount of load is carried by the fiber, which resists the crack propagation, leading to the enhancing of the mechanical properties of the composite. This cement-based nanocomposite sensor is embedded into the structural elements; hence, they need to possess sufficient strength to withstand the external load. Therefore, the composites with the highest ductility and toughness will be considered for application studies, as explained in Section 4.
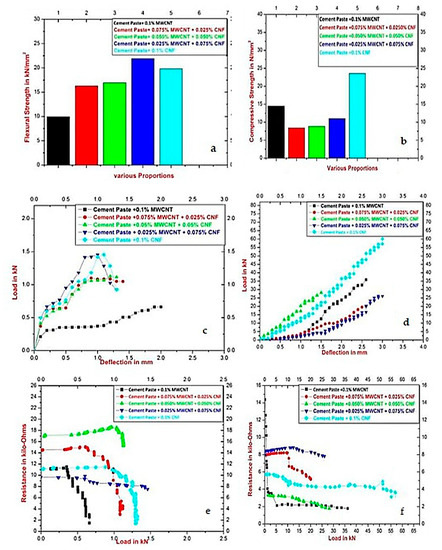
Figure 6.
(a) Flexural strength for various beam sensors specimens S1 to S5; (b) Compressive strength for cube sensors specimens S1 to S5; (c) Load verses deflection for various beam sensors specimens; (d) Load verses deflection for various cube sensors specimens; (e) Resistance verses load for beam sensors specimens S1 to S5; (f) Resistance verses load for cube sensors specimens S1 to S5.

Table 5.
Ductility Index.

Table 6.
Toughness index.
3.3. Electrical Properties
As per the electromechanical test results, the load versus resistance graphs were plotted as shown in Figure 6e,f. The graphs indicate that, by the addition of nanofillers to cement paste, the piezoresistive properties of cement paste can be achieved. These nanofillers have excellent electrical properties and the addition of these nanofillers to cement paste makes them self-sensing composites [11,12,13,14]. The addition of water to cement paste forms calcium silicate hydrate (C-S-H) gel. Since cement is porous in nature, this porosity of the cement is filled up by the nanofiller (MWCNT and CF) and trapped by C-S-H gel, resulting in the formation of a mesh kind of network within the cement matrix. When the loads are applied to the cement nano composites, they will act as solid blocks, and the loads will be transferred from the C-S-H gel to the nanofillers, which disturbs the electrical network, leading to the change in the resistance. Figure 6e,f shows that all the specimens indicate changes in resistance with respect to the application of loads. From the Figure 6a,e drop in the resistance is found at the initial level of loading for all composition sensors except cement paste + 0.025%MWCNT + 0.075%CF composition. This phenomenon can be explained with the percolation threshold theory. This is due to the fact that particular composition sensors consist of greater of amounts of carbon fiber and will be unable to mix uniformly into a cement matrix. The interaction of CF with MWCNT particles forms the agglomeration at certain places in the cement matrix, as seen in Figure 3. Due to this, when this composition is subjected to flexural loading, all fibers expand, creating an ineffective path for current flow, hence decreases in resistance value and less sensitivity to applied loads compared to other compositions of sensors. In a similar way, from Figure 6f, it is observed that a drop in resistance is observed for a cement paste + 0.1%MWCNT composition sensor. This is due the fact that this particular composition sensor consists only of MWCNT. When a composite is subjected to compression loading, all MWCNT particles come closer to forming conductive networks within themselves, and an increasing resistivity path leads to a decrease in the resistance value compared to other composition sensors. Due to the continuous application of compression loading, these conductive networks show disturbances, and later on, variations in resistance are observed.
Hence, accordingly, from the above electromechanical results, the percolation threshold value for the beam nano composite sensor is considered as cement paste + 0.05%MWCNT + 0.05%CF, and similarly, cement paste + 0.1% MWCNT cube nano composite exhibits better electrical properties. Thus, these composition sensors exhibit better electronic properties compared to the composition sensor. Thus, these sensors are embedded into the structural component to understand the response structure under the failure load for damage detection purposes, as explained in Section 4.
4. Application Studies for Real Time Structural Elements
4.1. Preparation of Samples
From the above experimental results, it was concluded that cement paste + 0.1%MWCNT and cement paste + 0.05%MWCNT + 0.05%CF exhibit better mechanical and electrical properties. Hence, structural elements such as beams and columns of size 100 mm × 100 mm × 500 mm were casted by embedding these compositions of cement nanocomposite sensors at the mid-point, as shown in Figure 7b,c. The midpoint is subjected the maximum deflection and cracks initiate from this point; hence, nanocomposite sensors exhibit piezoresistive properties by showing variations in resistivity with respect to load to detect the damage. M25 concrete is used to cast the structural element with a mix proportion of 1:1.33:2.92 as per IS 10262-2009. Curing is carried out for 28 days, and later on, tests were conducted to assess the embedded sensor’s response to the mechanical loads.
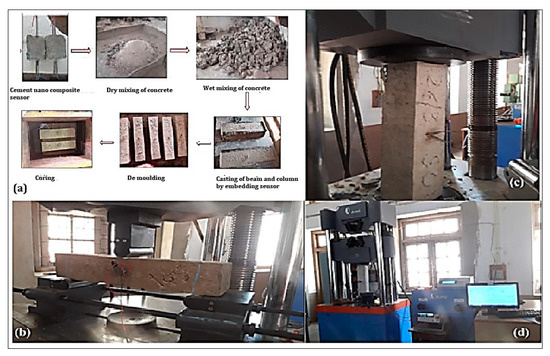
Figure 7.
(a) Preparation of structural component beam and column by embedding cement-based sensor (b) Test set up for flexural test on beam (c) Test set up for column subjected compression load (d) UTM of 100-ton capacity.
4.2. Electro-Mechanical Tests on Structural Component
Electromechanical tests were conducted on the beams and columns by measuring the resistance with respect to the increase in the applied load. A compression test on the column was carried out using UTM of 100-ton capacity as shown in Figure 7b. Two crocodile clips were attached to the two opposite ends of the electrode (steel mesh) and connected to am Agilent digital multimeter to measure the change in resistance. In a similar manner, a flexural test with a three-point loading method was carried out for the beam, as shown in Figure 7c. Testing was performed as per IS 516-1959.
4.3. Mechanical Properties of Structural Components
From the experimental results, the load vs. deflection graphs are plotted for the beams and columns embedded with the above-specified sensors, as shown in Figure 8a,b. The mechanical properties such as compressive and flexural strength, toughness index, and ductility index are calculated to ascertain the effect of a cement nanocomposite sensor for the mechanical properties of structural elements. From Table 7, it was observed that the ductility and toughness index was highest for beams and columns embedded with cement paste + 0.05% CF + 0.05% MWCNT. Hence, the load carrying capacity is increased for structural components embedded with these composition sensors.
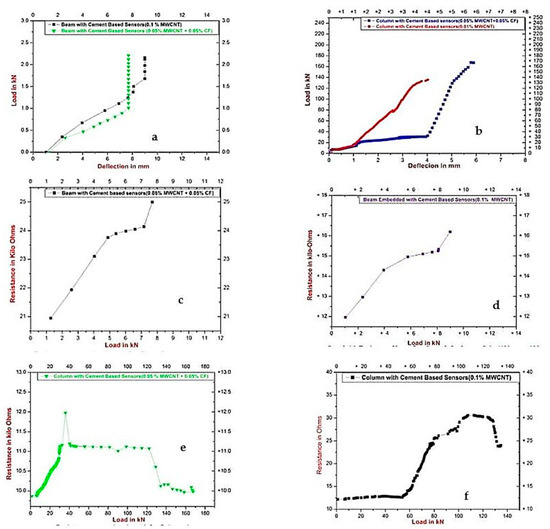
Figure 8.
(a) Load verses deflection for beams embedded with cement-based sensors; (b) Load verses deflection for columns embedded with cement-based sensors; (c) Resistance versus loads for beams embedded with cement-based sensors (Cement paste + 0.05%MWCNT + 0.05%CF); (d) Resistance versus loads for beams with cement-based sensors (Cement paste + 0.1%MWCNT); (e) Resistance versus loads for columns with cement-based sensors (Cement paste + 0.05% MWCNT + 0.05%CF); (f) Resistance versus loads for columns with cement-based sensors (Cement paste + 0.1%MWCNT).

Table 7.
Ductility and toughness indices for beams and columns embedded with cement-based sensors.
4.4. Electrical Properties of Structural Component Embedded with Cement-Based Sensors
The resistance versus load graph of the structural components (beam and column) embedded with cement-based nano composite sensors indicates z variation in resistance under the loads, as presented in Figure 8c–f. Initially, an increase in the resistance is found, and later on a decrease in resistance is found. However, under the failure load, small increments in the resistance value are observed, as shown in Figure 8c–f. This is due to structural components being subjected to large amounts of load, as a result of which electrical networks that were formed between the nanomaterials were broken, leading to the increase in resistance. Due to continuous loading, the failure of the structures includes crack formations. During this phenomenon, all the nanomaterials will come closer, and again there will be a formation of an electrical network, which increases the conductivity path, hence resistance decreases. However, at the time, the failure load reached all networks, causing breaks, hence an increase in the resistance was observed. Thus, we can conclude that under the failure load, small incremental resistance occurs, which will help to identify the damage and collapse of the structural component. The cement-based nanocomposite embedded sensor has greater strength than the structural element, as explained above. When the structure fails, these sensors exhibit piezoresistive properties by showing variation in resistance. This property is useful for monitoring the health of the structures.
5. Conclusions
From the above experimental study, it is observed that addition of nanomaterials into a cement matrix makes them conductive materials, leading them to become self-sensing smart materials. The carbon fibers and multi-wall carbon nanotubes dispersed well in the cement matrix, enhancing the mechanical as well as the electrical properties. These nanomaterials fill up the pores of matrix, and when these composites are subjected to external loading, e.g., flexural and compression, the conductive networks will form within themselves. Hence, it become possible to co-relate changes in stress and strain with respect to the resistance. When these composites were embedded into structural elements such as beams and columns, they exhibited piezoresistive properties. The dosage of nanomaterials also plays an important role in electrical properties. From the present study, it has been concluded that the dosage of nanomaterials and type of loading play crucial roles in the sensitivity of the resistance. Hence, the percolation value has a greater impact on the piezoresistive properties. From the present studies, nano composite sensors with cement paste + 0.05%MWCNT + 0.05%CF provide a greater conductivity path for structural elements. This composition can be used as baseline for future studies. These sensors are embedded into structural elements, which enhances the load carrying capacity of structures and at the same time gives a warning regarding the formation of internal cracks by exhibiting the change in variation in resistance. Due to this, cement-based nanocomposites are promising smart self-sensing sensors for health monitoring purposes. Hence, these sensors have potential applications for real-time structures, as they do not need any external electrical supply and they can measure the damages by indicating change resistance with respect to applied physical loads and environmental factors.
Author Contributions
Author Contributions: Conceptualization, A.K.R. and A.M.H.; methodology, A.K.R. and A.M.H.; validation, A.K.R.; formal analysis, A.K.R. and R.R.M.M.; investigation, A.K.R., R.R.M.M. and A.M.H.; writing—A.K.R.; writing—review and editing, A.K.R. and A.M.H.; visualization, A.K.R. and A.M.H.; supervision, A.M.H. All authors have read and agreed to the published version of the manuscript.
Funding
This research received no external funding.
Institutional Review Board Statement
Not applicable.
Informed Consent Statement
Not applicable.
Data Availability Statement
Not applicable.
Acknowledgments
The authors A. K. Roopa and A. M. Hunashyal are acknowledged to KLE Society and KLE Technological University for providing support for this research. Also, we wish to recognize the contributions of S. V. Ganachari and post graduate student R. M. Rahila to the completion of this research work.
Conflicts of Interest
The authors declare no conflict of interest.
References
- Chakraborty, J.; Wang, X.; Stolinski, M. Damage Detection in Multiple RC Structures Based on Embedded Ultrasonic Sensors and Wavelet Transform. Buildings 2021, 11, 56. [Google Scholar] [CrossRef]
- Chakraborty, J.; Katunin, A. Detection of structural changes in concrete using embedded ultrasonic sensors based on autoregressive model Diagnostyka. PSTD 2018, 20, 103. [Google Scholar]
- Ai, D.; Zhu, H.; Luo, H. Sensitivity of embedded active PZT sensor for concrete structural impact damage detection. Constr. Build. Mater. 2016, 111, 348–357. [Google Scholar] [CrossRef]
- Zhang, J.; Huang, Y.; Zheng, Y. A Feasibility Study on Timber Damage Detection Using Piezoceramic-Transducer-Enabled Active Sensing. Sensors 2018, 18, 1563. [Google Scholar] [CrossRef] [PubMed]
- Mangini, F.; D’Alvia, L.; Del Muto, M.; Dinia, L.; Federici, E.; Palermo, E.; Del Prete, Z.; Frezza, F. Tag recognition: A new methodology for the structural monitoring of cultural heritage. Measurement 2018, 127, 308–313. [Google Scholar] [CrossRef]
- Mangini, F.; Dinia, L.; Del Muto, M.; Federici, E.; Rivaroli, L.; Frezza, F. Study of optical tag profile of the tag recognition measurement system in cultural heritage. J. Cult. Heritage 2020, 45, 240–248. [Google Scholar] [CrossRef]
- Fallahian, M.; Ahmadi, E.; Khoshnoudian, F. A structural damage detection algorithm based on discrete wavelet transform and ensemble pattern recognition models. J. Civ. Struct. Heal. Monit. 2022, 12, 323–338. [Google Scholar] [CrossRef]
- Han, B.; Ding, S.; Yu, X. Intrinsic self-sensing concrete and structures: A review. Measurement 2015, 59, 110–128. [Google Scholar] [CrossRef]
- Rainieri, C.; Song, Y.; Fabbrocino, G.; Mark, J.S.; Shanov, V. CNT-cement based composites: Fabrication, self-sensing properties and prospective applications to Structural Health Monitoring. In Proceedings of the Fourth International Conference on Smart Materials and Nanotechnology in Engineering, Gold Coast, Australia, 10–12 July 2013. [Google Scholar]
- Olivera, J.; González, M.; Fuente, J.V.; Varga, R.; Zhukov, A.; Anaya, J.J. An Embedded Stress Sensor for Concrete SHM Based on Amorphous Ferromagnetic Microwires. Sensors 2014, 14, 19963–19978. [Google Scholar] [CrossRef]
- Horszczaruk, E.; Sikora, P.; Łukowski, P. Application of Nanomaterials in Production of Self-Sensing Concretes: Contemporary Developments and Prospects. Arch. Civ. Eng. 2016, 62, 61–74. [Google Scholar] [CrossRef]
- Cao, J.; Wen, S.; Chung, D.D.L. Defect dynamics and damage of cement-based materials, studied by electrical resistance meas-urement. J. Mater. Sci. 2001, 36, 4351–4360. [Google Scholar] [CrossRef]
- Meoni, A.; D’Alessandro, A.; Downey, A.; García-Macías, E.; Rallini, M.; Materazzi, A.L.; Torre, L.; Laflamme, S.; Castro-Triguero, R.; Ubertini, F. An Experimental Study on Static and Dynamic Strain Sensitivity of Embeddable Smart Concrete Sensors Doped with Carbon Nanotubes for SHM of Large Structures. Sensors 2018, 18, 831. [Google Scholar] [CrossRef] [PubMed]
- Dong, W.; Li, W.; Shen, L.; Sun, Z.; Sheng, D. Piezoresistivity of carbon nanotubes (CNT) reinforced cementitious composites under integrated cyclic compression and impact load. Compos. Struct. 2020, 241, 112106. [Google Scholar] [CrossRef]
- Kim, G.M.; Yang, B.J.; Cho, K.J.; Kim, E.M.; Lee, H.K. Influences of CNT dispersion and pore characteristics on the electrical performance of cementitious composites. Compos. Struct. 2017, 164, 32–42. [Google Scholar] [CrossRef]
- Nguyen, D.L.; Song, J.; Manathamsombat, C.; Kim, D.J. Comparative electromechanical damage-sensing behaviors of six strain-hardening steel fiber-reinforced cementitious composites under direct tension. Compos. Part B Eng. 2015, 69, 159–168. [Google Scholar] [CrossRef]
- Chung, D.D.L. Damage in cement-based materials, studied by electrical resistance measurement. Mater. Sci. Eng. R Rep. 2003, 42, 1–40. [Google Scholar] [CrossRef]
- Hunashyal, A.M.; Lohitha, S.J.; Quadri, S.S.; Banapurmath, N.R. Experimental investigation of the effect of carbon nanotubes and carbon fibres on the behaviour of plain cement composite beams. IES J. Part A Civ. Struct. Eng. 2011, 4, 29–36. [Google Scholar] [CrossRef]
- Hunashyal, A.M.; Banapurmath, N.R.; Hallad, S.A.; Quadri, S.S.; Kulkarni, C.; Akshay, P.M. Experimental investigation on the study of mechanical properties and modelling analysis of hybrid composite cement beams reinforced with mulit-walled carbon Nano tubes and glass fibres. Int. J Appl. Eng. Res. 2016, 11, 5128–5131. [Google Scholar]
- Caporale, A.; Feo, L.; Luciano, R. Damage mechanics of cement concrete modeled as a four-phase composite. Compos. Part B: Eng. 2014, 65, 124–130. [Google Scholar] [CrossRef]
- Han, B.; Yu, X.; Kwon, E.; Ou, J. Effects of CNT concentration level and water/cement ratio on the piezoresistivity of CNT/cement composites. J. Compos. Mater. 2012, 46, 19–25. [Google Scholar] [CrossRef]
- Doo-Yeol, Y.; Soonho, K.; Lee, S.H. Self-sensing capability of ultra-high-performance concrete containing steel fibers and carbon nanotubes under tension. Sens. Actuators A Phys. 2018, 276, 125–136. [Google Scholar]
- Dong, W.; Li, W.; Tao, Z.; Wang, K. Piezoresistive properties of cement-based sensors: Review and perspective. Constr. Build. Mater. 2019, 203, 146–163. [Google Scholar] [CrossRef]
- Valvona, F.; Toti, J.; Gattulli, V.; Potenza, F. Effective seismic strengthening and monitoring of a masonry vault by using Glass Fiber Reinforced Cementitious Matrix with embedded Fiber Bragg Grating sensors. Compos. Part B Eng. 2017, 113, 355–370. [Google Scholar] [CrossRef]
- Yu, Y.; Ou, J.; Li, H. Design, calibration and application of wireless sensors for structural global and local monitoring of civil infrastructures. Smart Struct. Syst. 2010, 6, 641–659. [Google Scholar] [CrossRef]
- Dong, S.; Han, B.; Ou, J.; Li, Z.; Han, L.; Yu, X. Electrically conductive behaviors and mechanisms of short-cut super-fine stainless wire reinforced reactive powder concrete. Cem. Concr. Compos. 2016, 72, 48–65. [Google Scholar] [CrossRef]
- D’Alessandro, A.; Rallini, M.; Ubertini, F.; Materazzi, A.L.; Kenny, J.M. Investigations on scalable fabrication procedures for self-sensing carbon nanotube cement-matrix composites for SHM applications. Cem. Concr. Compos. 2016, 65, 200–213. [Google Scholar] [CrossRef]
- García-Macías, E.; D’Alessandro, A.; Castro-Triguero, R.; Pérez-Mira, D.; Ubertini, F. Micromechanics modeling of the uniaxial strain-sensing property of carbon nanotube cement-matrix composites for SHM applications. Compos. Struct. 2017, 163, 195–215. [Google Scholar] [CrossRef]
- Sikarwar, S.; Satyendra; Singh, S.; Yadav, B.C. Review on pressure sensors for structural health monitoring. Photon Sens. 2017, 7, 294–304. [Google Scholar] [CrossRef]
- Reza, F.; Batson, G.B.; Yamamuro, J.A.; Lee, J.S. Resistance Changes during Com-pression of Carbon Fiber Cement Composites. J. Civ. Eng. 2003, 5, 476–483. [Google Scholar] [CrossRef]
- Chung, D.D.L. Review functional properties of cement-matrix composites. J. Mater. Sci. 2001, 36, 1315–1324. [Google Scholar] [CrossRef]
- Teomete, E. The effect of temperature and moisture on electrical resistance, strain sensitivity and crack sensitivity of steel fiber reinforced smart cement composite. Smart Mater. Struct. 2016, 25, 075024. [Google Scholar] [CrossRef]
- Azhari, F.; Banthia, N. Cement-based sensors with carbon fibers and carbon nanotubes for piezoresistive sensing. Cem. Concr. Compos. 2012, 34, 866–873. [Google Scholar] [CrossRef]
- Galao, O.; Baeza, F.J.; Zornoza, E.; Garcés, P. Strain and damage sensing properties on multifunctional cement composites with CNF admixture. Cem. Concr. Compos. 2014, 46, 90–98. [Google Scholar] [CrossRef]
- Sathyanarayanan, K.S.; Sridharan, N. Self Sensing Concrete using Carbon Fibre for Health Monitoring of Structures under Static loading. Indian J. Sci. Technol. 2016, 9, 1–5. [Google Scholar] [CrossRef]
- Zhu, S.; Chung, D.D.L. Theory of piezoresistivity for strain sensing in carbon fiber reinforced cement under flexure. J. Mater. Sci. 2007, 42, 6222–6233. [Google Scholar] [CrossRef]
- Ghafari, E.; Lu, N. Self-polarized electrospun polyvinylidene fluoride (PVDF) nanofiber for sensing applications. Compos. Part B: Eng. 2019, 160, 1–9. [Google Scholar] [CrossRef]
- Li, V.C.; Lim, Y.M.; Chan, Y.-W. Feasibility study of a passive smart self-healing cementitious composite. Compos. Part B Eng. 1998, 29, 819–827. [Google Scholar] [CrossRef]
- Kim, M.K.; Kim, D.J.; An, Y.-K. Electro-mechanical self-sensing response of ultra-high-performance fiber-reinforced concrete in tension. Compos. Part B Eng. 2018, 134, 254–264. [Google Scholar] [CrossRef]
- Xu, J.; Zhong, W.; Yao, W. Modeling of conductivity in carbon fiber-reinforced cement-based composite. J. Mater. Sci. 2010, 45, 3538–3546. [Google Scholar] [CrossRef]
- Wang, Z.; Luo, Y.; Zhao, G.; Xu, B.Q.; Yuan, F.-G. Design of an Orthotropic Piezoelectric Composite Material Phased Array Transducer for Damage Detection in a Concrete Structure. Res. Nondestruct. Eval. 2016, 27, 204–215. [Google Scholar] [CrossRef]
Publisher’s Note: MDPI stays neutral with regard to jurisdictional claims in published maps and institutional affiliations. |
© 2022 by the authors. Licensee MDPI, Basel, Switzerland. This article is an open access article distributed under the terms and conditions of the Creative Commons Attribution (CC BY) license (https://creativecommons.org/licenses/by/4.0/).