Article

Exploration of the Fluorescence Property of Acrylic Fibers Dyed with the Residues Extract of Juglans regia Barks

1
Faculty of Sciences of Monastir, Research Laboratory—Environmental Chemistry and Clean Processes (LR21ES04), University of Monastir, Monastir 5000, Tunisia
2
Department of Early Childhood, University College of Turabah, Taif University, P.O. Box 11099, Taif 21944, Saudi Arabia
3
Laboratoire de Micro-Optoélectronique et Nanostructures (LR99ES29), Faculté des Sciences Monastir, Université de Monastir, Avenue de l’Environnement, Monastir 5019, Tunisia
4
LPCNO, INSA-CNRS-UPS, Université de Toulouse, 31077 Toulouse, France
*
Author to whom correspondence should be addressed.
Sustainability 2022, 14(19), 12275; https://doi.org/10.3390/su141912275
Submission received: 29 August 2022 / Revised: 20 September 2022 / Accepted: 21 September 2022 / Published: 27 September 2022
(This article belongs to the Section Resources and Sustainable Utilization)

Abstract

:
This study aims to check the fluorescence property of acrylic fabrics dyed with Juglans regia bark extract. Fluorescence measurements have been developed on the aqueous extract and acrylic samples. The extraction process was assisted by a microwave with the following conditions: a concentration of 5 g·L−1, a power of 850, a pH of 5 and an extraction duration of 4 min. Afterwards, the dyeing quality was assessed by measuring the color strength (K/S) and the photoluminescence intensity (PL) of acrylic fibers dyed at 350 W for 3 min, with the extract already prepared. The effect of certain factors (pH, power, concentration and duration of dyeing) on the dyeing process was also investigated. Subsequently, this process was optimized thanks to the surface response method in order to maximize the photoluminescence intensity of dyed acrylic fibers. Best dyeing properties were achieved at 500 W, pH 2 for 4 min. The results showed good washing fastness and acceptable light fastness.

1. Introduction

Synthetic substances such as pesticides, dyes and plastics are non-bio-degradable because of their complicated and long structures. Their natural cycle takes a prolonged period to lead to an environmental contamination. For environmental regulation, natural dyes have been exanimated to replace the synthetic ones. They provided part of the pigments used in paint and were also of great importance in the cosmetic, pharmaceutical and food industry [1,2,3,4,5].
The use of natural organic dyes represents a strategic choice whose importance would be wrong to underestimate [6,7,8,9,10,11]. In fact, in the same way as leather, furs and animal and vegetable textile fibers, dye plants are renewable resources of coloring matter. In this research, particular importance should be attached to tinctorial species that are unknown but abundant in Tunisia and in all the Mediterranean countries. In this paper, a special focus is put on the residues of Juglans regia, Juglandaceae, widely known as Persian or English walnut. In traditional medicine, Juglans regia is a valued medicinal plant with a capability to act as an antidote against different diseases.
Thanks to its anti-inflammatory and antioxidant activity [12], the bark of Juglans regia is used as tooth brush. In addition, many countries (Iran, Saudi Arabia, etc.) use this plant as a natural dye (lips coloring). Juglans regia bark extract has also been used to dye wool fabrics [12,13]. Acrylic is one of the fibers that are difficult to dye because of the electrostatic repulsions which can develop between the carboxylate groups COO- of the dyes and sulfonates SO3- of the acrylic. In the case of natural dyeing, this fiber generally requires a chemical modification [14]. However, following preliminary dye tests on an acrylic support, a great affinity was found between the Juglans regia bark residue and the unmodified acrylic fiber; a very important fluorescent aspect characterized the samples.
This work was developed in order to characterize the fluorescence property of acrylic fabric dyed with Juglans regia bark extract, a natural dye. Indeed, this character can disappear as a consequence of the development of new chemical interactions between the dye and the dyed fiber.

2. Materials and Methods

2.1. Preparation of Plant Material

The residues of Juglans regia barks were collected from Fernena (located in the northwest of Tunisia) during March 2018. The plant material fine has been well-rinsed, dried and powdered.

2.2. Extraction Assisted by Microwave

Dry matter (0.5 g) was dissolved in water (100 mL). Process extraction was assisted by microwave at 350 W during 3 min. After extraction, obtained solution was filtered and ready for dyeing.

2.3. Microwave Dyeing Process

The developed microwave dyeing technique [15] consists in impregnating the textile support with the aqueous extract, prepared according to the technique described above, at different dyeing conditions pH, microwave power and duration.

2.4. Dyeing Quality Evaluation

Colorimetric coordinates (L*, a*, b*) and color yield (K/S) [16] were evaluated using a Spectro Flash SF300 spectrophotometer. Imputs were treated by Data Master software (the Datacolor 121 International, Lawrenceville, NJ, USA).

2.5. Evaluation of the Photoluminescence

The photoluminescence was evaluated by a spectrophotometer based on a blue laser. Luminescence spectroscopy refers to any technique that measures luminescence characteristics of a sample. Luminescence is defined as a process in which an emission of electromagnetic radiation (light) of non-thermal origin is generated [17]. The overall luminescence process consists of two main phases: excitation and de-excitation (emission). The photon emission mechanism distinguishes between photoluminescence and phosphorescence. Generally, in the case of photoluminescence, the emission follows the excitation by a very short time (lifespan of the order of 10–8 s). As for phosphorescence, the emission time can vary from a second to several days. Photoluminescence spectroscopy is used in the textile fields to characterize dyes and textile articles dyed with luminescent dyes [18].

2.6. Dyeing Fastness Properties

Fastness to washing (according ISO 105-CO2, 1989) and fastness to light (according ISO 105-B01, 2015) were used to evaluate the fastness properties of the dyed acrylic fabrics.

2.7. Description of the Mordanting Process

Different mordants were used: copper sulphate, iron sulphate, mimosa, tin chloride and tannic acid at a concentration of 3% (w/w relative to the tissue). Two different dyeing methods were used: pre-mordanting and simultaneous mordanting.
In the pre-mordanting process, the fabrics were first immersed in an aqueous mordant solution for 3 min at 350 W, followed by a dyeing step in another bath containing a Juglans regia bark. As for the simultaneous mordanting, the tissues were immersed in an aqueous extract of Juglans regia bark residue with mordants. The dye bath was maintained at pH 3, a power of 500 W and a dyeing time of 3 min. The fabrics were rinsed, pressed and dried [19].

2.8. Statistical Analysis

After identifying the process conditions and product components that affect quality, experimental designs were used to improve the feasibility, reliability, quality and performance of the product in the field. The methodology used to investigate the influence of operating parameters consists in adjusting the value of a parameter while keeping the others fixed.
The results and the experimental study were greatly simplified by using the methodology of the experimental plans. This technique created a statistically significant model of a phenomenon that integrates interactions between variables while reducing the number of trials.

3. Results and Discussion

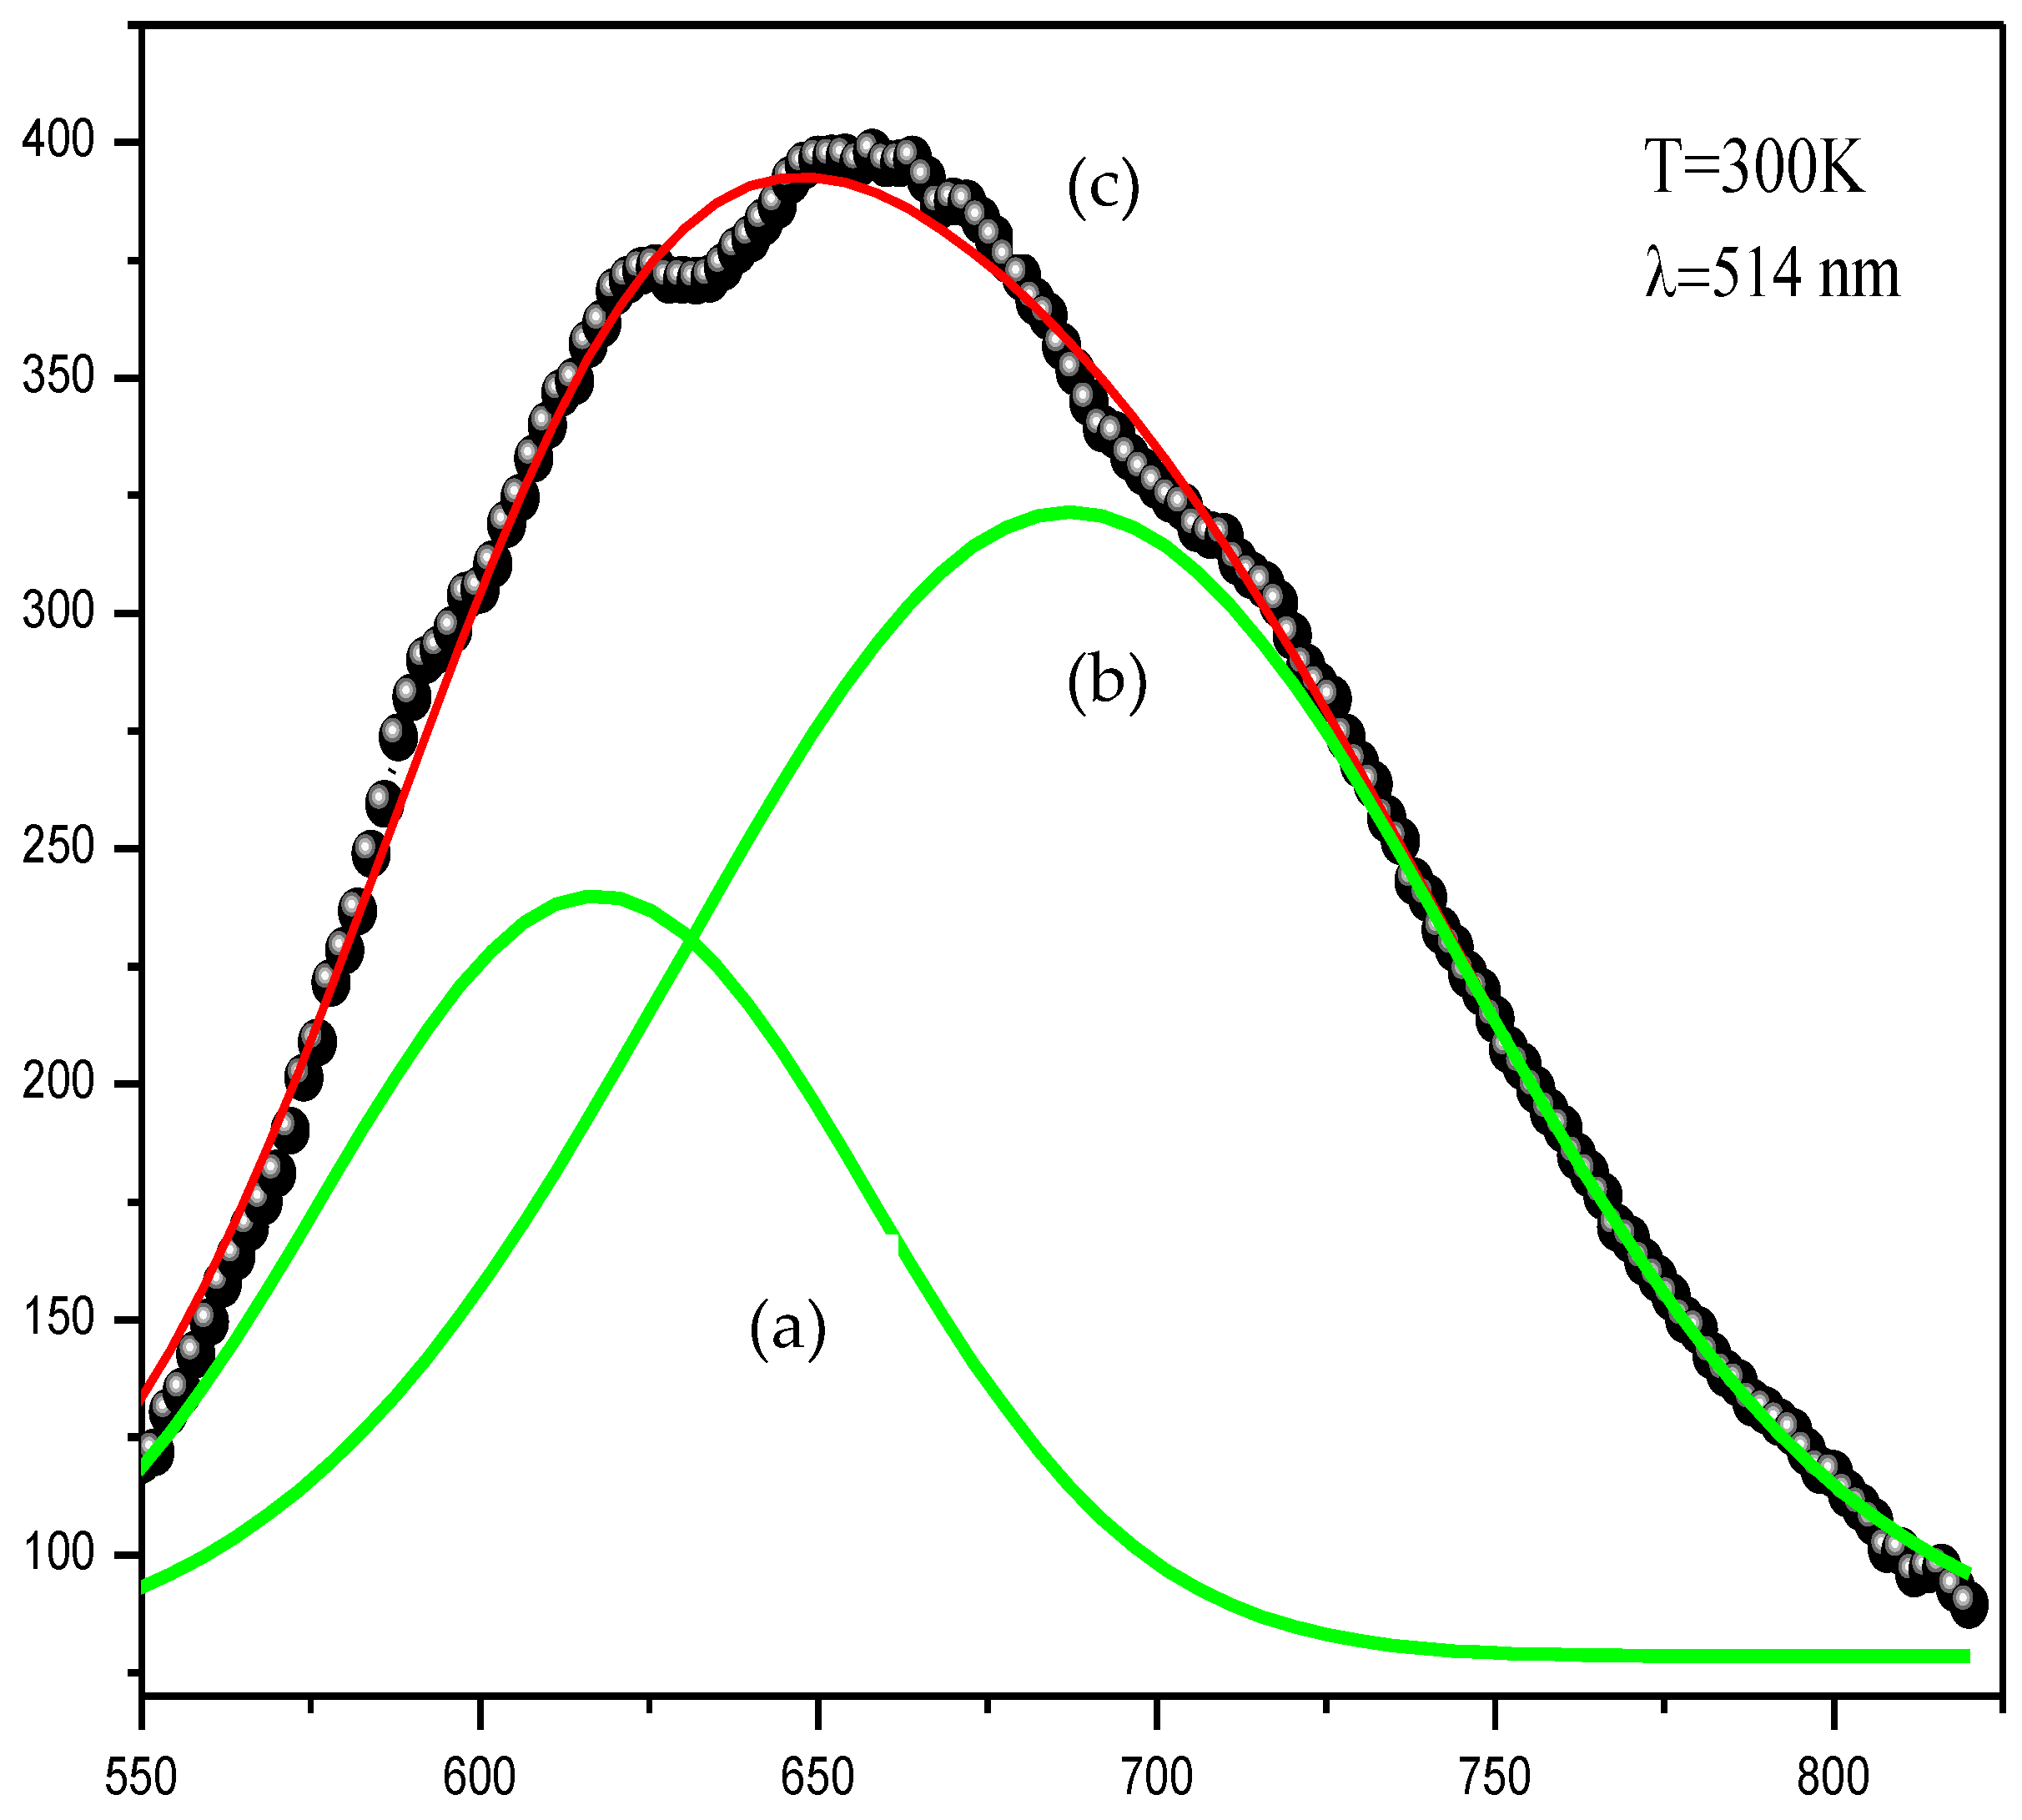
3.1. Bark Residues of Juglans regia Extract Identification by Photoluminescence Spectroscopy

Figure 1 shows two peaks of intense emissions in the region 600 nm–700 nm (flavin region). These peaks could be assigned to tannin and flavonoid. A fluorescent molecule (fluorophore) absorbed light energy (excitation light) and restored it as fluorescent light (emission light). Fluorescent molecules are mostly cyclic and rigid and possess π bonds (delocalization of electrons). Polyphenols are classified as a natural fluorophore [20].

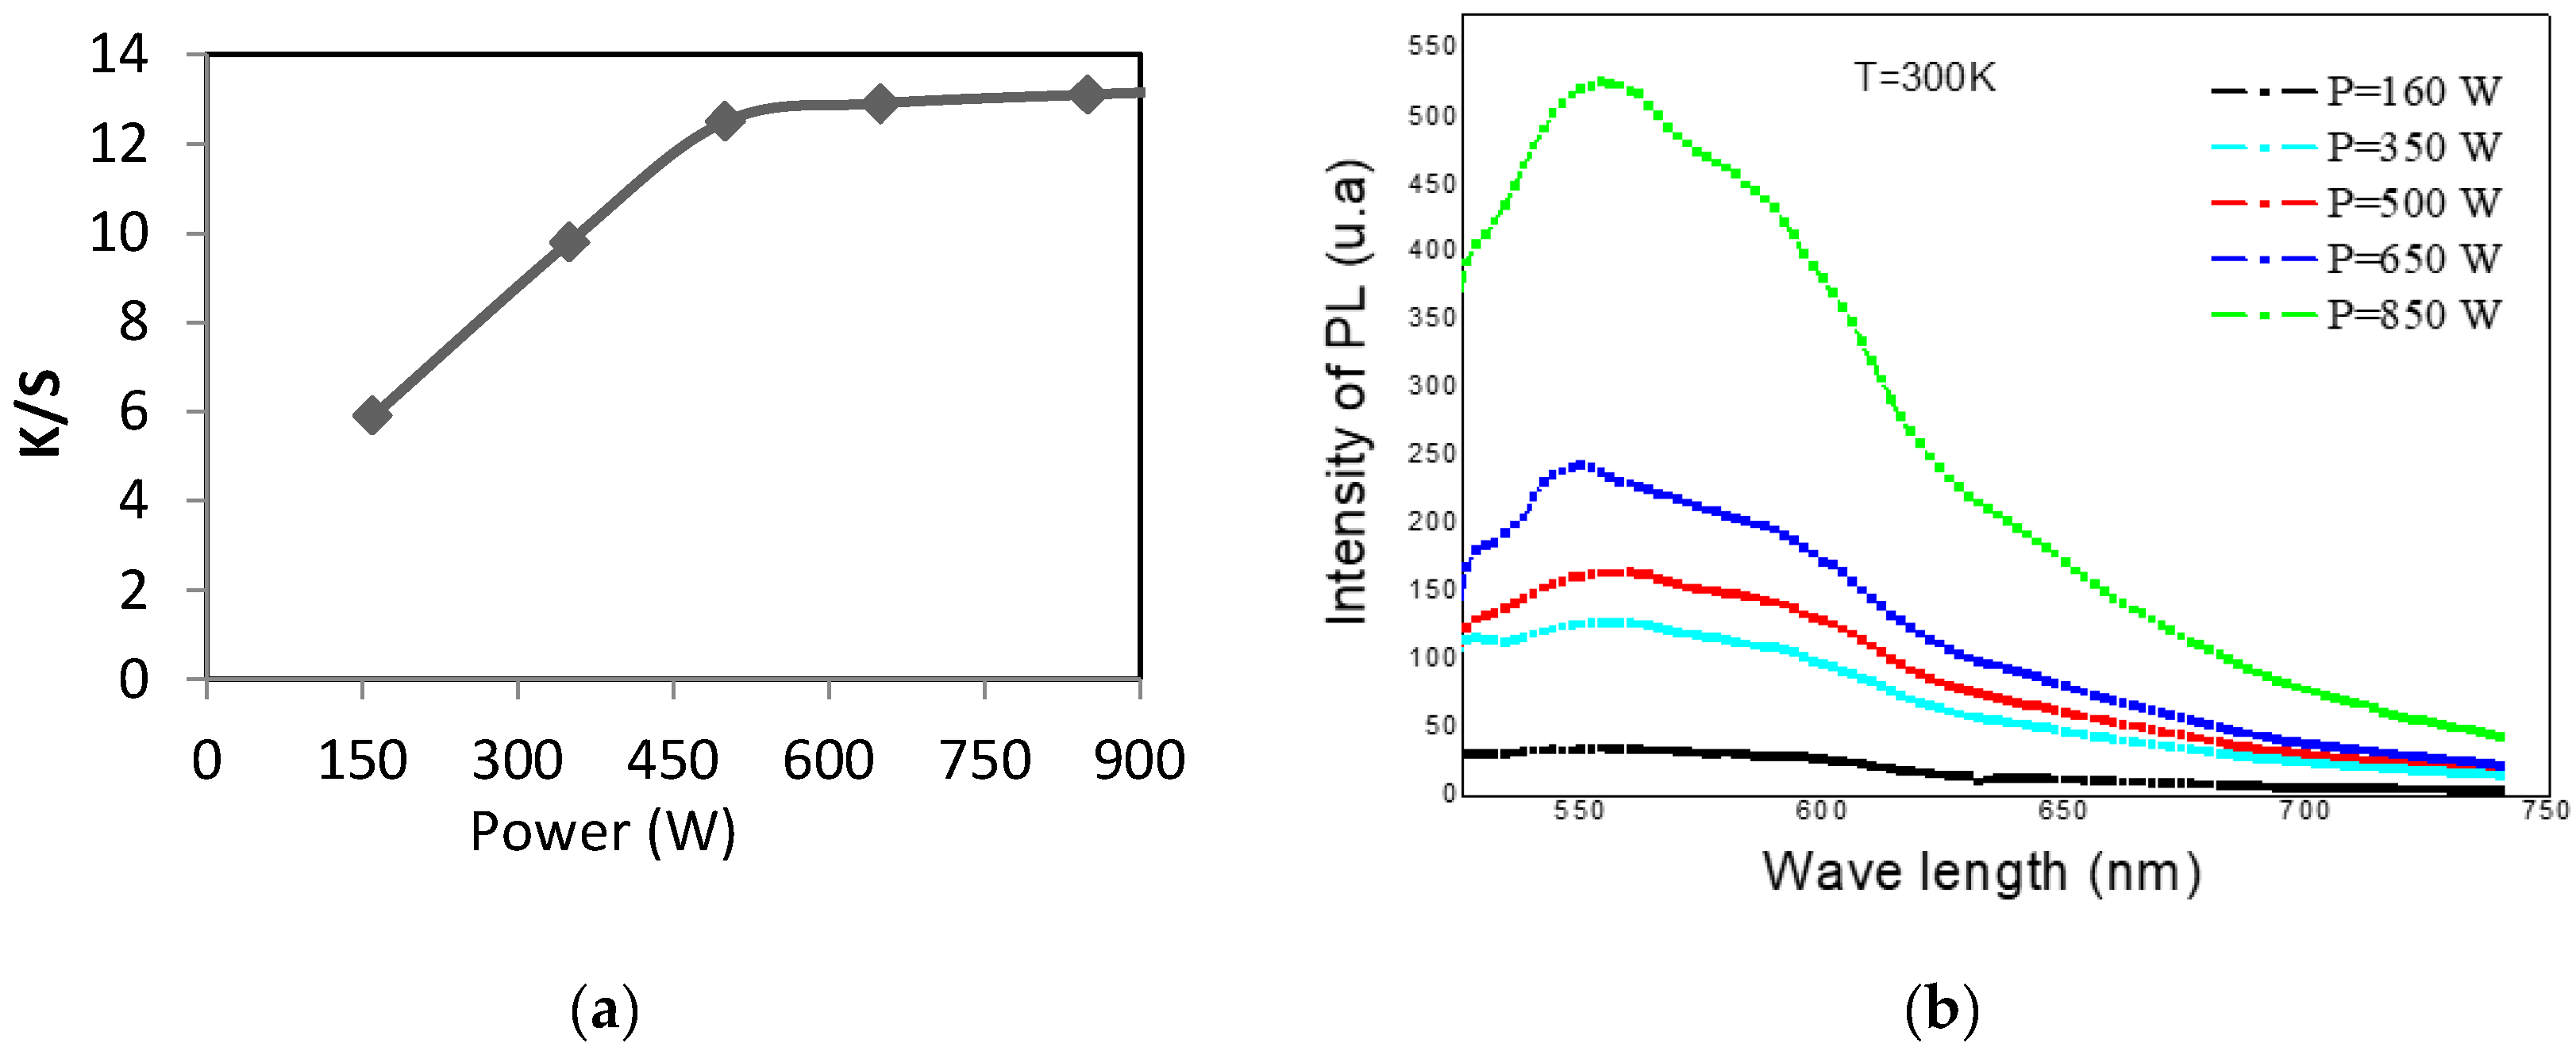
3.1.1. Microwave Power Effect

This part investigates the effect of the microwave power of the dyeing process on the color strength (K/S) and the intensity of photoluminescence.
Effect of microwave power on colorimetric coordinates and color strength:
Color strength (K/S) and colorimetric coordinates (L*, a*, b*, c*, h*) were measured for acrylic fabrics dyed with the bark residues of Juglans regia extract while varying the microwave power. The results are shown in Table 1. It could be noticed that L* decreased with the increase in microwave power, which proves that acrylic fabrics became darker. For b*, an increase was observed, proving a turn to yellow.
The color strength increased with increasing the microwave power and reached a value of K/S = 12.5 for a power of 500 W. Beyond this power, K/S remained constant.
As the microwave power was increased, the swelling of the acrylic fibers and the degradation of the aggregates of the dye molecule in the solution became more important. Thus, to minimize any deterioration of the acrylic, a power of 550 W was adopted.
Effect of microwave power on photoluminescence
According to Figure 2, the increase in microwave power positively influences the intensity of photoluminescence (PL), The maximum value of PL was of the order of 520 (u.a) for a microwave power of 850 W, whereas for a microwave power of 160 W, the intensity of photoluminescence (PL) was almost zero. Hence, the evolution of the intensity of photoluminescence (PL) depends on the color strength (K/S).

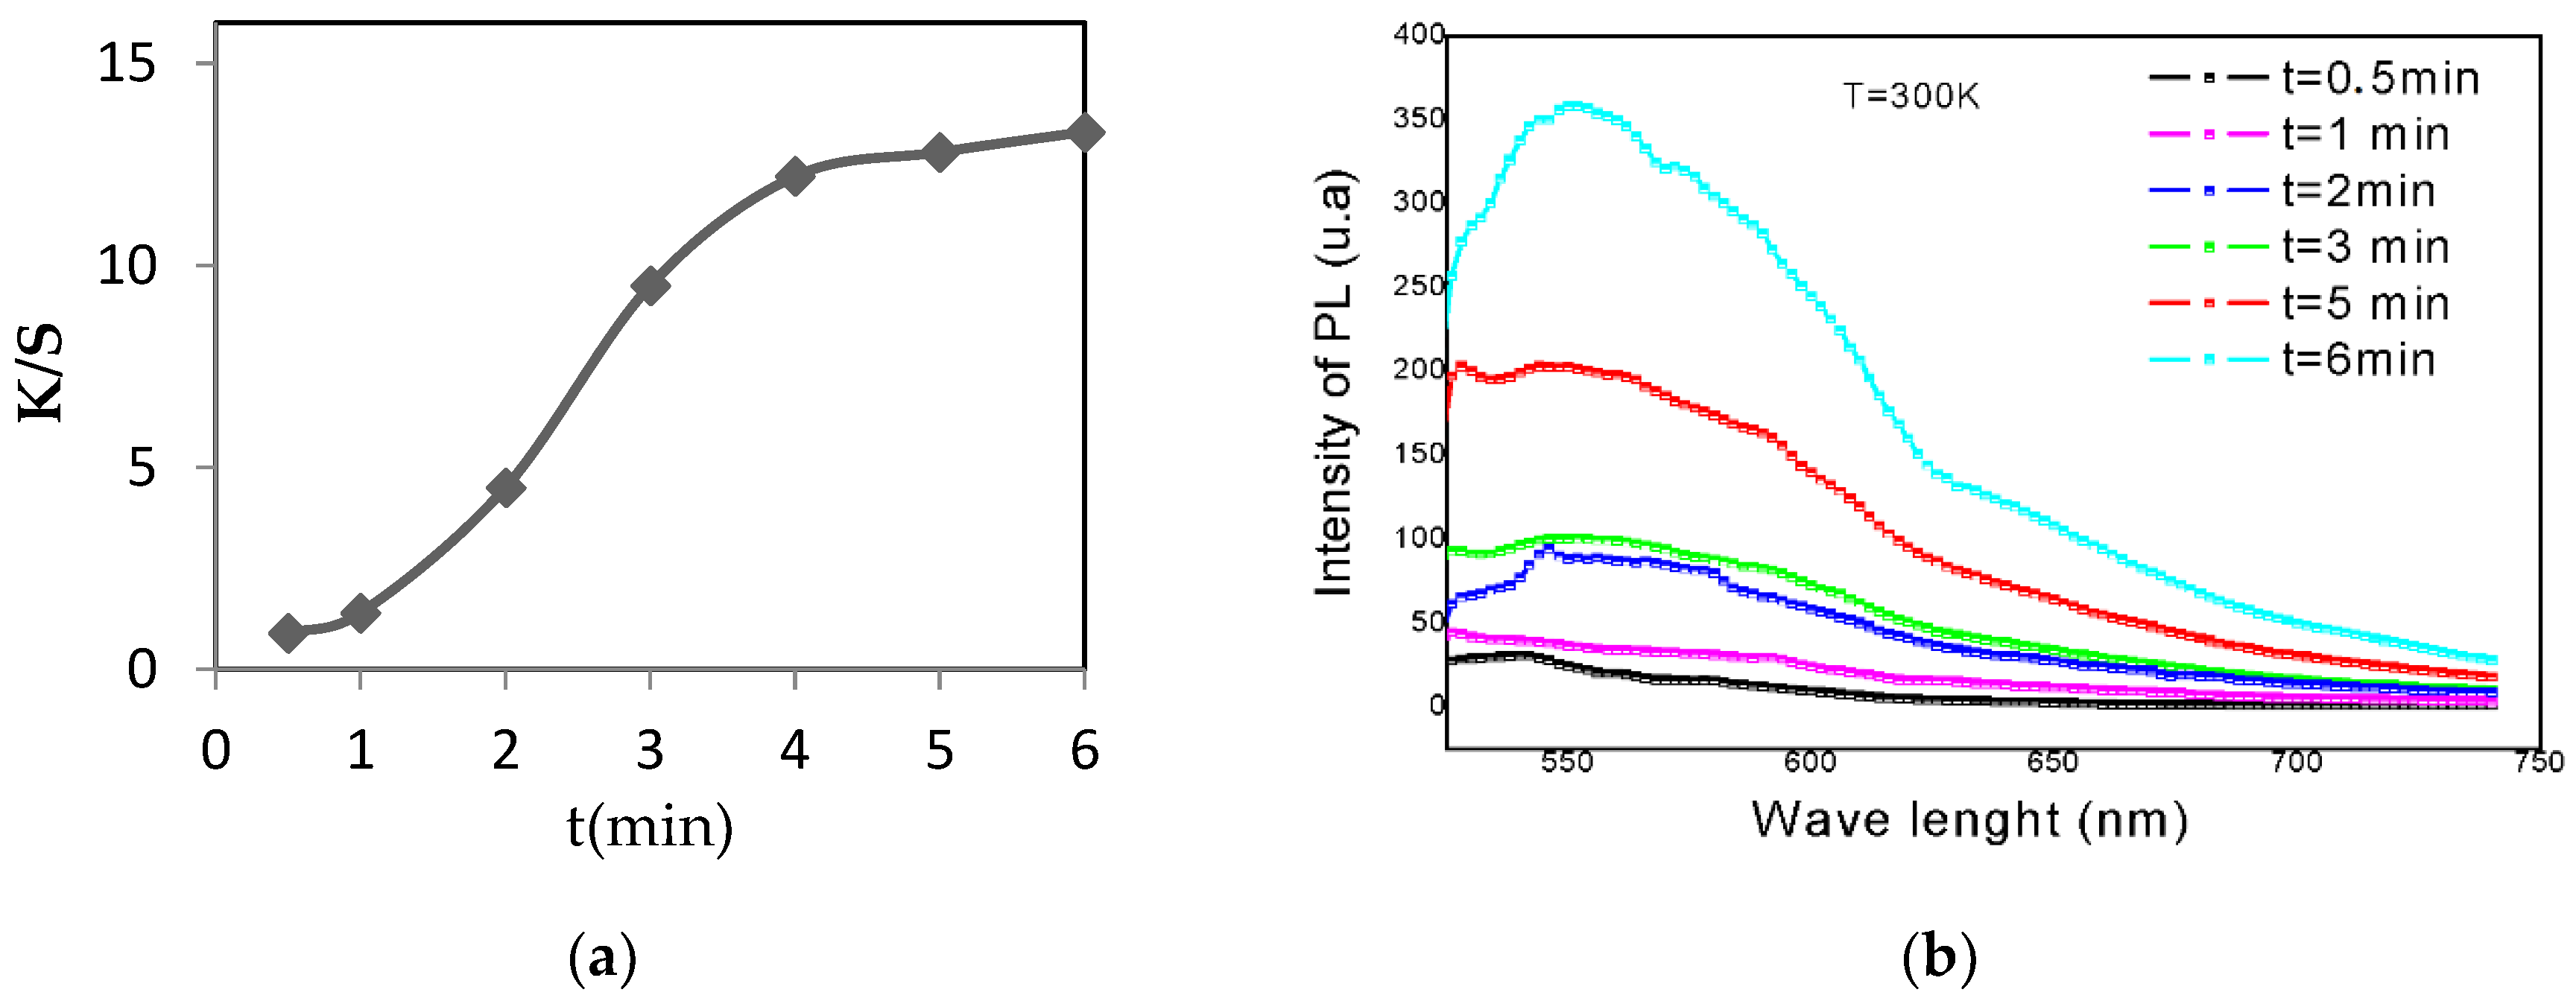
3.1.2. Effect of Dyeing Duration

Effect of duration on colorimetric coordinates and color strength. Results are shown in Table 2.
According to Table 2, increasing the dyeing duration induced a decrease in L*, which implies darker samples. Moreover, increasing the duration of dyeing caused an increase of b*, which implies a shift of shade to yellow.
Figure 3 shows the positive influence of increasing the dyeing duration on the dyeing quality of acrylic fabrics. In fact, there was an improvement in the (K/S) value of the acrylic as a result of increasing the dyeing time. This coloring force reached a value of 13 at a duration of 6 min. This could be explained by the high affinity between the coloring substances and the chemical structure of the acrylic.
Effect of dyeing duration on photoluminescence
Figure 3 reveals that the dyeing time positively affected the intensity of photoluminescence (PL). At a dyeing duration of 6 min, the recorded intensity of photoluminescence (PL) was almost 357 (u.a).

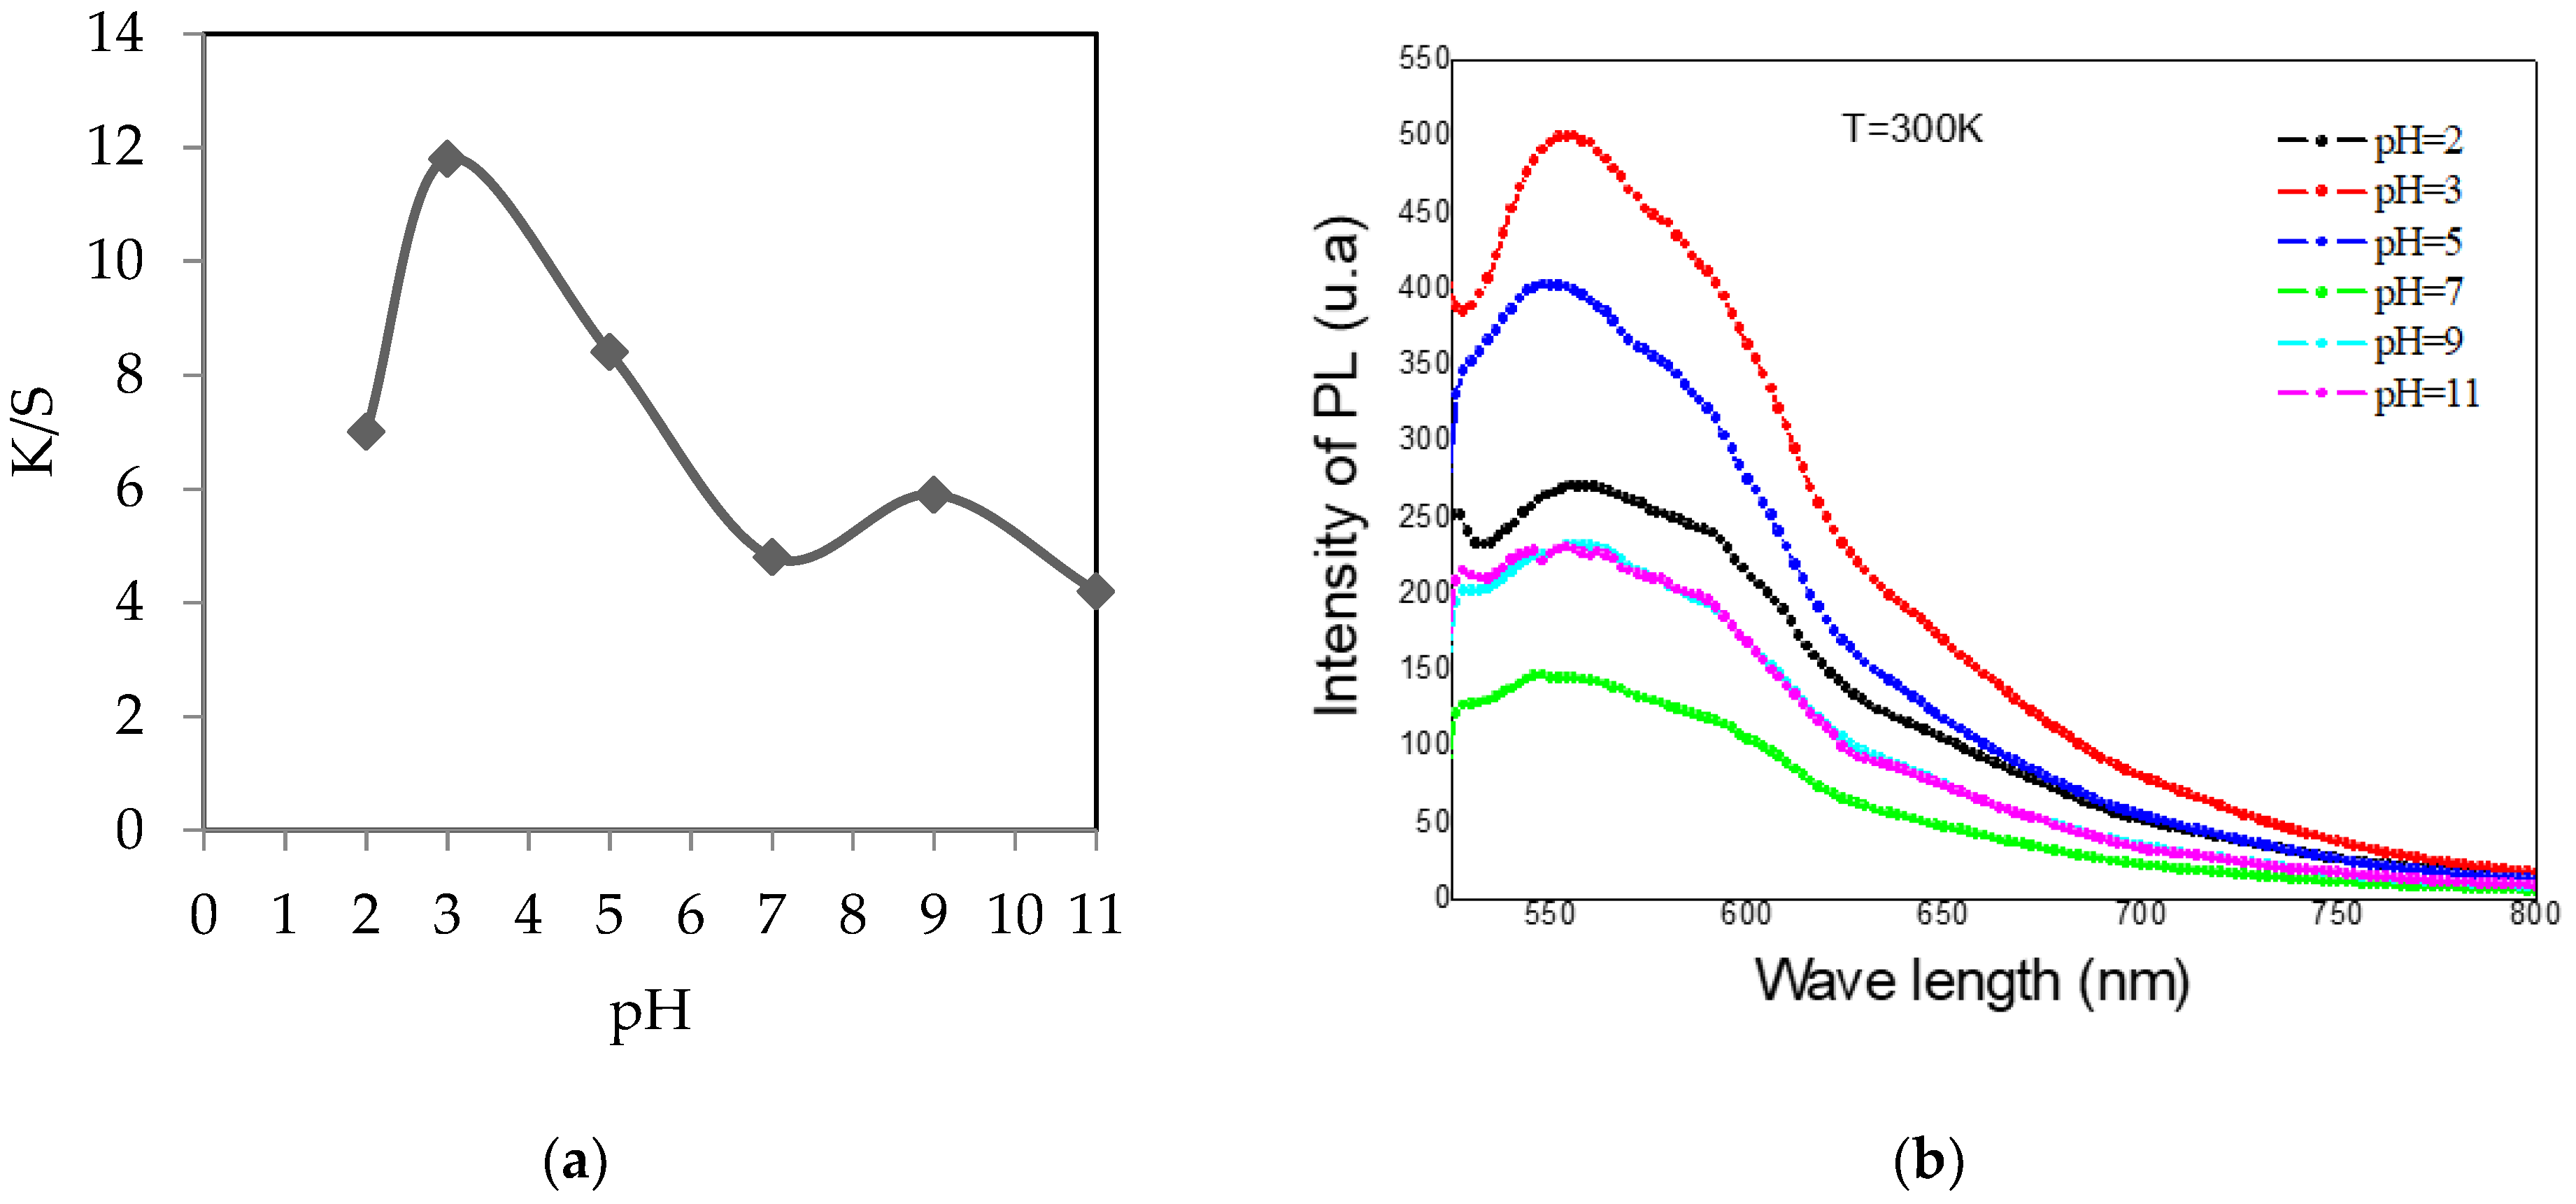
3.1.3. Effect of the Dye Bath pH

The pH of the dyebath varied between 2 and 11, keeping the bath ratio (1/40), the microwave power (350 W) and the dyeing duration constant (3 min). The adjustment of the dye bath pH was carried out using a solution of soda (1 M) and hydrochloric acid (1 M).
Effect of pH on colorimetric coordinates and color strength (Table 3).
For the acrylic fiber, it could be noticed that b* was higher in acid medium (pH = 3), which shows the turn towards yellow. It could also be noticed that L* decreased in acidic medium but increased in basic medium, which implies darker samples in acid medium and lighter in basic medium.
Figure 4 shows that an acid medium is the most suitable for dyeing acrylic. Indeed, the maximum obtained value of K/S was 12 for a pH of 3. Under these acidic conditions, the fillers present were not compensated, thus allowing maximum fixation thanks to the electrostatic interactions [21].
Effect of pH on photoluminescence
This test consists in varying the pH passing through the most acidic medium to another very basic by constantly maintaining the extraction duration and microwave power.
From Figure 4, the maximum value of the PL intensity was 500 (u.a) for a pH of 3. This intensity decreased progressively closer to the basic pH. At a pH = 7, the minimum intensity of photoluminescence (PL) was 120 (u.a).
The intensity of photoluminescence (PL) agrees with the dye quality. Each time K/S increased, the intensity of PL became more important, which could be explained by the amount of dye stuff rich in natural fluorophores absorbed by the textile support.

3.2. Optimization of Microwave Dyeing Process

The experimental design method, Minitab, provided by the software (MINITAB Ver., 18, U.S. Federal Government Commonwealth of Pennsylvania, USA), was used to model and optimize the experimental conditions of the dyeing process [22]. The experimental design is reported in Table 4.

3.2.1. Establishment of Regression Equations

This function was performed to adjust the generated experimental design models with the following terms.
Through regression analysis on the experimental results, expected responses could be defined by the following mathematical equations:
K/S = −13.64 + 0.0133 P(W) + 5.85 pH + 2.24 t(min) − 0.560 pH × pH
−0.00135 P(W) × pH + 0.00091 P(W) ×t(min) − 0.195 pH ×t(min)
With R2 (%) = 81
PL = −334 + 0.97 P(W) + 51.9 pH + 351 t(min) − 0.082 P(W) × pH
+0.210 P(W) × t(min) − 47.6 pH × t(min)
With R2(%) = 90
where PL = intensity of photoluminescence, t (min) = duration, P = power, K/S = color strength and pH=hydrogen potential of the bath.
The coefficient of determination (R2) denotes the degree of prediction of the model; in our situation, R2 is around 90% for the intensity of photoluminescence and 81% for the degree of absorption K/S, which implies that the models proposed are highly predictable.

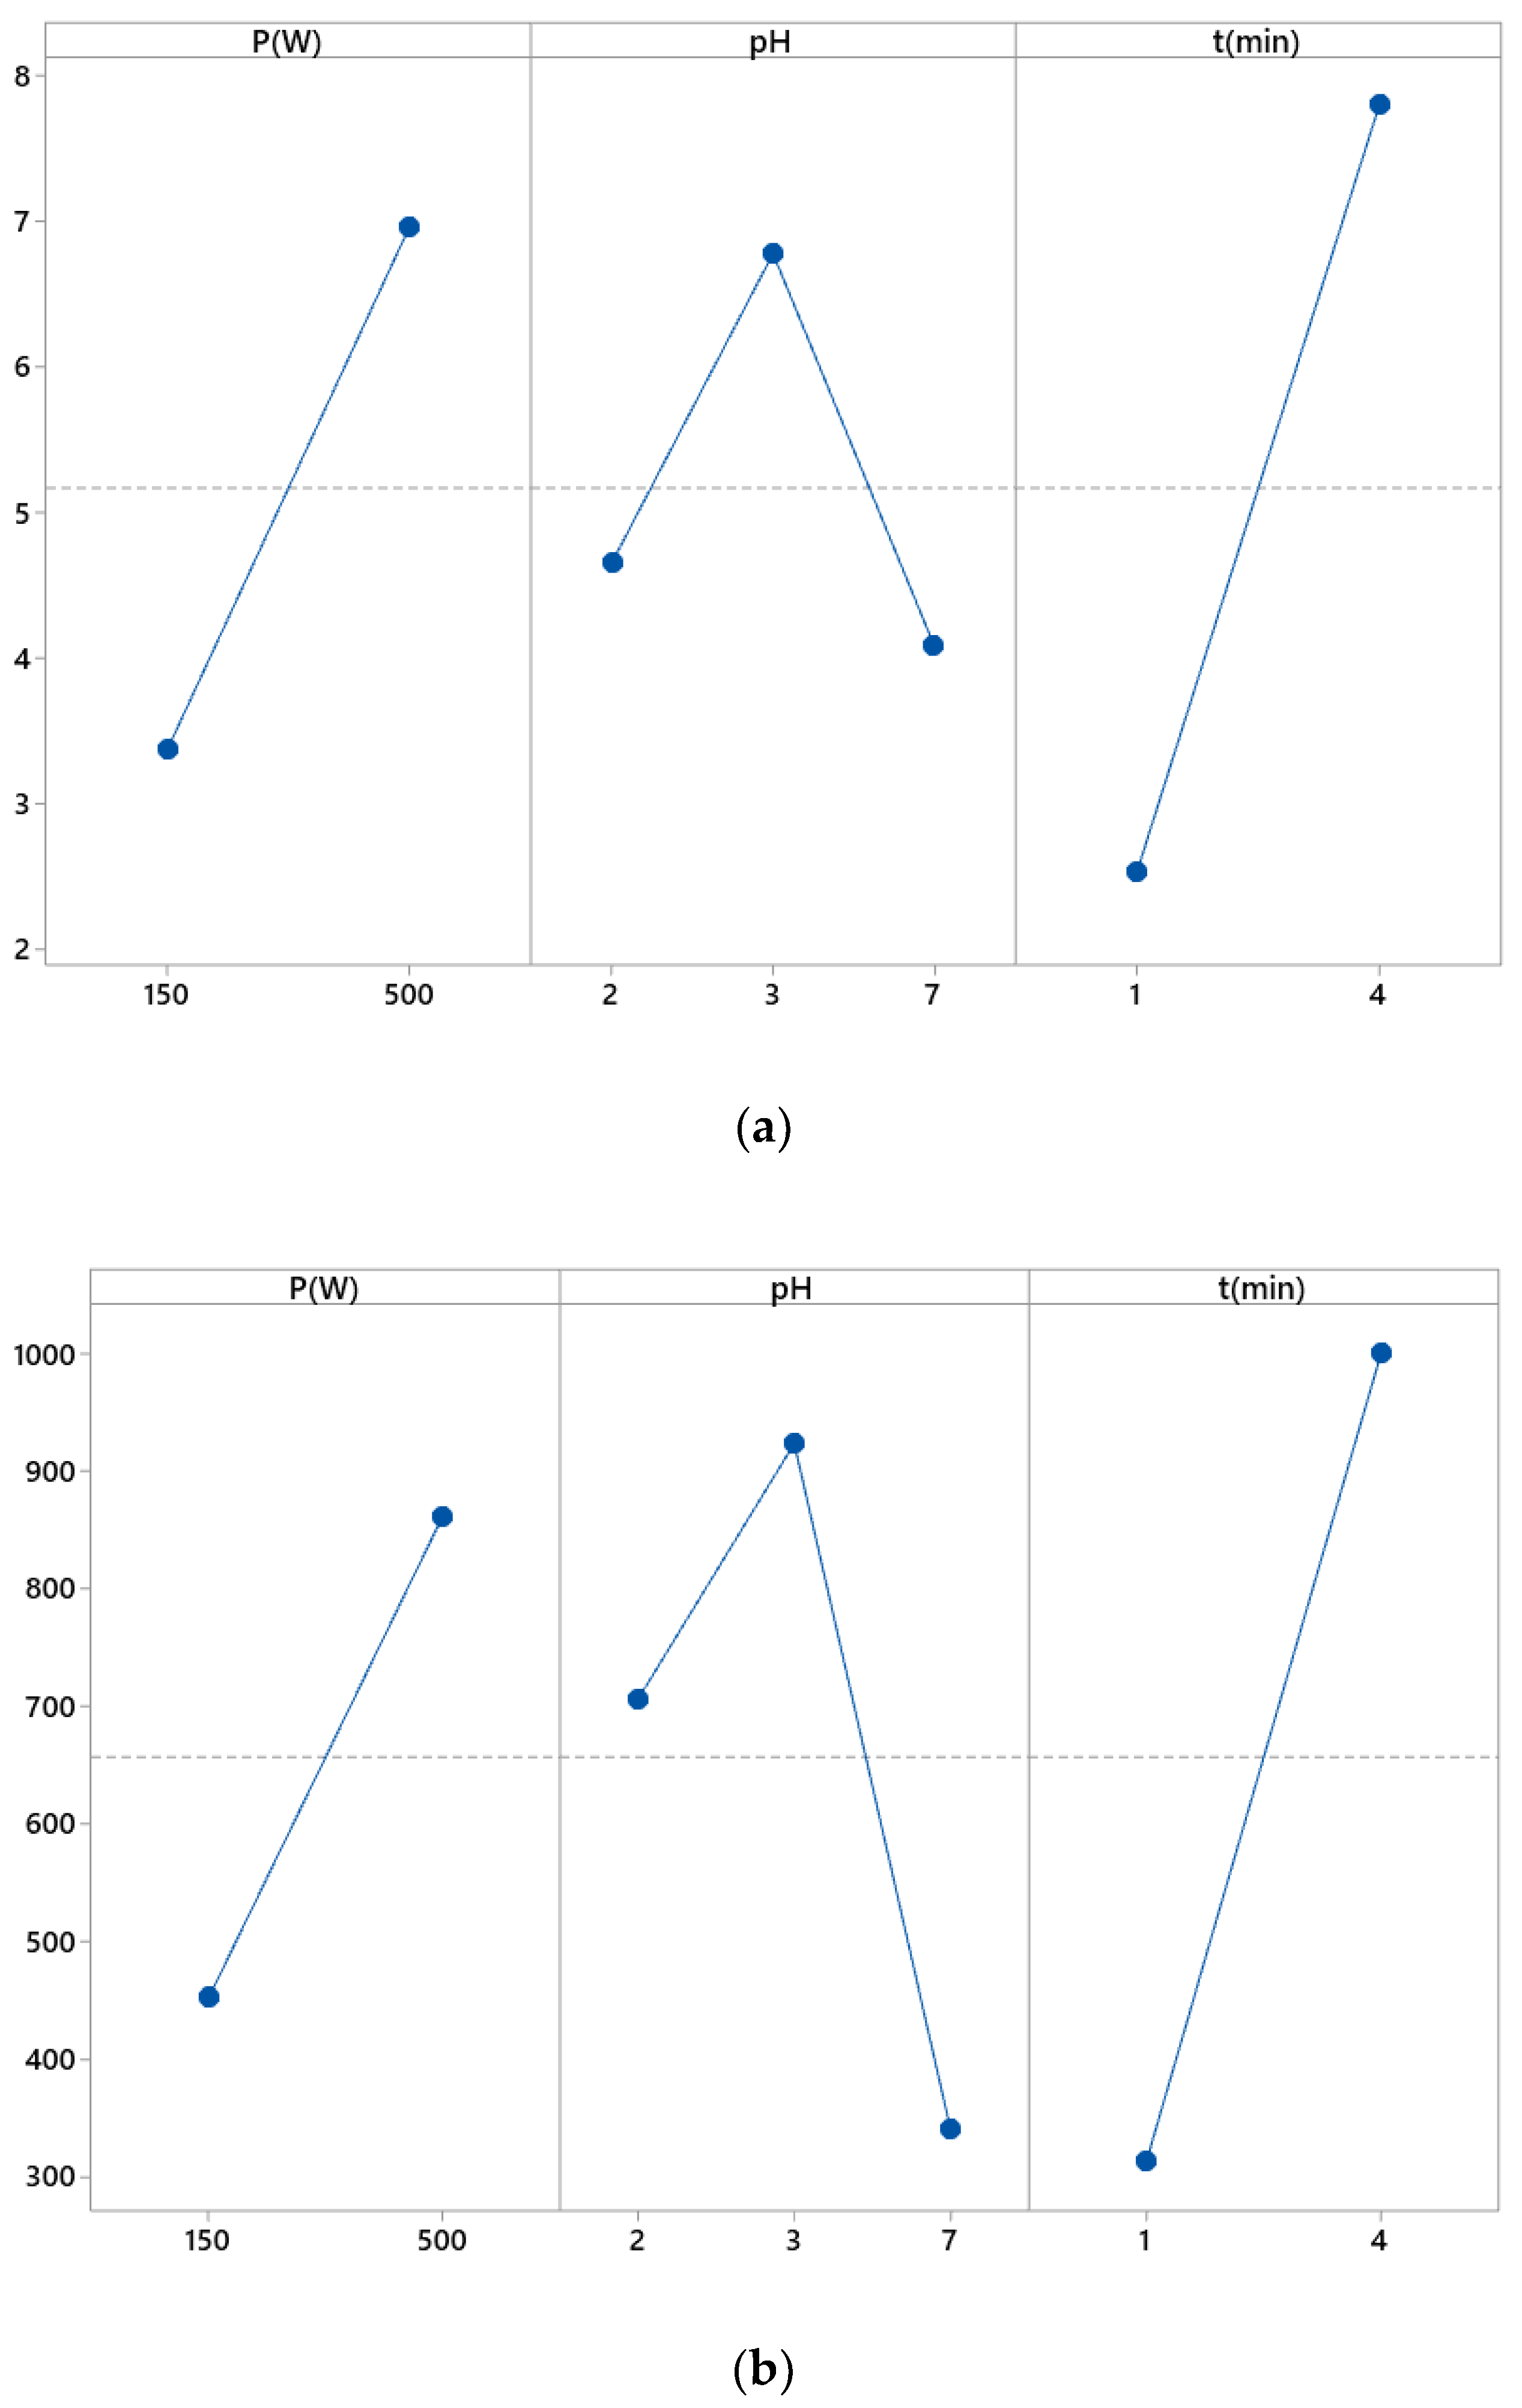
3.2.2. Study of the Main Effect Diagrams

This diagram was combined with an analysis of variance and an experimental design to analyze the differences between the average levels of one or more factors. A main effect occurred when the levels of different factors touched the response differently. This diagram presents the average of the responses of each factor level joined by a line.
A main effect is the alternation in the average response between factor levels. The main effects plot showed the averages for the K/S responses of acrylic and photoluminescence intensities based on three factors (pH, microwave power and dyeing duration).
Each point represents the average treatment time for a level of a factor. The horizontal center line shows the average responses for all tests.
Figure 5a shows the main effect relating to K/S of acrylic. From these graphs, it could be noticed that:
  • The microwave power positively affected the dyeing quality from 150 to 500 W;
  • For a duration of 1 to 4 min, the duration improved the dyeing properties of textiles;
  • By going from pH 2 to pH 3, the dyeing properties of acrylic were concerned. This effect became rather important from a neutral pH, so the acidic pH was the best for acrylic dyeing.
Figure 5b shows the main effect relating to photoluminescence intensity (PL) of acrylic. From these graphs, it could be noticed that:
  • The power positively affected the photoluminescence intensity from 150 to 500 W;
  • From a duration of 1 to 4 min, the duration positively affected the photoluminescence intensity;
  • The pH strongly affected the photoluminescence intensity by going from 2 to 3. This effect became rather important from a neutral pH.

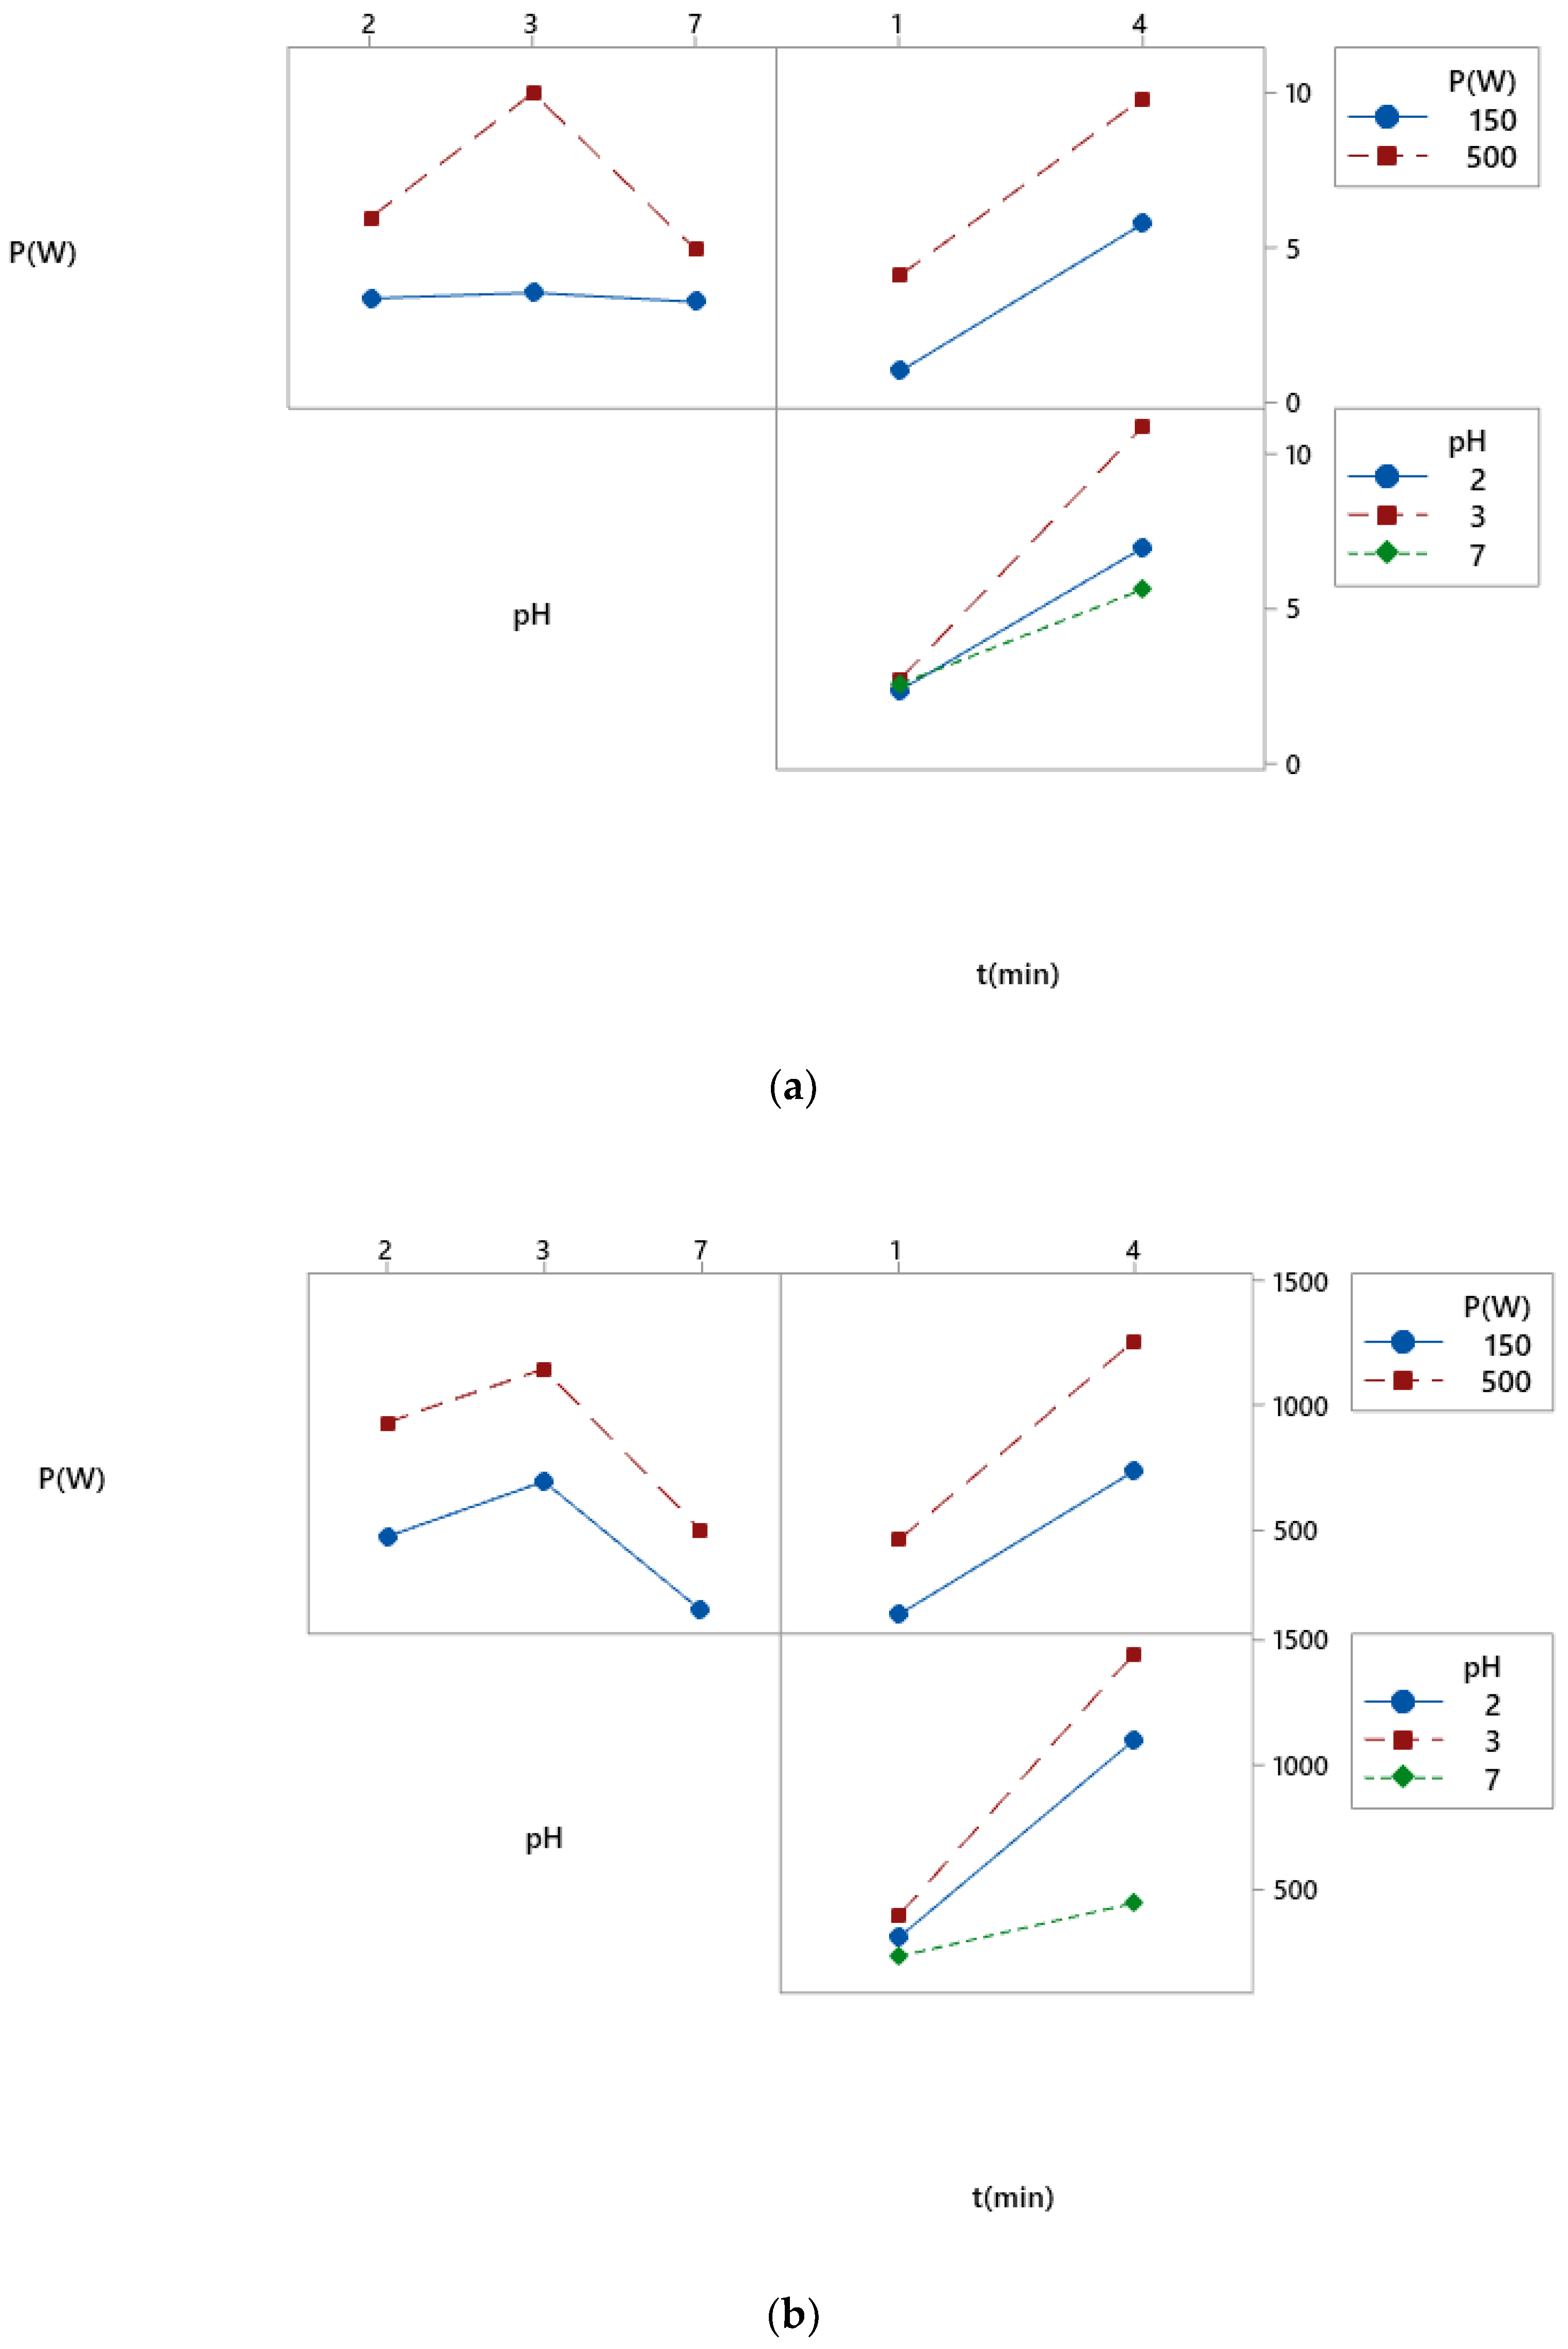
3.2.3. Study of Interaction Diagrams

Interaction diagrams allow to check the effect of one factor on the level of the other factor and to compare the relative power of the effects of different factors. Results are shown on Figure 6. For K/S (Figure 6a), it could be observed that there was a very low interaction between microwave power, pH and duration. However, there was more interaction between pH and duration.
For the photoluminescence intensity (Figure 6b), there was a very low interaction between microwave power and pH and between microwave power and duration. However, there was more interaction between pH and duration.

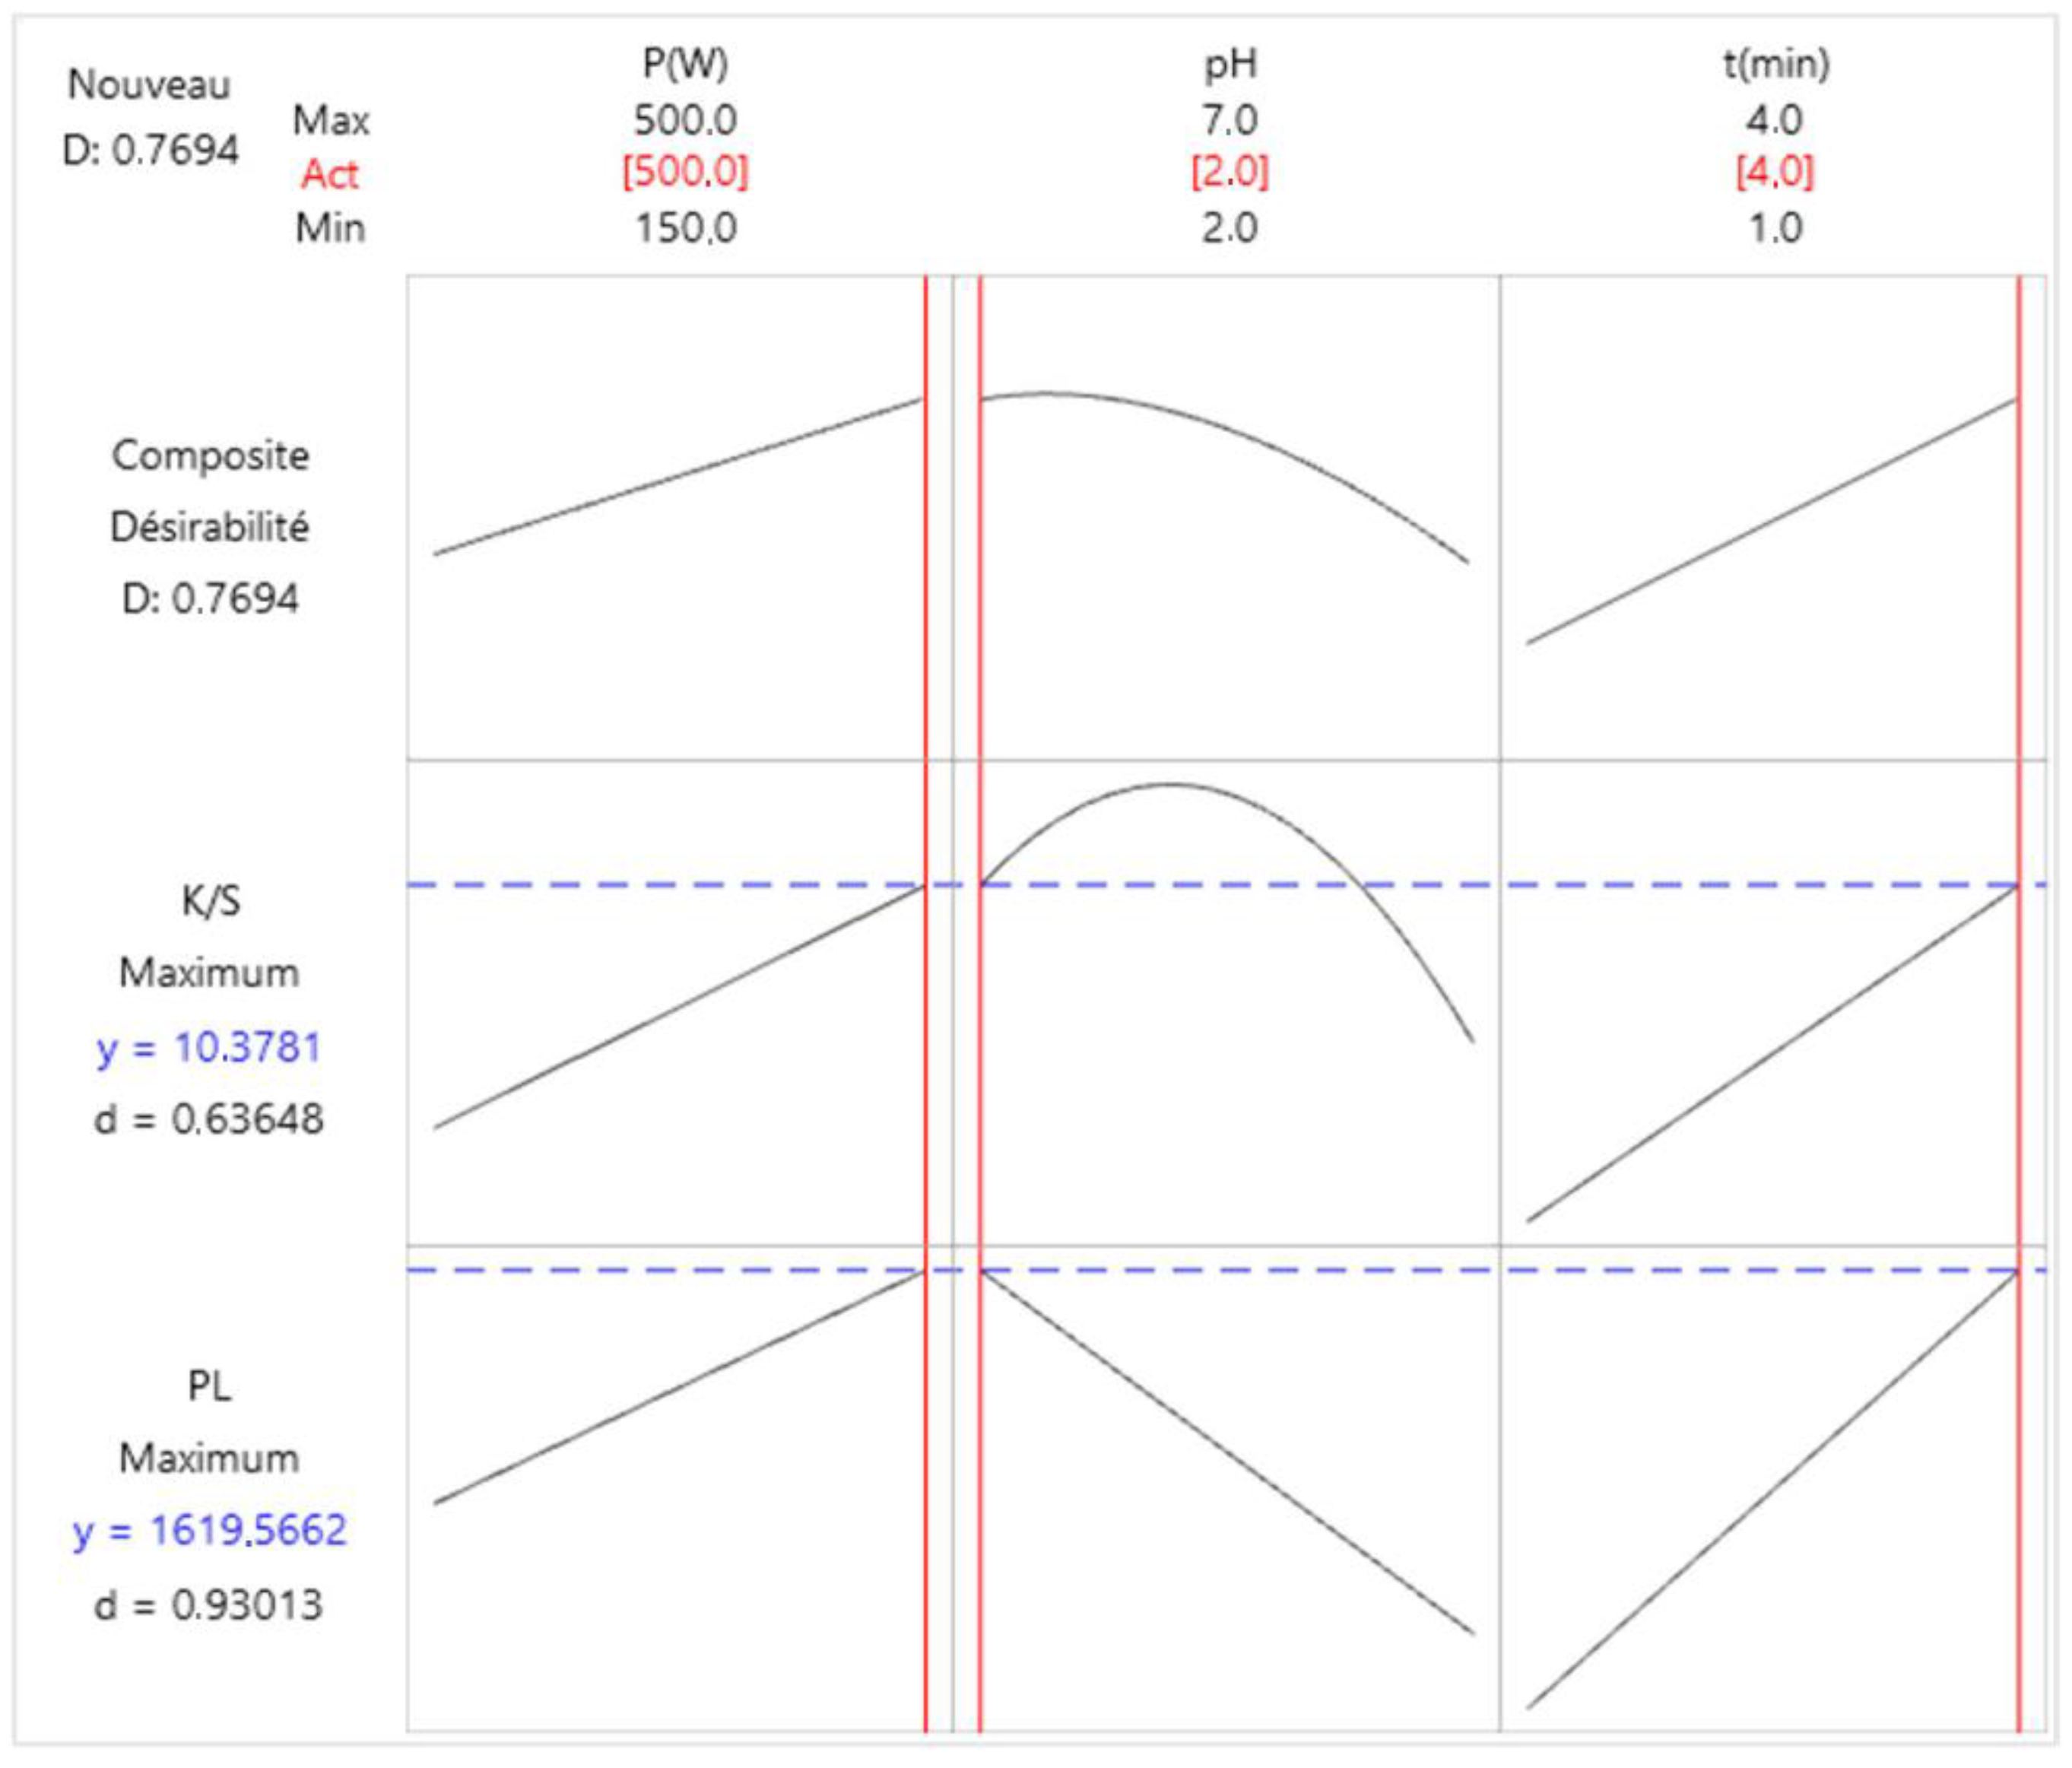
3.2.4. Response Optimization

The optimization chart illustrates the effect of each factor (columns) on composite responses or desirability (rows) [23].
Figure 7 indicates the optimal responses (K/S color strength = 10.3781 and PL = 1619.566 (u.a)) for a power of 500 W, a pH of 2 and a duration of 4 min.

3.2.5. Model Validation

The results achieved when applying the optimal combination were in harmony with the theoretical result. In fact, the obtained color strength (K/S) was 13.35, and the value of the photoluminescence intensity was 1720.166 (u.a).

3.3. Fastness Properties of Optimum Dyed Fabrics

In this part, fastness to washing and fastness to light were determined. In general, most natural dyes have moderate wash fastness and low light fastness. The obtained fastness properties are shown in Table 5. Good fastness could be observed.

3.4. Effect of Mordanting on Dyeing Quality

3.4.1. Stain of Acrylic with Simultaneous Mordanting

From Table 6, it could be noticed that mimosa give the darker sample and highest color strength (ʃ K/S = 21.12). Hence, mimosa was the mordant with the best ability to form coordination complexes with the dye.

3.4.2. Stain of Acrylic with Subsequent Mordanting

From Table 6, it was observed that using mimosa as a mordant lead to the best dyeing quality (ʃ K/S = 15.8). Hence, mordanting with mimosa gave a darker sample, whereas zinc chloride has the weakest coloring force (ʃ K/S = 12.8).
Mordanting results showed that the simultaneous mordanting gave greater value than that of the pre-mordanting method.

3.4.3. Effect of Mordanting on Color Fastness

According to the results presented in Table 7, it is clear that etched acrylic exhibited good results for fastness to washing and average results for fastness to light. It could therefore be stated that mordants have improved the fastness to light and to washing, hence the advantage of carrying out this step.

4. Conclusions

The aim of this study is to evaluate the fluorescence property of acrylic fabric dyed with the extract of the bark of Juglans regia, a natural dye. It was found that dyed samples exhibit interesting photoluminescence. Juglans regia bark residue extract could be applied to acrylic fabrics, with or without mordant, to produce a wide variety of shades accompanied by significant resistance to light irradiation and washing.
The response surface methodology is effective and reliable in determining the optimal conditions for this green dyeing process. It was also found that the best dyeing and photoluminescence performances were achieved at a pH of 3 and a microwave power of 500 W for a duration of 4 min.

Author Contributions

Conceptualization, data curation, formal analysis, investigation, methodology, software, writing—original draft preparation, N.S., M.B.T., B.S. Conceptualization, project administration, supervision, writing—review and editing, H.D. All authors have read and agreed to the published version of the manuscript.

Funding

There is no external funding.

Institutional Review Board Statement

Not applicable.

Informed Consent Statement

Not applicable.

Data Availability Statement

Not applicable.

Acknowledgments

The authors would like to thank the Tunisian Higher Education and Scientific Research Ministry. Moreover, the authors would like to acknowledge Taif University Researchers Supporting Project number (TURSP-2020/188), Taif University, Taif, Saudi Arabia.

Conflicts of Interest

The authors declare no conflict of interest.

References

  1. Wissgott, U.; Bortlik, K. Prospects for new natural food colorants Trends. Food Sci. Technol. 1996, 7, 298–302. [Google Scholar] [CrossRef]
  2. Gouila, H.; Meksi, N.; Haddar, W.; Mhenni, M.F.; Jannet, H.B. Extraction, identification and dyeing studies of Isosalipurposide, a natural chalcone dye from Acacia cyanophylla flowers on wool. Ind. Crops Prod. 2012, 35, 31–36. [Google Scholar] [CrossRef]
  3. Vankar, P.S.; Rakhi, S.; Samudrika, W. Dyeing of cotton, wool and silk with extract of Allium cepa. Pigment Resin Technol. 2009, 38, 242–247. [Google Scholar] [CrossRef]
  4. Kamel, M.; El-Shishtawy, R.M.; Youssef, B.M.; Mashaly, H. Ultrasonic assisted dyeing: III. Dyeing of wool with lac as a natural dye. Dye. Pigment. 2005, 73, 103–110. [Google Scholar] [CrossRef]
  5. Montazer, M.; Parvinzadeh, M. Dyeing of wool with Marigold and its properties. Fiber. Polym. 2007, 8, 181–185. [Google Scholar] [CrossRef]
  6. Ben Ticha, M.; Haddar, W.; Meksi, N.; Guesmi, A.; Mhenni, M.F. Improving dyeability of modified cotton fabrics by the natural aqueous extract from red cabbage using ultrasonic energy. Carbohydr. Polym. 2016, 154, 287–295. [Google Scholar] [CrossRef]
  7. Ben Ticha, M.; Meksi, N.; Drira, N.; Mhenni, M.F. Clean Process: Reducing indigo by using environmentally friendly 3-hydroxybutanone on dyed cotton modified with Denitex BC 200%. Res. J. Text. Appar. 2015, 19, 16–25. [Google Scholar] [CrossRef]
  8. Bouatay, F.; Meksi, N.; Slah, F.; Mhenni, M.F. Chemical Modification of Cellulosic Fibers Using Eco-Friendly Compounds to Improve Dyeing with Cationic Dyes. J. Text. Sci. Eng. 2014, 4, 1000153. [Google Scholar]
  9. Bouatay, F.; Meksi, N.; Adeel, S.; Salah, F.; Mhenni, M.F. Dyeing Behavior of the Cellulosic and Jute Fibers with Cationic Dyes: Process Development and Optimization Using Statistical Analysis. J. Nat. Fibers 2016, 13, 423–436. [Google Scholar] [CrossRef]
  10. Meksi, N.; Ben Ticha, M.; Kechida, M.; Mhenni, M.F. Using of ecofriendly α-hydroxycarbonyls as reducing agents to replace sodium dithionite in indigo dyeing processes J. Clean. Prod. 2012, 24, 149–158. [Google Scholar] [CrossRef]
  11. Ben Ticha, M.; Meksi, N.; Drira, N.; Mhenni, M.F. The synergetic effect of α-hydroxycarbonyls mixtures used as green reducing agent on the indigo dyeing process. Chem. Ind. Chem. Eng. Q. 2014, 20, 463–470. [Google Scholar]
  12. Chaieb, K.; Kouidhi, B.; Slama, R.B.E.N.; Fdhila, K.; Zmantar, T.; Bakhrouf, A. Cytotoxicity, Antibacterial, antioxydant, and biofilm properties of tunisian Juglans regia bark extract. Herbs Spices Med. Plants 2013, 19, 168–179. [Google Scholar] [CrossRef]
  13. Haji, A.; Quavamnia, S.S.; Nasiriboroumand, M. The use of D-optimal design in optimization of wool dyeing with Juglans rewgia bark. Ind. Text. 2018, 69, 104–110. [Google Scholar]
  14. Guesmi, A.; Ben Hamadi, N.; Ladhari, N.; Sakli, F. Sonicator dyeing of modified acrylic fabrics with indicaxanthin natural dye. Ind. Crop. Prod. 2013, 42, 63–69. [Google Scholar] [CrossRef]
  15. Tiwari, V.; Vankar, P.S. Unconventiontional natural dyeing using microwave and sonicator with alkanet root bark. Colourage 2001, 48, 25–28. [Google Scholar]
  16. Kubelka, P.; Munck, F. Ein beitrag zur optik der farbanstriche. Z. Tech. Phys. 1931, 12, 593–601. [Google Scholar]
  17. Davidson, R.S. The photodegradation of some naturally occurring polymers. J. Photochem. Photobiol. B Biol. 1931, 33, 3–25. [Google Scholar] [CrossRef]
  18. Clementi, C.; Miliani, C.; Romani, A.; Favaro, G. In situ fluorimetry: A powerful non-invasive diagnostic technique for natural dyes used in artefacts. Part I. Spectral characterization of orcein in solution, on silk and wool laboratory-standards and a fragment of Renaissance tapestry. Spectrochim. Acta A Mol. Biomol. Spectrosc. 2006, 64, 906–912. [Google Scholar] [CrossRef]
  19. Deo, H.T.; Paul, R. Dyeing of ecru denim with onion extract using mordant combination. Indian J. Fibre Text. Res. 2000, 25, 152–157. [Google Scholar]
  20. Gandía-Herrero, F.; García-Carmona, F.; Escribano, J. Fluorescent pigments: New perspectives in betalain research and applications. Food Res. Int. 2005, 38, 879–884. [Google Scholar] [CrossRef]
  21. Haddar, W.; Elkssibi, I.; Meksi, N.; Mhenni, F. Valorisation of the leaves of fennel (Foeniculum Vulgare) as natural dyes fixed on modified cotton: A dyeing process optimisation based on a response surface methodology. Ind. Crops Prod. 2014, 52, 588–596. [Google Scholar] [CrossRef]
  22. Shah, A.R.; Tahir, H.; Ullah, H.M.K.; Adnan, A. Optimization of Electrocoagulation Process for the Removal of Binary Dye Mixtures Using Response Surface Methodology and Estimation of Operating Cost. Open J. Appl. Sci. 2017, 7, 458–484. [Google Scholar] [CrossRef]
  23. Rosa, S. Optimal experimental designs for treatment contrasts in heteroscedastic models with covariates. J. Stat. Plan. Inference 2020, 12, 280–291. [Google Scholar] [CrossRef] [Green Version]
Figure 1. Emission behavior of Juglans regia bark residues extract. (a): Emission behavior of tannin; (b): Emission behavior of flavonoid; (c): Emission behavior of Flavin (the sum of two curves a and b).
Sustainability 14 12275 g001
Figure 2. Evolution of the color strength (K/S) (a) and photoluminescence (PL) (b) according to the microwave power dyeing.
Sustainability 14 12275 g002
Figure 3. Evolution of the color strength (K/S) (a) and the photoluminescence (PL) (b) as a function of dyeing duration.
Sustainability 14 12275 g003
Figure 4. Evolution of the color strength (K/S) (a) and the photoluminescence (PL) (b) of dyed acrylic samples according to the pH of dyeing.
Sustainability 14 12275 g004
Figure 5. Main effects diagrams related to the color strength (K/S) (a) and photoluminescence (PL) (b).
Sustainability 14 12275 g005
Figure 6. Interaction diagram related to the color strength (K/S) (a) and photoluminescence (PL) (b).
Sustainability 14 12275 g006
Figure 7. Response optimization related to the color strength (K/S) and photoluminescence (PL).
Sustainability 14 12275 g007
Table 1. Colorimetric parameters attributed to variation in microwave dyeing power.
Power (W)L*a*b*c*h*Samples
p = 16082.69−9.4556.3262.0498.6Sustainability 14 12275 i001
p = 35080.10−8.875.2759.9498.51Sustainability 14 12275 i002
p = 50069.69−8.5259.3253.0399.24Sustainability 14 12275 i003
p = 65065.19−7.5073.5173.8098.82Sustainability 14 12275 i004
p = 85063.27−7.8475.2653.8397.49Sustainability 14 12275 i005
Table 2. Colorimetric parameters attributed to variation in dyeing duration.
Duration (min)L*a*b*c*h*Samples
t = 0.585.64−2.8119.0619.2798.37Sustainability 14 12275 i006
t = 182.52−6.1138.3538.8399.05Sustainability 14 12275 i007
t = 282.65−9.5764.4865.298.43Sustainability 14 12275 i008
t = 376.09−7.7670.5270.9496.28Sustainability 14 12275 i009
t = 467.81−6.9862.5773.1882.03Sustainability 14 12275 i010
t = 573.39−7.0272.3672.795.54Sustainability 14 12275 i011
t = 672.61−7.6061.5762.6197.02Sustainability 14 12275 i012
Table 3. Colorimetric parameters attributed to variation in dyeing pH.
pHL*a*b*c*h*Samples
pH = 273.38−5.4161.3961.6295.03Sustainability 14 12275 i013
pH = 374.61−6.0572.0772.3594.79Sustainability 14 12275 i014
pH = 579.90−8.9064.4765.0997.85Sustainability 14 12275 i015
pH = 779.79−8.9561.0961.7398.33Sustainability 14 12275 i016
pH = 978.13−8.5769.3164.8597.97Sustainability 14 12275 i017
pH = 1186.50−11.9554.7256.05102.31Sustainability 14 12275 i018
Table 4. Experimental design.
FactorsResponses
NumP(W)pHt (min)K/SPL (u.a)
1150311.18229.41
2150710.85120.62
3150210.90139.27
4150245.80814.08
5500314.20563.36
6150745.62240.06
7500714.25347.06
8150345.901168.00
9500213.80477.17
105003415.821732.16
11500248.101392.98
12500745.60657.33
Table 5. Fastness properties of the optimal dyed acrylic fabric.
SampleLight (Note/8)Wash (Note/5)
Sustainability 14 12275 i01954
Table 6. Effect of mordanting on dye quality.
MordantL*a*b*c*h*K/SSamples
Without mordanting-----59.43−0.6731.7271.8990.6613.7Sustainability 14 12275 i020
Simultaneous mordantingIron chloride36.26−2.87.5813.73107.4313.4Sustainability 14 12275 i021
Mimosa68.02−4.535.9372.4194.1121.12Sustainability 14 12275 i022
Tannic acid65.86−3.3533.4257.2396.2117Sustainability 14 12275 i023
Zinc chloride47.925.4911.3319.3568.8612.6Sustainability 14 12275 i024
Pre mordantingIron chloride39.88−3.1213.8326.9399.4915.2Sustainability 14 12275 i025
Mimosa61.01−2.2928.4253.6792.9315.8Sustainability 14 12275 i026
Tannic acid64.77−2.9432.262.3693.1715Sustainability 14 12275 i027
Zinc chloride47.524.3311.619.473.4312.8Sustainability 14 12275 i028
Table 7. Effect of mordanting on the strength of dyed wool fabrics.
MordantLight Fastness (Note/8)Washing Fastness (Note/5)
Without mordanting---43–4
Simultaneous mordantingIron chloride64–5
Mimosa6–74–5
Tannic acid64–5
Zinc chloride54
Pre-mordantingIron chloride54
Mimosa64
Tannic acid64
Zinc chloride54
Publisher’s Note: MDPI stays neutral with regard to jurisdictional claims in published maps and institutional affiliations.

