Article

Study on Alkali Reduction Treatments and Plant Growth Properties of Planting Concrete

1
College of Civil Engineering & Architecture, Qingdao Agricultural University, Qingdao 266109, China
2
Qingdao Sanxing Engineering Co., Ltd., Qingdao 266000, China
3
Rizhao Lanshan District Ocean Development Co., Ltd., Rizhao 262300, China
*
Author to whom correspondence should be addressed.
Sustainability 2022, 14(19), 12228; https://doi.org/10.3390/su141912228
Submission received: 17 August 2022 / Revised: 16 September 2022 / Accepted: 19 September 2022 / Published: 27 September 2022
(This article belongs to the Collection Waste Management towards a Circular Economy Transition)

Abstract

:
The use of planting concrete (PC) is one of the most prevalent slope protection methods. However, PC offers poor plant growth properties and poor ecological performance due to its high alkalinity. Therefore, in this study we used an orthogonal experimental design to optimize the mix design, and we used three alkali reduction treatments to reduce alkalinity and improve plant growth properties. The compressive strength, interconnected porosity, and pH values were analyzed to obtain the optimal level. Subsequently, the plant growth property test was conducted both indoors and outdoors. Stem length was used to evaluate different plants, which were grown in both natural soil (NS) and construction waste (CW). The experiment results show that the paste–aggregate ratio (PR) has the greatest impact on the above properties and that the optimum levels for PR, water–binder ratio (W/B), and fly ash addition level (FA) are 1/5, 0.29, and 10%, respectively. Additionally, the compound alkali reduction treatments, which combined the use of 0.4% ferrous sulfate in the planting substance and 3% potassium dihydrogen phosphate in the soaking solution, were effective. Furthermore, tall fescue may have potential applications in combination with CW. In conclusion, PC that has undergone alkali reduction treatments shows potential for application in slope protection, and thus may help to improve sustainability.

1. Introduction

In China, infrastructure has been regarded as a key factor in national economic development, and this has led to a lot of ecological destruction, such as slope failures [1,2,3,4]. Therefore, many studies have been conducted on slope protection [5,6]. Concrete is one of the most widely used construction materials for slopes due to its high mechanical properties and nontoxicity [7,8]. However, traditional concrete used in the construction of slopes presents some problems, such as soil loss, because of its imperviousness [9].
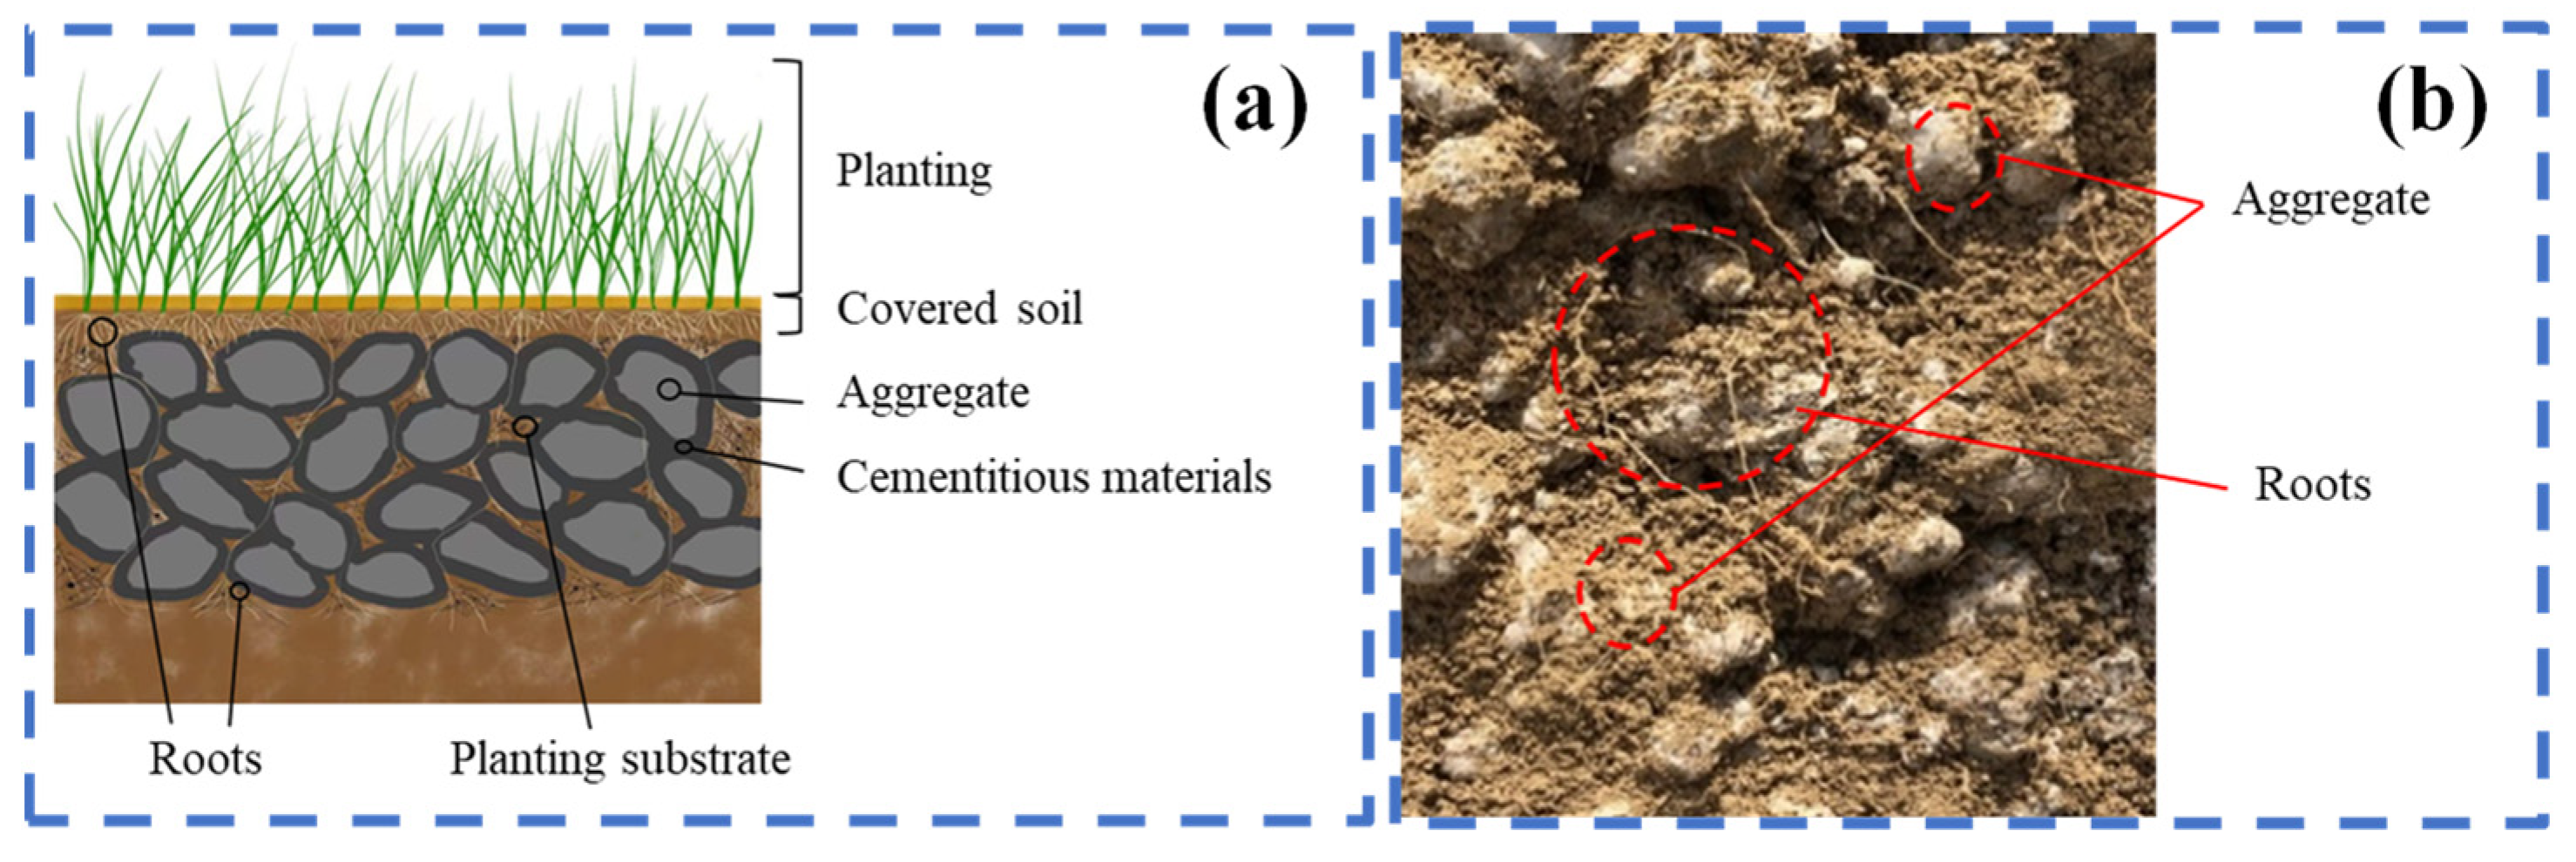
To solve these issues, PC was developed as a sustainable construction material [10,11] which provides excellent water permeability and relatively lower weight, as shown in Figure 1. However, its high alkalinity, which is caused by the hydration contained in Portland cement [12,13,14], has limited its extensive application. Calvo et al. [15] used silica fumes and fly ash to reduce the pH values of cementitious material, finding that the pH values can be reduced to 12. Kong et al. [16] used waste oyster shells as inert filler to fabricate porous concrete, discovering that the pH values could thereby be reduced to 8.52.
Recently, the methods of alkalinity reduction mainly include the modification of the planting substrate [17], carbonization [18], and chemical treatment [19]. There are some further studies concerning the alkalinity reduction methods needed to obtain the required properties of PC. For instance, Li et al. [20] generated low-alkali PC by adding fertilizer, and they found that the pore fluid alkalinity of the PC was about 8.2 and provided an excellent environment for plant growth. Li et al. [21] used fly ash and slag to prepare PC through accelerating carbonization and natural carbonization, respectively, and they found that the lowest pH values reached 8.57, and that there was less compressive strength loss. Wang et al. [22] used recycled aggregate and ultrafine slag to prepare PC through the solution spraying and soaking of ferrous sulfate, and they found that the pH values could be reduced significantly.
In this study, an orthogonal experimental design was used to optimize the mix design of the concrete, with the aim of reducing alkalinity and improving plant growth properties. The three factors included were PR, W/B, and FA addition level. Additionally, the compressive strength, interconnected porosity, and pH values were analyzed. Subsequently, a planting substrate method, a solution-soaking method, and a spraying method were used to reduce alkalinity. Finally, the plant growth properties were tested both indoors and outdoors. Stem length was used to evaluate the plant growth properties for different plants, which were grown in both NS and CW.

2. Materials and Methods

2.1. Raw Materials

Ordinary Portland cement (42.5, Shanshui company, Jinan, China) was used as binding material and FA (Qingjian company, Qingdao, China) as supplementary cementitious material, replacing cement by mass. The specific surface area of the cement was 342 kg/m2 and the fineness of the FA was 19.5%. The chemical compositions of the OPC and FA are shown in Table 1. Polycarboxylate superplasticizer (Sobute New Materials company, Nanjing, China) was selected to improve paste fluidity. The dosage was calculated by mass of cement, and its water reduction rate was 25%. The mixing water was tap water with a pH of 7.3. The natural aggregate (NA, Qingjian company, Qingdao, China) was granitic gravel, and its physical properties are shown in Table 2. Ferrous sulfate (FeSO4, Sinopharm chemical reagent company, Shanghai, China), potassium dihydrogen phosphate (KH2PO4, Sinopharm chemical reagent company, China), and boric acid (H3BO3, Sinopharm chemical reagent company, Shanghai, China) were used to reduce the alkalinity of the PC. Both natural soil and construction waste (CW, Qingdao Lvfan company, Qingdao, China) were used as cover soils. The chemical composition of the CW is shown in Table 3.

2.2. Orthogonal Experimental Design

Compared with a comprehensive test, an orthogonal experimental design effectively reduces the number of experiments while still allowing the significance levels of the factors to be obtained. In this study, the three factors were PR, W/B, and FA addition level. The level distributions were as follows: 1/4 (level 1), 1/5 (level 2), 1/6 (level 3), and 1/7 (level 4) for PR; 0.26 (level 1), 0.29 (level 2), 0.32 (level 3), and 0.35 (level 4) for W/B; and 0% (level 1), 10% (level 2), 20% (level 3), and 30% (level 4) for FA addition level. The L16(45) orthogonal array was selected. Additionally, the mix design was created using the absolute volume method [23], as shown in Table 4. Subsequently, range analysis was used to analyze the significance levels of the three factors. The Ki and ki represent the summation and average value of the test results at level i. R was calculated according to the difference between the maximum and minimum of the Ki. The blank column is set to estimate random error. Finally, single factor analysis was used to analyze the influenced properties.

2.3. Preparation Procedures

A two-step charting operation was used to prepare the PC, and its preparation procedures [10] were as follows:
(1)
NA along with binding material was added into a concrete mixer and stirred for 30 s.
(2)
Mixing water containing polycarboxylate superplasticizer was added and stirred for 90 s.
(3)
Fresh concrete was cast in the cubic mould, which was divided into three, followed by hand tamping for 25 min.
(4)
Hardened concrete was removed after 24 h to the standard curing room with temperature of 20 ± 2 °C and humidity of 95%.

2.4. Testing Methods

2.4.1. Compressive Strength

According to the Chinese national standard GB/T 50081 [24], the concrete was cured for 7 d and 28 d in order to test compressive strength. The testing machine (YA 2000, Zerui company, Cangzhou, China) was used to load 0.5 KN/s for specimens.

2.4.2. Interconnected Porosity

According to the Chinese industrial standard JC/T 2557-2020 [25], the interconnected porosity was tested. This procedure is shown in Figure 2, and the result can be calculated using Equation (1).
C pore = [ 1 m b m a ρ V ] × 100 %
where Cpore is the interconnected porosity of the PC, %; ma is the mass of the specimens, g; mb is the mass of the dried specimens, g; ρ is the water density, g/cm3; and V is the volume of the specimens, cm3.

2.4.3. Alkalinity

The alkalinity of the PC was evaluated using the pH values of leachate, which is tested using the leaching method. The PC was placed in distilled water with a mass ratio of 1:1 and with isolated air to avoid carbonation. Subsequently, pH values were tested after 24 h using a pH meter (PHS-3C, Shanghai INESA Scientific Instrument company, Shanghai, China).

2.4.4. Microstructure Analysis

A scanning electron microscope (SEM, ZEISS MERLIN Compact, ZEISS company, Oberkochen, Germany) was used to obtain the microstructure of the specimens. X-ray Fluorescence (XRF, Axios mAX, PANalytical B.V., Eindhoven, The Netherlands) was used to analyze the specimens.

2.5. Alkali Reduction Treatments

2.5.1. Planting Substrate Method

The specimens are presented in Table 4. The normal planting substance (NPS) was prepared, as shown in Table 5, and mixed with water according to a mass ratio of 1:1.5. Subsequently, the ferrous sulfate and potassium dihydrogen phosphate were added into the NPS at concentrations of 0.2%, 0.4%, and 0.6%, producing the alkali reduction planting substance (APS). The prevention of the release of OH- is the mechanism by which alkali reduction is achieved for the APS. The porous spaces of the PC were filled with the APS, as shown in Figure 3a. Only NPS was used for the control group. Finally, the pH values of the PC were tested at 3, 7, 14, and 28 d, and range analyses between 0 and 28 d were calculated. The test process was as follows:
(1)
The APS and NPS were taken out of the PC and dried naturally.
(2)
The specimens below 2 mm were put in 25 mL of distilled water, with isolated air to avoid carbonation.
(3)
The solution was stirred using an agitator for 5 min, and the pH values were tested after 3 h using a pH meter.
Figure 3. The alkali reduction treatments: (a) Planting substrate method. (b) Solution-soaking method. (c) Spraying method.
Sustainability 14 12228 g003
Table 5. Proportion of planting substrate.
MaterialsNSSoddy SoilCoconut HuskVermiculiteHumic AcidPerlitic RocksOrganic Fertilizer
Content (%)40.540.016.01.01.01.00.5

2.5.2. Solution-Soaking Method

The PC cured for 7 d was placed in a tank, and solutions of boric acid and potassium dihydrogen phosphate with concentrations of 1%, 3%, and 5% were added, as shown in Figure 3b. Subsequently, the pH values of the solutions were tested at different times.

2.5.3. Spraying Method

The PC cured for 7 d was sprayed with a solution of ferrous sulfate with concentrations of 10%, 15%, and 20%. The process is shown in Figure 3c. Subsequently, the pH values of the specimens were tested until they had cured for 28 d, in accordance with the test method proposed in Section 2.4.3.

2.6. Plant Growth Property

The specimens were cast at the following dimensions: 315 × 240 × 100 mm3. Subsequently, the specimens cured for 7 d were underwent alkali reduction treatments, which combined solution soaking with 5% potassium dihydrogen phosphate and the use of APS with 0.4% ferrous sulfate. Additionally, NS and CW were used as cover soils at 1–2 cm. The specimens were placed indoors at a temperature of 20 ± 2 ℃, and outdoors, for which the temperature and sunlight times are shown in Figure 4. The process is shown in Figure 5, and stem length was used to evaluate the different plants [26].

3. Results and Discussions
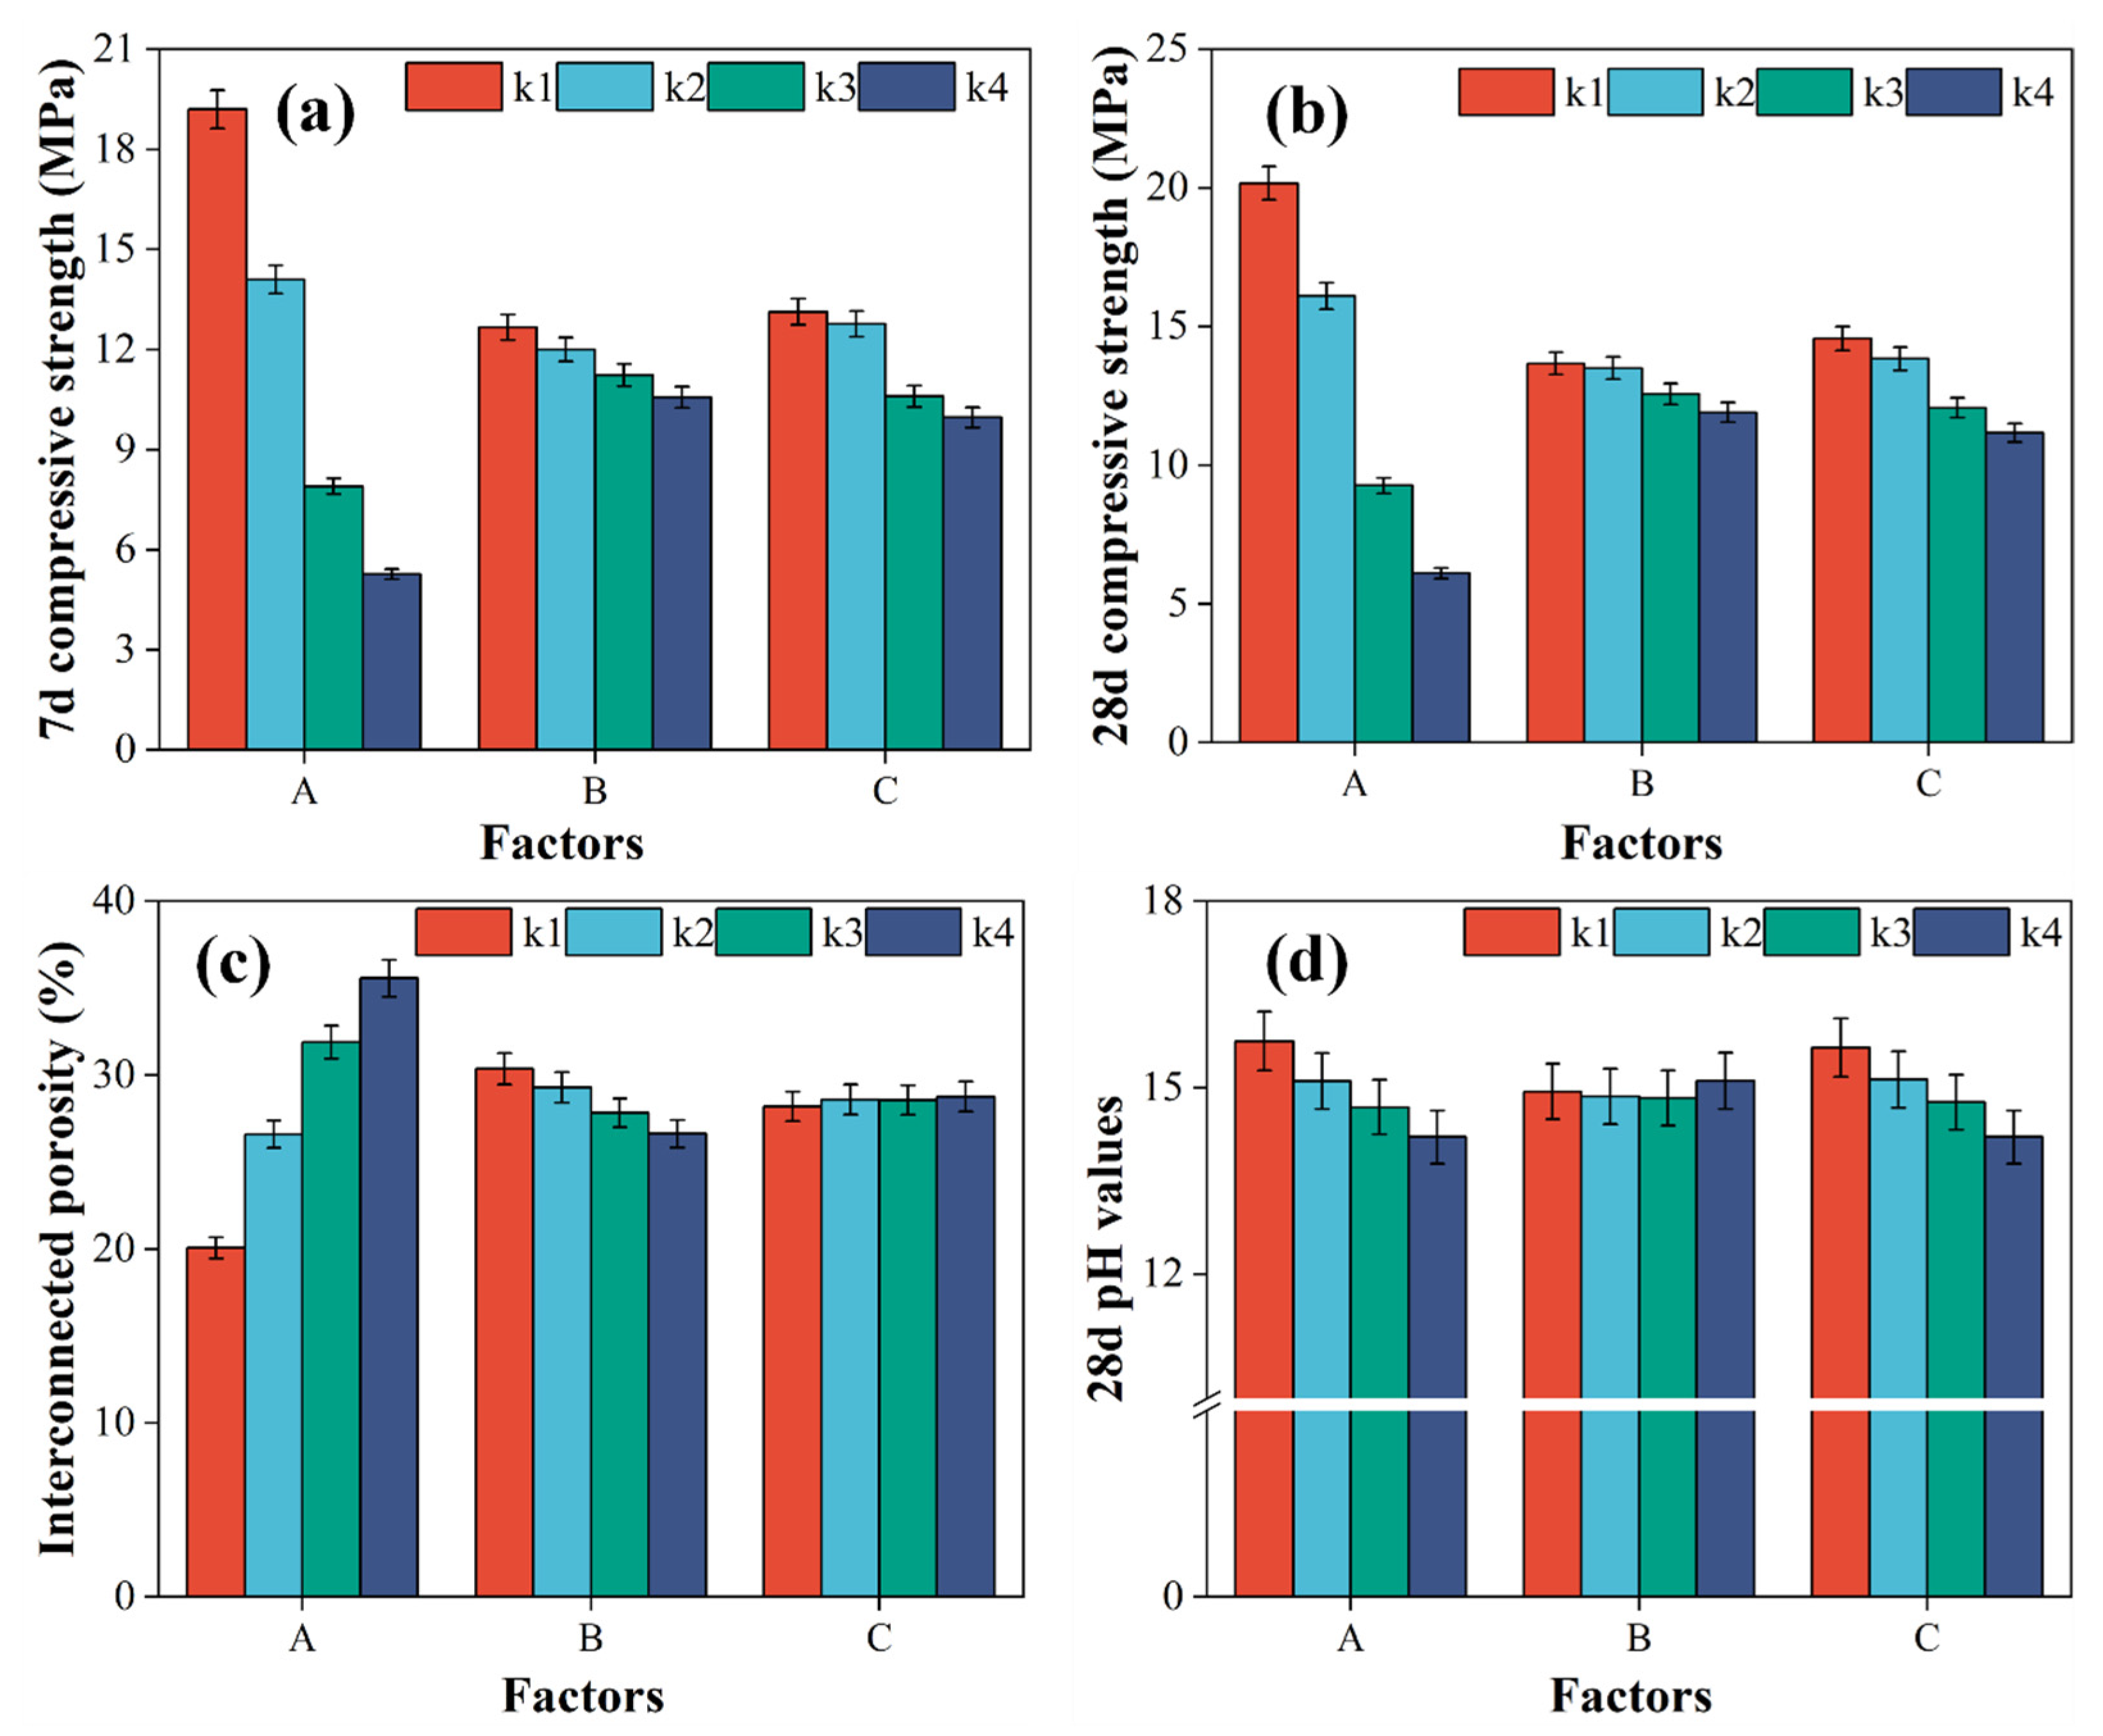
3.1. Range Analysis

The orthogonal experimental design was used to obtain the optimal mix design for PC. The compressive strength, interconnected porosity, and 28 d pH values were tested, as shown in Table 6. Additionally, the results of the range analysis are shown in Table 7, Table 8 and Table 9. The results of the single factor analysis are shown in Figure 6.

3.1.1. Compressive Strength

The important order of factor for compressive strength is PR > FA > W/B, and the significance levels are 1/4, 0.26, and 0%, respectively. As the PR decreases from 1/4 to 1/7, both the 7 d and 28 d compressive strength decrease. The reason for this is that the lower PR exceeds the optimal thickness of the paste for the aggregate, which leads to less porosity [27]. In addition, as the content of the FA increases from 0% to 30%, both the 7 d and 28 d compressive strength decrease. The reason for this is that the FA, as a pozzolanic material, shows slow rates of strength development [28]. As the W/B increases from 0.26 to 0.35, both the 7 d and 28 d compressive strength increase.

3.1.2. Interconnected Porosity

The important order of factor for interconnected porosity is PR> W/B > FA, and the significance levels are 1/7, 0.26, and 30%, respectively. As the PR decreases from 1/4 to 1/7, the interconnected porosity increases. The reason for this is that clogging between adjacent aggregate is eliminated when the content of aggregate increases and the content of cement paste decreases [29]. In addition, as the W/B increases from 0.26 to 0.35, the interconnected porosity decreases. The reason for this is that the lower water content results in a higher consistency of fresh cement paste, which easily wraps around the aggregate and strengthens the stress regions. As the content of FA increases from 0% to 30%, the interconnected porosity increases. The reason for this is that the FA addition level can increase the workability of fresh cement paste, which then easily wraps around aggregate [30].

3.1.3. Alkalinity

The important order of factor for alkalinity is PR > FA > W/B, and the significance levels are 1/4, 0.35, and 0%, respectively. As the PR decreases from 1/4 to 1/7, the 28 d pH values decrease. The reason for this is that the content of cement is reduced. The pH values of concrete are mainly determined by the hydration of the cement. In addition, as FA addition level increases from 0% to 30%, the 28 d pH values decrease. The reason for this is that the use of FA reduces the content of cement. As W/B increases from 0.26 to 0.35, the 28 d pH values first increase and then decrease. The reason for this is that the low W/B lacks sufficient water to hydrate, but then hydration is promoted by soaking in the distilled water, which releases more OH.
In summary, we consider the PR the most important factor to affecting the relevant properties, including the compressive strength, interconnected porosity, and alkalinity. According to the results of the range analysis and related requirements of the Chinese industrial standard JC/T 2557-2020 [25], the optimal PR, W/B, and FA are 1/5, 0.29, and 10%, respectively.

3.2. Alkali Reduction Treatments

The three alkali reduction treatments, including the planting substrate method, the solution-soaking method, and the spraying method, were used to reduce the alkalinity of the PC. The effects of the alkali reduction treatments were evaluated using the changed pH values and compressive strength.

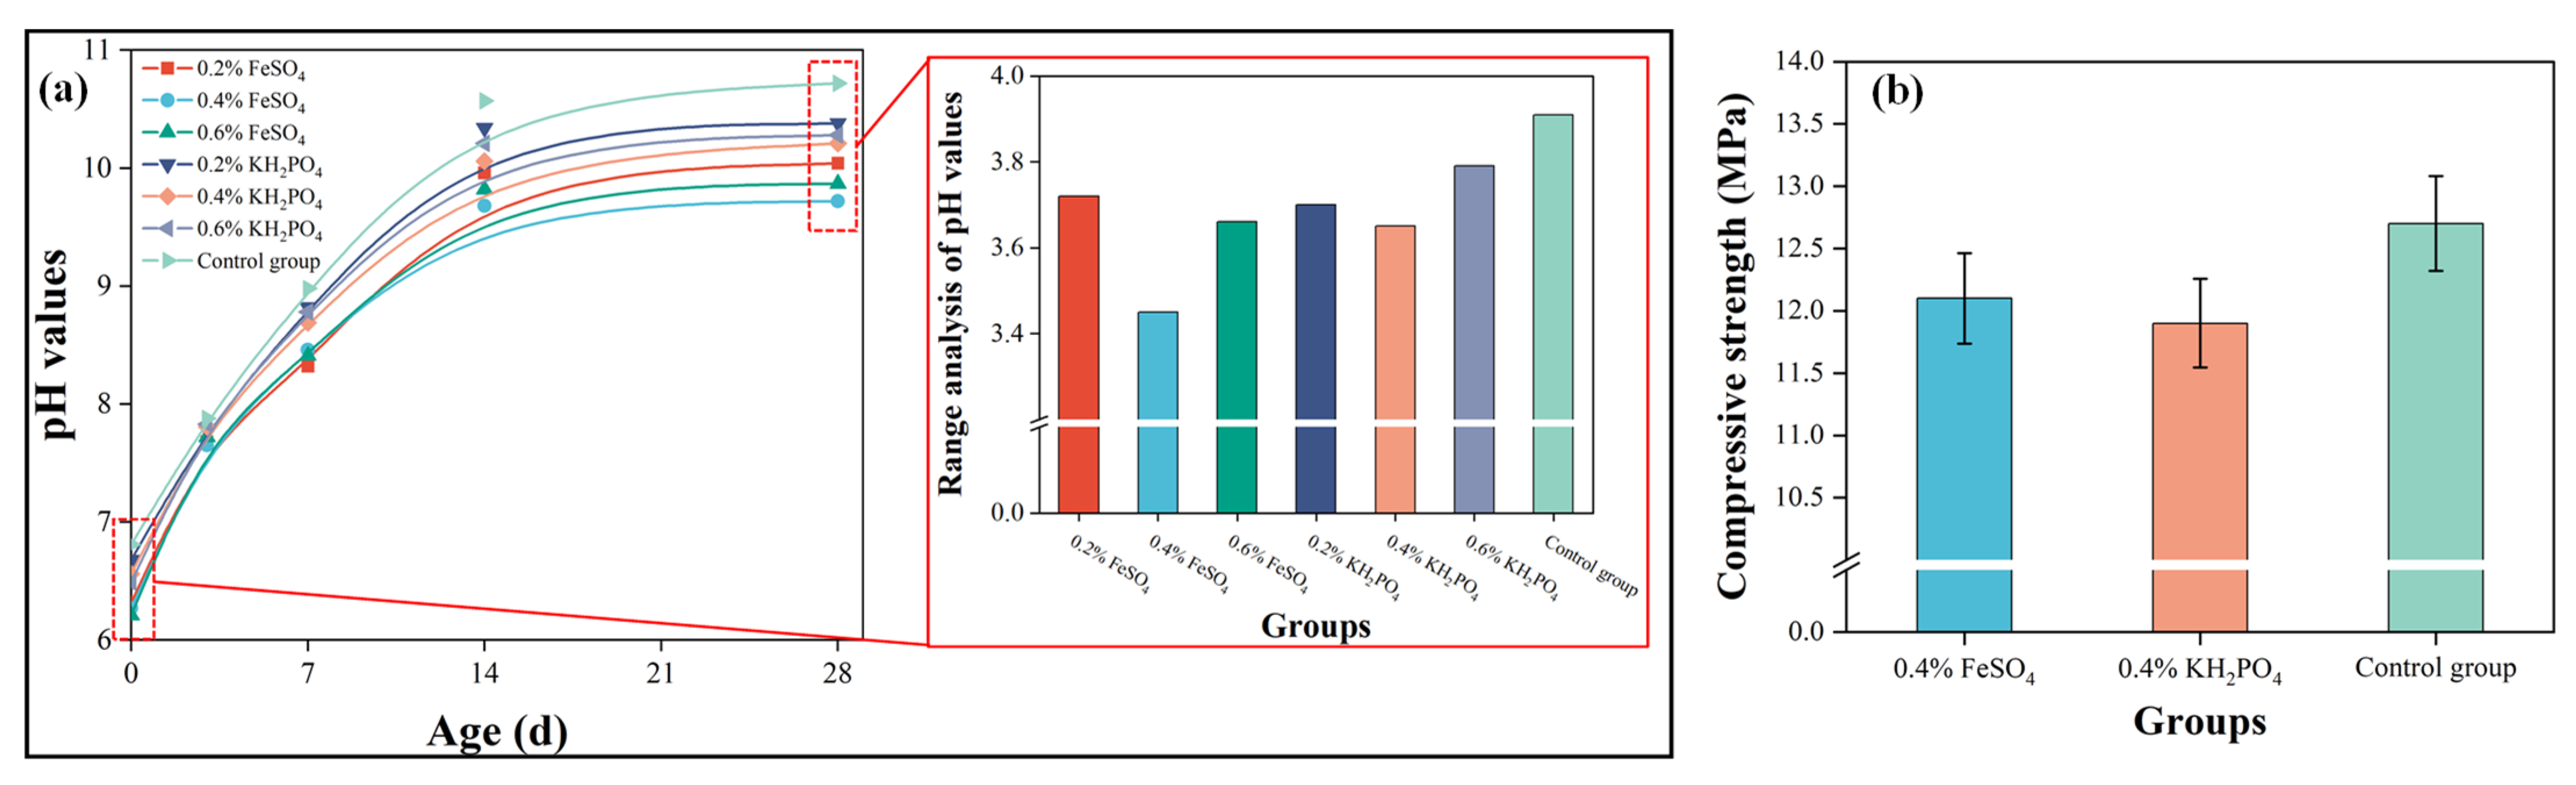
3.2.1. Planting Substrate Method

Unlike concrete, the planting substance directly touches the plant roots. Therefore, low pH values of planting substances are essential for plant growth. The changed pH values and the range analysis are shown in Figure 7a. As the concentration of ferrous sulfate increased from 0.2% to 0.6%, the range decreased by 5–12%. Additionally, as the concentration of potassium dihydrogen phosphate increased from 0.2% to 0.6%, the range decreased by 3–9%. Therefore, based on the range analysis, both ferrous sulfate and potassium dihydrogen phosphate at concentrations of 0.4% are effective treatments. Subsequently, the compressive strength was tested, as shown in Figure 7b. Compared with the control group, the compressive strength of the specimens which were treated using ferrous sulfate and potassium dihydrogen phosphate at concentration of 0.4% decreased by 5% and 6%, respectively. Therefore, ferrous sulfate at a concentration of 0.4% produces lower alkalinity and compressive strength loss.

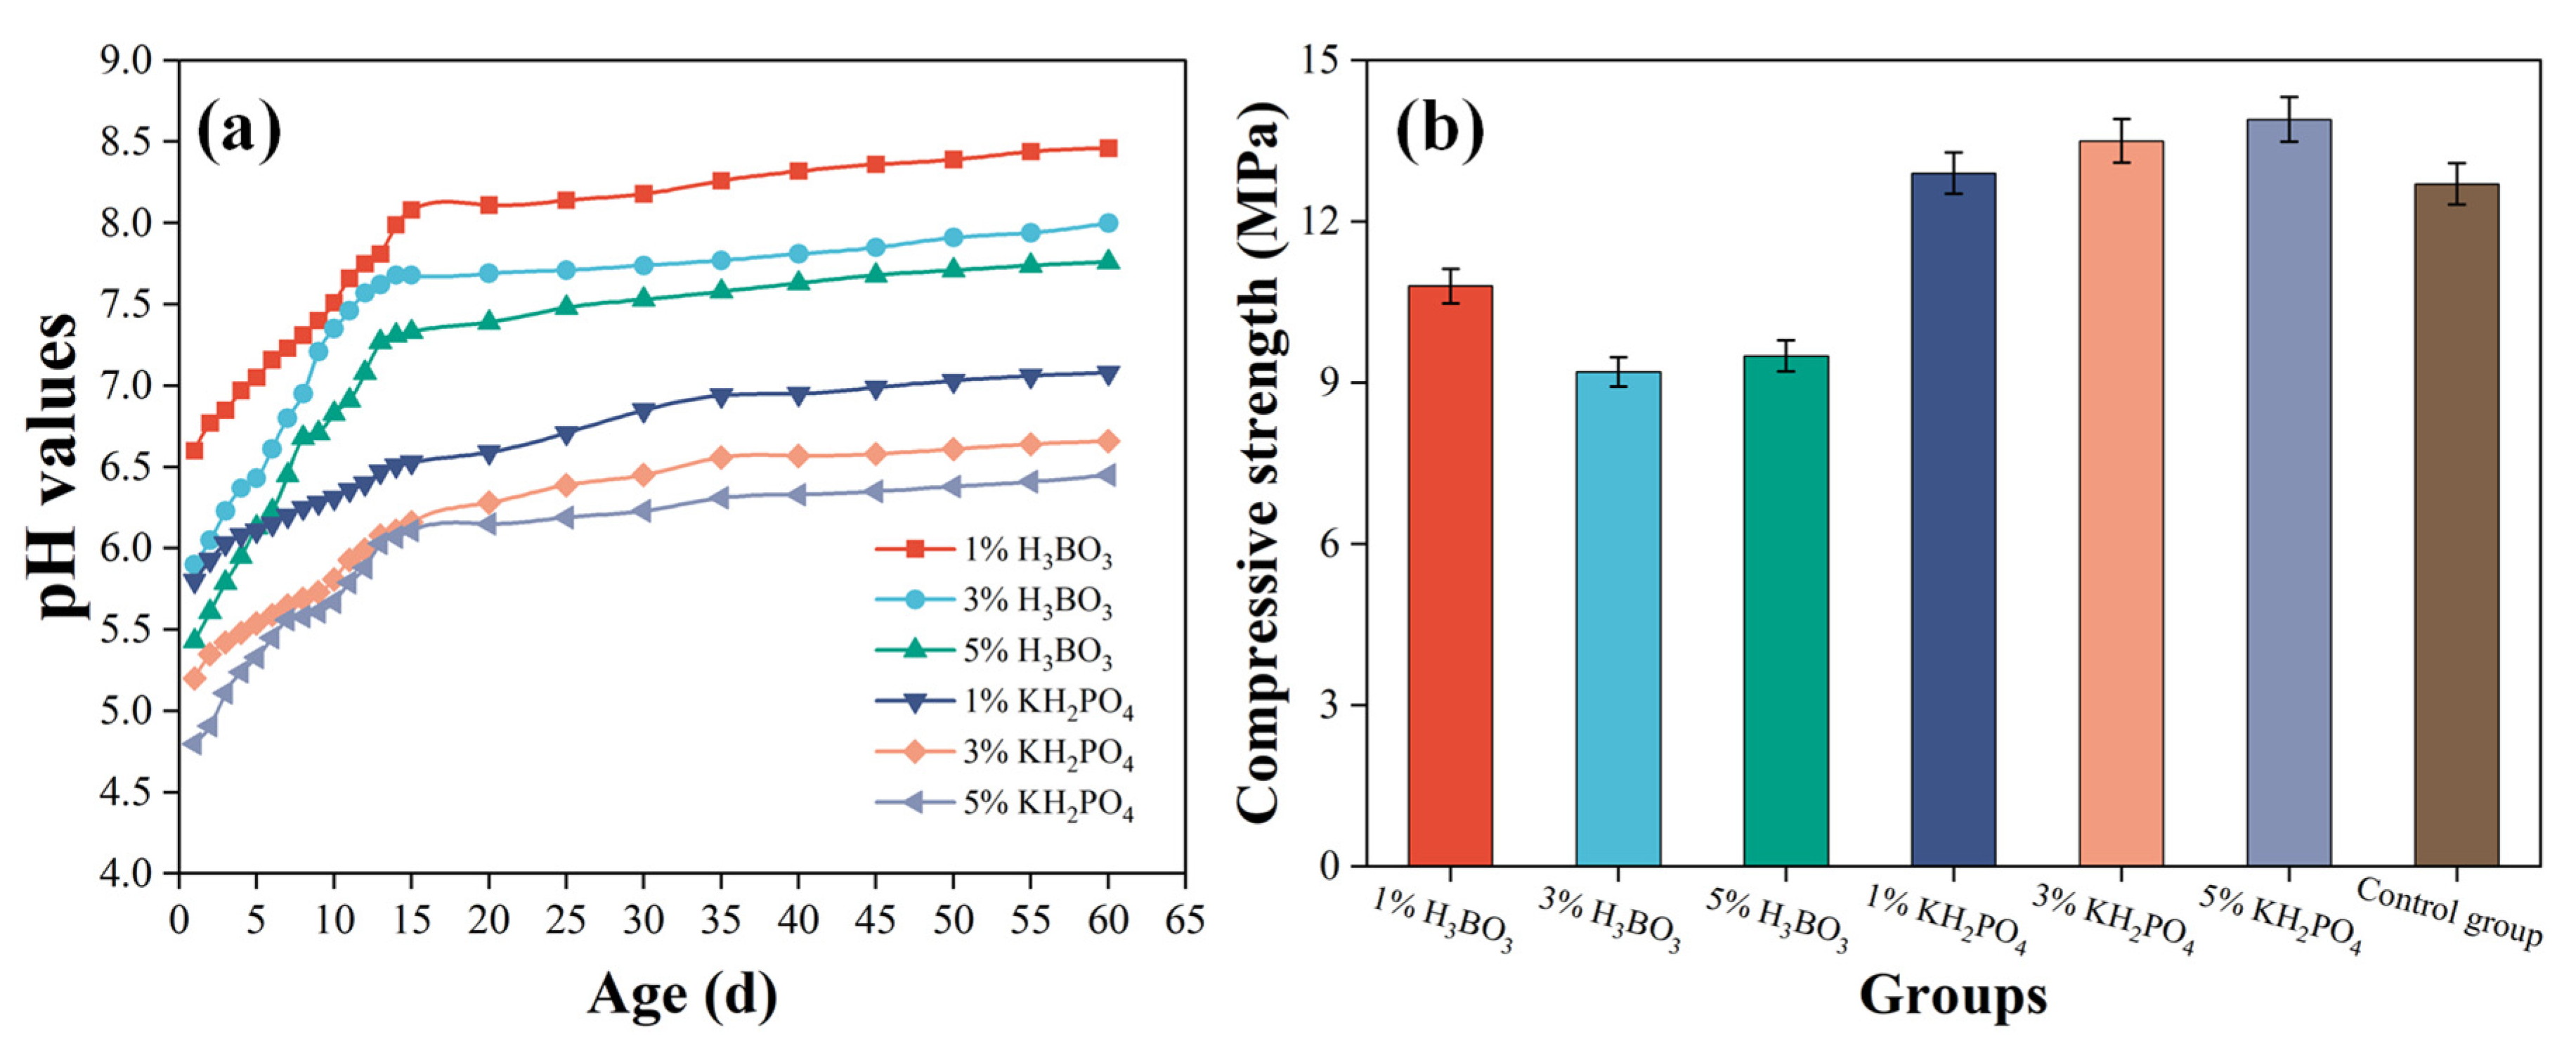
3.2.2. Solution-Soaking Method

The solution-soaking method aims to directly reduce the alkalinity of the PC. The changed pH values are shown in 
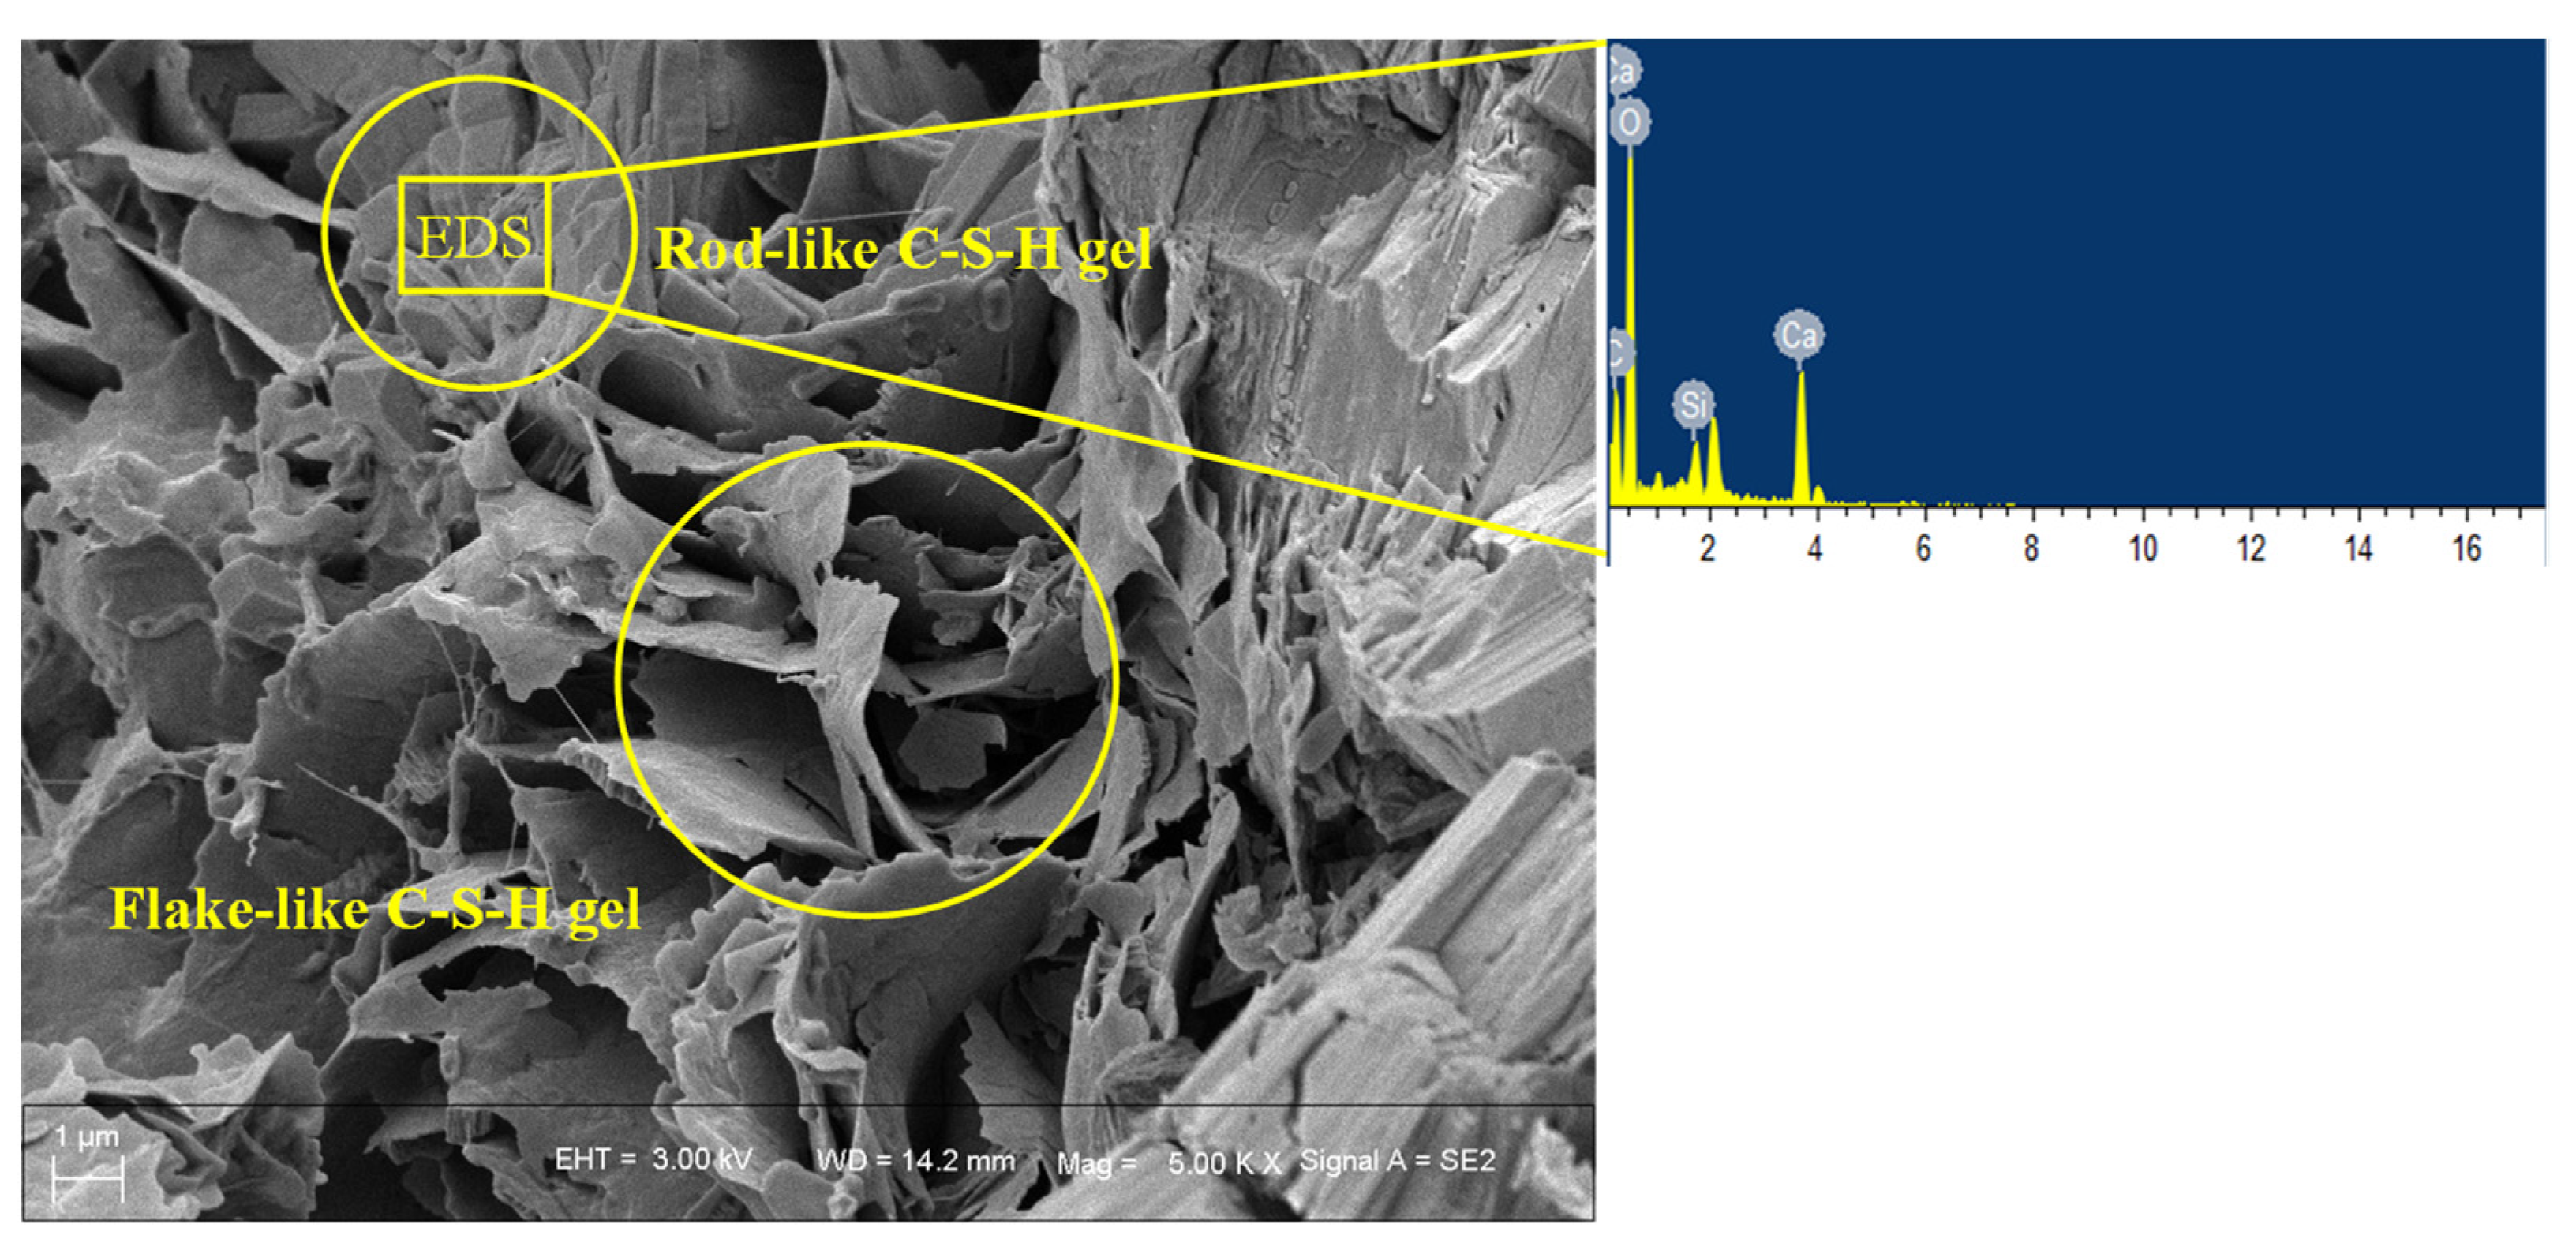
Figure 8a. As the concentration of boric acid increased from 1% to 5%, the pH values changed by 0.28, 0.36, and 0.43. Additionally, as the concentration of potassium dihydrogen phosphate increased from 1% to 5%, the pH values changed by 0.22, 0.28, and 0.34. The reason for this is that boric acid reacts with calcium hydroxide, as shown in reactions (1) and (2). Therefore, the alkalinity of the hardened cement paste is reduced, and the morphology of the C-S-H gel changes, as shown in Figure 9. Additionally, the compressive strength of each group is shown in Figure 8b. The compressive strength loss produced by the use of boric acid is bigger than that produced using potassium dihydrogen phosphate. It is worth noting that as the concentration of potassium dihydrogen phosphate increased from 1% to 5%, the compressive strength increased from 2% to 9%. The reason for this is that the porous spaces of the hardened cement paste was filled with calcium phosphate, which is insoluble in water. In conclusion, we consider potassium dihydrogen phosphate at a concentration of 3% to be optimum.
2H3BO3 + 3Ca(OH)2 = Ca3(BO3)2 + 6H2O
3Ca(OH)2 + P2O5 = Ca3(PO4)2 + 3H2O

3.2.3. Spraying Method

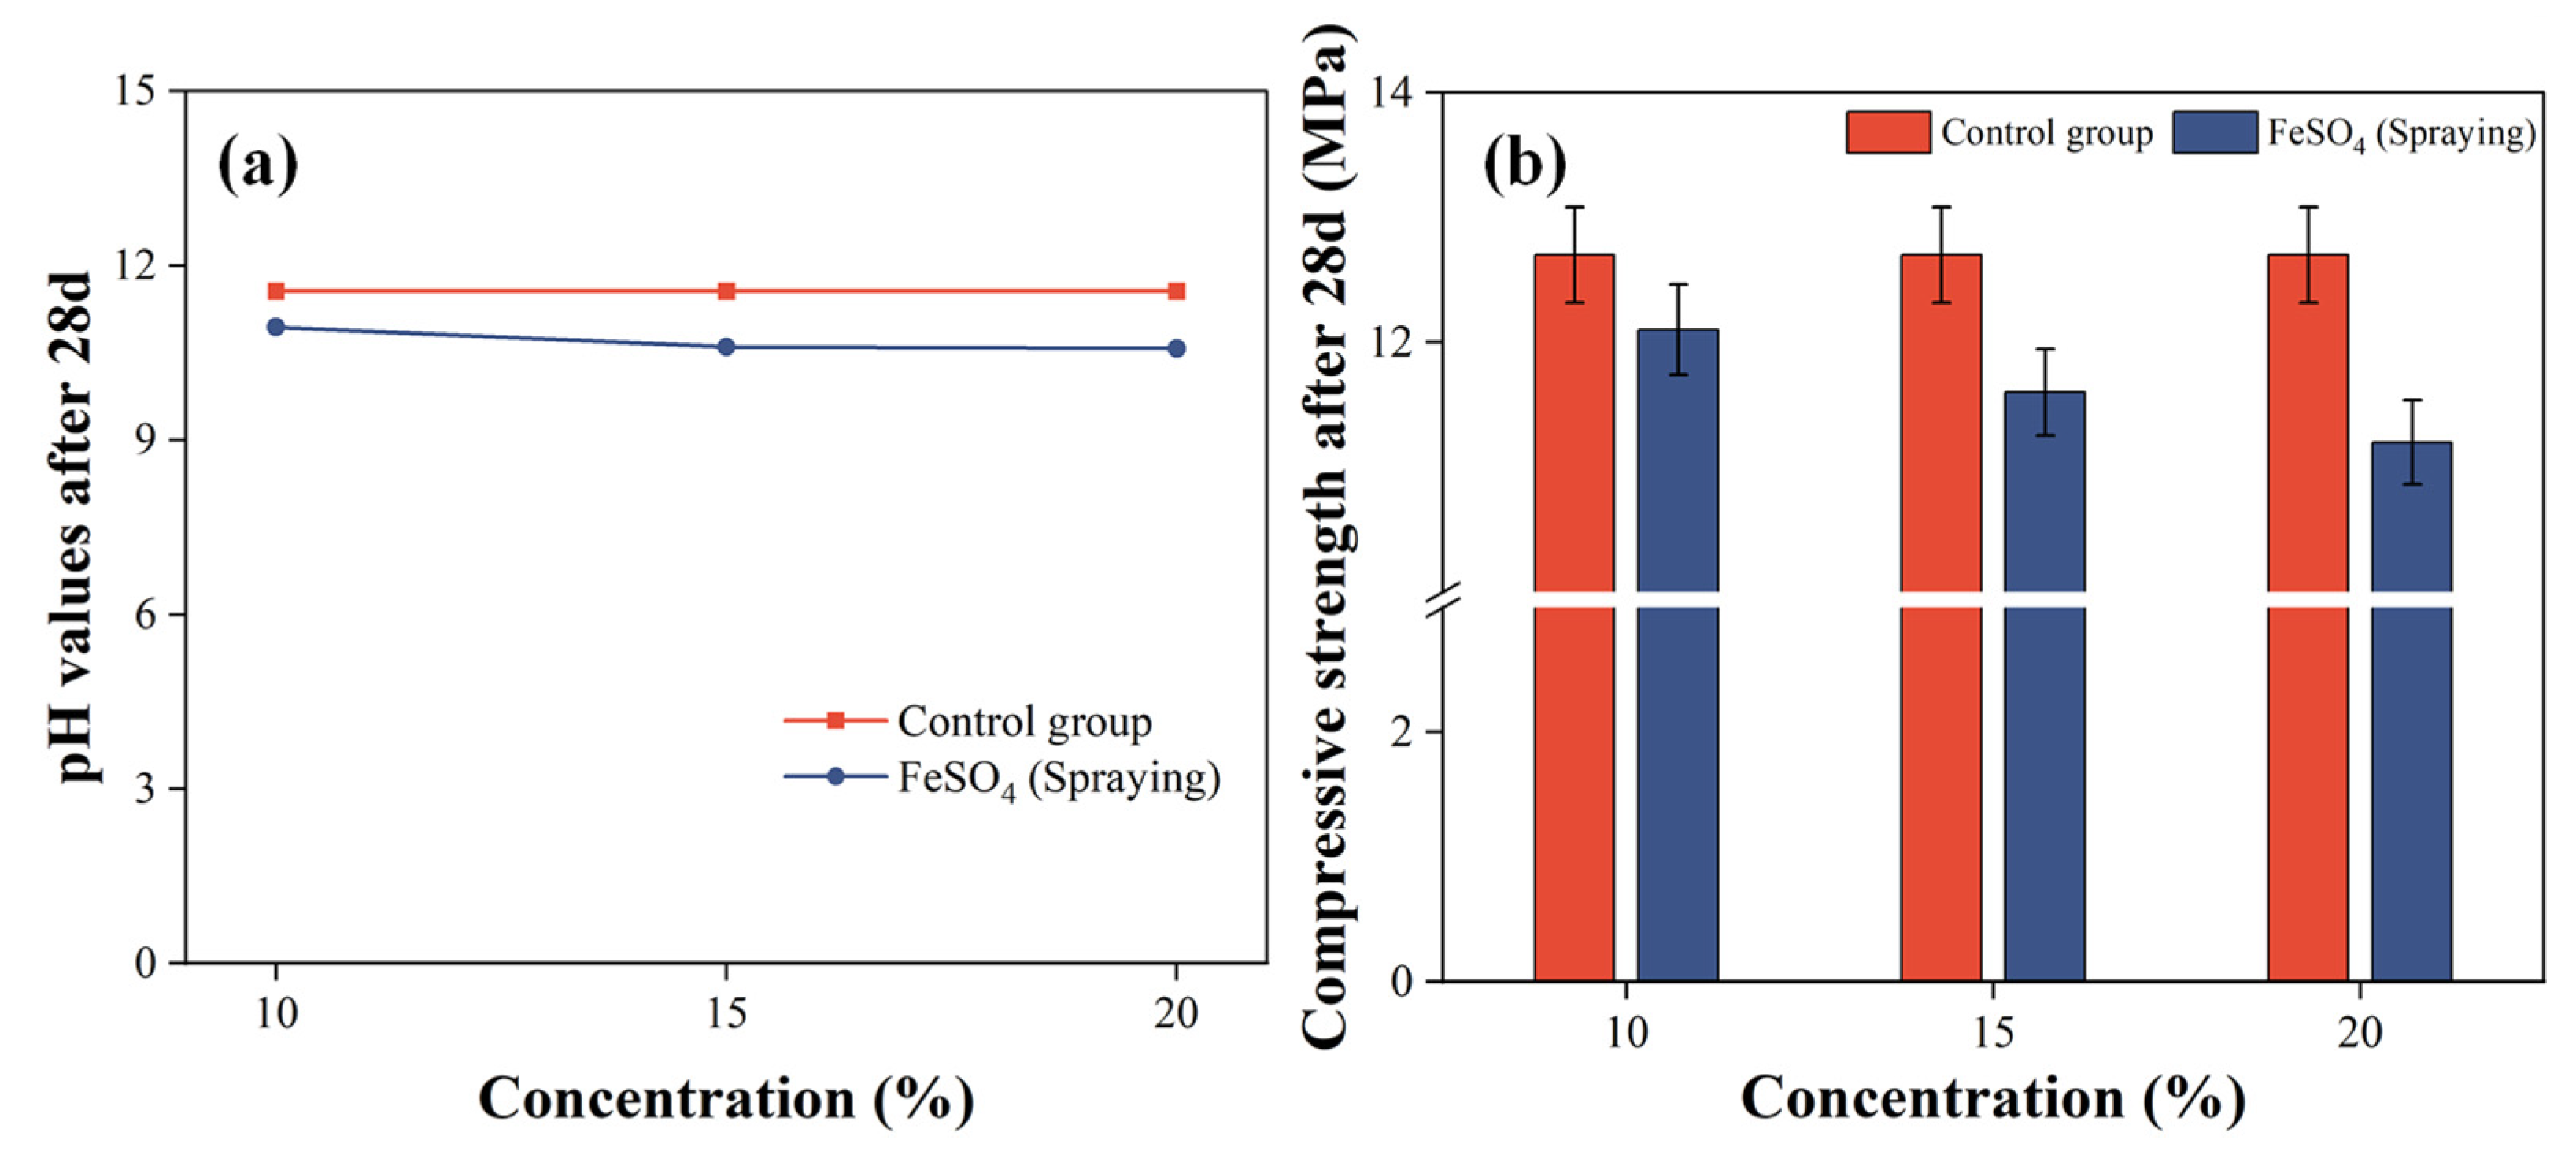
Spraying is the normal method due to the easiness of the operation. The changed pH values are shown in Figure 10a. As the concentration of ferrous sulfate increased from 10% to 20%, the pH values changed by 0.62, 0.96, and 0.99. The reason for this is that ferrous sulfate reacts with calcium hydroxide, as shown in reactions (3)–(5). Ferric oxide deposits on the surface of the PC, which may prevent the OH- from releasing. additionally, as the concentration of ferrous sulfate increased from 10% to 20%, the compressive strength decreased from 5% to 12%, as shown in Figure 10b. The reason for this is that ferrous sulfate stays for a long time on the surface, resulting in an excess state. Therefore, the reaction always trends to consume calcium hydroxide, which leads to obvious compressive strength loss.
Ca(OH)2 + FeSO4 = Fe(OH)2 + CaSO4
4Fe(OH)2 + 2H2O + O2 = 4Fe(OH)3
2Fe(OH)3 = Fe2O3 + 3H2O

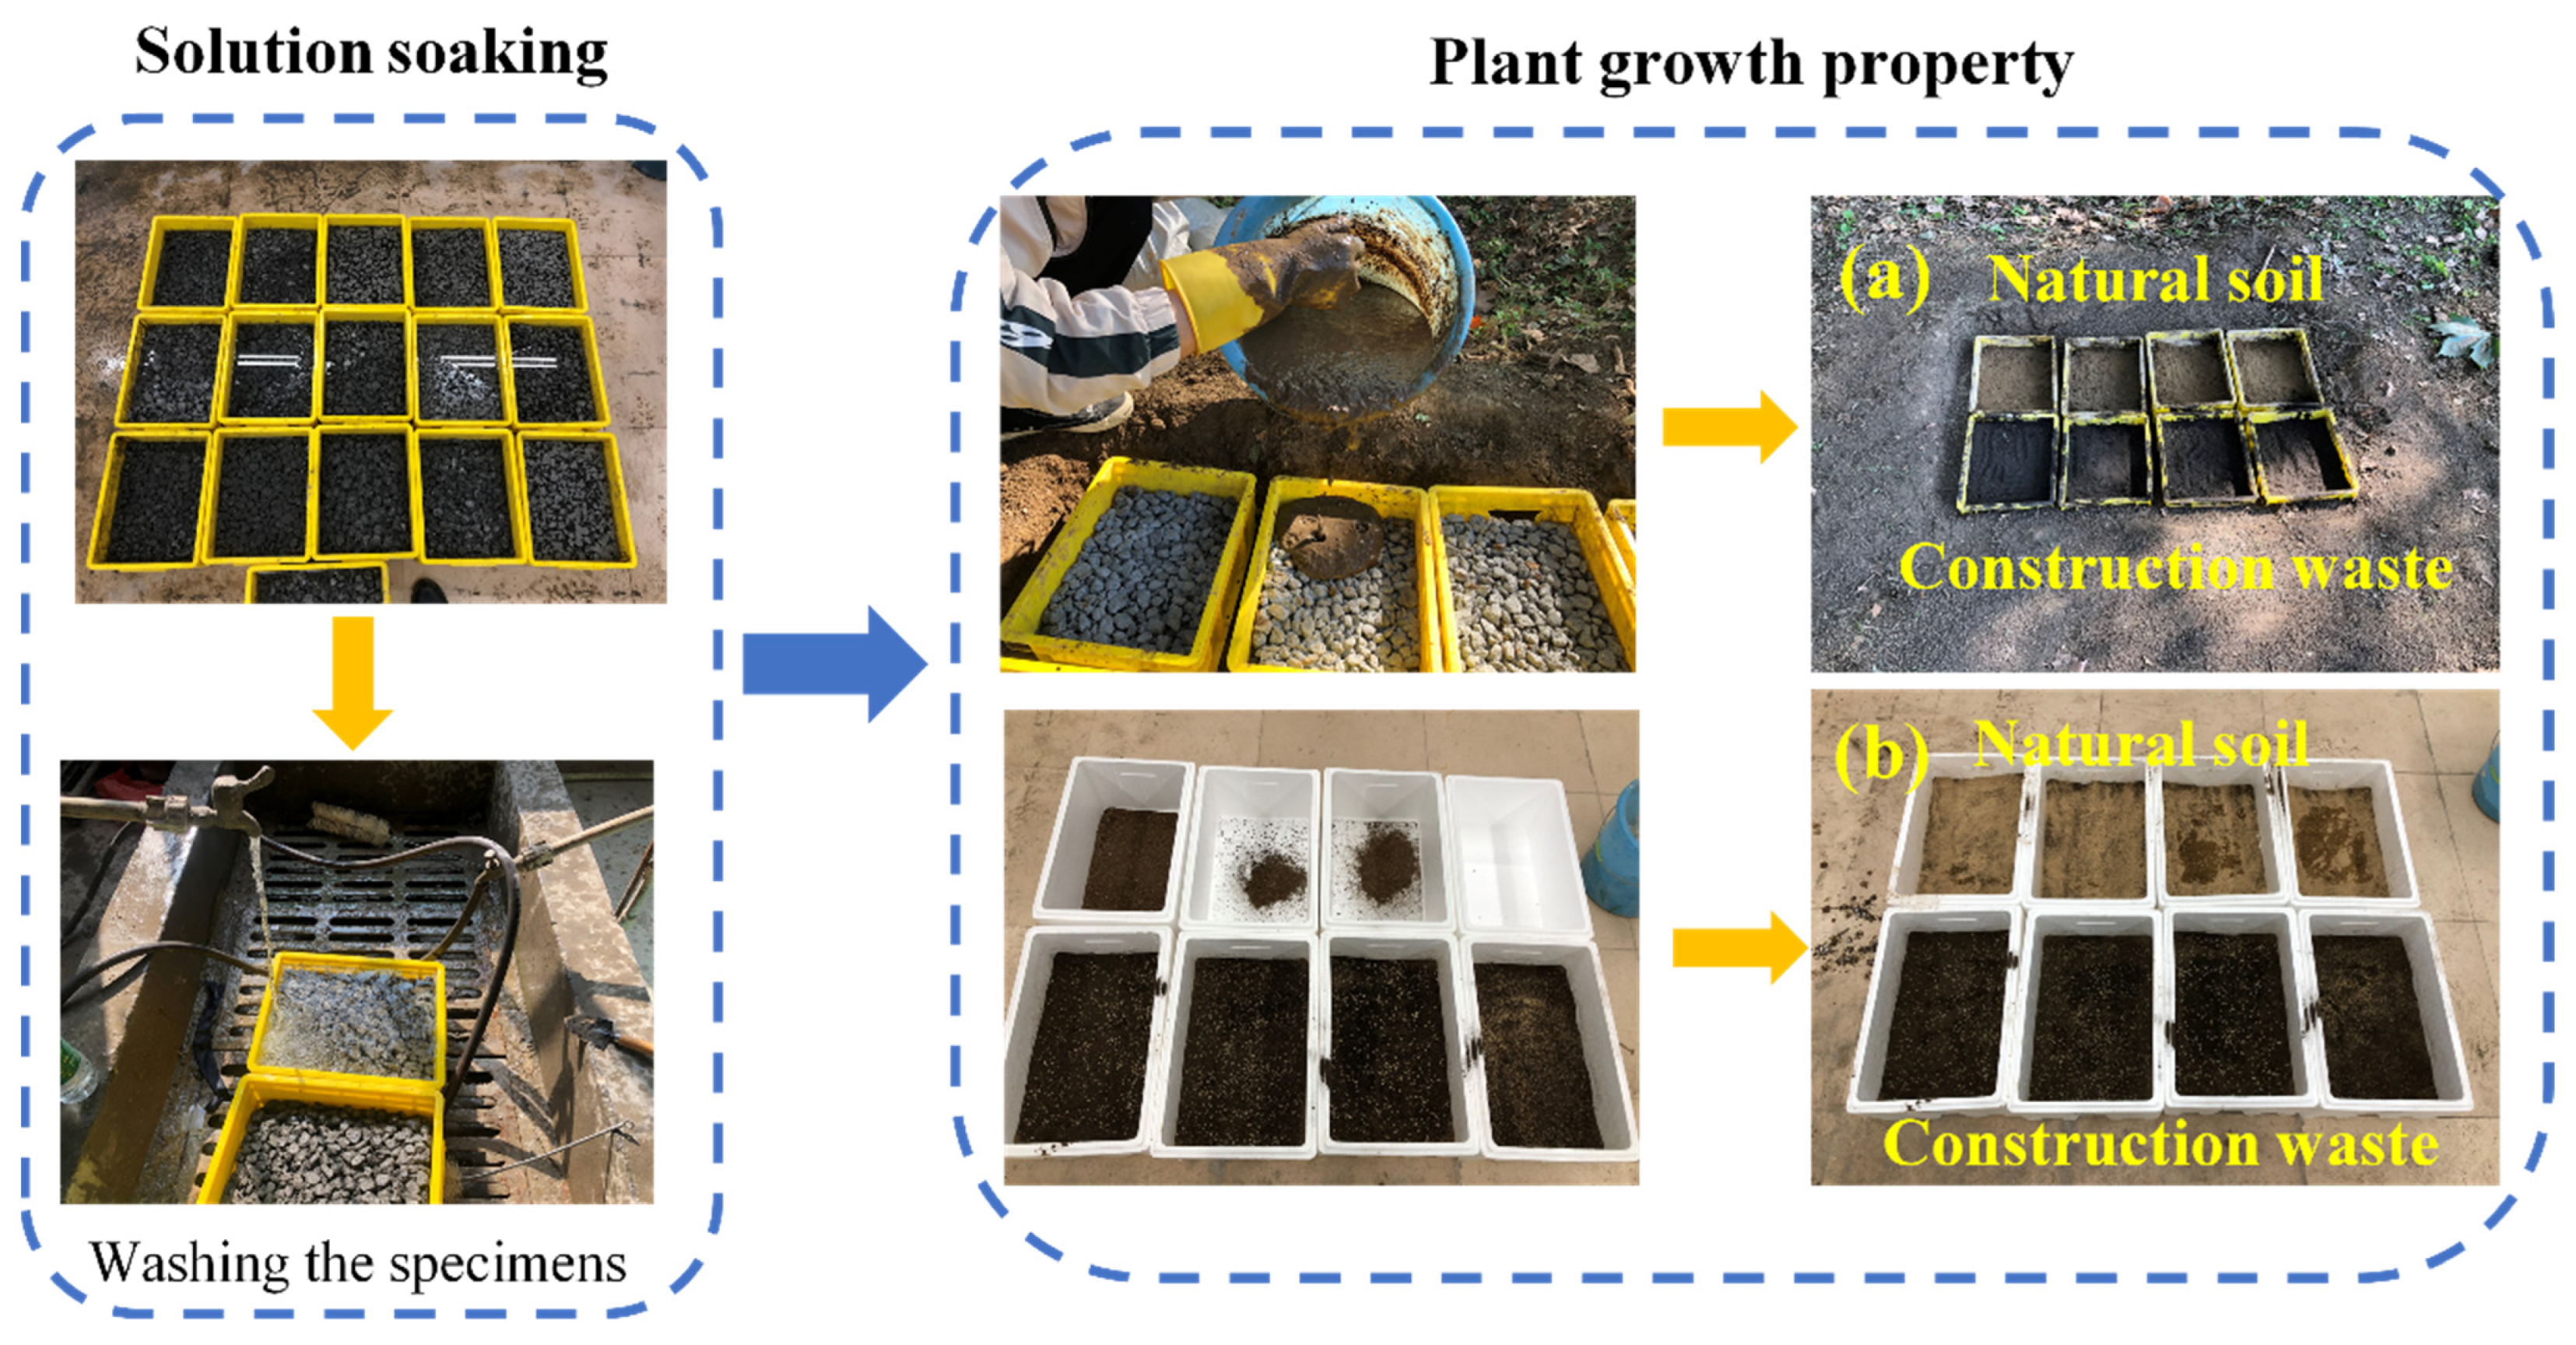
3.3. Plant Growth Properties

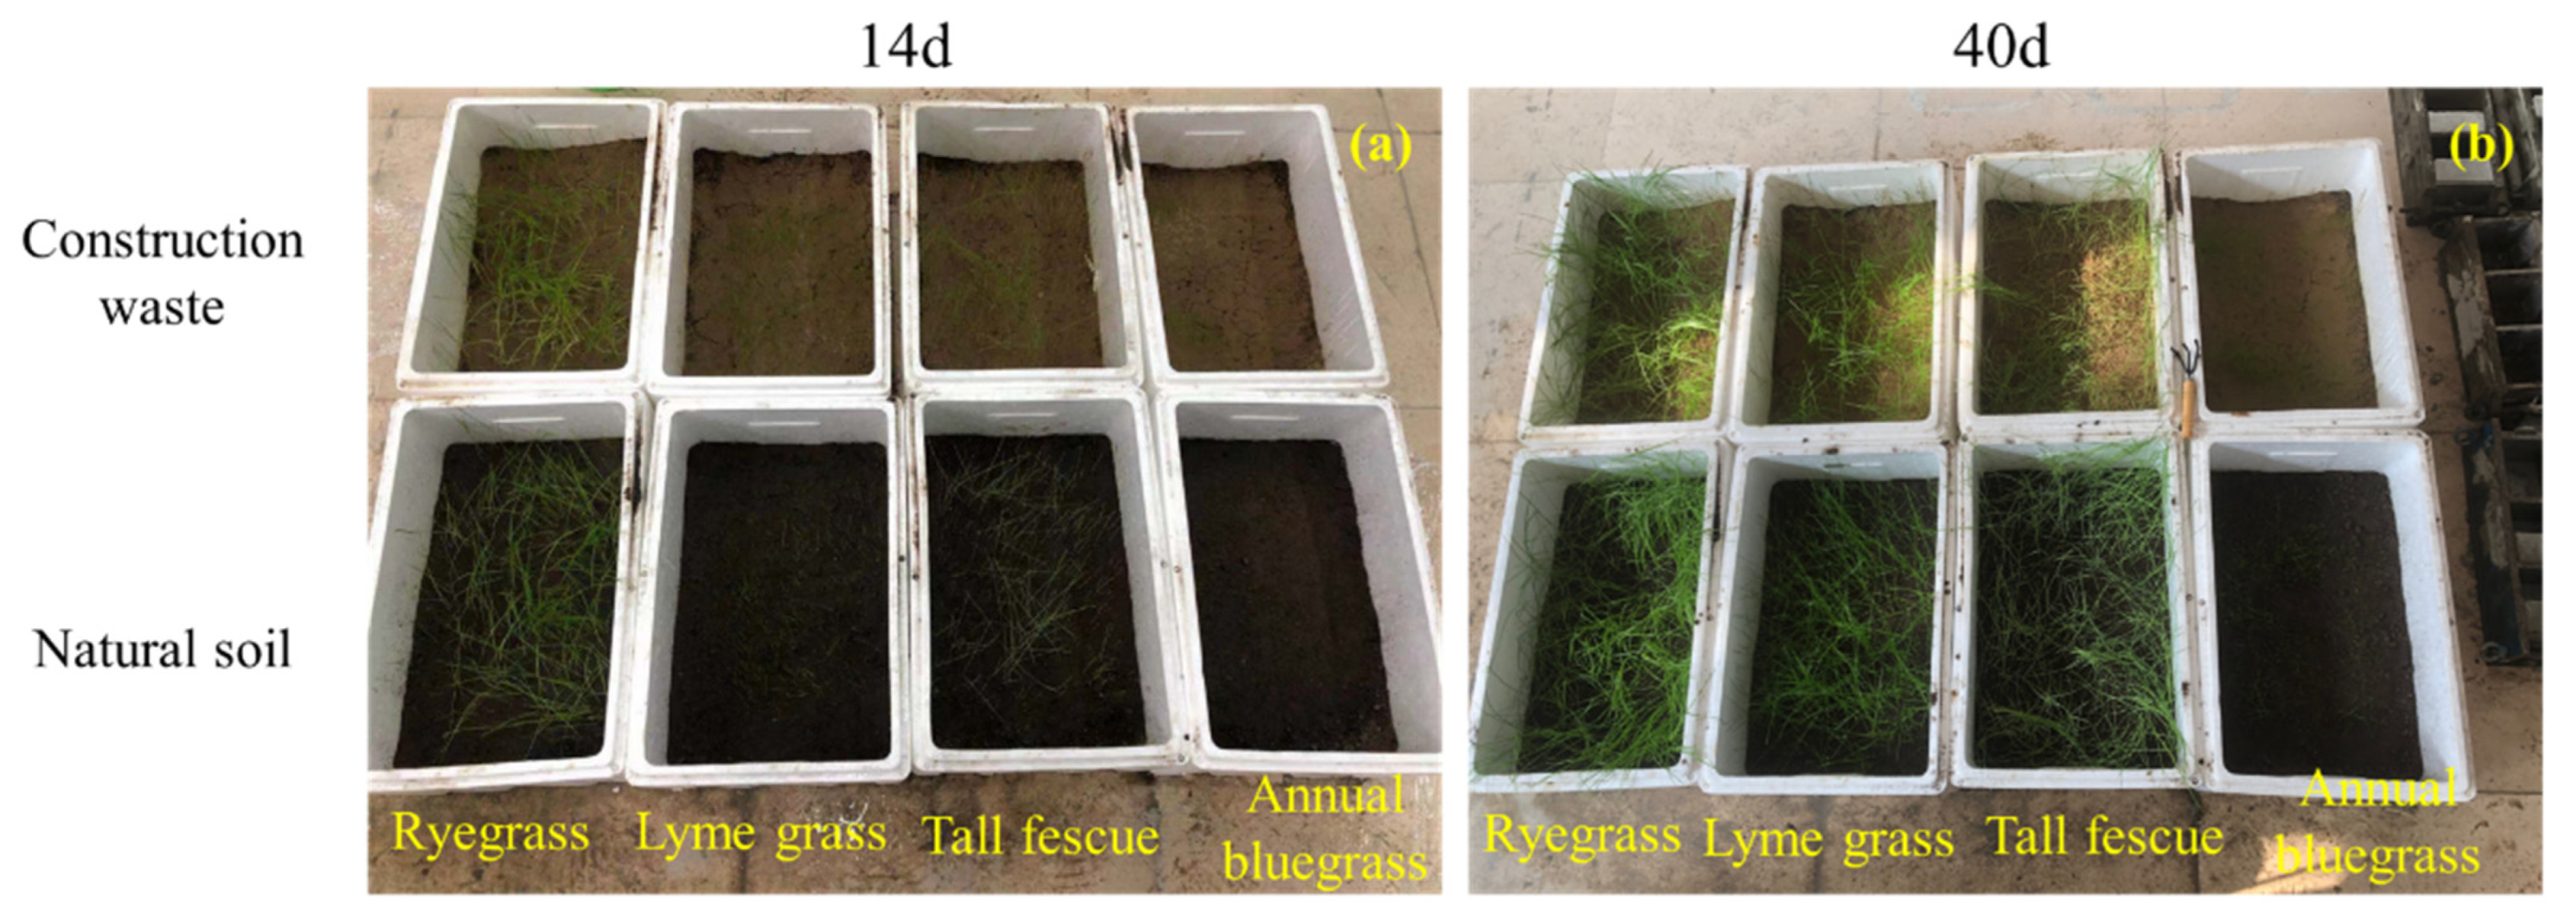
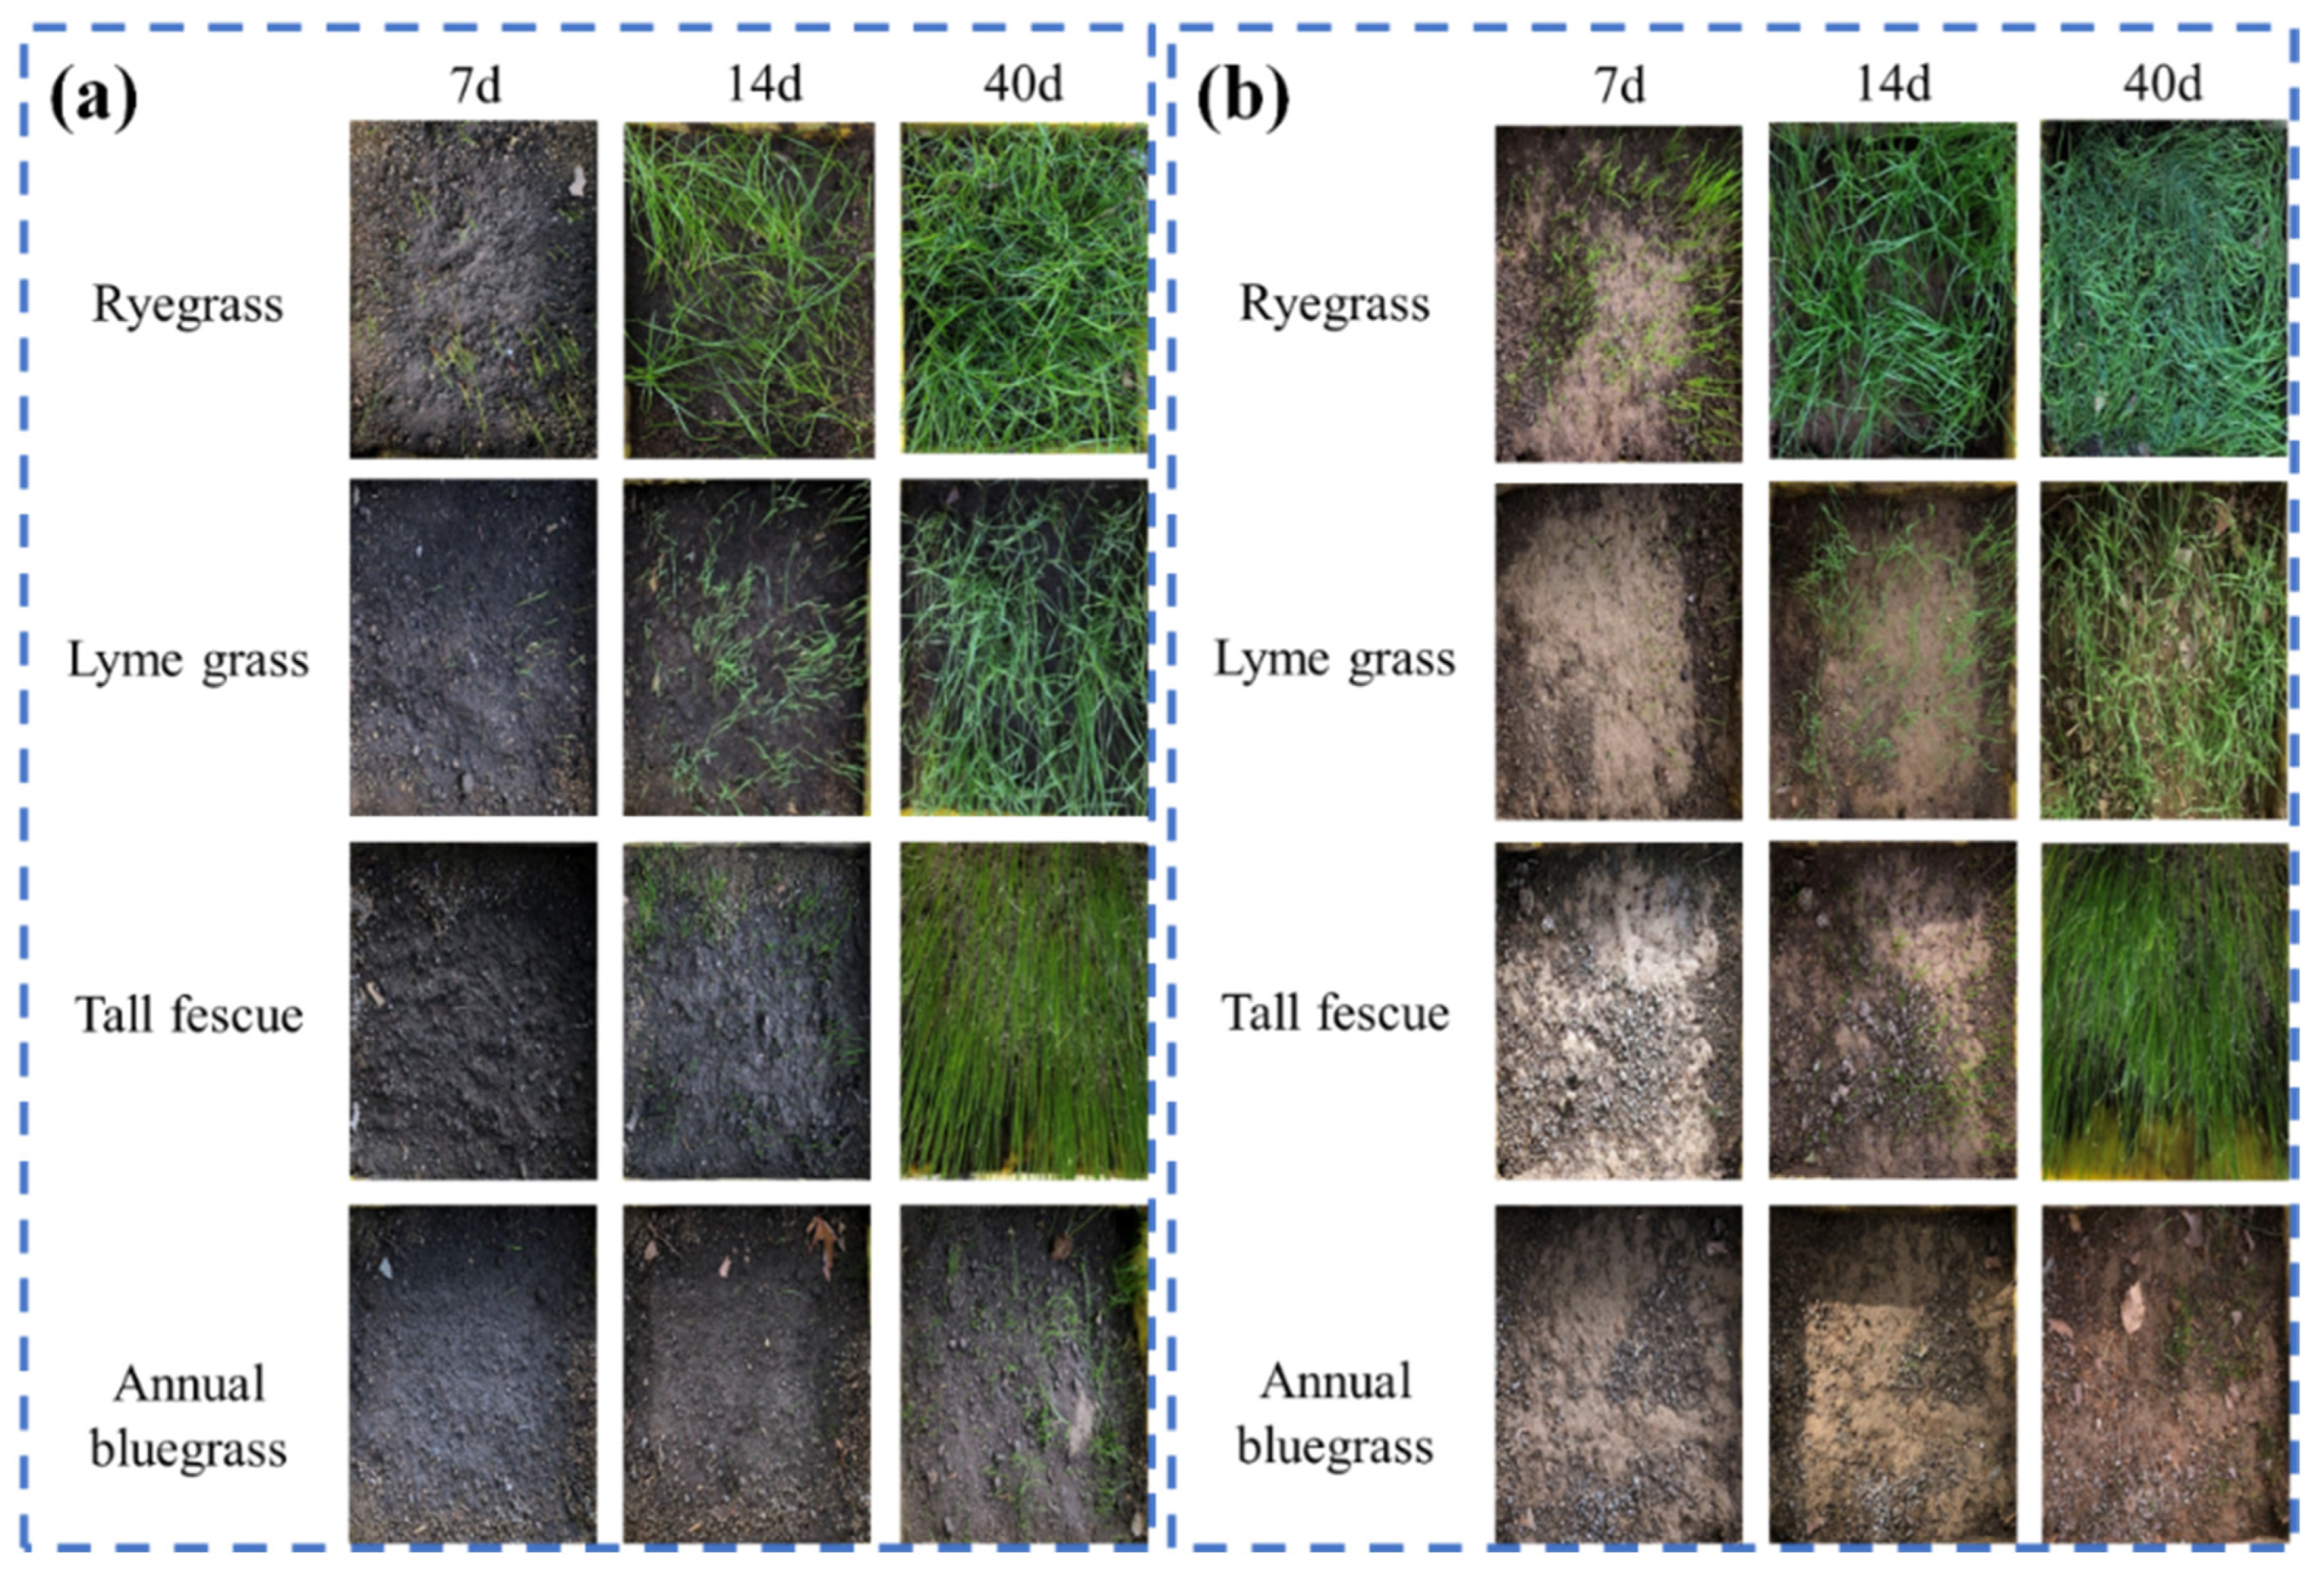
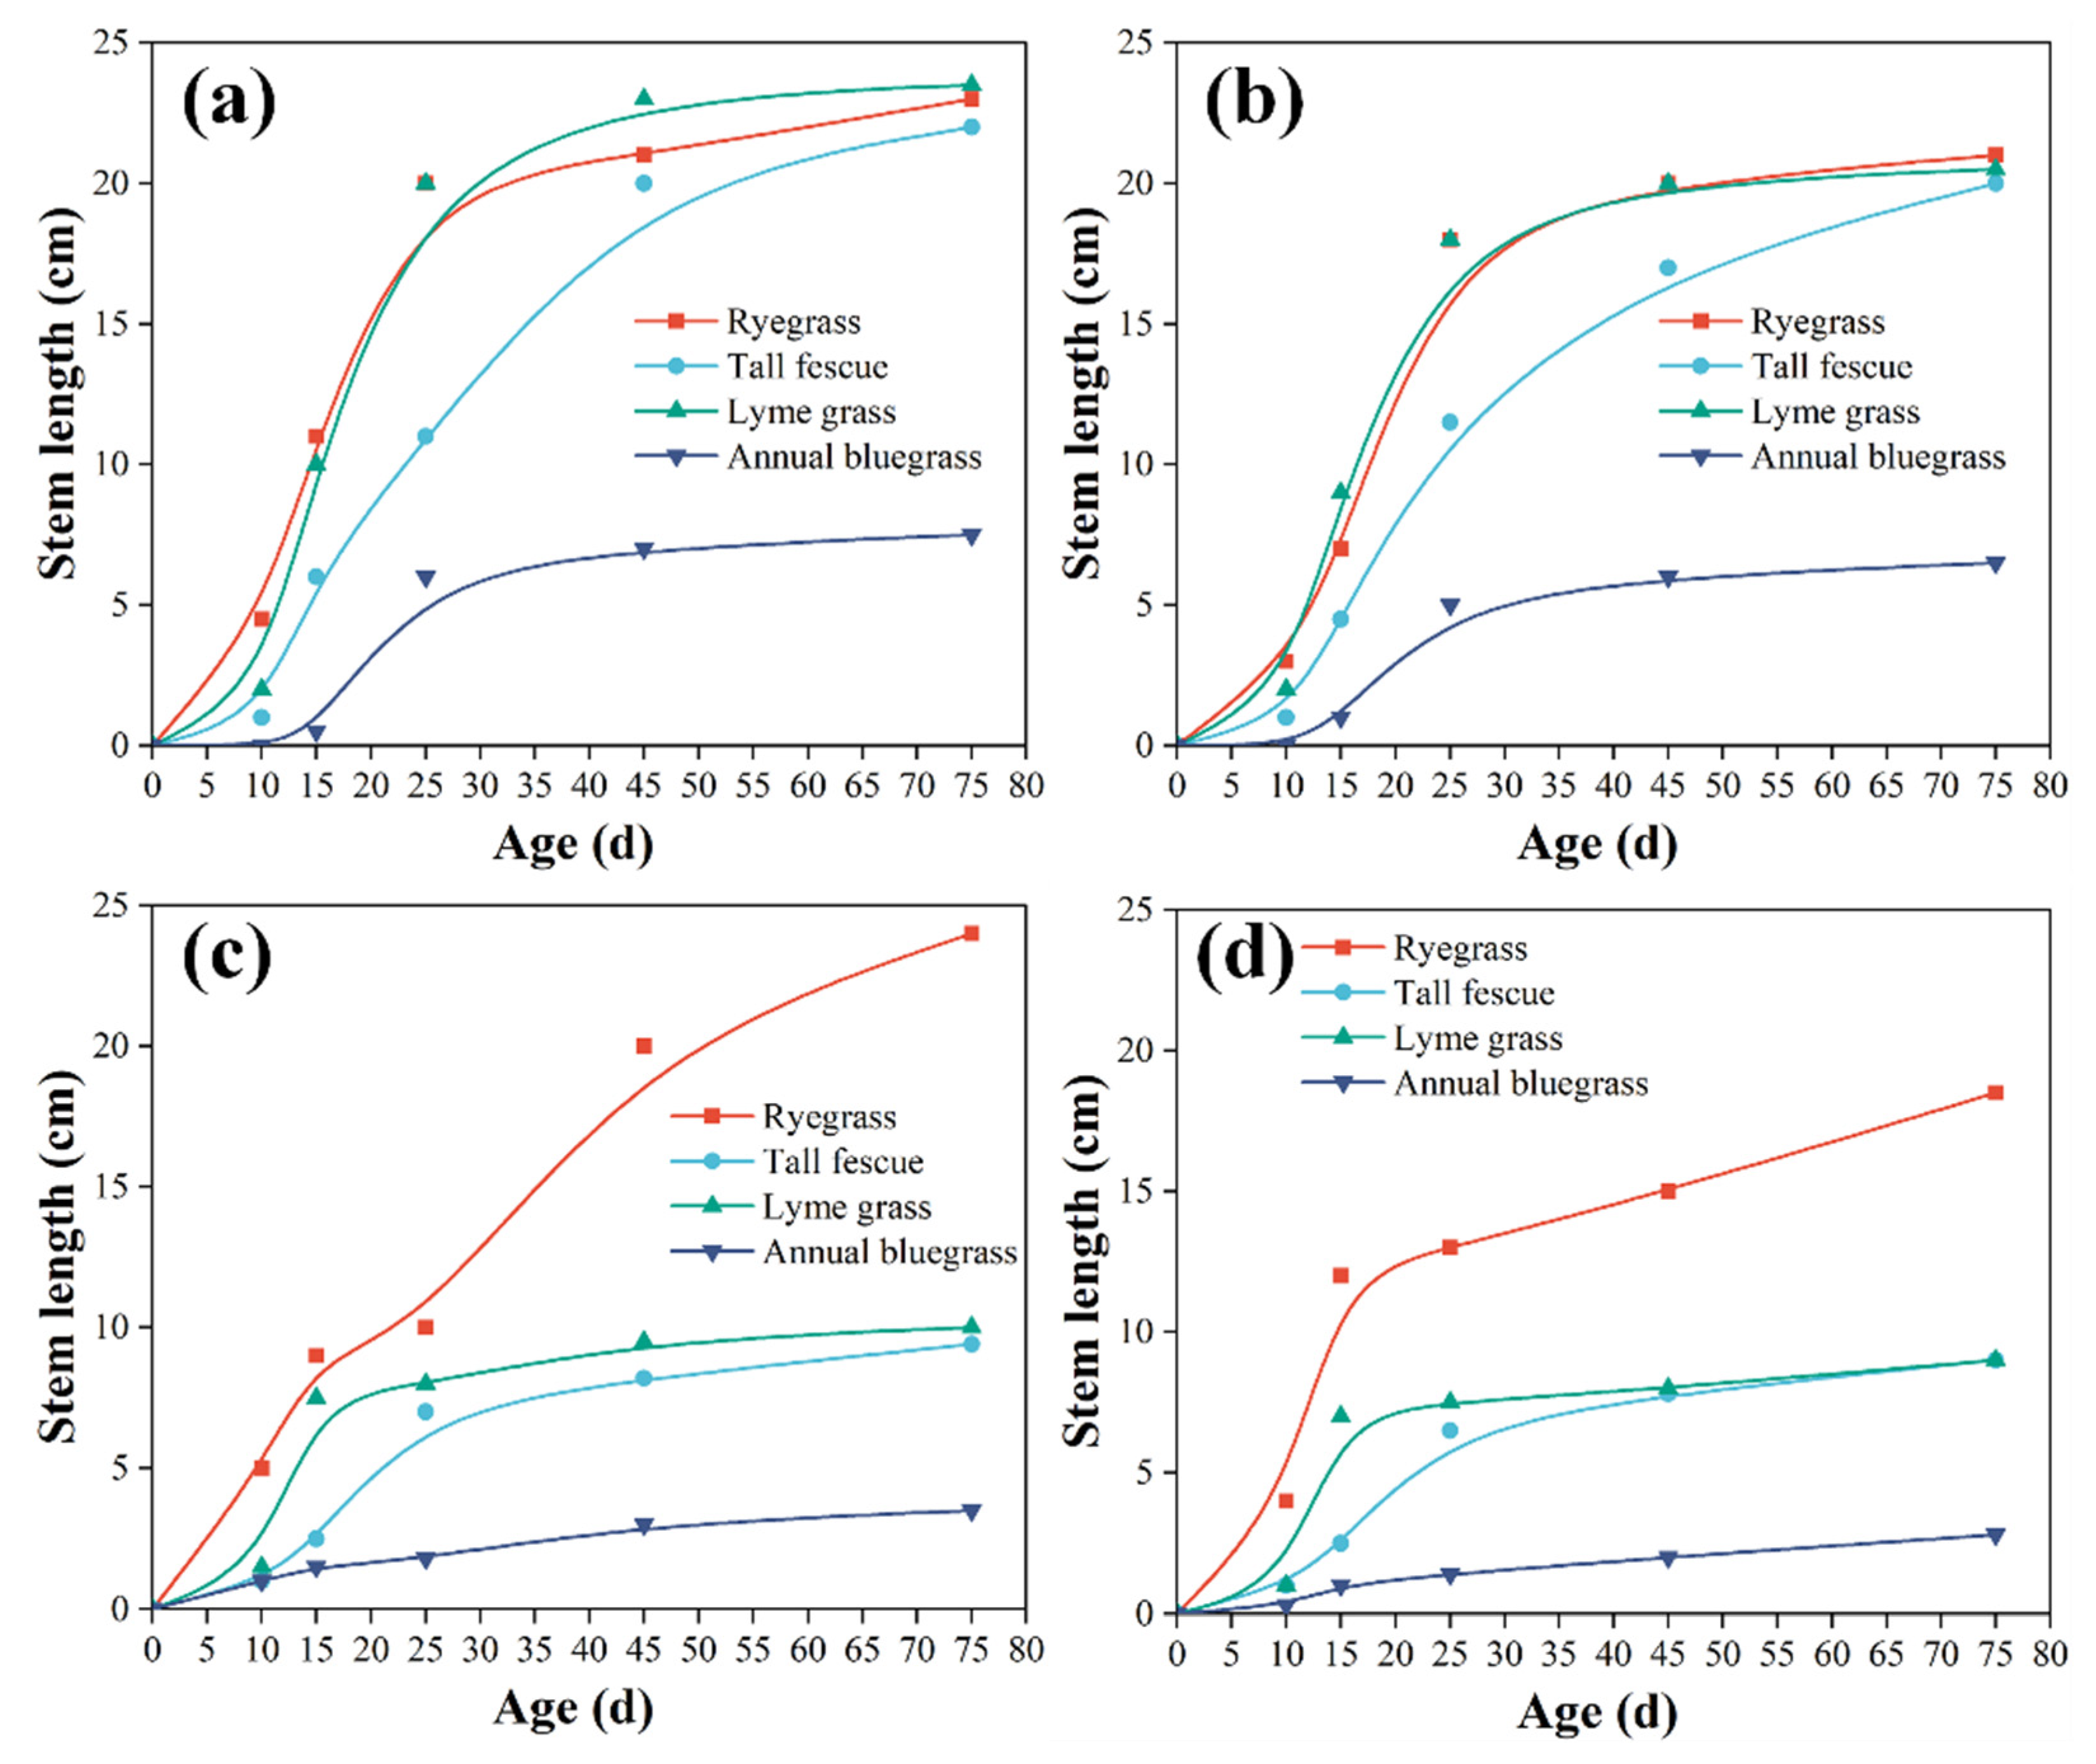
Based on the discussion above, both the planting substance method and solution-soaking method were used to reduce the alkalinity of the PC. Macrographs of the planting are shown in Figure 11 and Figure 12, and the changed stem length with age is shown in Figure 13. The germination order is as follows: outdoors: ryegrass, lyme grass, tall fescue, annual bluegrass; indoors: ryegrass, tall fescue, lyme grass, annual bluegrass. Each of these were grown in both NS and CW. The stem lengths outdoors were shorter than those indoors. The reason for this is that the indoor temperature was higher than the outdoor temperature [31]. The ryegrass, lyme grass, and tall fescue presented good germination rates and stem length, but the annual bluegrass showed poor plant growth properties no matter whether it was grown indoors or outdoors.
Compared with the annual bluegrass covered with NS, the stem length of the annual bluegrass covered with CW decreased by 13% (indoors) and 20% (outdoors). Both the ryegrass covered with NS and that covered with CW grew in a healthy state in the early stage. However, the leaning phenomenon occurred in the outdoor specimens covered with CW in the late stage. The reason for this is that the essential nutrients of the CW are lower than those of the NS. Compared with the ryegrass covered with NS, the stem length of the ryegrass covered with CW decreased by 9% (indoors) and 23% (outdoors). The leaves of the tall fescue were shiny, upright, and vigorous, providing excellent attractiveness. Compared with the tall fescue covered with NS, the stem length of the tall fescue covered with CW decreased by 9% (indoors) and 4% (outdoors). It is worth noting that the stem length of the tall fescue covered with CW grows close to that of the tall fescue covered with NS. Therefore, tall fescue may have potential applications in combination with CW. Compared with the lyme grass covered with NS, the stem length of the lyme grass covered with CW decreased by 13% (indoors) and 10% (outdoors). The low temperature resistance of lyme grass is poor, and its leaves are soft and weak, resulting in less attractiveness than ryegrass and tall fescue.

4. Conclusions

In this study, an orthogonal experimental design was used to optimize the mix design, aiming to reduce alkalinity and improve plant growth properties. In conclusion, the PC treated using three alkali reduction treatments showed potential for application in slope protection with improved ecological performance. The main conclusions are outlined below:
(1)
PR has the greatest impact on the above properties, and the optimal levels of PR, W/B, and FA addition level are 1/5, 0.29, and 10%, respectively.
(2)
The compound alkali reduction treatments, including the use of 0.4% ferrous sulfate in the planting substance and 3% potassium dihydrogen phosphate in the soaking solution, are effective in reducing alkalinity.
(3)
Tall fescue may have potential applications in combination with CW due to its stem length, which grows to a similar length in NS.

Author Contributions

Conceptualization, J.K. and M.C.; methodology, X.M. and Y.Z.; software, Z.W.; validation, X.M. and Y.Z.; formal analysis, Z.W.; investigation, J.K.; resources, H.Q.; data curation, H.Q.; writing—original draft preparation, J.K.; writing—review and editing, M.C.; funding acquisition, H.Q. All authors have read and agreed to the published version of the manuscript.

Funding

This research was funded by the Natural Science Foundation of Shandong Province grant number ZR2021ME110.

Conflicts of Interest

The authors declare no conflict of interest.

References

  1. Wang, X.; Zhao, X.L.; Zhang, Z.X.; Yi, L.; Zuo, L.J.; Wen, Q.K.; Liu, F.; Xu, J.Y.; Hu, S.G.; Liu, B. Assessment of soil erosion change and its relationships with land use/cover change in China from the end of the 1980s to 2010. Catena 2016, 137, 256–268. [Google Scholar] [CrossRef]
  2. Wang, S.A.; Fu, B.J.; Piao, S.L.; Lu, Y.H.; Ciais, P.; Feng, X.M.; Wang, Y.F. Reduced sediment transport in the Yellow River due to anthropogenic changes. Nat. Geosci. 2016, 9, 38–41. [Google Scholar] [CrossRef]
  3. Zhu, C.; He, M.C.; Karakus, M.; Cui, X.B.; Tao, Z.G. Investigating Toppling Failure Mechanism of Anti-dip Layered Slope due to Excavation by Physical Modelling. Rock Mech. Rock Eng. 2020, 53, 5029–5050. [Google Scholar] [CrossRef]
  4. Tu, X.B.; Kwong, A.K.L.; Dai, F.C.; Tham, L.G.; Min, H. Field monitoring of rainfall infiltration in a loess slope and analysis of failure mechanism of rainfall-induced landslides. Eng. Geol. 2009, 105, 134–150. [Google Scholar] [CrossRef]
  5. Cao, W.; Omran, B.A.; Lei, Y.K.; Zhao, X.; Yang, X.M.; Chen, Q.; Tian, G.H. Studying early stage slope protection effects of vegetation communities for Xinnan Highway in China. Ecol. Eng. 2018, 110, 87–98. [Google Scholar] [CrossRef]
  6. Liu, S.L.; Dong, Y.H.; Li, D.; Liu, Q.; Wang, J.; Zhang, X.L. Effects of different terrace protection measures in a sloping land consolidation project targeting soil erosion at the slope scale. Ecol. Eng. 2013, 53, 46–53. [Google Scholar] [CrossRef]
  7. Xiao, H.; Huang, J.; Ma, Q.; Wan, J.; Li, L.; Peng, Q.; Rezaeimalek, S. Experimental study on the soil mixture to promote vegetation for slope protection and landslide prevention. Landslides 2017, 14, 287–297. [Google Scholar] [CrossRef]
  8. Tang, W.C.; Mohseni, E.; Wang, Z.Y. Development of vegetation concrete technology for slope protection and greening. Constr. Build. Mater. 2018, 179, 605–613. [Google Scholar] [CrossRef]
  9. Duan, L.; Huang, M.; Zhang, L. Differences in hydrological responses for different vegetation types on a steep slope on the Loess Plateau, China. J. Hydrol. 2016, 537, 356–366. [Google Scholar] [CrossRef]
  10. Tamai, M.; Matsukawa, T. Properties and application of environmentally friendly porous concrete. Spec. Publ. 1998, 179, 123–140. [Google Scholar]
  11. Tamai, M.; Mizuguchi, H.; Hatanaka, S.; Katahira, H.; Nakazawa, T.; Yanagibashi, K.; Kunieda, M. Design, construction and recent applications of porous concrete in Japan. In Proceedings of the JCI Symposium on Design, Construction, and Recent Applications of Porous Concrete, Tokyo, Japan, 28–29 August 2004. [Google Scholar]
  12. Zheng, K.; Zhou, J.; Gbozee, M. Influences of phosphate tailings on hydration and properties of Portland cement. Constr. Build. Mater. 2015, 98, 593–601. [Google Scholar] [CrossRef]
  13. Meier, M.R.; Sarigaphuti, M.; Sainamthip, P.; Plank, J. Early hydration of Portland cement studied under microgravity conditions. Constr. Build. Mater. 2015, 93, 877–883. [Google Scholar] [CrossRef]
  14. Kaminskas, R.; Cesnauskas, V.; Kubiliute, R. Influence of different artificial additives on Portland cement hydration and hardening. Constr. Build. Mater. 2015, 95, 537–544. [Google Scholar] [CrossRef]
  15. García Calvo, J.L.; Hidalgo, A.; Alonso, C.; Fernández Luco, L. Development of low-pH cementitious materials for HLRW repositories: Resistance against ground waters aggression. Cem. Concr. Res. 2010, 40, 1290–1297. [Google Scholar] [CrossRef]
  16. Kong, J.; Cong, G.; Ni, S.; Sun, J.; Guo, C.; Chen, M.; Quan, H. Recycling of waste oyster shell and recycled aggregate in the porous ecological concrete used for artificial reefs. Constr. Build. Mater. 2022, 323, 126447. [Google Scholar] [CrossRef]
  17. Liu, Q.; Su, L.J.; Xiao, H.; Xu, W.N.; Yan, W.M.; Xia, Z.Y. Preparation of shale ceramsite vegetative porous concrete and its performance as a planting medium. Eur. J. Environ. Civ. Eng. 2021, 25, 2111–2126. [Google Scholar] [CrossRef]
  18. Branch, J.L.; Kosson, D.S.; Garrabrants, A.C.; He, P.J. The impact of carbonation on the microstructure and solubility of major constituents in microconcrete materials with varying alkalinities due to fly ash replacement of ordinary Portland cement. Cem. Concr. Res. 2016, 89, 297–309. [Google Scholar] [CrossRef]
  19. Yang, J.; Gao, T.; Yin, J.; Wu, S.; Liang, Q. Investigation on alkalinity reduction methods of eco-porous concrete. Mater. Und Werkst. 2018, 49, 1108–1116. [Google Scholar] [CrossRef]
  20. Li, L.; Chen, M.; Zhou, X.; Lu, L.; Wang, Y.; Cheng, X. Evaluation of the preparation and fertilizer release performance of planting concrete made with recycled-concrete aggregates from demolition. J. Clean. Prod. 2018, 200, 54–64. [Google Scholar] [CrossRef]
  21. Li, S.; Yin, J.; Zhang, G.; Gao, T. Research on reducing alkalinity of an ecological porous concrete mixure with carbonization. Mater. Tehnol. 2019, 53, 575–581. [Google Scholar] [CrossRef]
  22. Wang, F.C.; Sun, C.; Ding, X.Q.; Kang, T.B.; Nie, X.M. Experimental Study on the Vegetation Growing Recycled Concrete and Synergistic Effect with Plant Roots. Materials 2019, 12, 28. [Google Scholar] [CrossRef] [PubMed] [Green Version]
  23. Reddy, M.S.; Dinakar, P.; Rao, B.H. Mix design development of fly ash and ground granulated blast furnace slag based geopolymer concrete. J. Build. Eng. 2018, 20, 712–722. [Google Scholar] [CrossRef]
  24. GB/T 50081–2002; Standard for Test Method of Mechanical Properties on Ordinary Concrete. China Standards Press: Beijing, China, 2002.
  25. JC/T 2557–2020; Green-Growing Concrete. China Standards Press: Beijing, China, 2020.
  26. Chen, F.; Xu, Y.; Wang, C.; Mao, J. Effects of concrete content on seed germination and seedling establishment in vegetation concrete matrix in slope restoration. Ecol. Eng. 2013, 58, 99–104. [Google Scholar] [CrossRef]
  27. Chen, X.D.; Wu, S.X.; Zhou, J.K. Influence of porosity on compressive and tensile strength of cement mortar. Constr. Build. Mater. 2013, 40, 869–874. [Google Scholar] [CrossRef]
  28. Hardjito, D.; Wallah, S.E.; Sumajouw, D.M.J.; Rangan, B.V. On the development of fly ash-based geopolymer concrete. ACI Mater. J. 2004, 101, 467–472. [Google Scholar]
  29. Lian, C.; Zhuge, Y.; Beecham, S. The relationship between porosity and strength for porous concrete. Constr. Build. Mater. 2011, 25, 4294–4298. [Google Scholar] [CrossRef]
  30. Ismail, I.; Bernal, S.A.; Provis, J.L.; Nicolas, R.S.; Brice, D.G.; Kilcullen, A.R.; Hamdan, S.; van Deventer, J.S.J. Influence of fly ash on the water and chloride permeability of alkali-activated slag mortars and concretes. Constr. Build. Mater. 2013, 48, 1187–1201. [Google Scholar] [CrossRef]
  31. Lal, R. Soil carbon sequestration impacts on global climate change and food security. Science 2004, 304, 1623–1627. [Google Scholar] [CrossRef] [Green Version]
Figure 1. (a) The schematic of PC. (b) The realistic effect of plant roots.
Sustainability 14 12228 g001
Figure 2. Flow chart of procedure for testing the interconnected porosity of the PC.
Sustainability 14 12228 g002
Figure 4. The change of temperature and sunlight time during the planting test: (a) Temperature. (b) Sunlight time.
Sustainability 14 12228 g004
Figure 5. Flow chart of plant growth property test. (a) Outdoor test. (b) Indoor test.
Sustainability 14 12228 g005
Figure 6. The results of single factor analysis: (a) 7 d compressive strength. (b) 28 d compressive strength. (c) Interconnected porosity. (d) 28 d pH value.
Sustainability 14 12228 g006
Figure 7. Alkali reduction using the planting substrate method: (a) The changed pH values with different levels. (b) The compressive strength after the alkali reduction treatment.
Sustainability 14 12228 g007
Figure 8. Alkali reduction using the solution-soaking method: (a) The changed pH values with different levels. (b) The compressive strength after the alkali reduction treatment.
Sustainability 14 12228 g008
Figure 9. SEM analysis of concrete treated by solution soaking.
Sustainability 14 12228 g009
Figure 10. Alkali reduction using the spraying method: (a) The changed pH values with different levels. (b) The compressive strength after the alkali reduction treatment.
Sustainability 14 12228 g010
Figure 11. Macrographs of planting indoors at different times: (a) 14 d. (b) 28 d.
Sustainability 14 12228 g011
Figure 12. Macrographs of planting outdoors at different times: (a) NA. (b) CW.
Sustainability 14 12228 g012
Figure 13. The changed stem length with age: (a) The use of NS indoors. (b) The use of CW indoors. (c) The use of NS outdoors. (d) The use of CW outdoors.
Sustainability 14 12228 g013
Table 1. Chemical compositions of OPC and FA.
MaterialSiO2AI2O3Fe2O3CaOMgOSO3TiO2LOI
OPC21.45.783.3462.011.22.482.791
FA36.8512.666.4732.643.674.130.932.42
Table 2. Physical properties of NA.
TypeAggregate Size (mm)Apparent Density (kg/m3)Loose Bulk Density (kg/m3)Compacted Bulk Density (kg/m3)Water Absorption (%)
NA10~202703139015512.1
Table 3. Chemical composition of CW.
MaterialSiO2Al2O3CaOFe2O3SO3MgONa2OK2OTiO2LOI
CW57.417.36.14.00.21.82.53.60.66.5
Table 4. Orthogonal experiment design and mix design.
GroupFactorsMix Design of PC
A: PRB: W/BC: FA/%Cement (kg/m3)FA (kg/m3)Water (kg/m3)Water Reducer (%)NA (kg/m3)
ZJ-11/40.26045501160.21520
ZJ-21/40.2910387431250.31520
ZJ-31/40.3220340851360.11520
ZJ-41/40.35302911251460.31520
ZJ-51/50.261031535910.21520
ZJ-61/50.29035601030.41520
ZJ-71/50.32302331001070.51520
ZJ-81/50.3520272681190.31520
ZJ-91/60.262022857740.41520
ZJ-101/60.293019483800.31520
ZJ-111/60.3202970950.61520
ZJ-121/60.3510261291020.61520
ZJ-131/70.263016671620.41520
ZJ-141/70.292019649710.31520
ZJ-151/70.321022525800.51520
ZJ-161/70.3502540890.41520
Table 6. The Orthogonal Test Results for the PC.
Group7 d Compressive Strength (MPa)28 d Compressive Strength (MPa)Interconnected Porosity (%)28 d pH Value
ZJ-116.817.116.212.21
ZJ-215.916.515.811.89
ZJ-313.214.314.711.7
ZJ-411.712.613.511.45
ZJ-512.213.121.411.56
ZJ-611.213.620.111.87
ZJ-79.510.719.610.57
ZJ-89.410.918.711.32
ZJ-95.56.725.210.82
ZJ-105.26.124.910.37
ZJ-116.97.923.111.58
ZJ-126.17.122.511.29
ZJ-133.54.128.310.23
ZJ-143.74.327.110.45
ZJ-154.14.826.110.65
ZJ-164.55.125.211.28
Table 7. Range analysis of compressive strength.
TypeResultPRW/BFABlank Column
7 d compressive strengthK157.638.039.436.1
K242.336.038.335.7
K323.733.731.835.1
K415.831.729.932.5
k119.212.713.112.0
k214.112.012.811.9
k37.911.210.611.7
k45.310.610.010.8
R13.92.13.21.2
28 d compressive strengthK160.541.043.739.2
K248.340.541.539.4
K327.837.736.238.6
K418.335.733.537.7
k120.213.714.613.1
k216.113.513.813.1
k39.312.612.112.9
k46.111.911.212.6
R14.11.83.40.6
Table 8. Range analysis of interconnected porosity.
TypeResultPRW/BFABlank Column
Interconnected porosityK160.291.184.685.4
K279.887.985.885.9
K395.783.585.786.2
K4106.779.986.384.9
k120.130.428.228.5
k226.629.328.628.6
k331.927.828.628.7
k435.626.628.828.3
R15.53.70.60.4
Table 9. Range analysis of 28 d pH values.
TypeResultPRW/BFABlank Column
28 d pH valuesK147.344.846.944.5
K245.344.645.445.0
K344.144.544.344.9
K442.645.342.644.8
k115.814.915.614.8
k215.114.915.115.0
k314.714.814.815.0
k414.215.114.214.9
R1.50.31.40.2
Publisher’s Note: MDPI stays neutral with regard to jurisdictional claims in published maps and institutional affiliations.

