


Spatiotemporal Surveillance of COVID-19 Based on Epidemiological Features: Evidence from Northeast Iran


Abstract
:1. Introduction
2. Materials and Methods
2.1. Study Area
2.2. Data Acquisition
2.3. Methodology
2.3.1. Hot Spot Analysis
2.3.2. Directional Distribution Analysis
2.3.3. Space-Time Analysis
3. Results
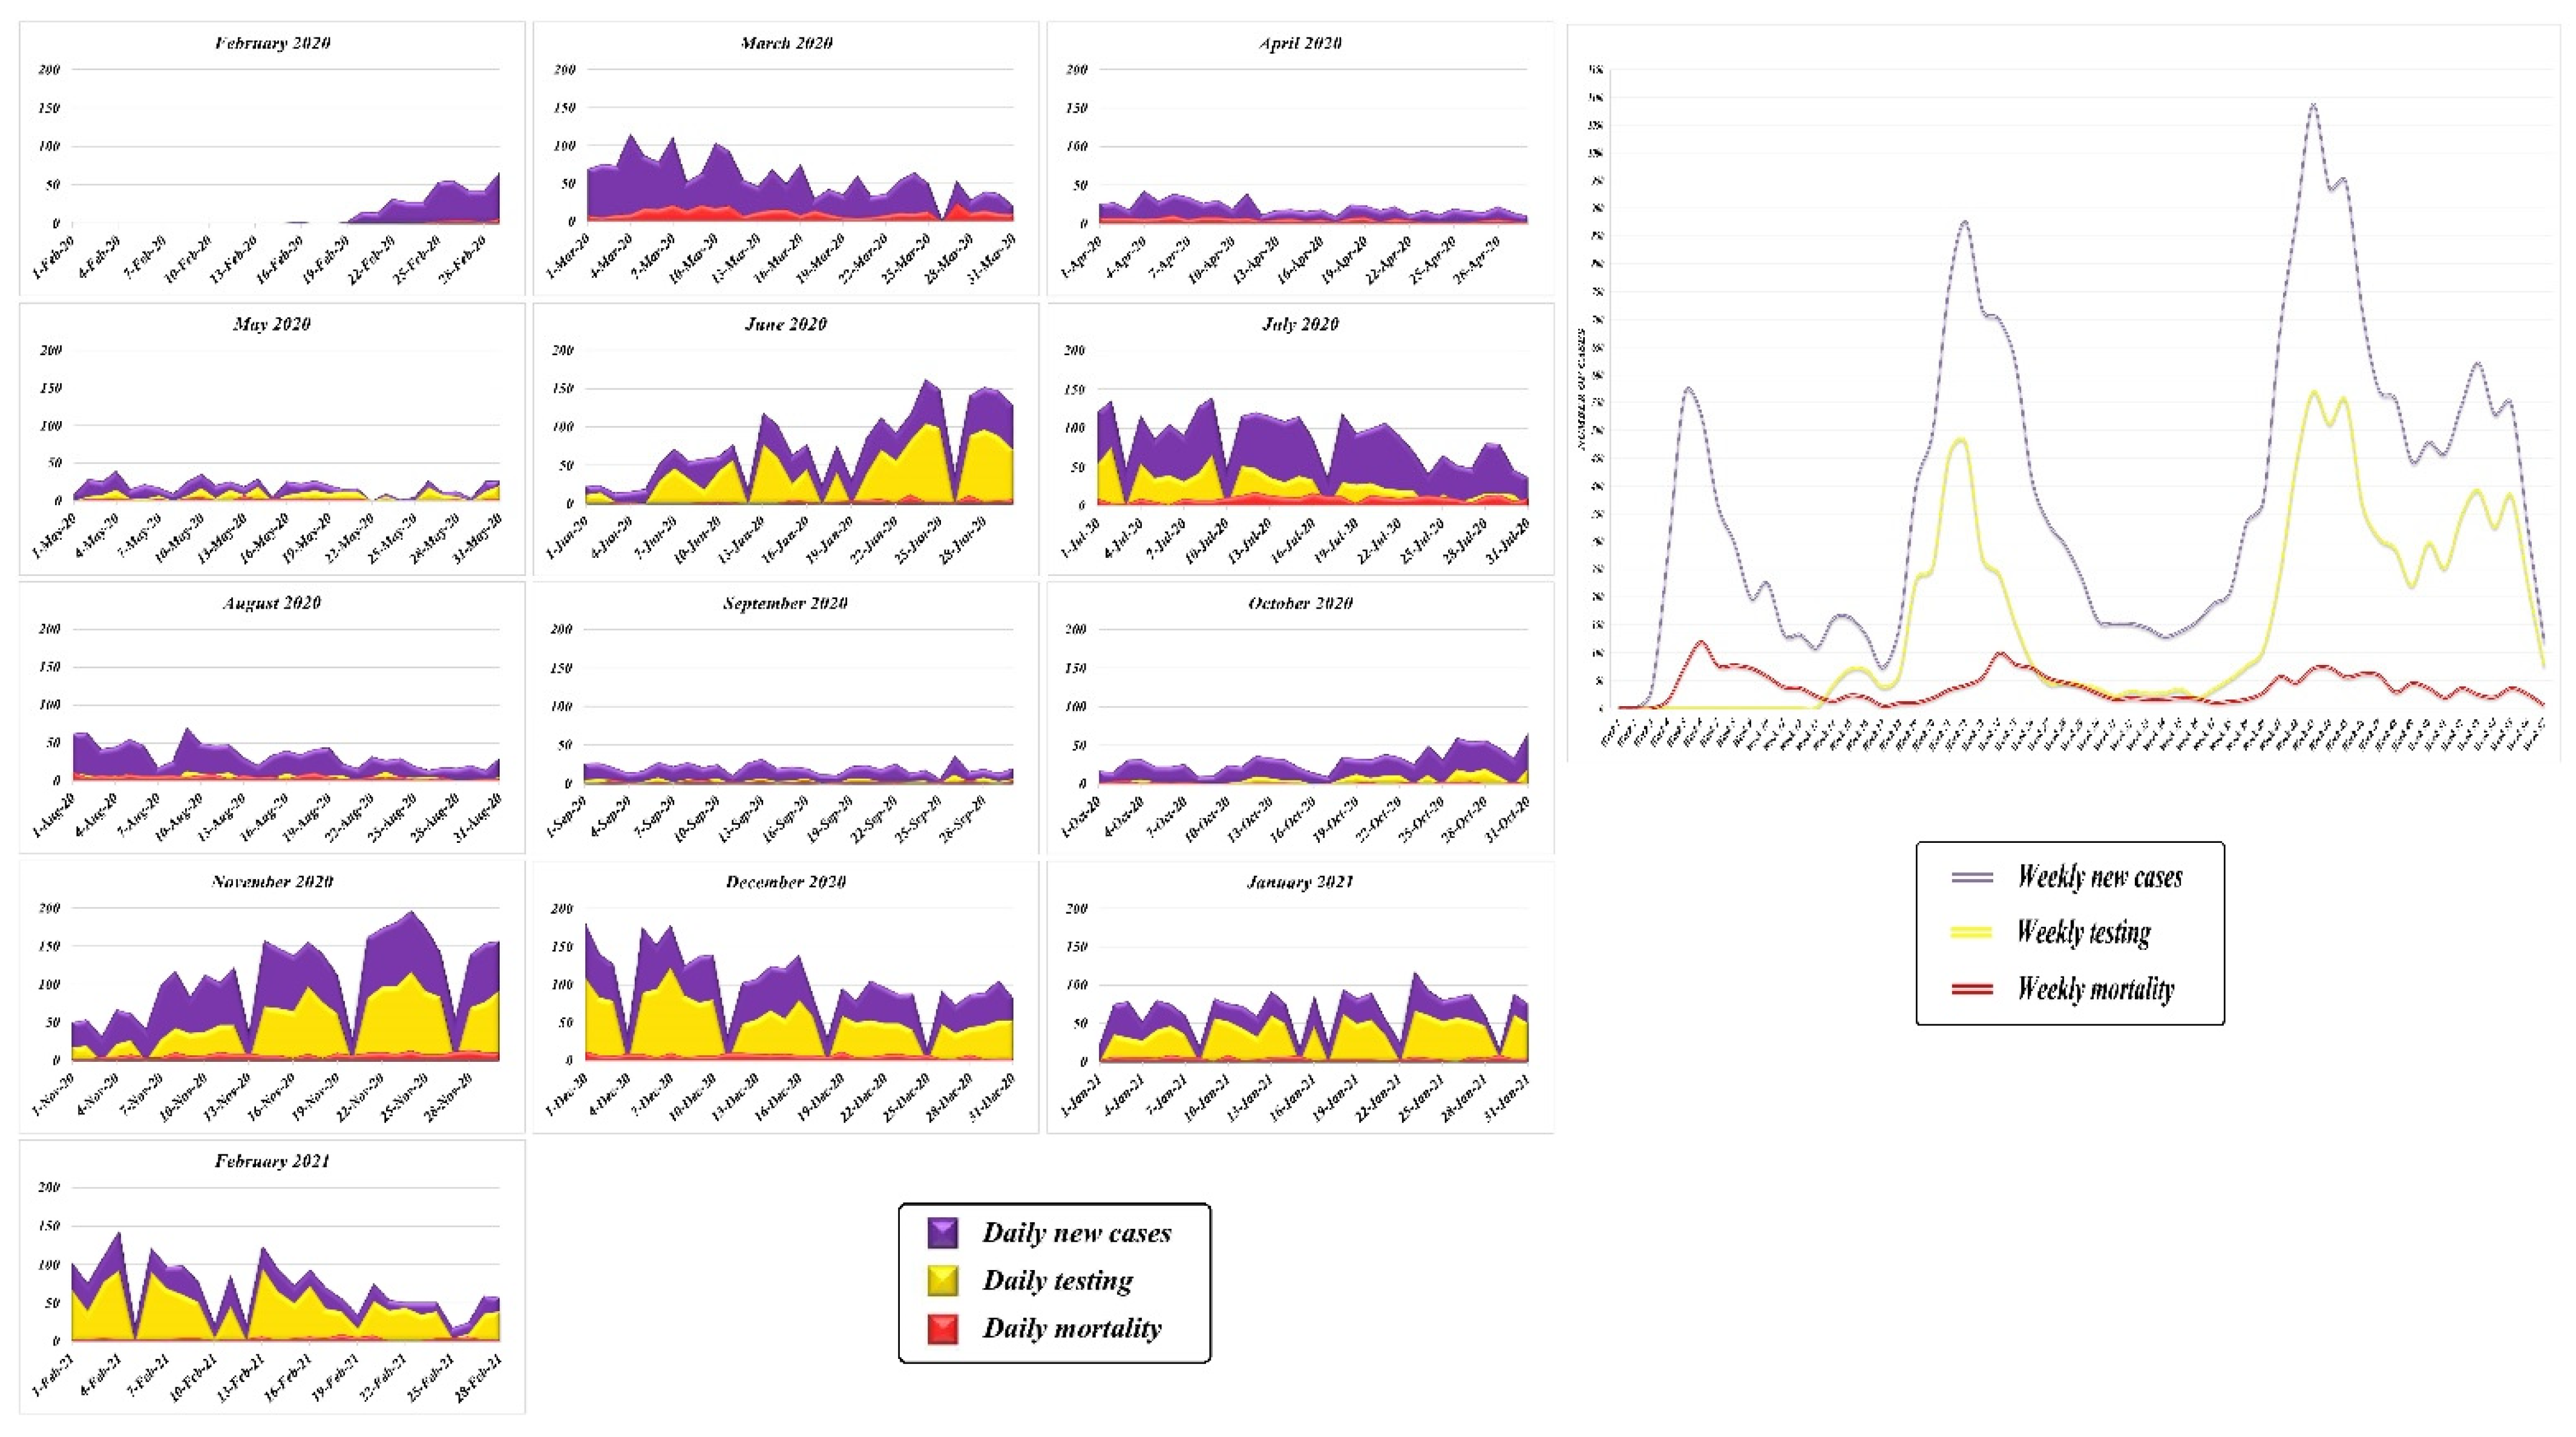
3.1. Temporal Trend
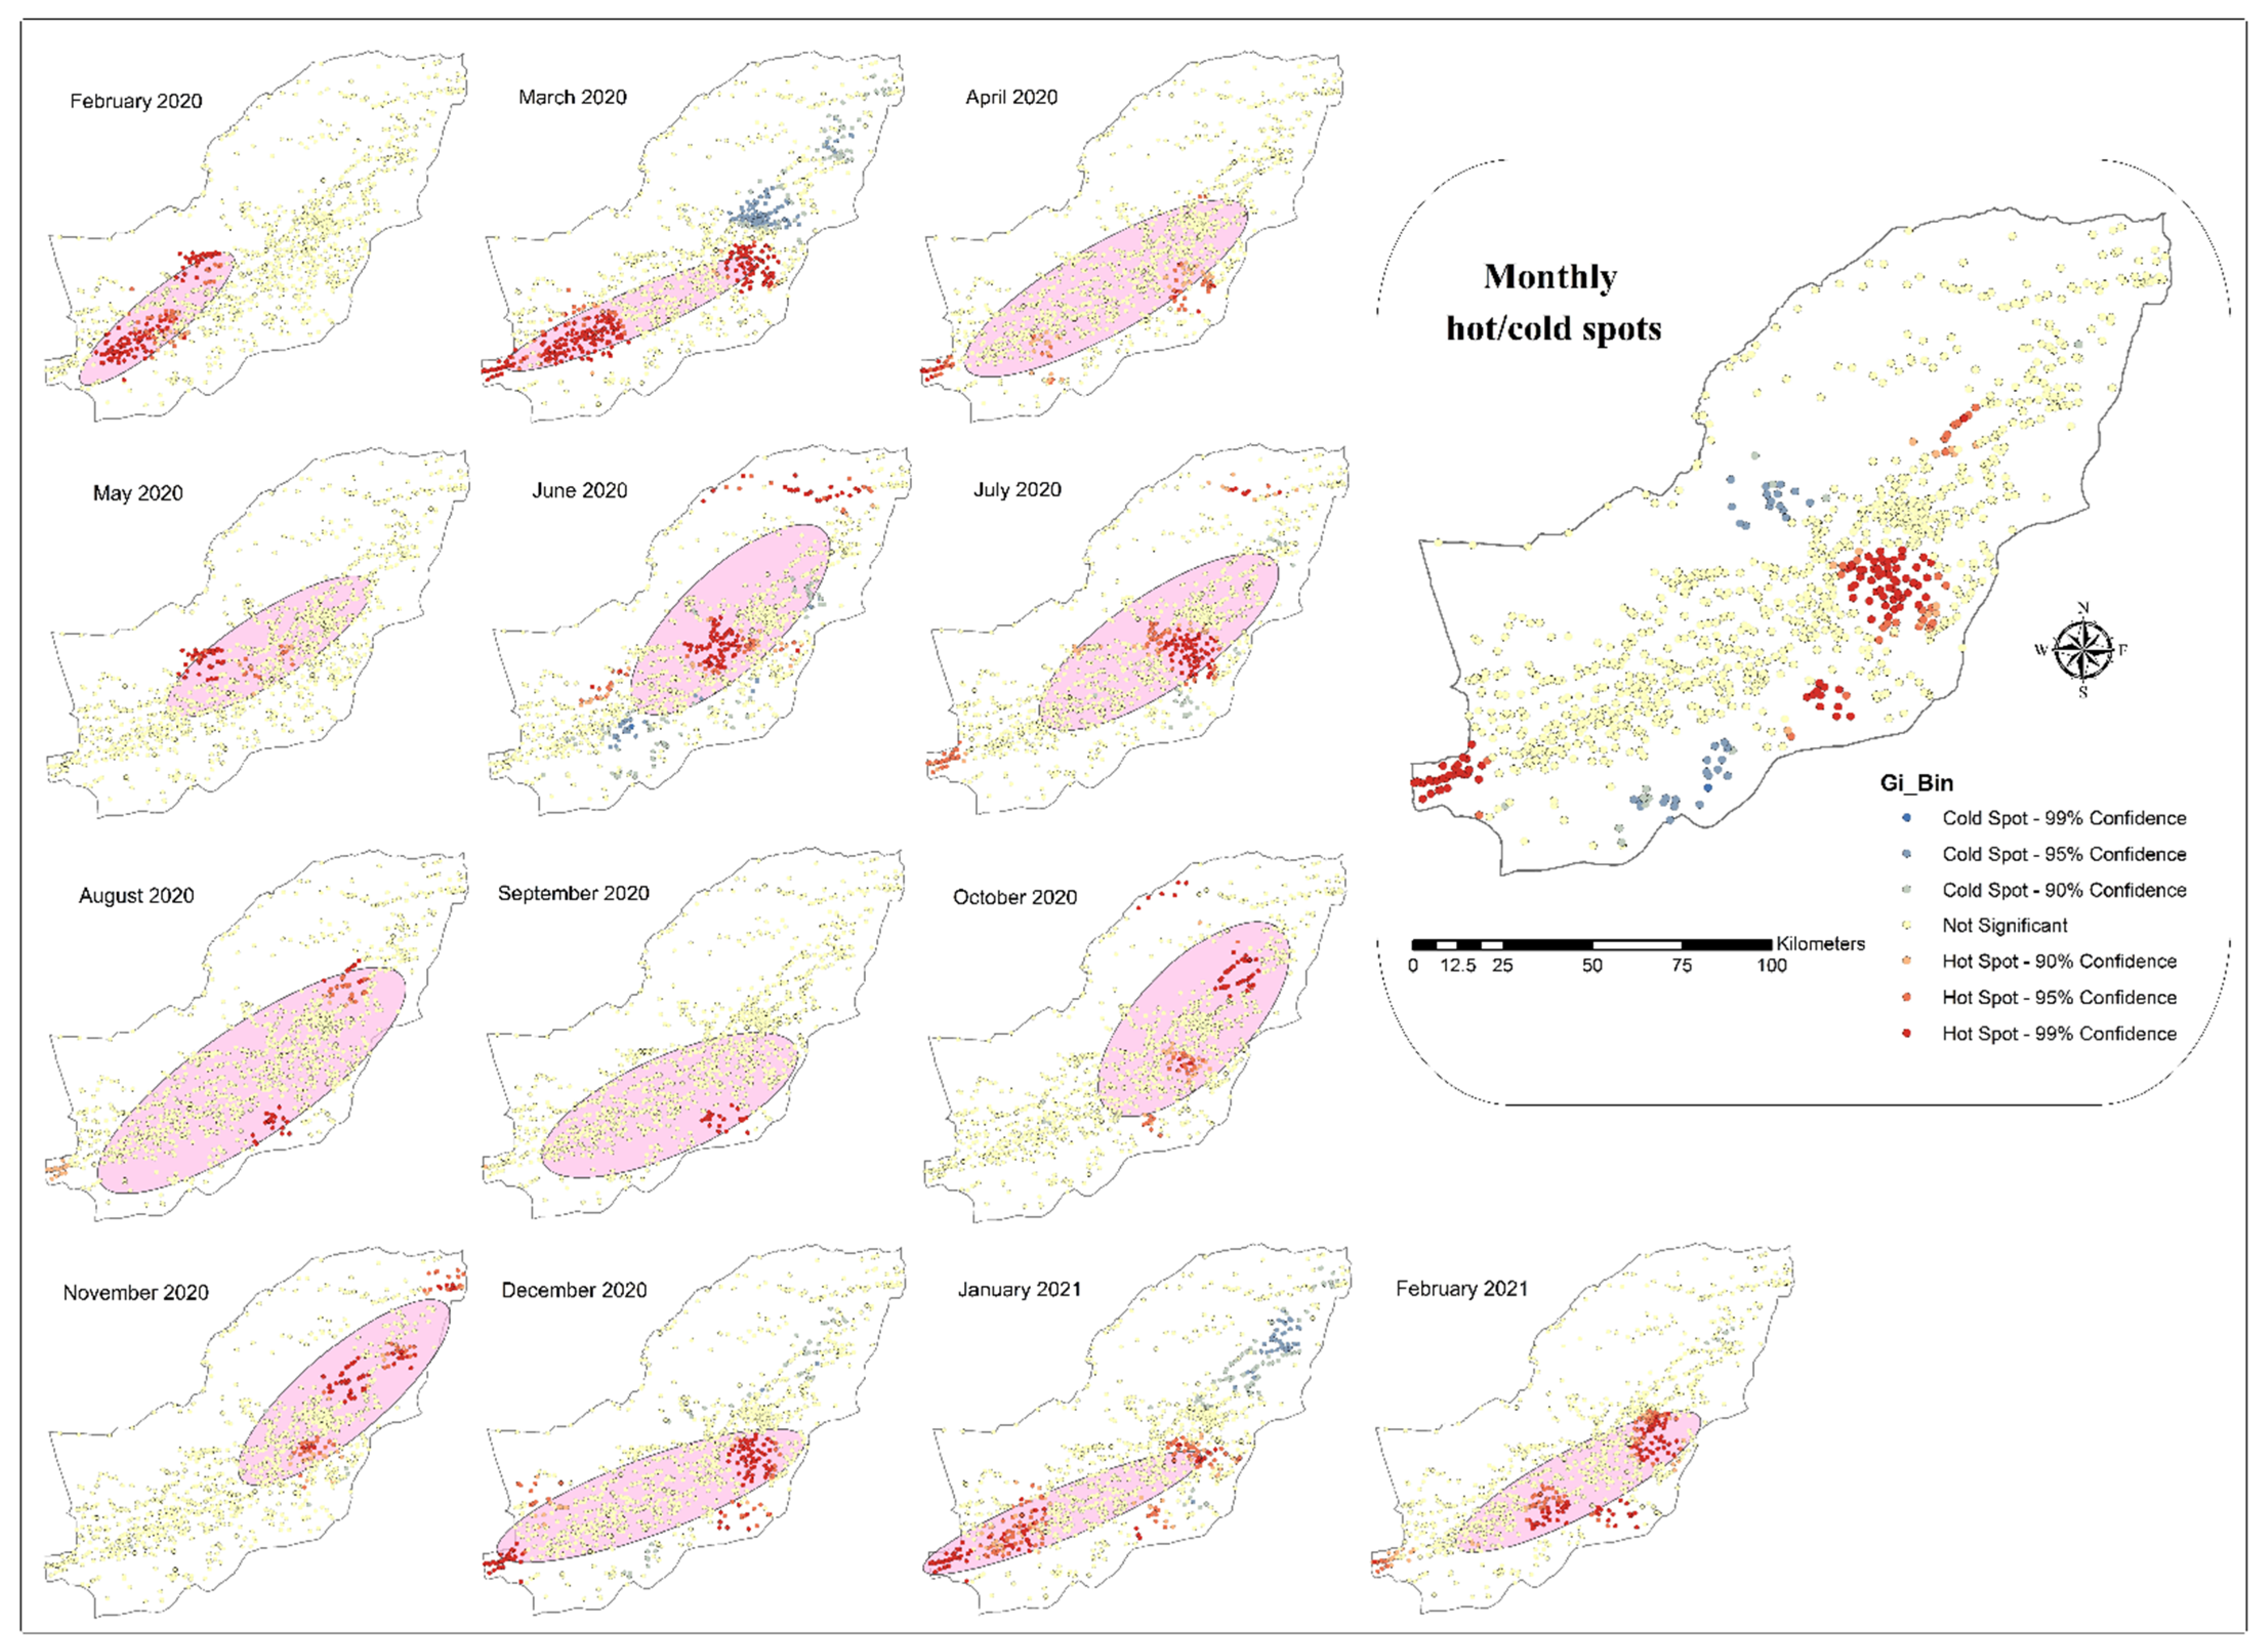
3.2. Spatial Analysis
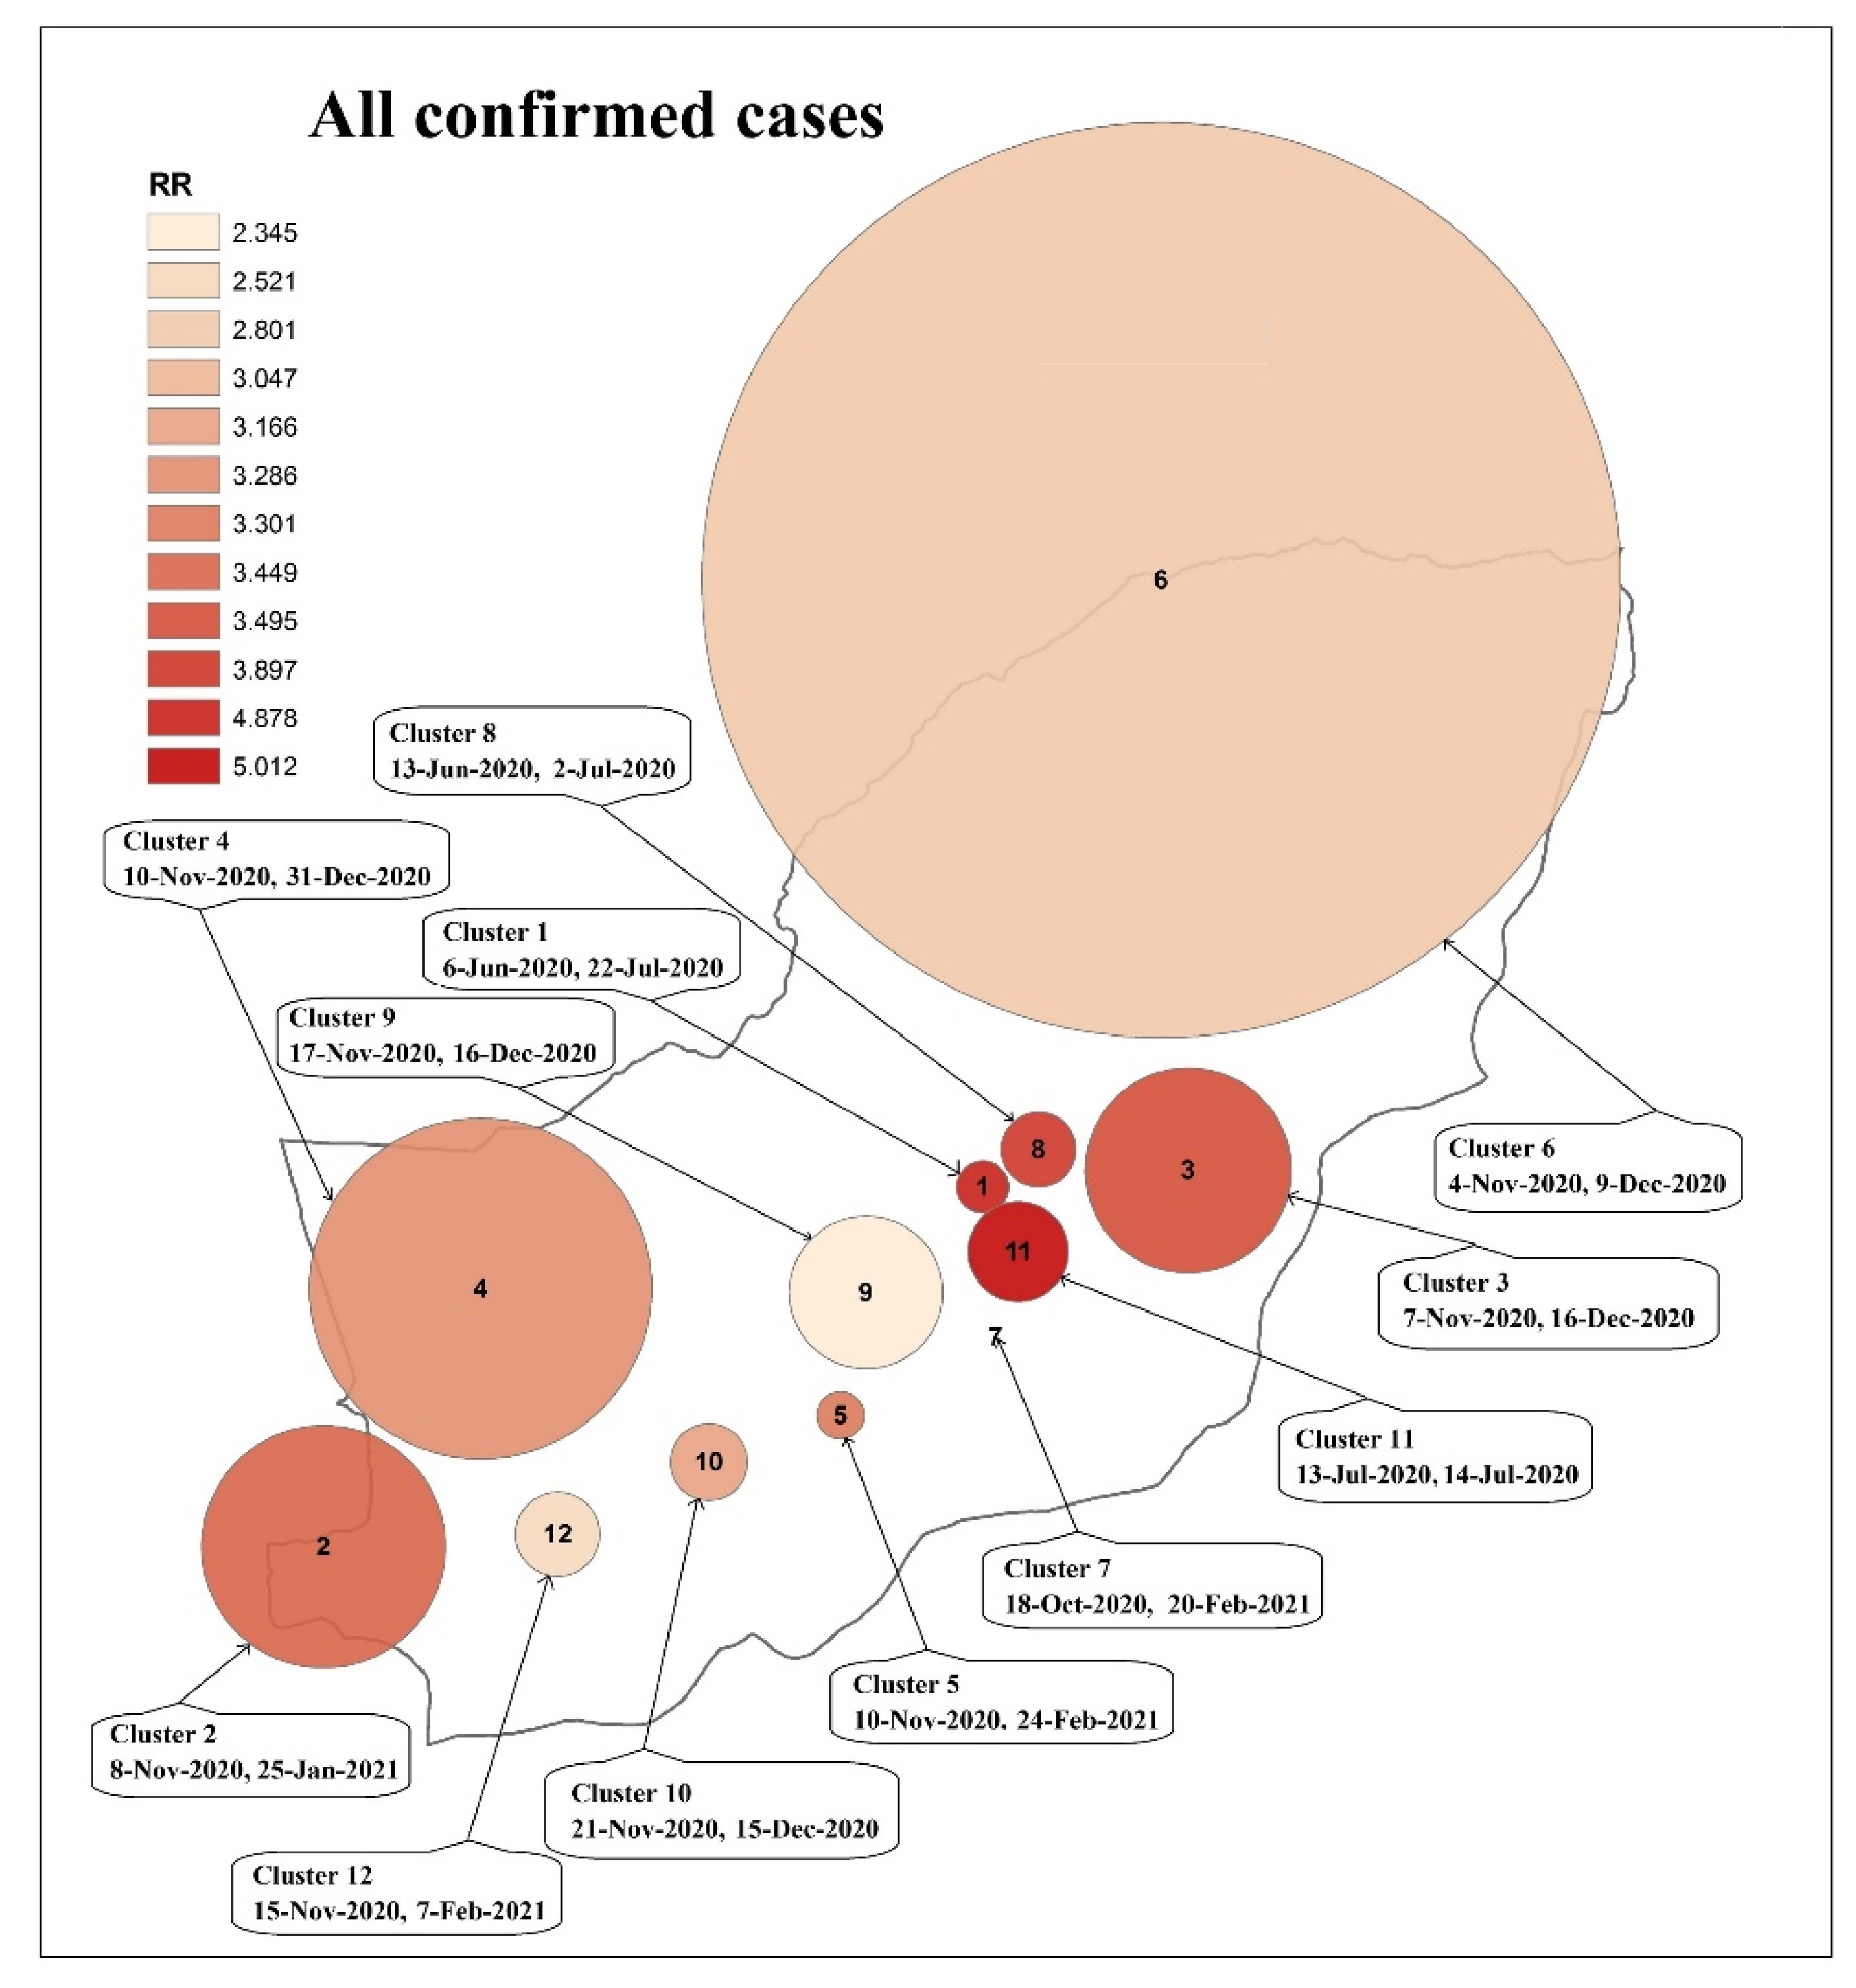
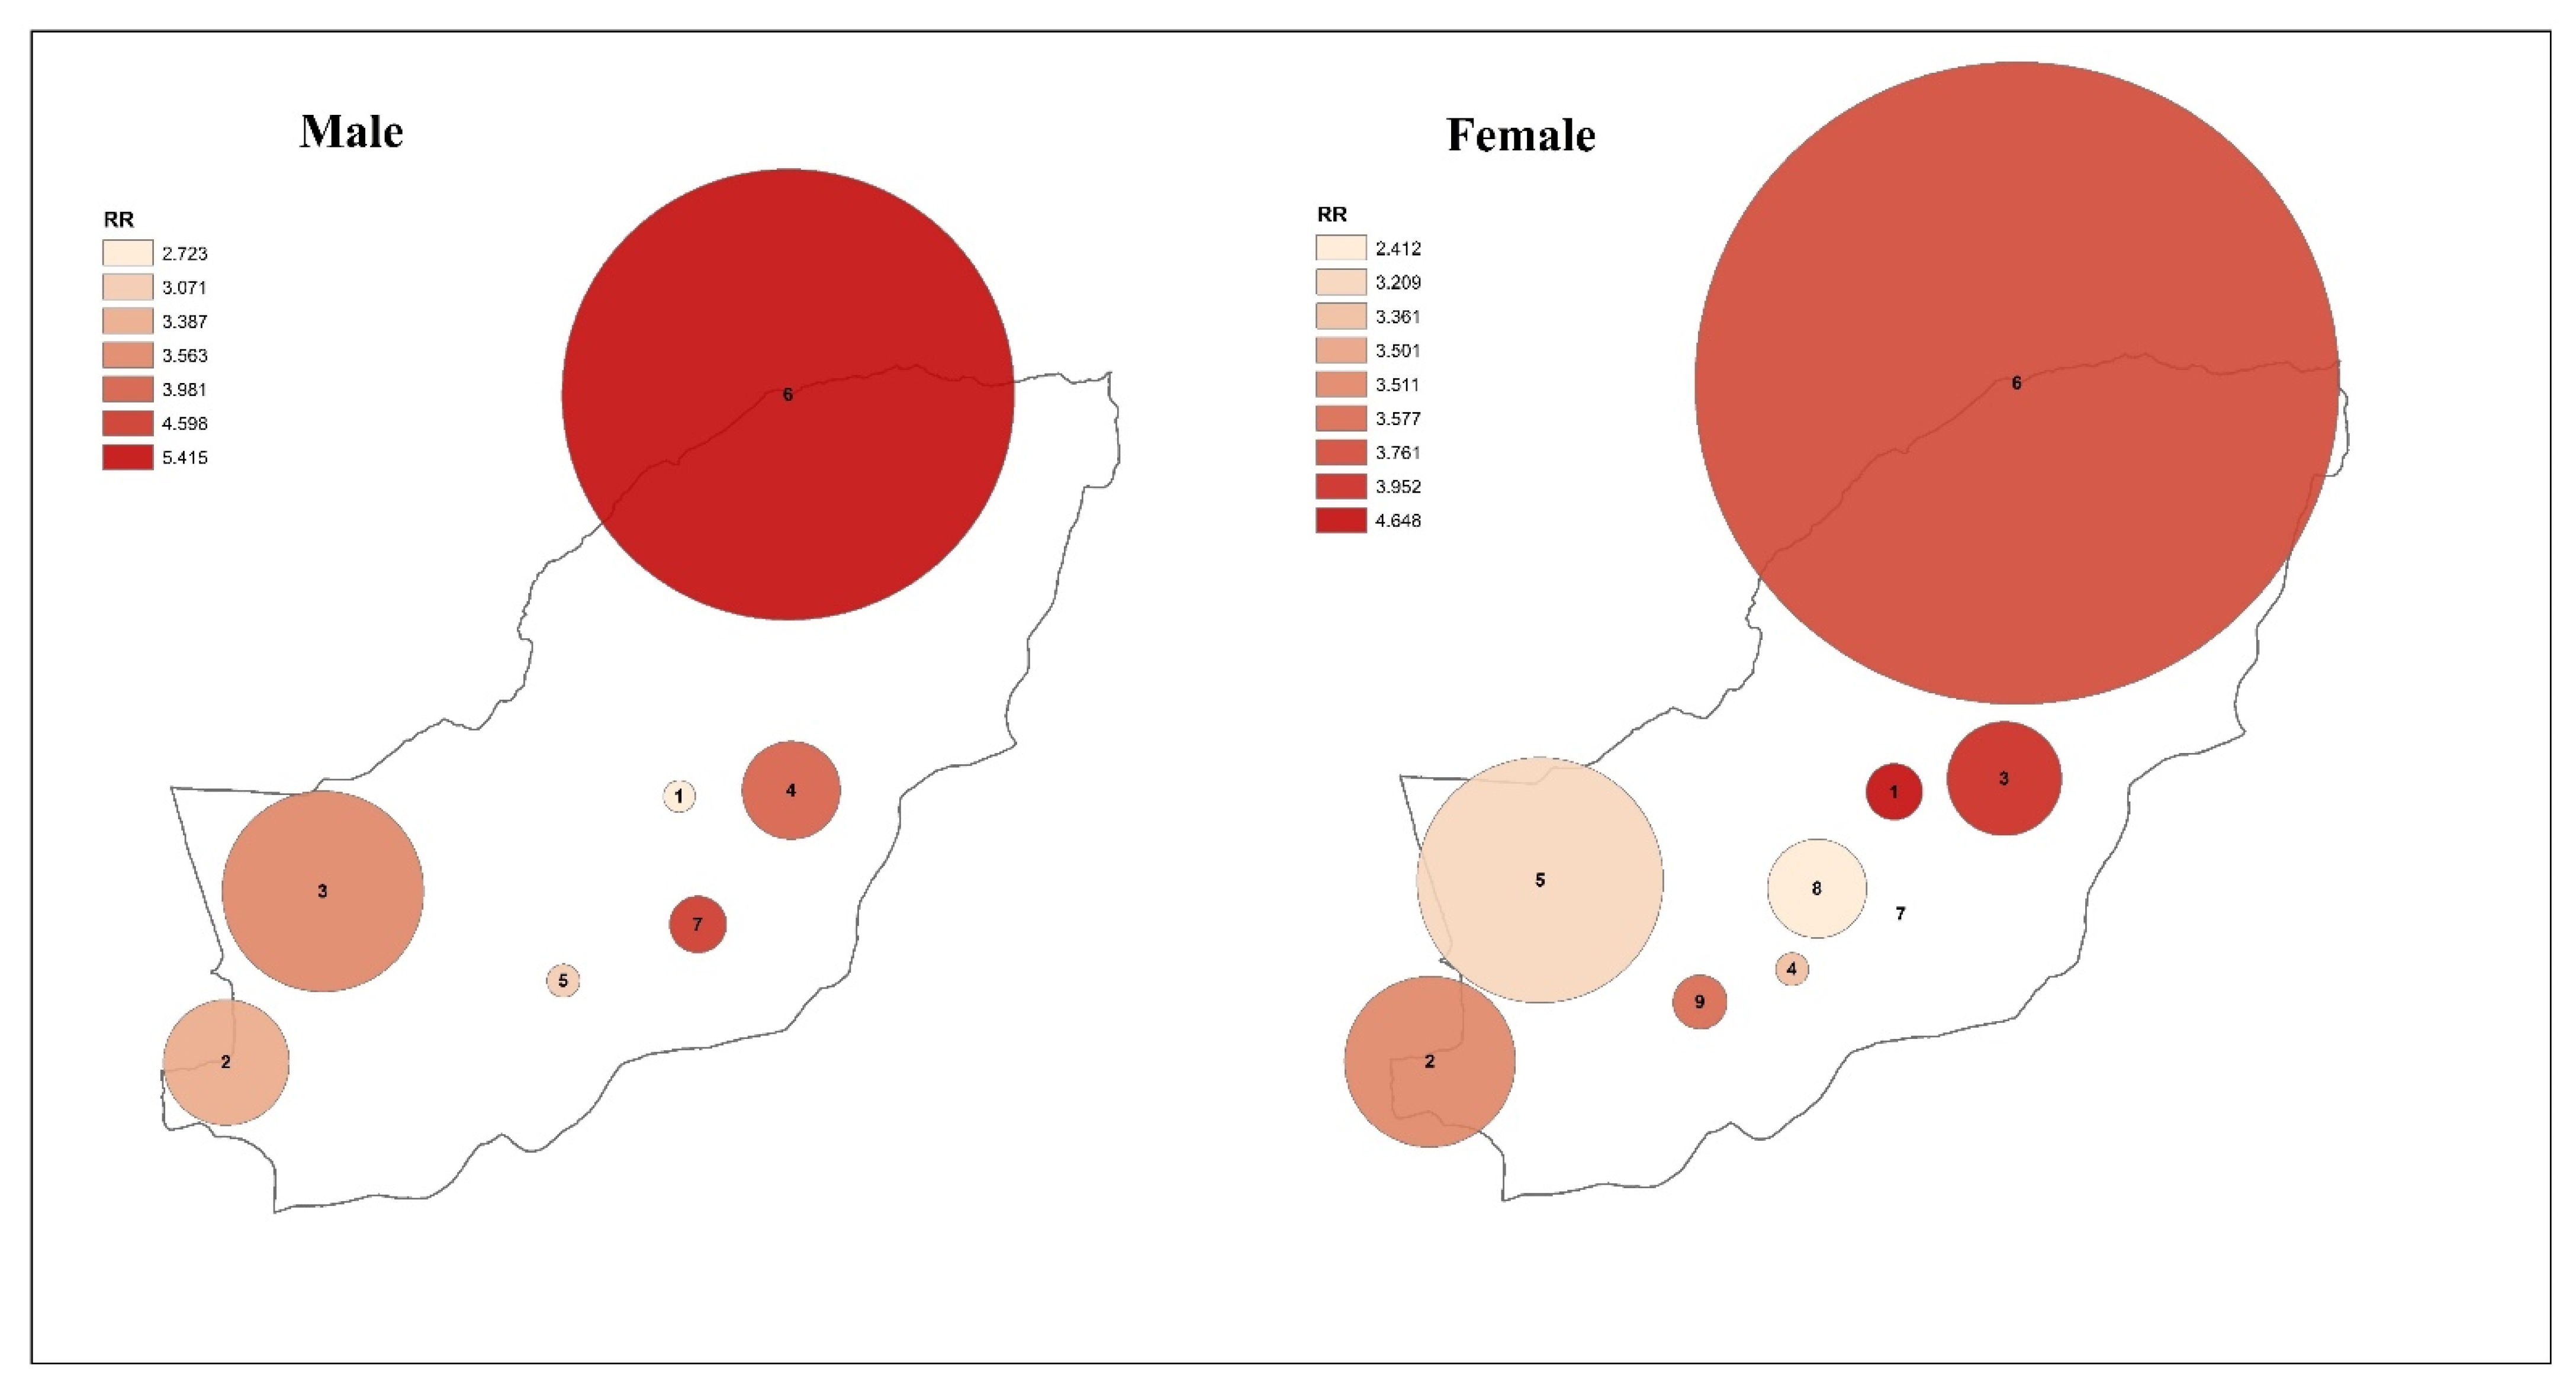
3.3. Spatiotemporal Analysis
4. Discussion
4.1. Main Findings
4.2. Strengths
4.3. Limitations
5. Conclusions
Supplementary Materials
Author Contributions
Funding
Institutional Review Board Statement
Informed Consent Statement
Data Availability Statement
Acknowledgments
Conflicts of Interest
References
- World Health Organization. Novel Coronavirus (2019-nCoV) Situation Reports. 2020. Available online: https://www.who.int/emergencies/diseases/novel-coronavirus-2019/situation-reports (accessed on 4 April 2020).
- World Health Organization. Laboratory Testing Strategy Recommendations for COVID-19, 2020. 2020. Available online: https://apps.who.int/iris/bitstream/handle/10665/331509/WHO-COVID-19-lab_testing-2020.1-eng.pdf (accessed on 13 April 2020).
- Tabasi, M.; Alesheikh, A.A. Spatiotemporal variability of Zoonotic Cutaneous Leishmaniasis based on sociodemographic heterogeneity. The case of Northeastern Iran, 2011–2016. Jpn. J. Infect. Dis. 2021, 74, 7–16. [Google Scholar] [CrossRef] [PubMed]
- Babaie, E.; Alesheikh, A.A.; Tabasi, M. Spatial prediction of human brucellosis (HB) using a GIS-based adaptive neuro-fuzzy inference system (ANFIS). Acta Trop. 2021, 220, 105951. [Google Scholar] [CrossRef] [PubMed]
- Mollalo, A.; Vahedi, B.; Rivera, K.M. GIS-based spatial modeling of COVID-19 incidence rate in the continental United States. Sci. Total Environ. 2020, 728, 138884. [Google Scholar] [CrossRef] [PubMed]
- Babaie, E.; Alesheikh, A.A.; Tabasi, M. Spatial modeling of zoonotic cutaneous leishmaniasis with regard to potential environmental factors using ANFIS and PCA-ANFIS methods. Acta Trop. 2022, 228, 106296. [Google Scholar] [CrossRef] [PubMed]
- Tabasi, M.; Alesheikh, A.A.; Sofizadeh, A.; Saeidian, B.; Pradhan, B.; AlAmri, A. A spatio-temporal agent-based approach for modeling the spread of zoonotic cutaneous leishmaniasis in northeast Iran. Parasites Vectors 2020, 13, 572. [Google Scholar] [CrossRef] [PubMed]
- Adekunle, I.A.; Onanuga, A.T.; Akinola, O.O.; Ogunbanjo, O.W. Modelling spatial variations of coronavirus disease (COVID-19) in Africa. Sci. Total Environ. 2020, 729, 138998. [Google Scholar] [CrossRef] [PubMed]
- Melin, P.; Monica, J.C.; Sanchez, D.; Castillo, O. Analysis of spatial spread relationships of coronavirus (COVID-19) pandemic in the world using self organizing maps. Chaos Solitons Fractals 2020, 138, 109917. [Google Scholar] [CrossRef]
- Ceylan, Z. Estimation of COVID-19 prevalence in Italy, Spain, and France. Sci. Total. Environ. 2020, 729, 138817. [Google Scholar] [CrossRef]
- Hernandez-Matamoros, A.; Fujita, H.; Hayashi, T.; Perez-Meana, H. Forecasting of COVID19 per regions using ARIMA models and polynomial functions. Appl. Soft Comput. 2020, 96, 106610. [Google Scholar] [CrossRef] [PubMed]
- Desjardins, M.R.; Hohl, A.; Delmelle, E.M. Rapid surveillance of COVID-19 in the United States using a prospective space-time scan statistic: Detecting and evaluating emerging clusters. Appl. Geogr. 2020, 118, 102202. [Google Scholar] [CrossRef] [PubMed]
- Andersen, L.M.; Harden, S.R.; Sugg, M.M.; Runkle, J.D.; Lundquist, T.E. Analyzing the spatial determinants of local COVID-19 transmission in the United States. Sci. Total Environ. 2021, 754, 142396. [Google Scholar] [CrossRef] [PubMed]
- Xu, M.; Cao, C.; Zhang, X.; Lin, H.; Yao, Z.; Zhong, S.; Huang, Z.; Shea Duerler, R. Fine-scale space-time cluster detection of COVID-19 in Mainland China using retrospective analysis. Int. J. Environ. Res. Public Health 2021, 18, 3583. [Google Scholar] [CrossRef] [PubMed]
- Kan, Z.; Kwan, M.-P.; Wong, M.S.; Huang, J.; Liu, D. Identifying the space-time patterns of COVID-19 risk and their associations with different built environment features in Hong Kong. Sci. Total Environ. 2021, 772, 145379. [Google Scholar] [CrossRef] [PubMed]
- da Silva, W.M.; Brito, P.D.S.; de Sousa, G.G.D.S.; Santos, L.F.S.; da Silva, J.C.; de Jesus Costa, A.C.P.; Pascoal, L.M.; Santos, F.S.; Graepp Fontoura, I.; Lobato, J.S.M.; et al. Deaths due to COVID-19 in a state of northeastern Brazil: Spatiotemporal distribution, sociodemographic and clinical and operational characteristics. Trans. R. Soc. Trop. Med. Hyg. 2022, 116, 163–172. [Google Scholar] [CrossRef]
- Yoneoka, D.; Tanoue, Y.; Kawashima, T.; Nomura, S.; Shi, S.; Eguchi, A.; Ejima, K.; Taniguchi, T.; Sakamoto, H.; Kunishima, H.; et al. Large-scale epidemiological monitoring of the COVID-19 epidemic in Tokyo. Lancet Reg. Health-West. Pac. 2020, 3, 100016. [Google Scholar] [CrossRef] [PubMed]
- Islam, A.; Sayeed, M.A.; Rahman, M.K.; Ferdous, J.; Islam, S.; Hassan, M.M. Geospatial dynamics of COVID-19 clusters and hotspots in Bangladesh. Transbound. Emerg. Dis. 2021, 68, 3643–3657. [Google Scholar] [CrossRef] [PubMed]
- Fonseca-Rodríguez, O.; Gustafsson, P.E.; San Sebastián, M.; Connolly, A.M.F. Spatial clustering and contextual factors associated with hospitalisation and deaths due to COVID-19 in Sweden: A geospatial nationwide ecological study. BMJ Glob. Health 2021, 6, e006247. [Google Scholar] [CrossRef]
- Ritchie, H.; Mathieu, E.; Rodés-Guirao, L.; Appel, C.; Giattino, C.; Ortiz-Ospina, E.; Hasell, J.; Macdonald, B.; Beltekian, D.; Roser, M. Coronavirus pandemic (COVID-19). Our World Data 2020. Available online: https://ourworldindata.org/coronavirus (accessed on 10 February 2022).
- Bergman, J.; Ballin, M.; Nordström, A.; Nordström, P. Risk factors for COVID-19 diagnosis, hospitalization, and subsequent all-cause mortality in Sweden: A nationwide study. Eur. J. Epidemiol. 2021, 36, 287–298. [Google Scholar] [CrossRef] [PubMed]
- Indseth, T.; Grøsland, M.; Arnesen, T.; Skyrud, K.; Kløvstad, H.; Lamprini, V.; Telle, K.; Kjøllesdal, M. COVID-19 among immigrants in Norway, notified infections, related hospitalizations and associated mortality: A register-based study. Scand. J. Public Health 2021, 49, 48–56. [Google Scholar] [CrossRef] [PubMed]
- Andrade, L.A.; Gomes, D.S.; Lima, S.V.M.A.; Duque, A.M.; Melo, M.S.; Góes, M.A.O.; Ribeiro, C.J.N.; Peixoto, M.V.S.; Souza, C.D.F.; Santos, A.D. COVID-19 mortality in an area of northeast Brazil: Epidemiological characteristics and prospective spatiotemporal modelling. Epidemiol. Infect. 2020, 148, E288. [Google Scholar] [CrossRef] [PubMed]
- Masrur, A.; Yu, M.; Luo, W.; Dewan, A. Space-time patterns, change, and propagation of COVID-19 risk relative to the intervention scenarios in Bangladesh. Int. J. Environ. Res. Public Health 2020, 17, 5911. [Google Scholar] [CrossRef]
- Tyrovolas, S.; Giné-Vázquez, I.; Fernández, D.; Morena, M.; Koyanagi, A.; Janko, M.; Haro, J.M.; Lin, Y.; Lee, P.; Pan, W.; et al. Estimating the COVID-19 spread through real-time population mobility patterns: Surveillance in Low-and Middle-income countries. J. Med. Internet Res. 2021, 23, e22999. [Google Scholar] [CrossRef] [PubMed]
- Map Political Divisions in Golestan Province. Statistical Center of Iran, Deputy of Statistics and Information of Golestan Province. Available online: https://amar.golestanmporg.ir/taghsimat-naghshe.html (accessed on 10 February 2022).
- COVID-19 Cases Data in Golestan Province. 2020–2021. Iranian Ministry of Health, Center for Disease Control and Prevention (CDC) of Golestan Province (Unpublished Data). 2021. Available online: https://goums.ac.ir/index.php?slc_lang=en&sid=200 (accessed on 28 February 2021).
- Census Data in Golestan Province. Statistical Center of Iran, Deputy of Statistics and Information of Golestan Province. Available online: https://amar.golestanmporg.ir/ftp/amar/sarshomari/maskan_95/taghsimat-jamiat.xlsx (accessed on 10 February 2022).
- Celentano, D.D.; Mhs, S.; Szklo, M. Gordis. Epidemiología; Elsevier: Amsterdam, The Netherlands, 2019; Available online: https://ak.sbmu.ac.ir/uploads/epidemiology_gordis_5_edi.pdf (accessed on 10 February 2022).
- Getis, A.; Ord, J.K. The analysis of spatial association by use of distance statistics. In Perspectives on Spatial Data Analysis; Springer: Berlin/Heidelberg, Germany, 2010; pp. 127–145. [Google Scholar]
- Mitchell, A. The ESRI Guide to GIS Analysis; Redlands, CA, USA, 2005; Volume 2, Available online: https://www.esri.com/en-us/esri-press/browse/the-esri-guide-to-gis-analysis-volume-2-spatial-measurements-and-statistics-second-edition (accessed on 10 February 2022).
- Kulldorff, M. SaTScanTM v8. 0: Software for the Spatial and Space-Time Scan Statistics; Information Management Services, Inc. 2009. Available online: https://www.satscan.org/ (accessed on 10 February 2022).
- Ahmadkhani, M.; Alesheikh, A.A.; Khakifirouz, S.; Salehi-Vaziri, M. Space-time epidemiology of Crimean-Congo hemorrhagic fever (CCHF) in Iran. Ticks Tick-Borne Dis. 2018, 9, 207–216. [Google Scholar] [CrossRef] [PubMed]
- Kulldorff, M. A spatial scan statistic. Commun. Stat.-Theory Methods 1997, 26, 1481–1496. [Google Scholar] [CrossRef]
- Kulldorff, M. Prospective time periodic geographical disease surveillance using a scan statistic. J. R. Stat. Soc. Ser. A Stat. Soc. 2001, 164, 61–72. [Google Scholar] [CrossRef]
- Gao, P.; Guo, D.; Liao, K.; Webb, J.J.; Cutter, S.L. Early detection of terrorism outbreaks using prospective space–time scan statistics. Prof. Geogr. 2013, 65, 676–691. [Google Scholar] [CrossRef]
- He, J.; Guo, Y.; Mao, R.; Zhang, J. Proportion of asymptomatic coronavirus disease 2019: A systematic review and meta-analysis. J. Med. Virol. 2021, 93, 820–830. [Google Scholar] [CrossRef] [PubMed]
- Paul, R.; Arif, A.A.; Adeyemi, O.; Ghosh, S.; Han, D. Progression of COVID-19 from urban to rural areas in the United States: A spatiotemporal analysis of prevalence rates. J. Rural Health 2020, 36, 591–601. [Google Scholar] [CrossRef] [PubMed]
- Census Data in Golestan Province and Iran. Statistical Center of Iran, Deputy of Statistics and Information of Golestan Province. Available online: https://amar.golestanmporg.ir/ftp/amar/gmoredi/nashriyehtatbighi-1397.pdf (accessed on 10 February 2022).
- Atkins, J.L.; Masoli, J.A.; Delgado, J.; Pilling, L.C.; Kuo, C.L.; Kuchel, G.A.; Melzer, D. Preexisting comorbidities predicting COVID-19 and mortality in the UK biobank community cohort. J. Gerontol. Ser. A 2020, 75, 2224–2230. [Google Scholar] [CrossRef] [PubMed]
- Baradaran, A.; Ebrahimzadeh, M.H.; Baradaran, A.; Kachooei, A.R. Prevalence of comorbidities in COVID-19 patients: A systematic review and meta-analysis. Arch. Bone Jt. Surg. 2020, 8 (Suppl. S1), 247. [Google Scholar]


Publisher’s Note: MDPI stays neutral with regard to jurisdictional claims in published maps and institutional affiliations. |
© 2022 by the authors. Licensee MDPI, Basel, Switzerland. This article is an open access article distributed under the terms and conditions of the Creative Commons Attribution (CC BY) license (https://creativecommons.org/licenses/by/4.0/).
Share and Cite
Tabasi, M.; Alesheikh, A.A.; Babaie, E.; Hatamiafkoueieh, J. Spatiotemporal Surveillance of COVID-19 Based on Epidemiological Features: Evidence from Northeast Iran. Sustainability 2022, 14, 12189. https://doi.org/10.3390/su141912189
Tabasi M, Alesheikh AA, Babaie E, Hatamiafkoueieh J. Spatiotemporal Surveillance of COVID-19 Based on Epidemiological Features: Evidence from Northeast Iran. Sustainability. 2022; 14(19):12189. https://doi.org/10.3390/su141912189
Chicago/Turabian StyleTabasi, Mohammad, Ali Asghar Alesheikh, Elnaz Babaie, and Javad Hatamiafkoueieh. 2022. "Spatiotemporal Surveillance of COVID-19 Based on Epidemiological Features: Evidence from Northeast Iran" Sustainability 14, no. 19: 12189. https://doi.org/10.3390/su141912189
APA StyleTabasi, M., Alesheikh, A. A., Babaie, E., & Hatamiafkoueieh, J. (2022). Spatiotemporal Surveillance of COVID-19 Based on Epidemiological Features: Evidence from Northeast Iran. Sustainability, 14(19), 12189. https://doi.org/10.3390/su141912189