1. Introduction
Electrocoagulation (EC) is a technique that has been successfully used to treat wastewater [
1,
2,
3,
4,
5,
6,
7,
8], groundwater [
9,
10,
11,
12,
13,
14,
15], and drinking water [
16,
17]. The technique uses a reactor fed with electric current to produce hydroxides in situ (generally of iron or aluminum) by the anodic oxidation of these metals in an aqueous medium [
18]. The species formed in the reactor adsorb the contaminants found in the water and are removed by techniques such as sedimentation and filtration [
18,
19]. Disadvantages noted for EC reactor operation are the consumption of electrodes [
19,
20] and electrical energy [
19,
20,
21]. The distance between electrodes is the parameter with the greatest influence on energy consumption [
22]. Therefore, this study aims to determine the effect of different distances between electrodes: the treatment time required to reduce the residual concentration of F
− to 1.5 mg L
−1 (the maximum level allowed by the World Health Organization in water intended for human consumption) [
23], the energy and electrode consumption during the treatment time, and the liquid velocities profiles developed in the EC reactor.
2. Reactions in the Water Defluoridation Process
In the EC process, water defluorination is carried out by the following reactions [
2,
14,
16]:
Aluminum ions react with the hydroxyl ions produced at the cathode to form aluminum hydroxide according to the following reaction [
14,
16]:
The aluminum hydroxides produced are colloidal solids that remove the F
− and precipitate during the process. The reaction that describes the mechanism of F
− removal by flocs Al (OH)
3 is an ion exchange reaction [
14,
16]:
3. Aluminum Hydroxides Generated (w)
The quantity of the aluminum hydroxides generated depends directly on the consumption of the electrodes, which are formed from the dissolution of the electrodes, as shown in reactions (1)–(3). The following equation is used to calculate the consumption of electrodes (
w) in each water treatment process [
1,
24]:
where (
I) is the applied current, (
t) is the treatment time, (
n) is the number of electrons transferred, (
F) is the Faraday constant, and (
M) is the atomic mass of aluminum. According to this expression, the consumption of the electrodes is directly proportional to the treatment time and the supplied electric current.
4. Potential Drop on the Terminals (U)
The potential drop on the terminals, or the voltage drop across the reactor, is calculated using the following formula, disregarding the resistivity of the electrodes [
24]:
where (
U) is the voltage at the reactor terminals. This is equivalent to the sum of the individual potential differences involved in the process, as well as the ohmic drop of the aqueous medium (
d·i·
ρ), where (
d) is the interelectrode distance, (
ρ) the electrolyte resistivity and (
i) is the current density, (
ηA) and (
ηC) are the overpotentials of anode and cathode, and (
EA) and (
EC) the thermodynamic potentials. However, this value can be obtained experimentally by measuring the voltage at the terminal electrodes of the reactor.
5. Electric Power Consumption I
The electrical energy consumed during the EC process is obtained from the potential drop in the reactor (
U), the applied current (
I), and the treatment time (
t), as indicated in the following equation [
24]:
6. Materials and Methods
The fluoride (F−) water was prepared from a stock solution of sodium fluoride (NaF) and deionized water with 2.0 mM NaCl to simulate natural water with ionic strength. The pH value (7.0) was measured with a Hach pH meter.
The F− initial concentration (CF0 = 5 mg L−1) and the samples obtained during the experimentation were measured using the potentiometric technique, using Orion 9609 ion selective electrodes. To avoid the interference of other ions during the analysis of fluoride, a TISAB II ionic strength-adjusting solution was used.
Three batch reactors with a volume of 1 L were used for the experiments, and electrode racks with vertically oriented rectangular aluminum plates with distances between them of 9, 5, and 3 mm were used. The electrode’s dimensions were 10 × 14 × 0.635 cm in height, width, and thickness, respectively, and connected in bipolar mode.
The current density was fixed at 3.0 mAcm−2, employing a variable current source of 0–5 A.
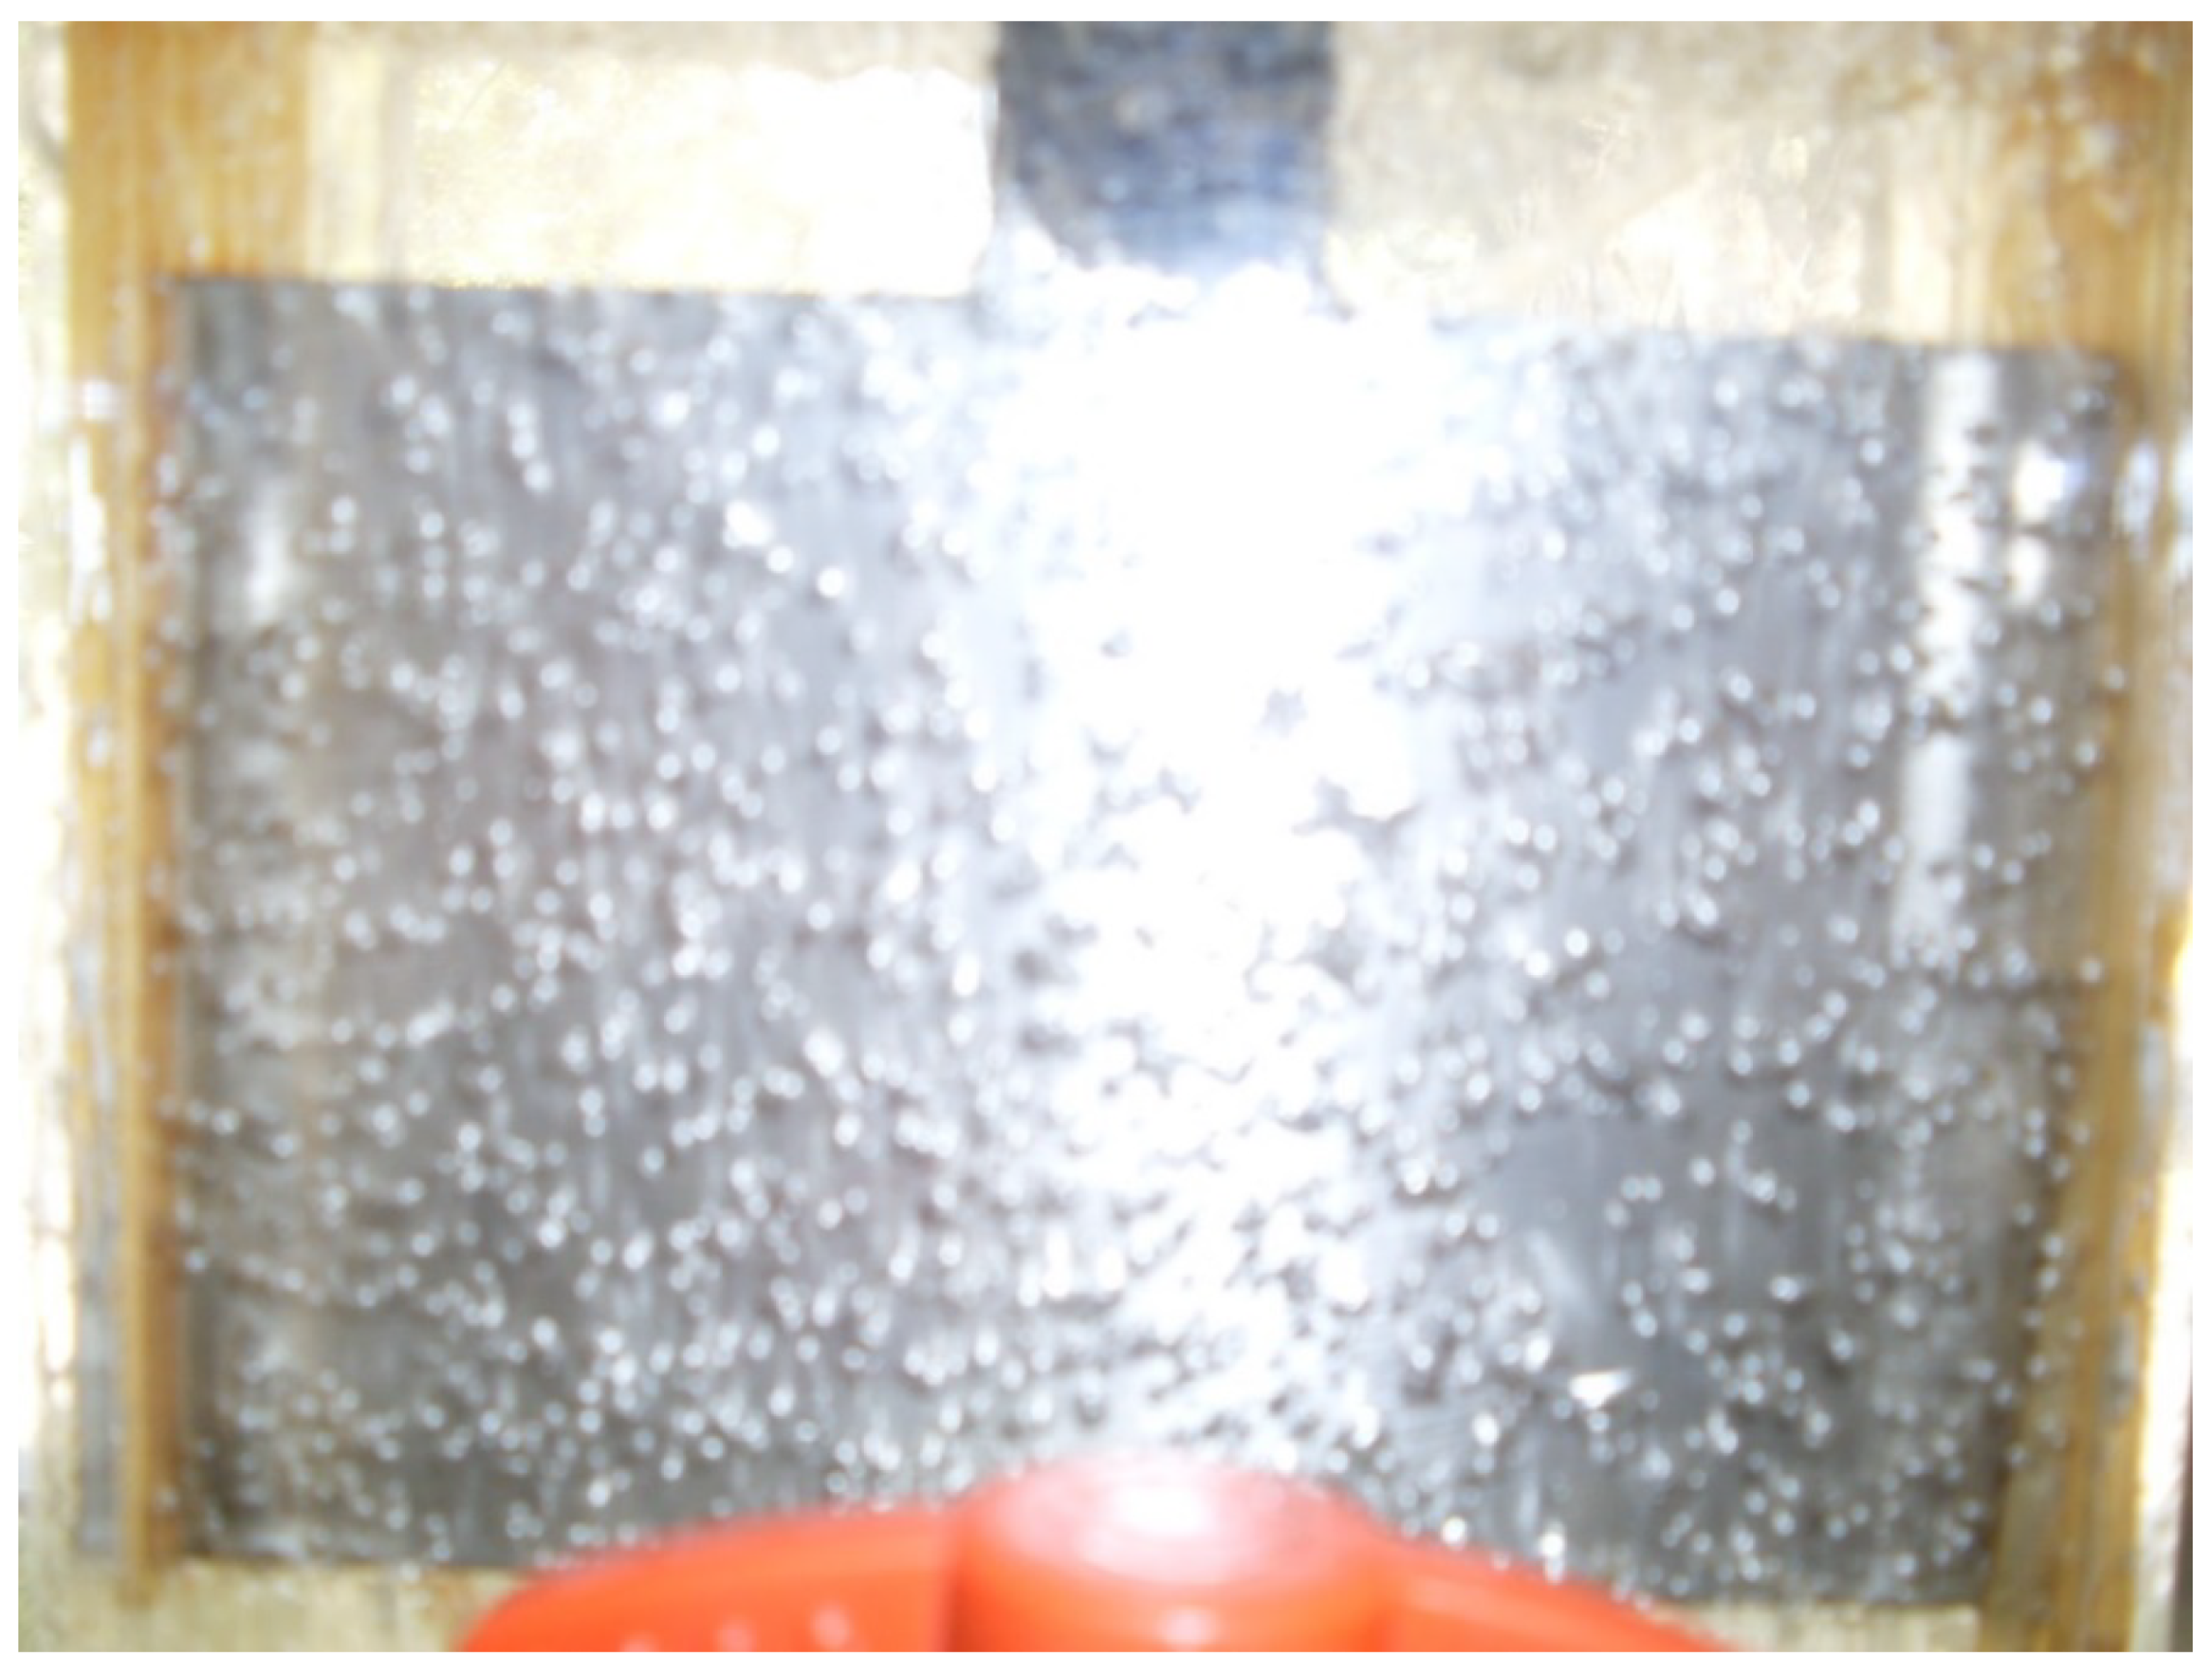
To generate the liquid movement, porous membrane diffusers located at the base of the reactor insufflated bubbles of approximately 2 mm in diameter at a velocity of 0.3 m s
−1 by a flow air pump (Azoo 9500) of 4.0 L min
−1 discharge. The distribution of air bubbles was uniform throughout the reactor chamber, as can be seen in
Figure 1.
The precipitates obtained in the removal of F− by the EC process were separated from the treated water by cellulose filter paper with a pore size of 2.5 μm, subsequently dried for 2 h at 100 °C in a Furnace Thermolyne 1500 muffle, and were weighed using an Ohaus electronic analytical balance.
7. Results and Discussion
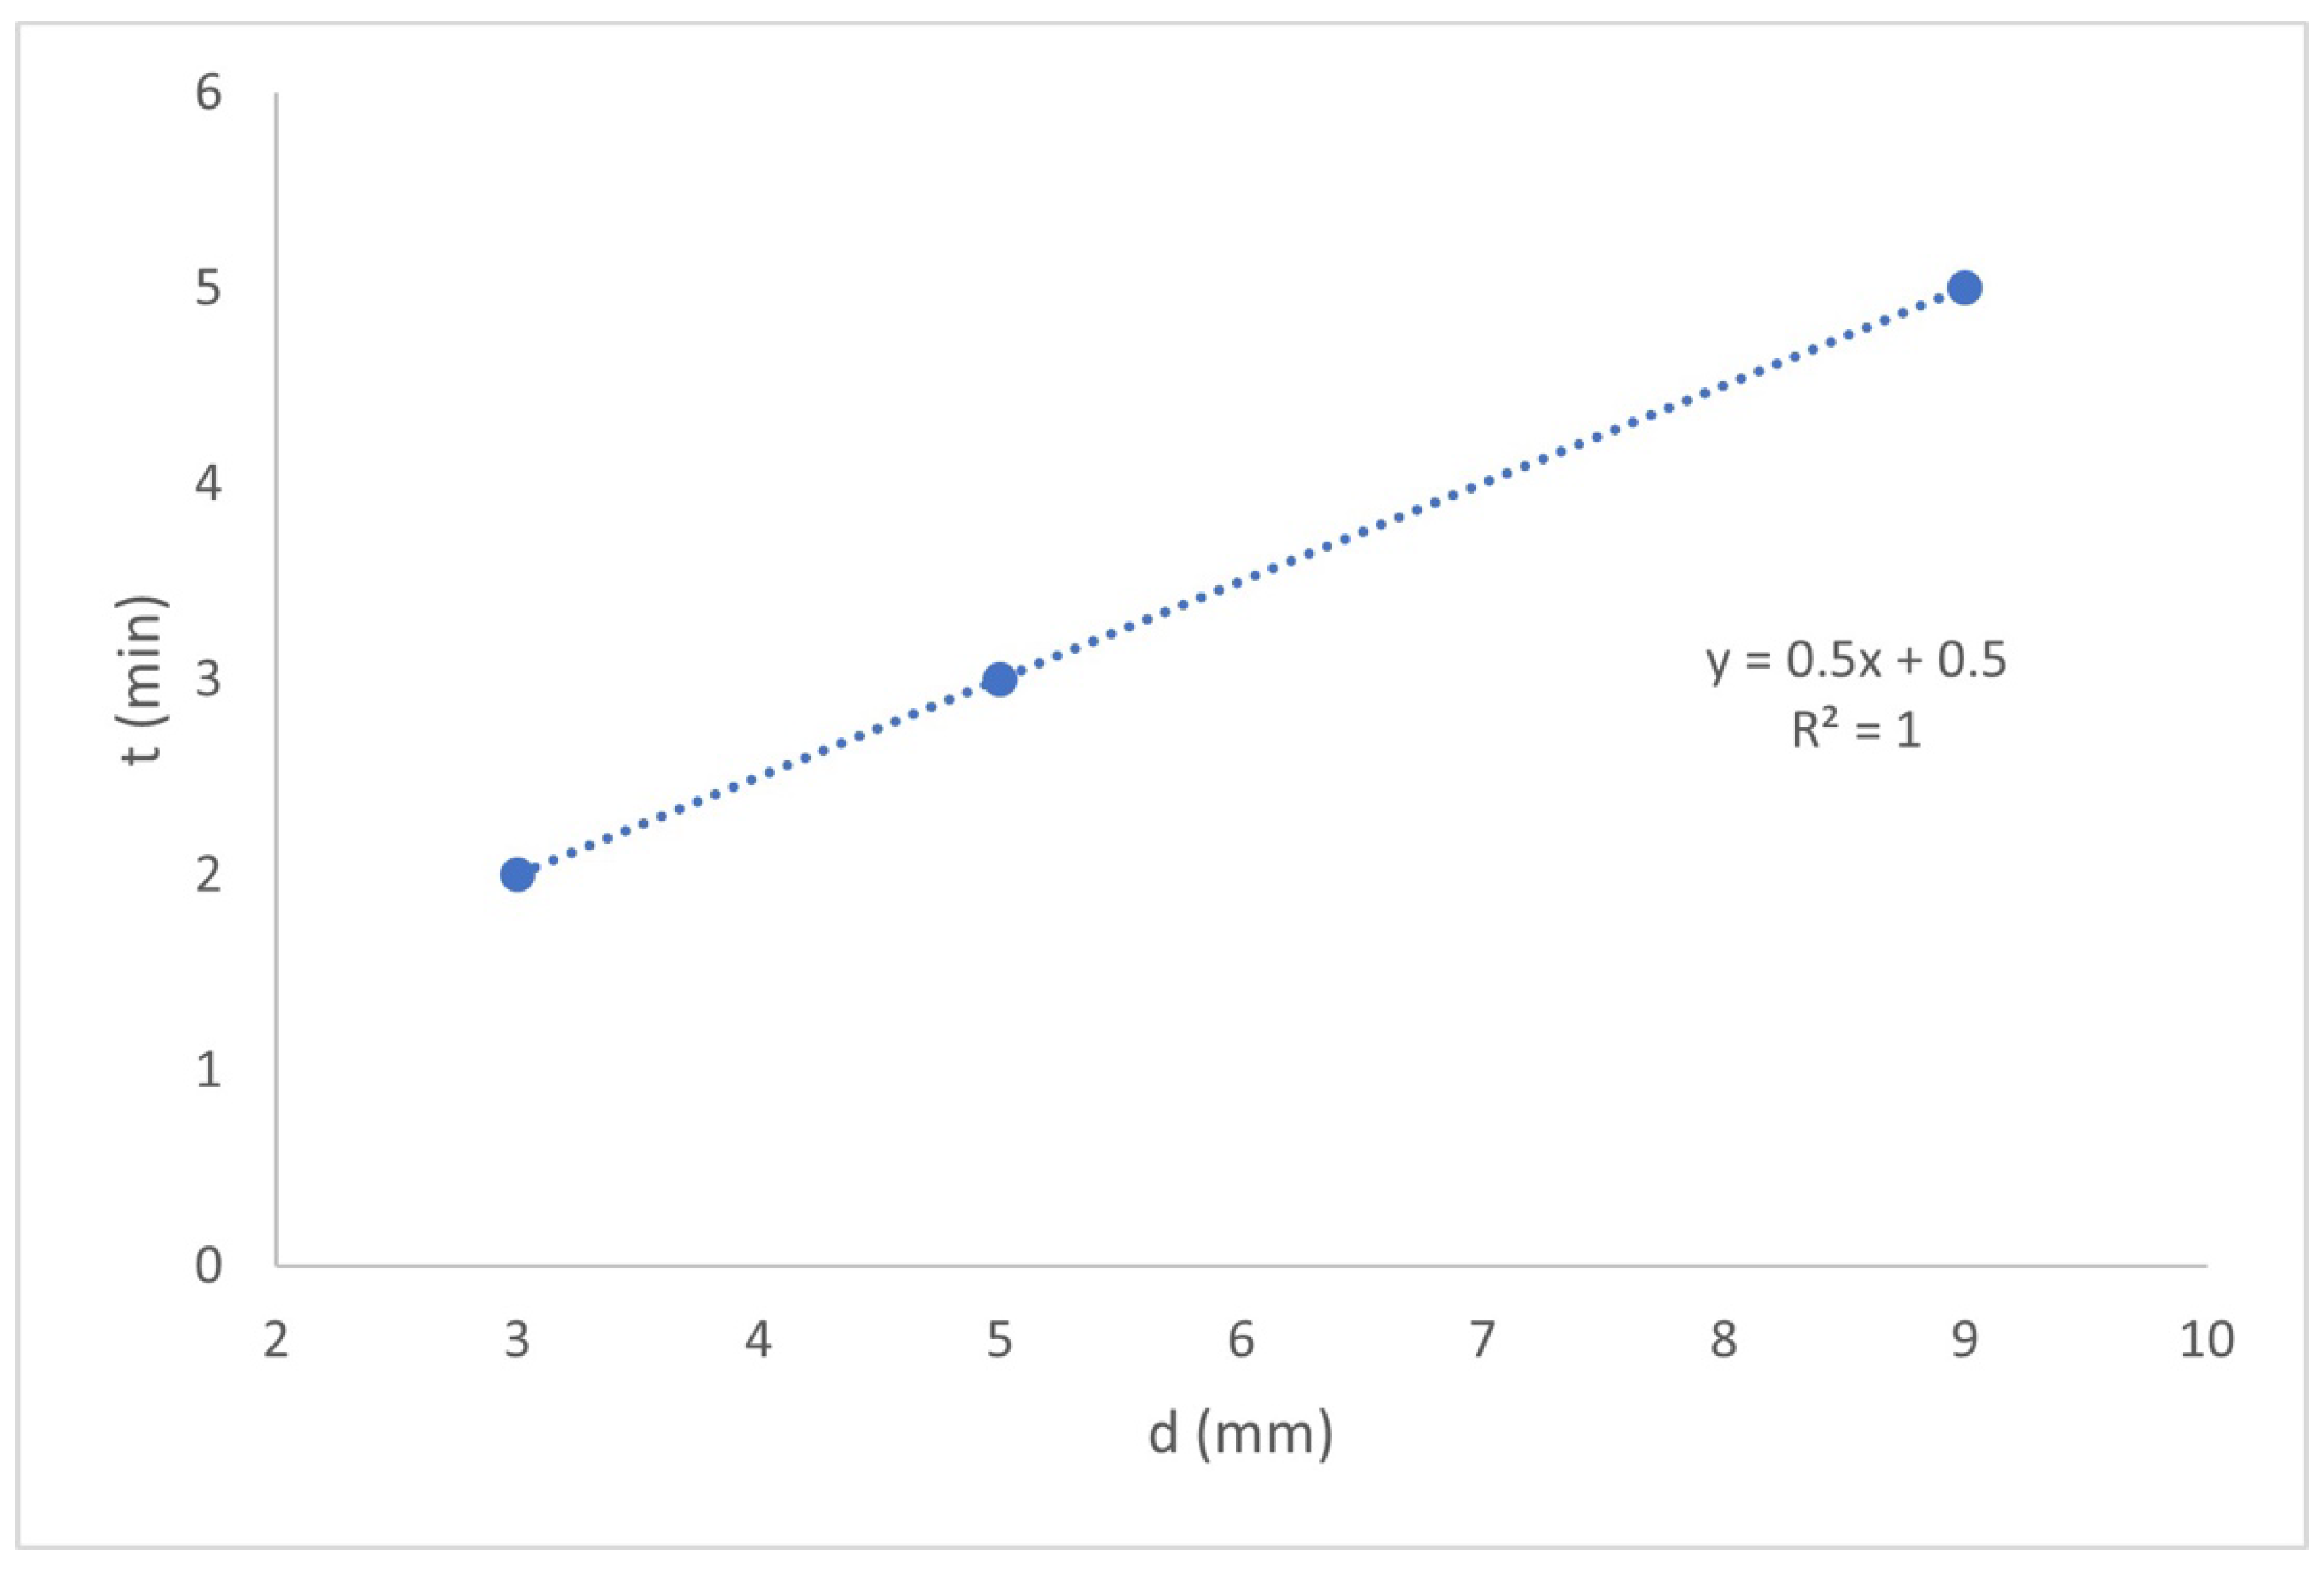
Figure 2 shows the effect of the interelectrode distance on the treatment time necessary to achieve C
F = 1.5 mg L
−1.
As shown in
Figure 2, the treatment time is precisely adjusted to the ratio y = 0.5x + 0.5. The shortest treatment time was that corresponding to
d = 3, followed by
d = 5 and finally d = 9, with 2, 3, and 5 min, respectively. This is because reactions (3) and (4) are faster, due to the liquid velocity increases, and greater mass transfer (MT) is achieved in the reactor chamber. Therefore, it can be established that, with a smaller
d, it will have a shorter treatment time necessary for the formation of aluminum hydroxides, which adsorb the F
− present in the water (according to reactions (3) and (4)). On the other hand, during the experiments with the shorter
d values, not only the turbulence in the interelectrode spaces but also in the reactor chamber was greater, producing the dispersion of the Al(OH
3) flocs in the reactor chamber and favoring the kinetics of these reactions.
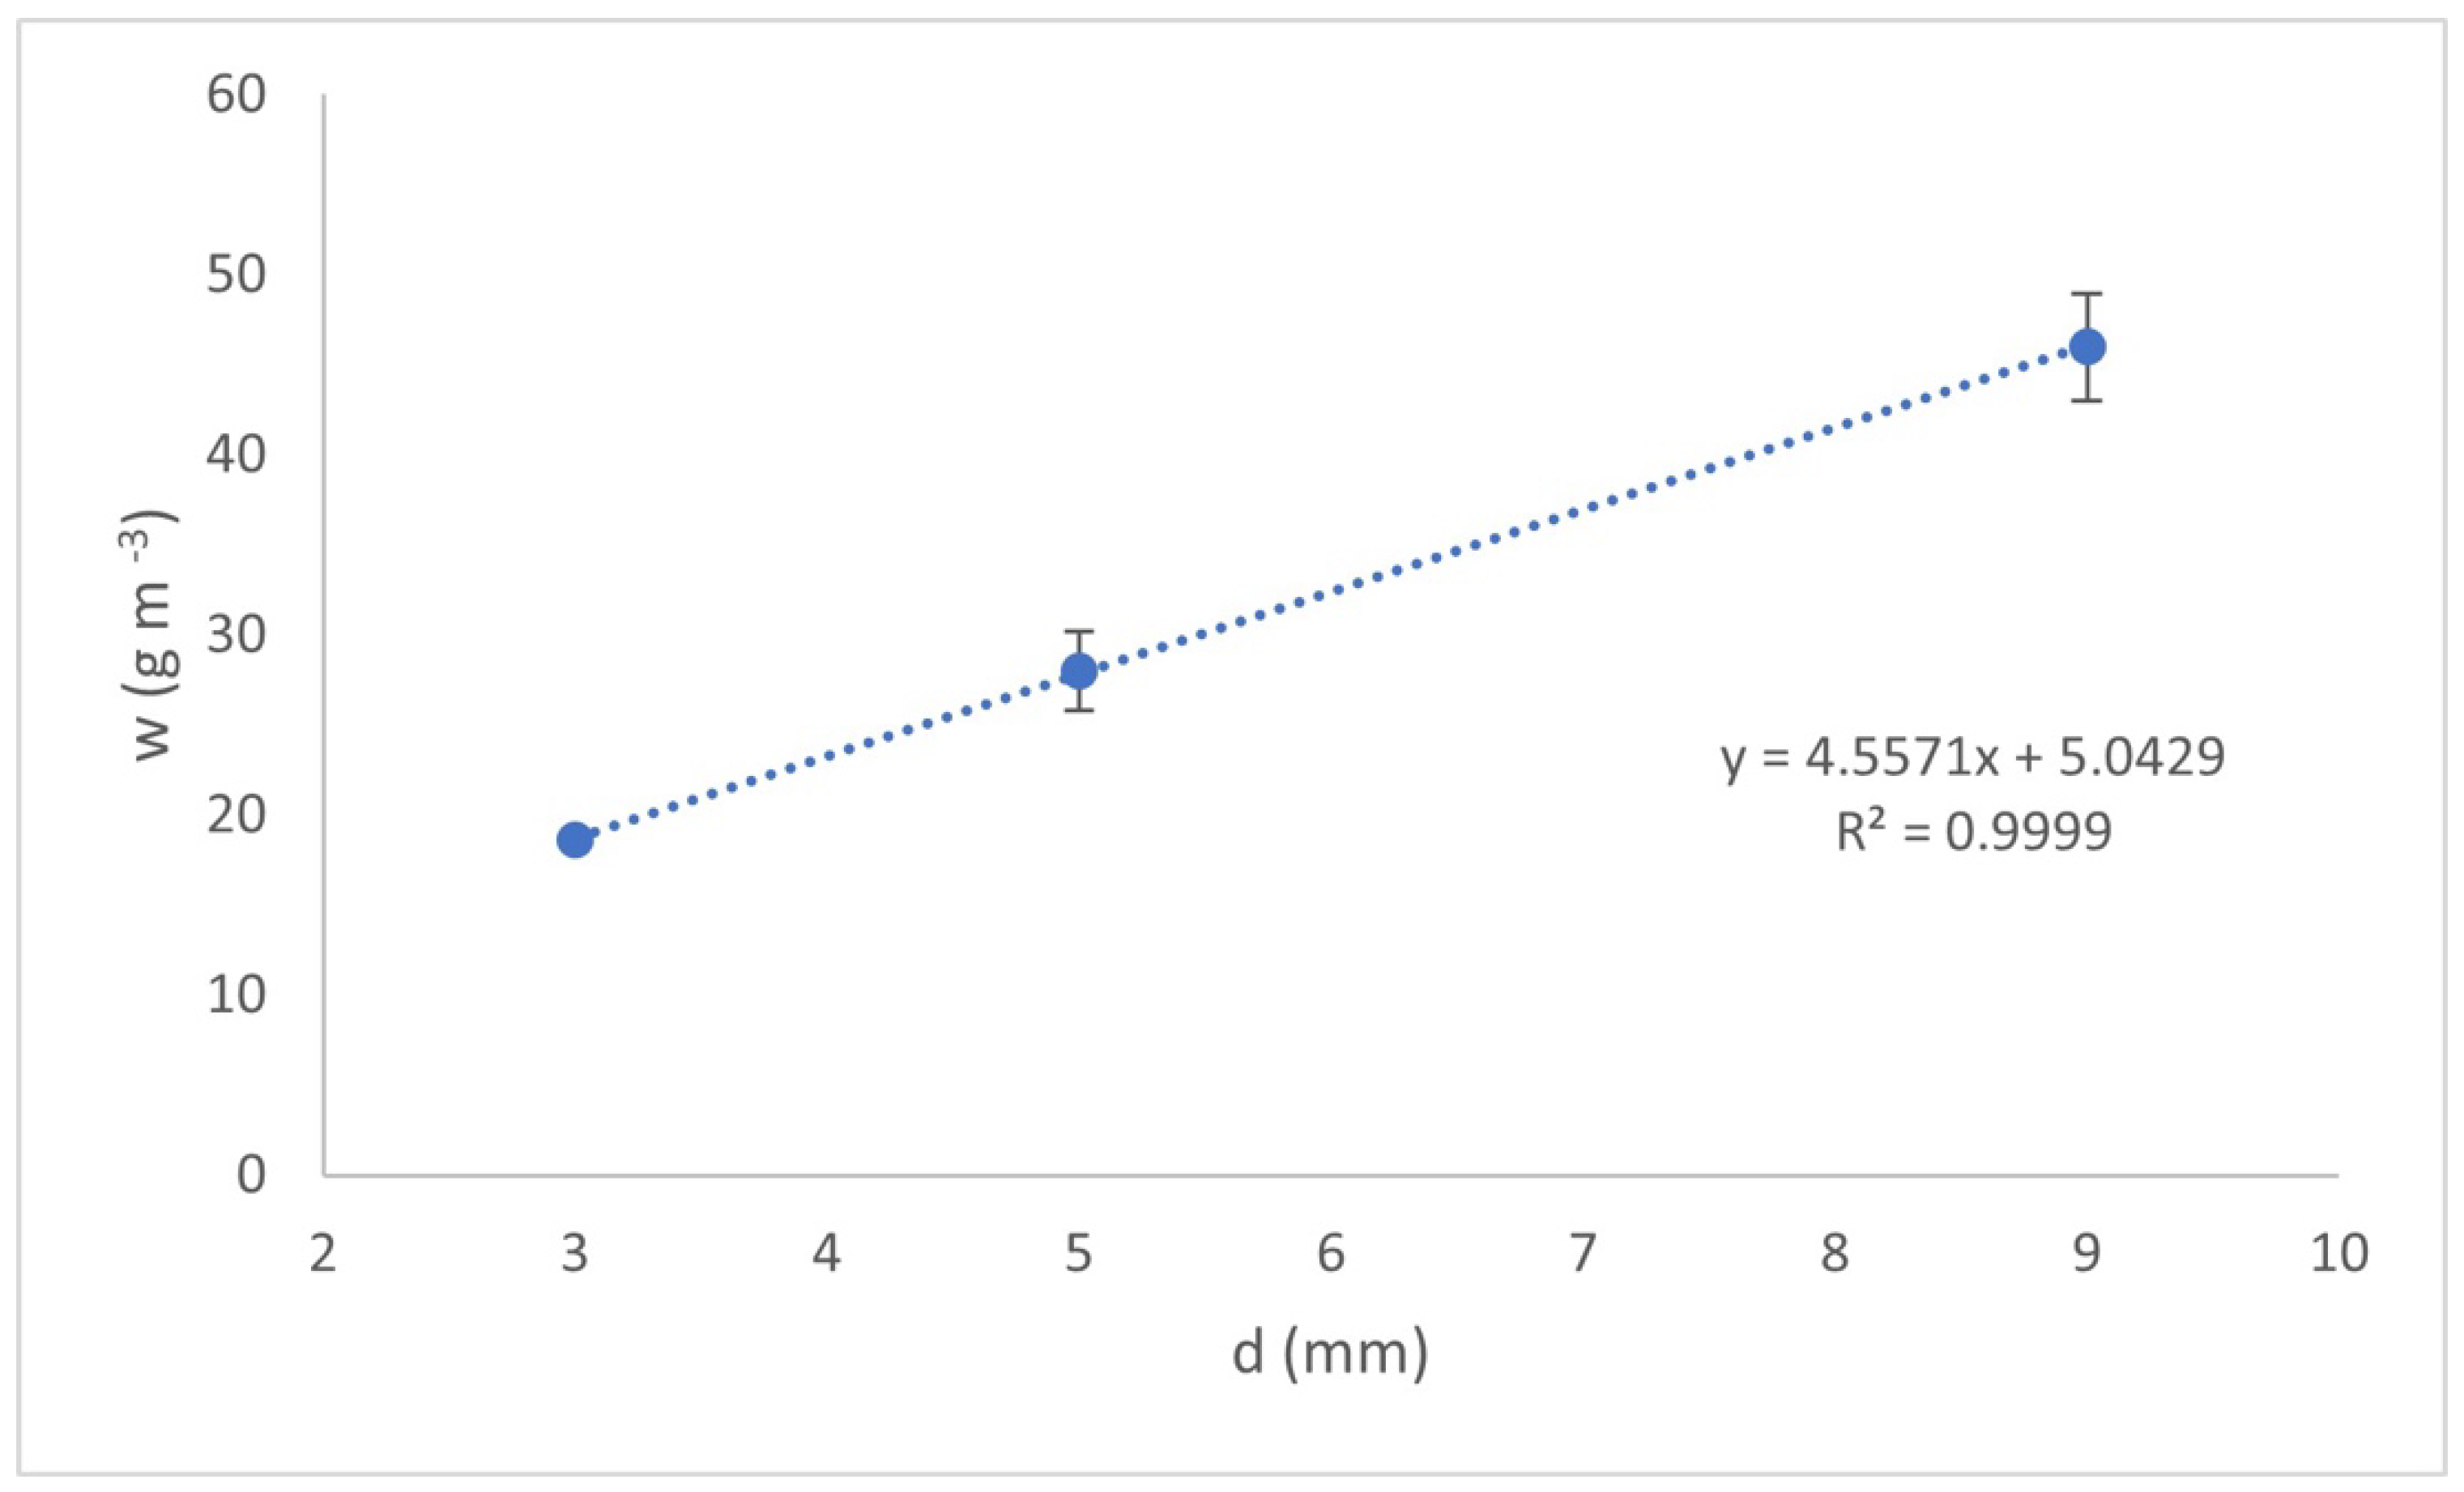
Figure 3 shows the amount of aluminum hydroxides formed (
w), obtained at the time of the treatment required to achieve a concentration of 1.5 mg L
−1 of F
− in the treated water as a function of the interelectrode distance
d.
As shown in
Figure 3, the increase in formed aluminum hydroxides is almost linear with d. The interelectrode distance with the lowest amount of aluminum hydroxides formed was that corresponding to
d = 3 mm, followed by
d = 5 mm and finally
d = 9 mm, with 18.5, 28, and 46 g m
−3, respectively. This is because reactions (1) and (2) are carried out instantaneously; however, the reactions (3) and (4) take more time due to their dependence on the MT. Due to the above, the influence of contaminant adsorption depends strongly on the dispersion of the flocs generated in the reactor in comparison to the amount of them. Therefore, the dispersion of Al(OH
3) flocs generated in the reactor chamber is more important than the amount generated in the chamber.
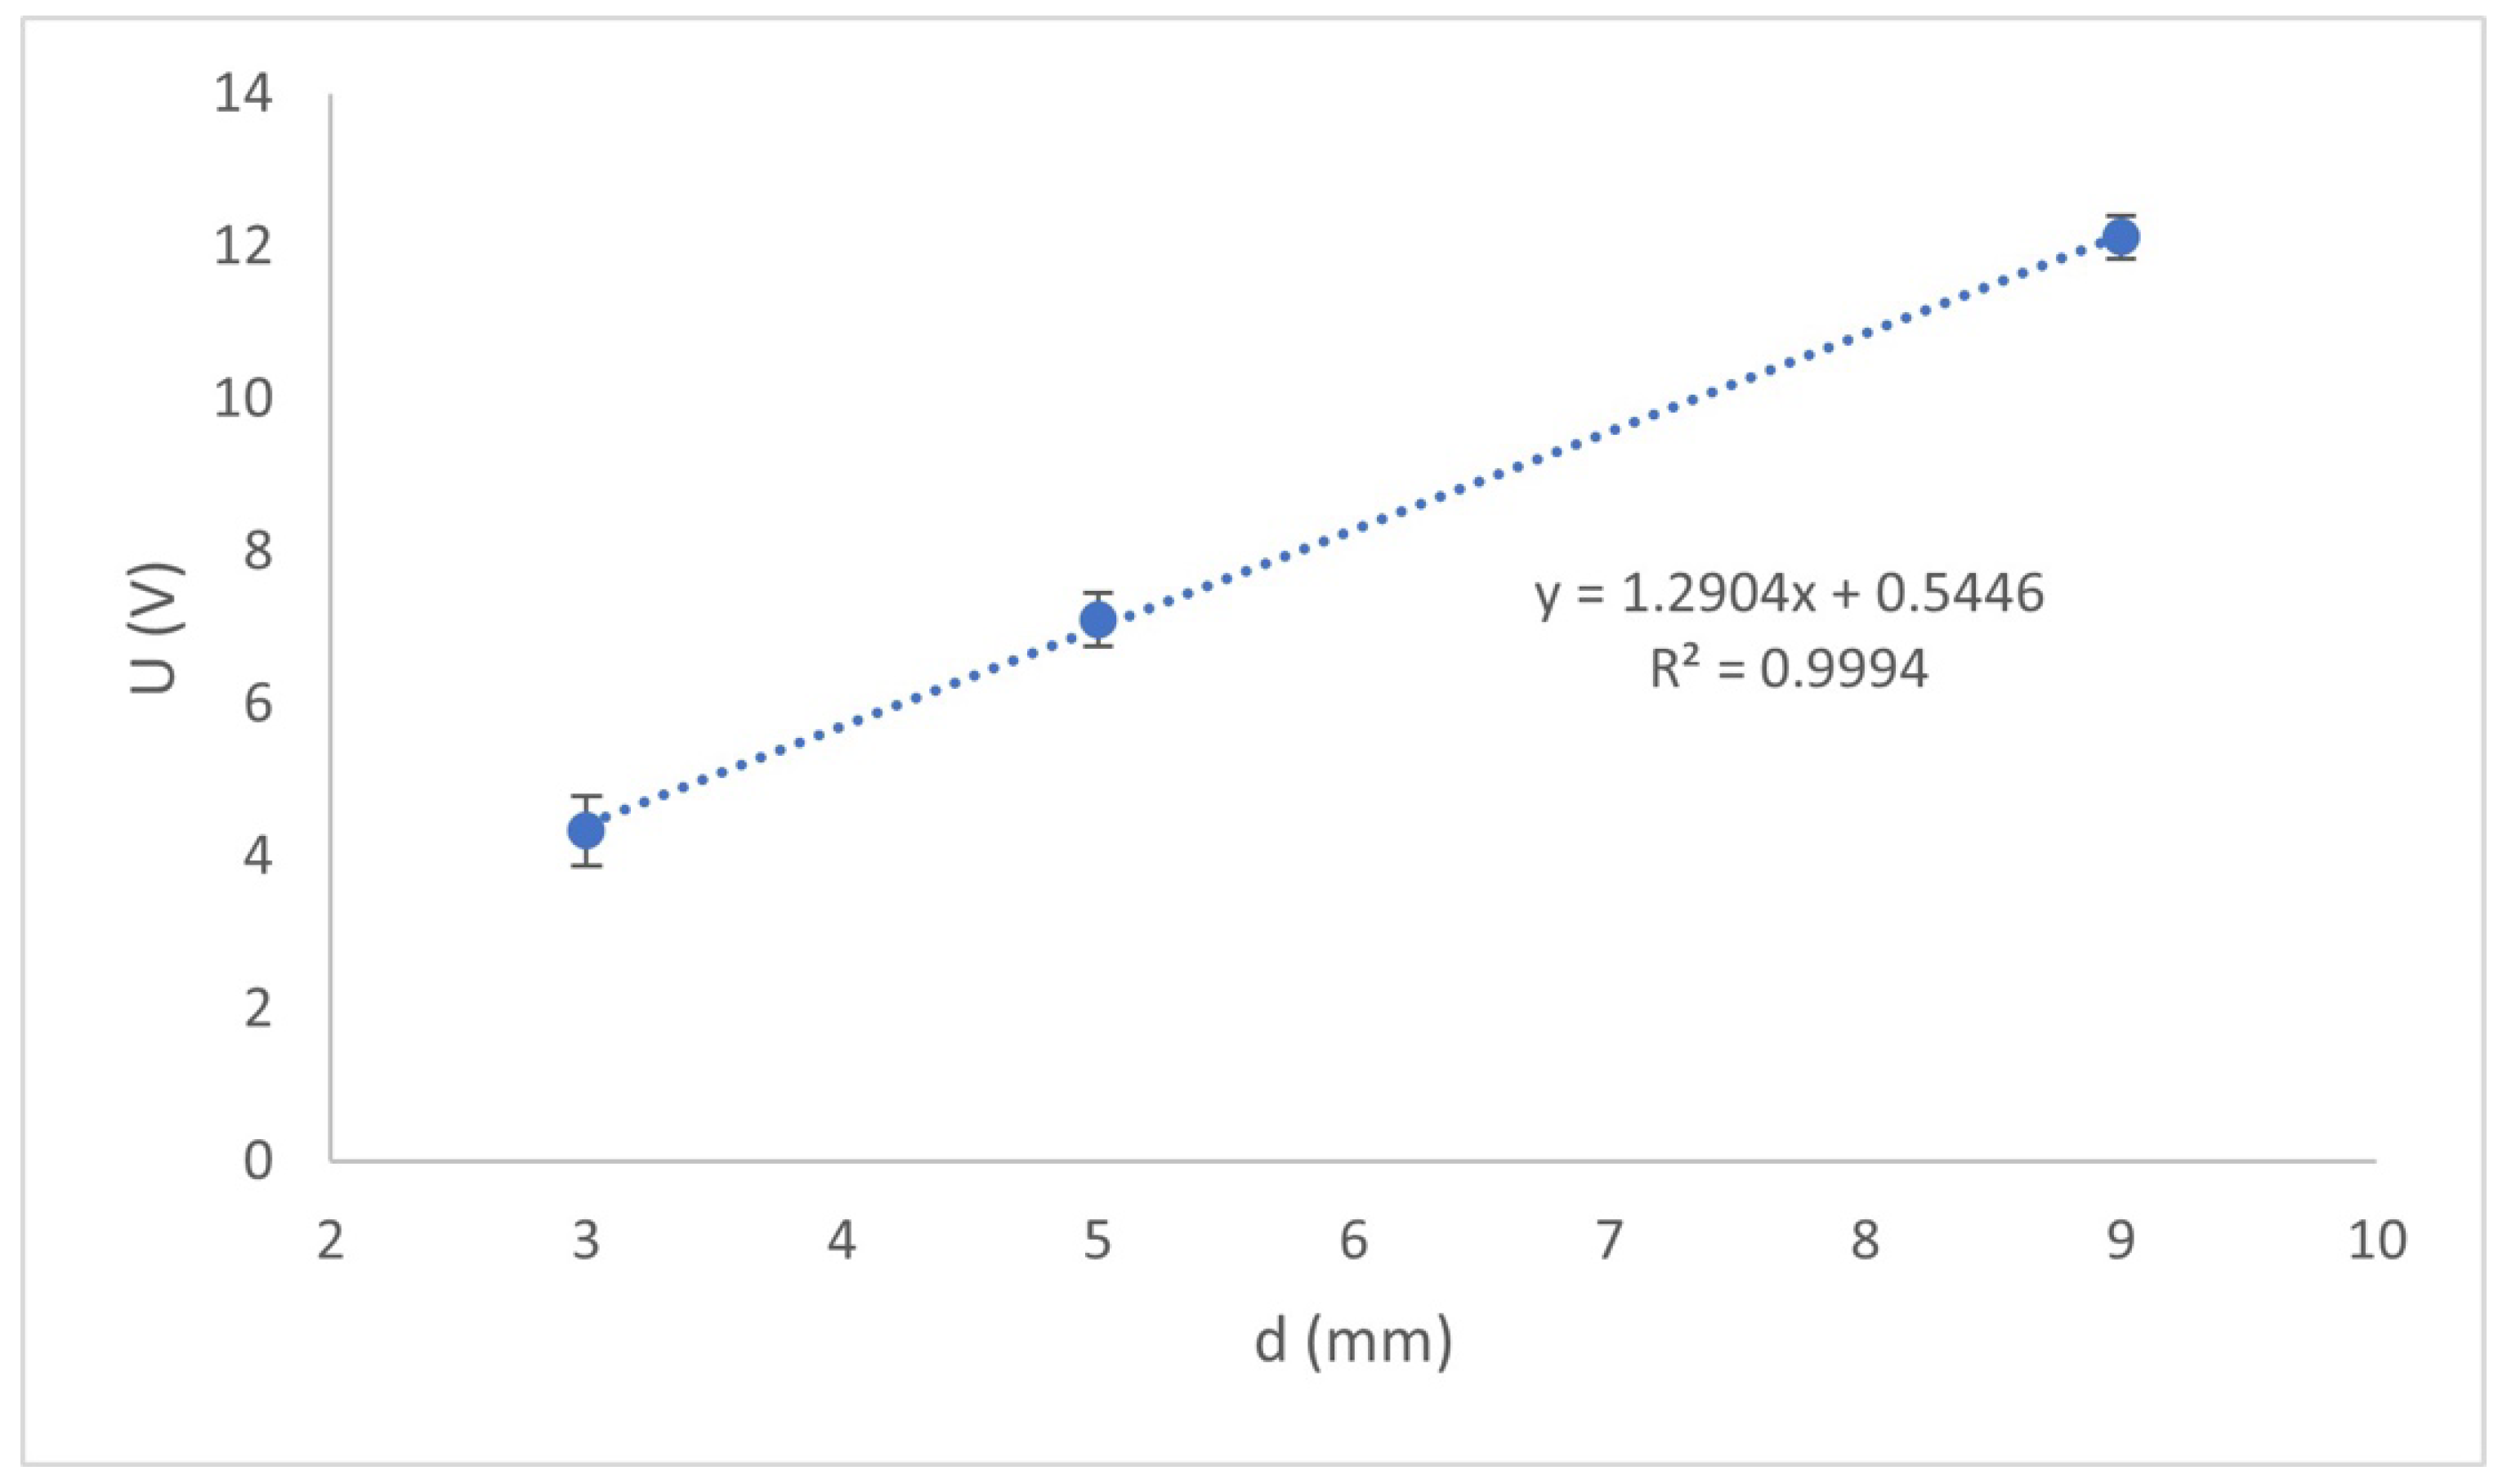
Figure 4 shows the effect of the interelectrode distance on the potential drop at the terminal electrodes at the time of treatment in which an F
− = 1.5 mg L
−1 concentration was achieved.
Figure 4 shows the following: the voltage drop in the reactor increases approximately linearly with the increase in the electrode distance. This tendency can be explained in terms of Equation (6) presented above, which indicates that
U depends directly on the interelectrode distance.
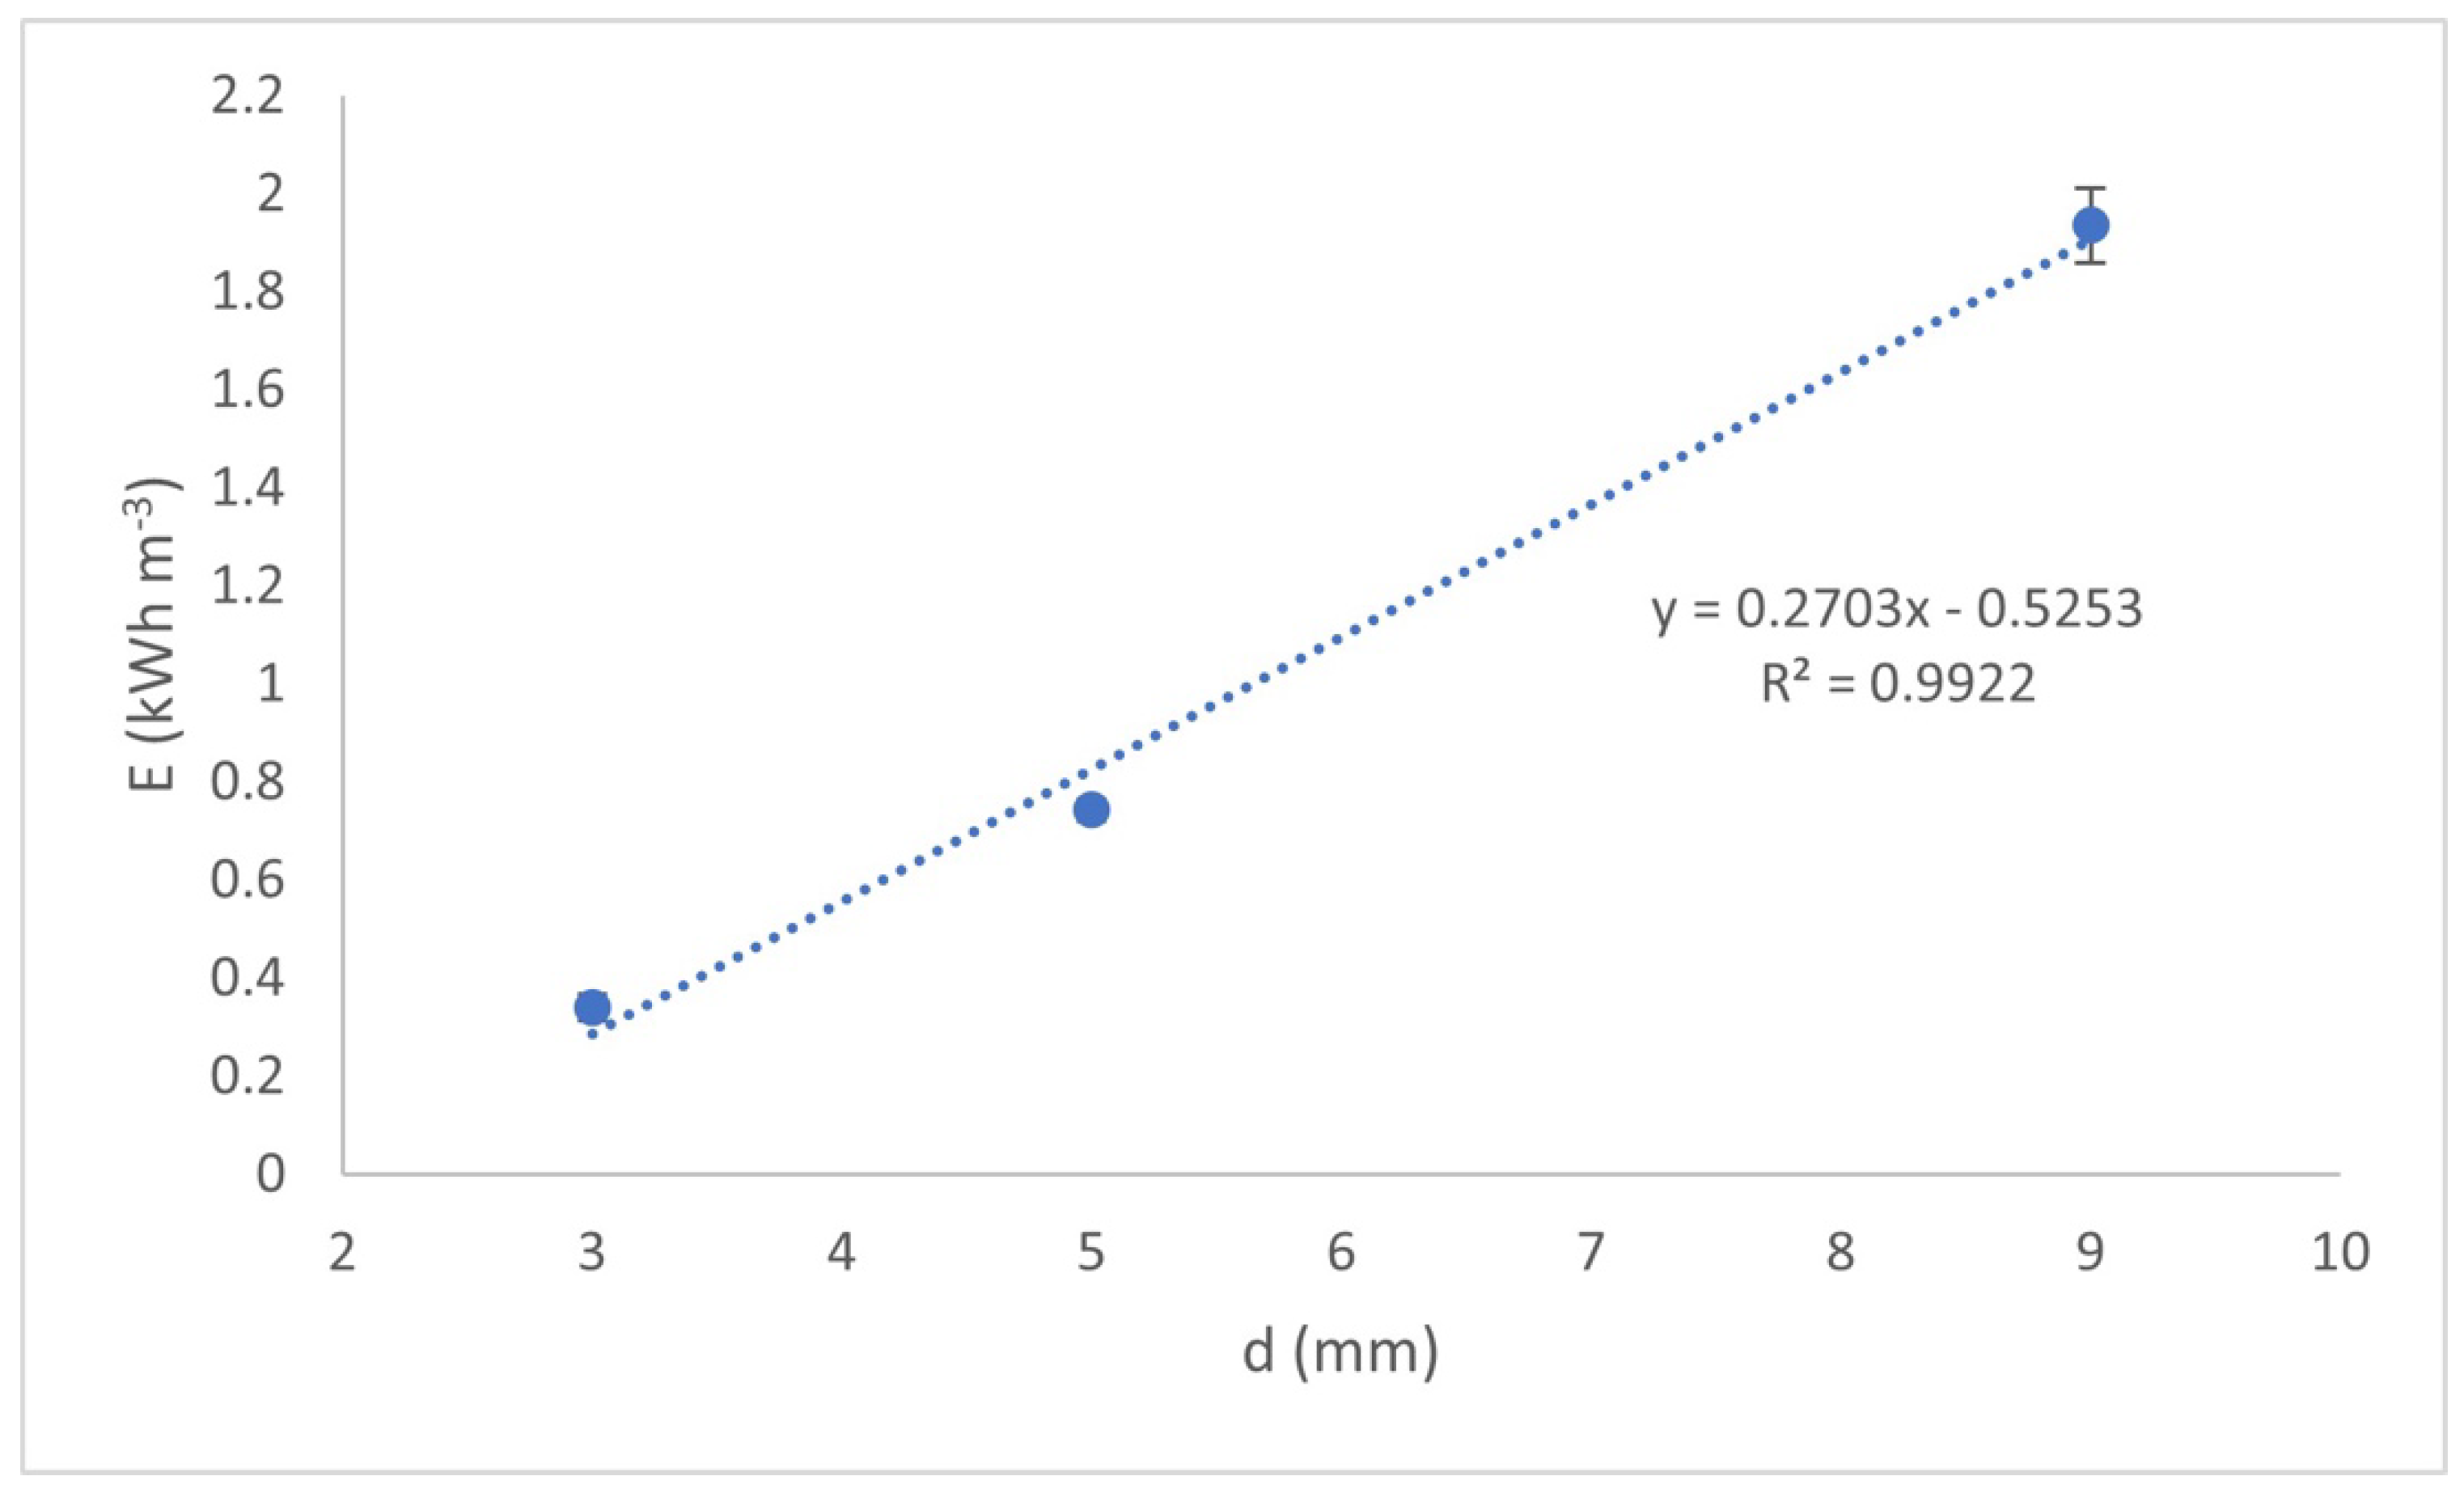
Figure 5 shows the effect of the interelectrode distance in the energy electric power consumption (E) required to achieve an F
− concentration of 1.5 mg L
−1 in the treated water.
In
Figure 5, the increase in the electricity consumption is not only directly proportional to the interelectrode distance but also to the treatment time, which is consistent with Equations (6) and (7) previously presented. It is also observed that this increase is approximately linear. It should be noted that this energy consumption involves that consumed by the reactor and by the air pump used to produce the movement of the liquid (3 watts per hour).
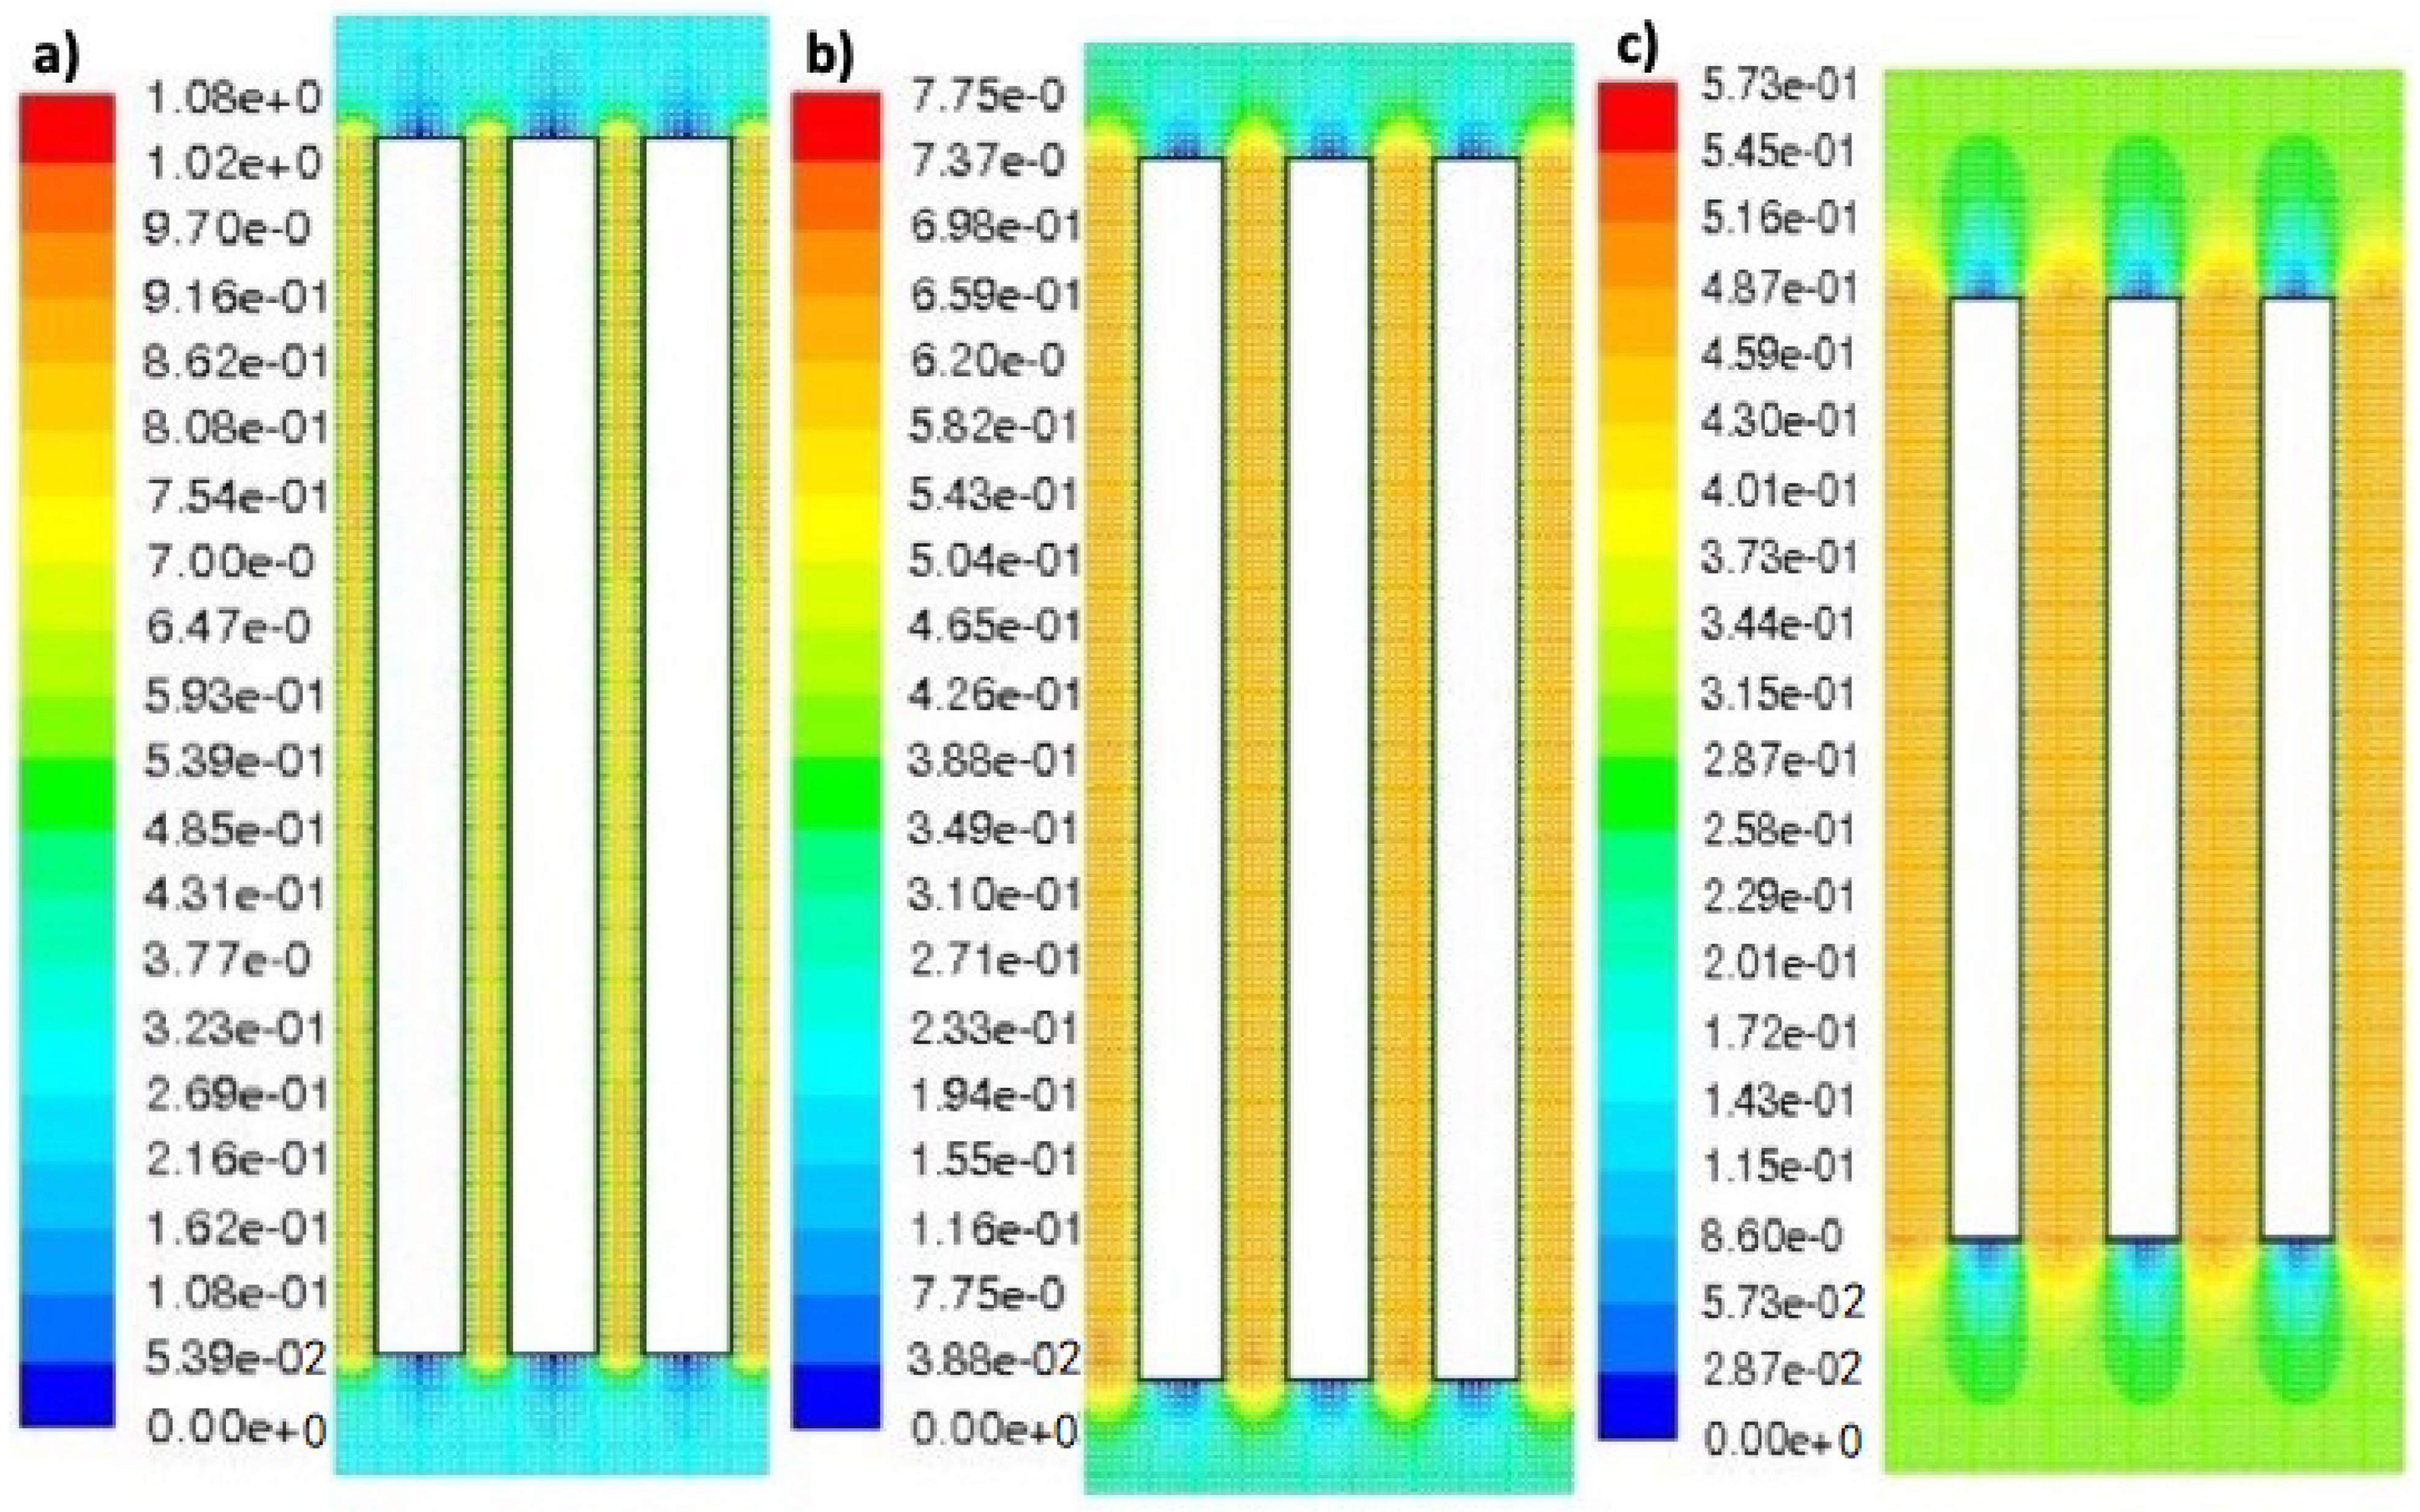
8. Simulation of the Developed Velocity Profiles
To visualize and numerically determine the velocity profiles achieved by the liquid inside the EC reactor at different interelectrode distances, the software FLUENT version 6.3 was employed. The software supports the numerical simulations by the Reynolds Stress Equation model (RSM), analyzing the flow and trajectory of the liquid. The simulation validates the water’s velocity profiles inside of the electrocoagulation reactor for different interelectrode distances, considering a steady state. The input parameters were water velocity, density, and viscosity; walls and electrodes were considered as solid materials.
Figure 6 shows the simulation results of the axial velocity profiles developed by the water inside the reaction chamber when the interelectrode distances are: (a) 3 mm, (b) 5 mm, and (c) 9 mm.
As can be seen in
Figure 6a–c, in which the white rectangles simulate the electrodes and the colors, the liquid motion. The initial and final velocity of the liquid moving through the reactor chamber is 0.3 ms
−1, the liquid velocity at the inferior and superior base of the electrodes is 0 ms
−1, and the velocity component of the liquid is faster in the interelectrode spaces. The initial velocity increases within the interelectrode spaces to approximately 0.48, 0.65, and 0.95 ms
−1 for interelectrode distances of 9, 5, and 3 mm, respectively. Therefore, it can be established that the movement of the species participating in the EC process (reaction (1)–(4)) is faster when d decreases, due to the velocity component of the liquid through the reactor chamber directly influencing the mass transfer of the process. These results show that the interelectrode distance has great importance not only in the formation velocity of flocs (AlOH
3) but also in the fluoride removal by them.
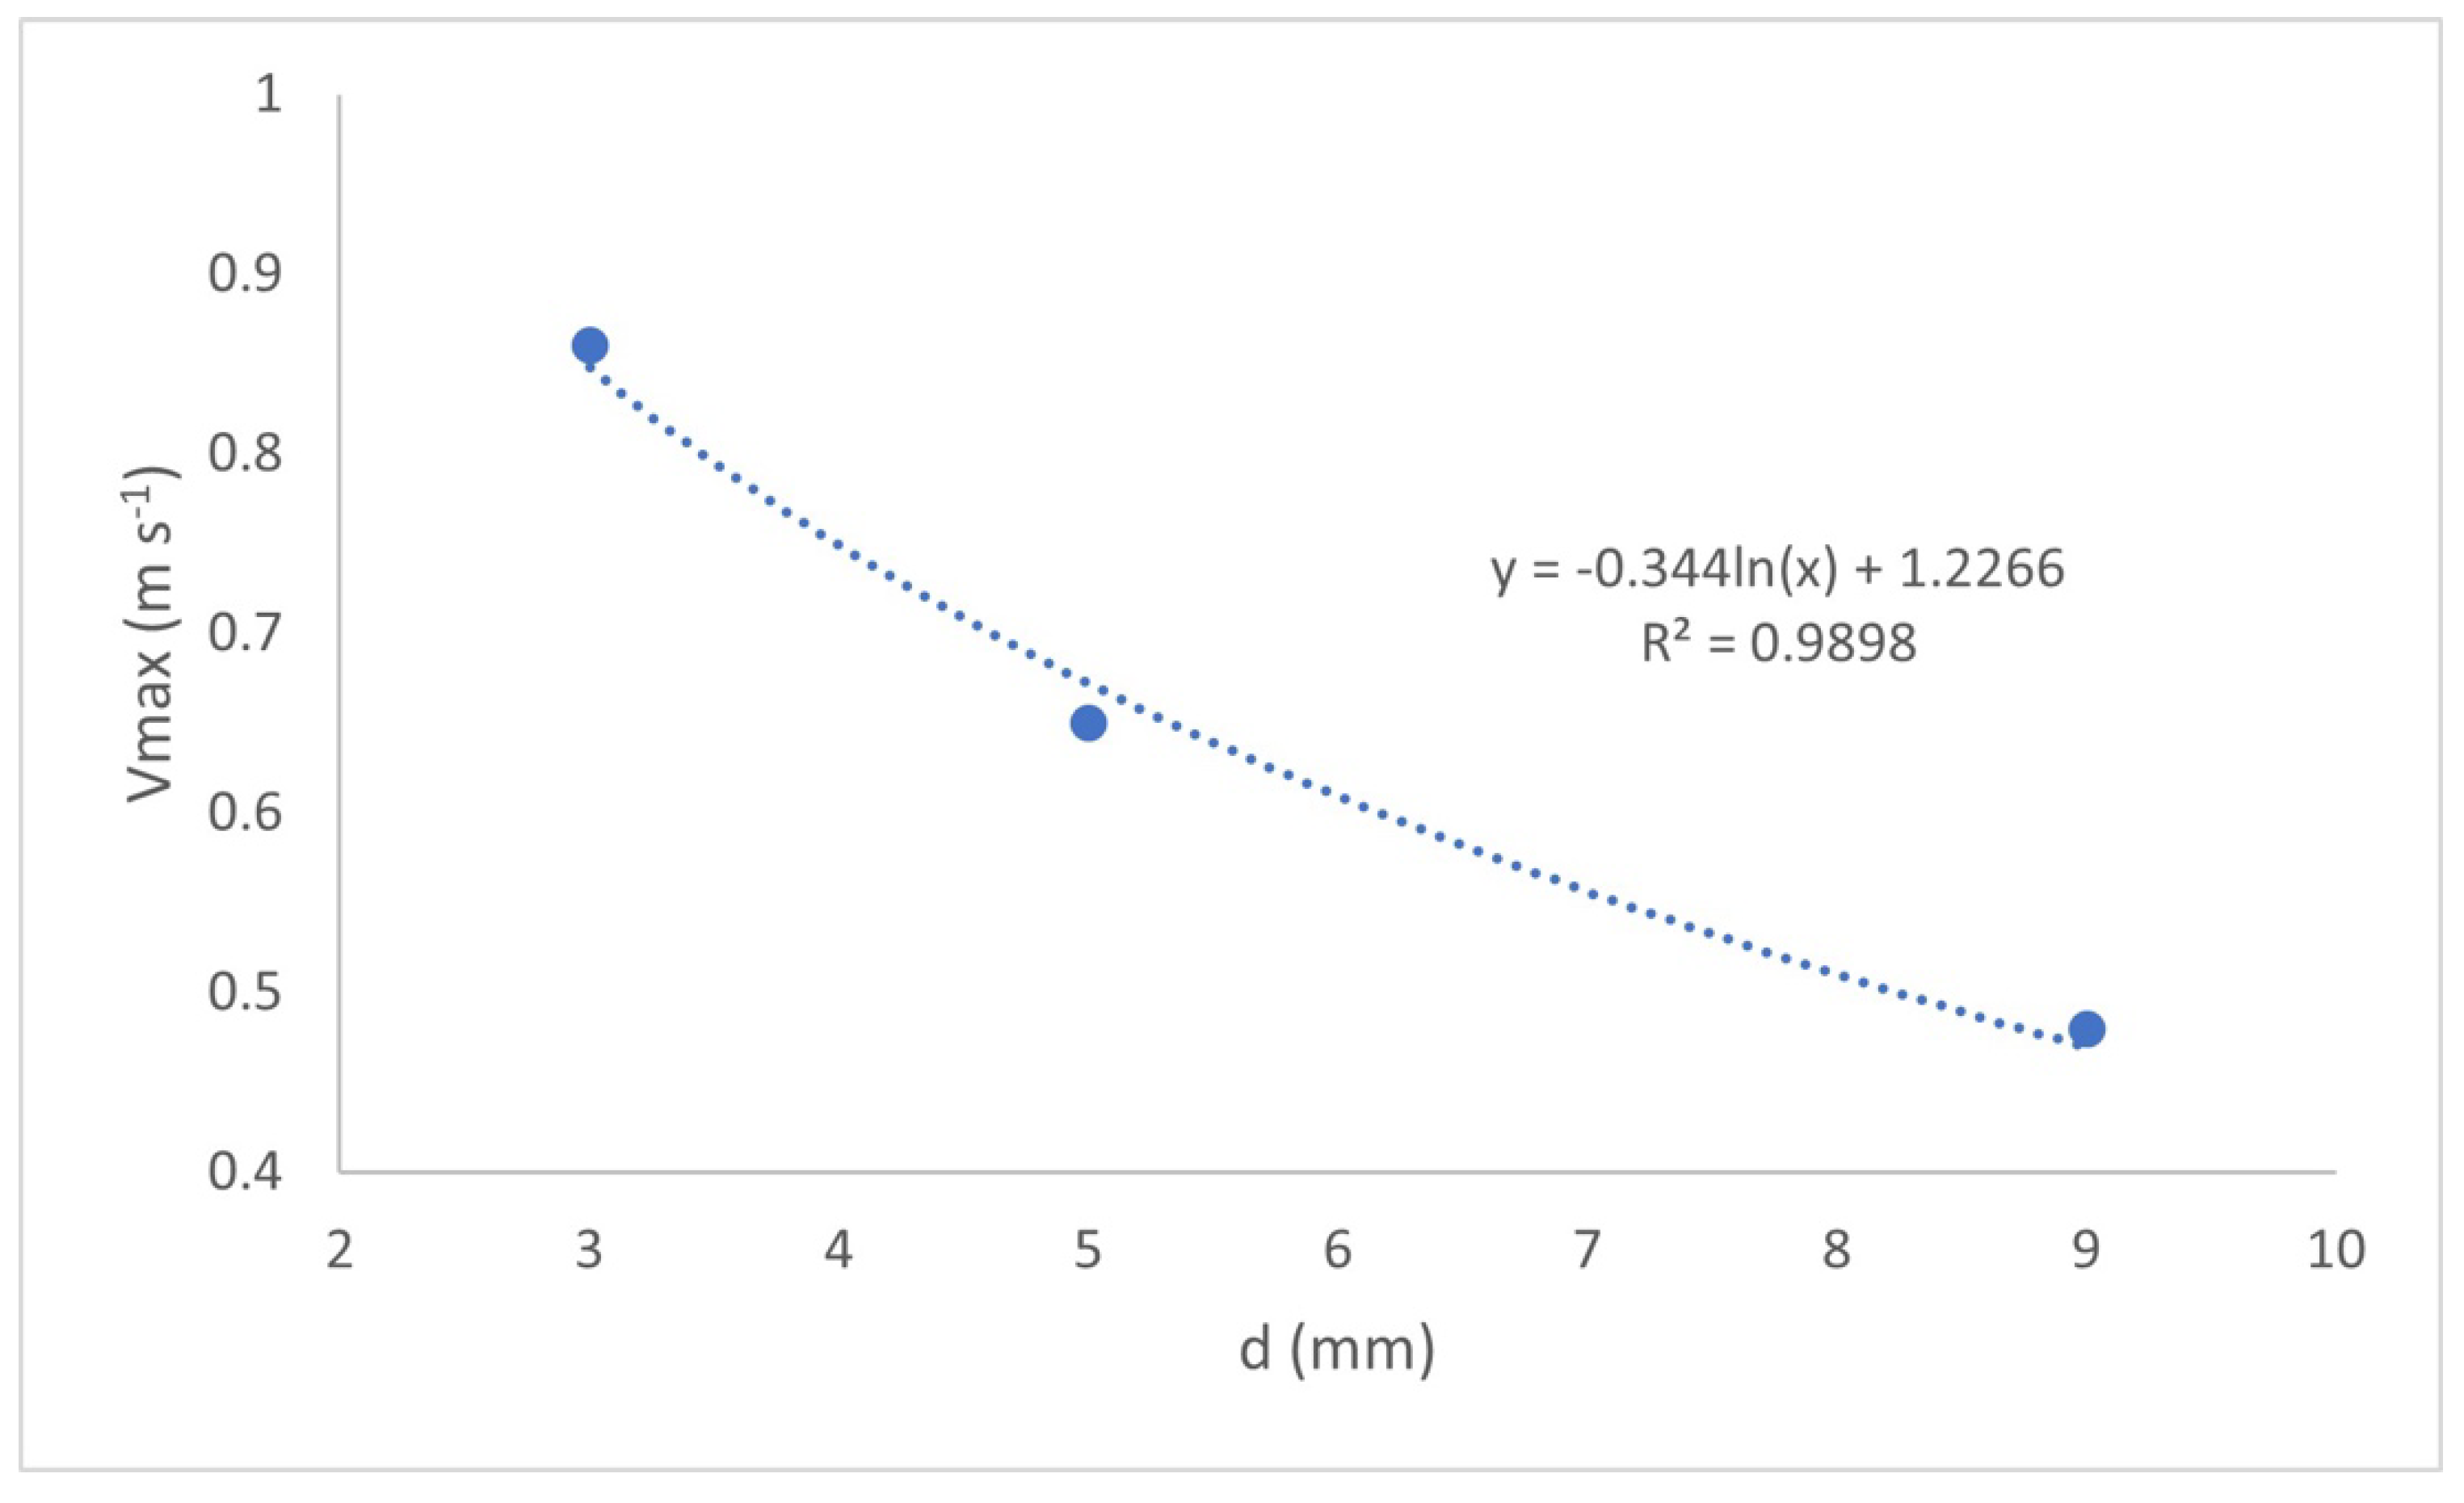
Figure 7 shows the maximum liquid velocity (Vmax) reached within the individual cells as a function of the interelectrode distance value.
Figure 7 shows the following, Vmax decreases as the value of d increases, from 0.86 m s
−1 for
d = 3 mm, to 0.48 m s
−1 for
d = 9 mm, which directly influences the mass transfer of the reactor, which represents the movement of the species participating in the EC process (reactions (1)–(4)). It is also observed that the values of Vmax are adjusted precisely to a logarithmic line (R
2 = 0.9898) with the relation, Vmax = −0.344ln(x) + 1.2266.
9. Conclusions
The liquid velocity in the reaction chamber increases as the interelectrode distance decreases, achieving a greater mass transfer in the EC reactor. The interelectrode distance has great importance not only in the formation velocity of flocs (AlOH3) but also in the fluoride removal by them. With shorter interelectrode distance, the EC reactor not only consumes less electrical energy but also fewer electrodes, and the dispersion of generated flocs in the reactor chamber is major. The dispersion of generated flocs Al(OH3) in the reactor chamber is more important than the amount of flocs generated.
Author Contributions
Conceptualization, J.F.M.-V., J.G.-C. and N.A.R.-R.; Data curation, J.F.M.-V. and O.G.-C.; Formal analysis, J.F.M.-V., J.S.G.-V. and O.G.-C.; Funding acquisition, C.R.M.-V.; Investigation, F.C.-R. and C.R.M.-V.; Methodology, J.S.G.-V., N.A.R.-R. and O.G.-C.; Resources, J.C.O.-C. and F.C.-R.; Supervision, J.C.O.-C., F.C.-R. and J.G.-C.; Validation, J.C.O.-C., J.G.-C. and C.R.M.-V.; Visualization, J.C.O.-C. and N.A.R.-R.; Writing—original draft, J.F.M.-V. and C.R.M.-V.; Writing—review & editing, J.S.G.-V. All authors have read and agreed to the published version of the manuscript.
Funding
This research received no external funding.
Data Availability Statement
The data and methods used in the research are presented in sufficient detail in the document for other researchers to replicate the work.
Acknowledgments
The authors gratefully acknowledge the financial support of PRODEP and CONACYT Mexico.
Conflicts of Interest
The authors declare no conflict of interest.
References
- Kamyab, H.; Yuzir, M.A.; Abdullah, N.; Quan, L.M.; Riyadi, F.A.; Marzouki, R. Recent Applications of the Electrocoagulation Process on Agro-Based Industrial Wastewater: A Review. Sustainability 2022, 14, 1985. [Google Scholar]
- Marmanis, D.; Emmanouil, C.; Fantidis, J.G.; Thysiadou, A.; Marmani, K. Description of a Fe/Al Electrocoagulation Method Powered by a Photovoltaic System, for the (Pre-) Treatment of Municipal Wastewater of a Small Community in Northern Greece. Sustainability 2022, 14, 4323. [Google Scholar] [CrossRef]
- Shivaprasad, K.S. Electrochemical treatment of two health-care wastewaters—A comparative study. Sep. Sci. Technol. 2022, 57, 2323–2339. [Google Scholar]
- Akter, S.; Suhan, M.B.K.; Islam, M.S. Recent advances and perspective of electrocoagulation in the treatment of wastewater: A review. Environ. Nanotechnol. Monit. Manag. 2022, 17, 100643. [Google Scholar] [CrossRef]
- Chen, R.F.; Wu, L.; Zhong, H.T.; Liu, C.X.; Qiao, W.; Wei, C.H. Evaluation of electrocoagulation process for high-strength swine wastewater pretreatment. Sep. Purif. Technol. 2021, 272, 118900. [Google Scholar] [CrossRef]
- Jadhao, V.K.; Kodape, S.; Junghare, K. Optimization of electrocoagulation process for fluoride removal: A blending approach using gypsum plaster rich wastewater. Sustain. Environ. Res. 2019, 29, 1–9. [Google Scholar] [CrossRef]
- Song, P.; Yang, Z.; Zeng, G.; Yang, X.; Xu, H.; Wang, L.; Ahmad, K. Electrocoagulation treatment of arsenic in wastewaters: A comprehensive review. Chem. Eng. J. 2017, 317, 707–725. [Google Scholar] [CrossRef]
- Hu, C.Y.; Lo, S.L.; Kuan, W.H.; Lee, Y.D. Removal of fluoride from semiconductor wastewater by electrocoagulation–flotation. Water Res. 2005, 39, 895–901. [Google Scholar] [CrossRef]
- Müller, D.; Stirn, C.N.; Maier, M.V. Arsenic Removal from Highly Contaminated Groundwater by Iron Electrocoagulation—Investigation of Process Parameters and Iron Dosage Calculation. Water 2021, 13, 687. [Google Scholar] [CrossRef]
- Si, Y.; Zhang, F.; Hong, C.; Li, G.; Zhang, H.; Liu, D. Effect of current density on groundwater arsenite removal performance using air cathode electrocoagulation. Front. Environ. Sci. Eng. 2021, 15, 112. [Google Scholar] [CrossRef]
- Ghosh, S.; Debsarkar, A.; Dutta, A. Technology alternatives for decontamination of arsenic-rich groundwater—A critical review. Environ. Technol. Innov. 2019, 13, 277–303. [Google Scholar] [CrossRef]
- Omwene, P.I.; Çelen, M.; Öncel, M.S.; Kobya, M. Arsenic removal from naturally arsenic contaminated ground water by packed-bed electrocoagulator using Al and Fe scrap anodes. Process Saf. Environ. Prot. 2019, 121, 20–31. [Google Scholar] [CrossRef]
- Mohora, E.; Rončević, S.; Agbaba, J.; Zrnić, K.; Tubić, A.; Dalmacija, B. Arsenic removal from groundwater by horizontal-flow continuous electrocoagulation (EC) as a standalone process. J. Environ. Chem. Eng. 2018, 6, 512–519. [Google Scholar] [CrossRef]
- Luna, J.; Martinez, J.; Montero, C.; Muñiz, C.; Ortiz, J.; Gonzalez, G.; Vazquez, V.; Equihua, F. Defluoridation of groundwater in central Mexico by electrocoagulation. Fluoride 2018, 51, 34–43. [Google Scholar]
- Van Genuchten, C.M.; Addy, S.E.; Pena, J.; Gadgil, A.J. Removing arsenic from synthetic groundwater with iron electrocoagulation: And Fe and As K-edge EXAFS study. Environ. Sci. Technol. 2012, 46, 986–994. [Google Scholar] [CrossRef]
- Sandoval, M.A.; Fuentes, R.; Nava, J.L.; Rodriguez, I. Fluoride removal from drinking water by electrocoagulation in a continuos filter press reactor coupled to a flocculator and clarifier. Sep. Purif. Technol. 2014, 134, 163–170. [Google Scholar] [CrossRef]
- Kobya, M.; Gebologlu, U.; Ulu, F.; Oncel, S.; Demirbas, E. Removal of arsenic from drinking water by the electrocoagulation using Fe and Al electrodes. Electrochim. Acta 2011, 56, 5060–5070. [Google Scholar] [CrossRef]
- Cocke, D.L.; Gomes, J.A.; Kesmez, M.; Daida, M.; Weir, M.; Moreno, H.; Parga, J.R.; Irwin, G.; McWhinney, H.; Grady, T.; et al. Arsenic removal by electrocoagulation using combined Al–Fe electrode system and characterization of products. J. Hazard. Mater. 2007, 139, 220–231. [Google Scholar]
- Mollah, M.Y.A.; Morkovsky, P.; Gomes, J.A.; Kesmez, M.; Parga, J.; Cocke, D.L. Fundamentals, present and future perspectives of electrocoagulation. J. Hazard. Mater. 2004, 114, 199–210. [Google Scholar] [CrossRef]
- Avsar, Y.; Kurt, U.; Gonullu, T. Comparison of classical chemical and electrochemical processes for treating rose processing wastewater. J. Hazard. Mater. 2007, 148, 340–345. [Google Scholar] [CrossRef]
- Chen, G. Electrochemical technologies in wastewater treatment. Sep. Purif. Technol. 2004, 38, 11–41. [Google Scholar] [CrossRef]
- Martínez-Villafañe, J.F.; Montero-Ocampo, C. Optimisation of energy consumption in arsenic electro-removal from groundwater by the Taguchi method. Sep. Purif. Technol. 2010, 70, 302–305. [Google Scholar] [CrossRef]
- World Health Organization (WHO). Guidelines for Drinking Water Quality, Volume 1, Recommendations; World Health Organization (WHO): Geneva, Switzerland, 2004; p. 376.
- Martínez-Villafañe, J.F.; Montero-Ocampo, C.; García-Lara, A.M. Energy and electrode consumption analysis of electrocoagulation for the removal of arsenic from underground water. J. Hazard. Mater. 2009, 172, 1617–1622. [Google Scholar] [CrossRef] [PubMed]
| Publisher’s Note: MDPI stays neutral with regard to jurisdictional claims in published maps and institutional affiliations. |
© 2022 by the authors. Licensee MDPI, Basel, Switzerland. This article is an open access article distributed under the terms and conditions of the Creative Commons Attribution (CC BY) license (https://creativecommons.org/licenses/by/4.0/).


 ,
, 
