

Smart Charging for Electric Car-Sharing Fleets Based on Charging Duration Forecasting and Planning

 ,
,  ,
,  ,
,  ,
,  and
and 
Abstract
:1. Introduction
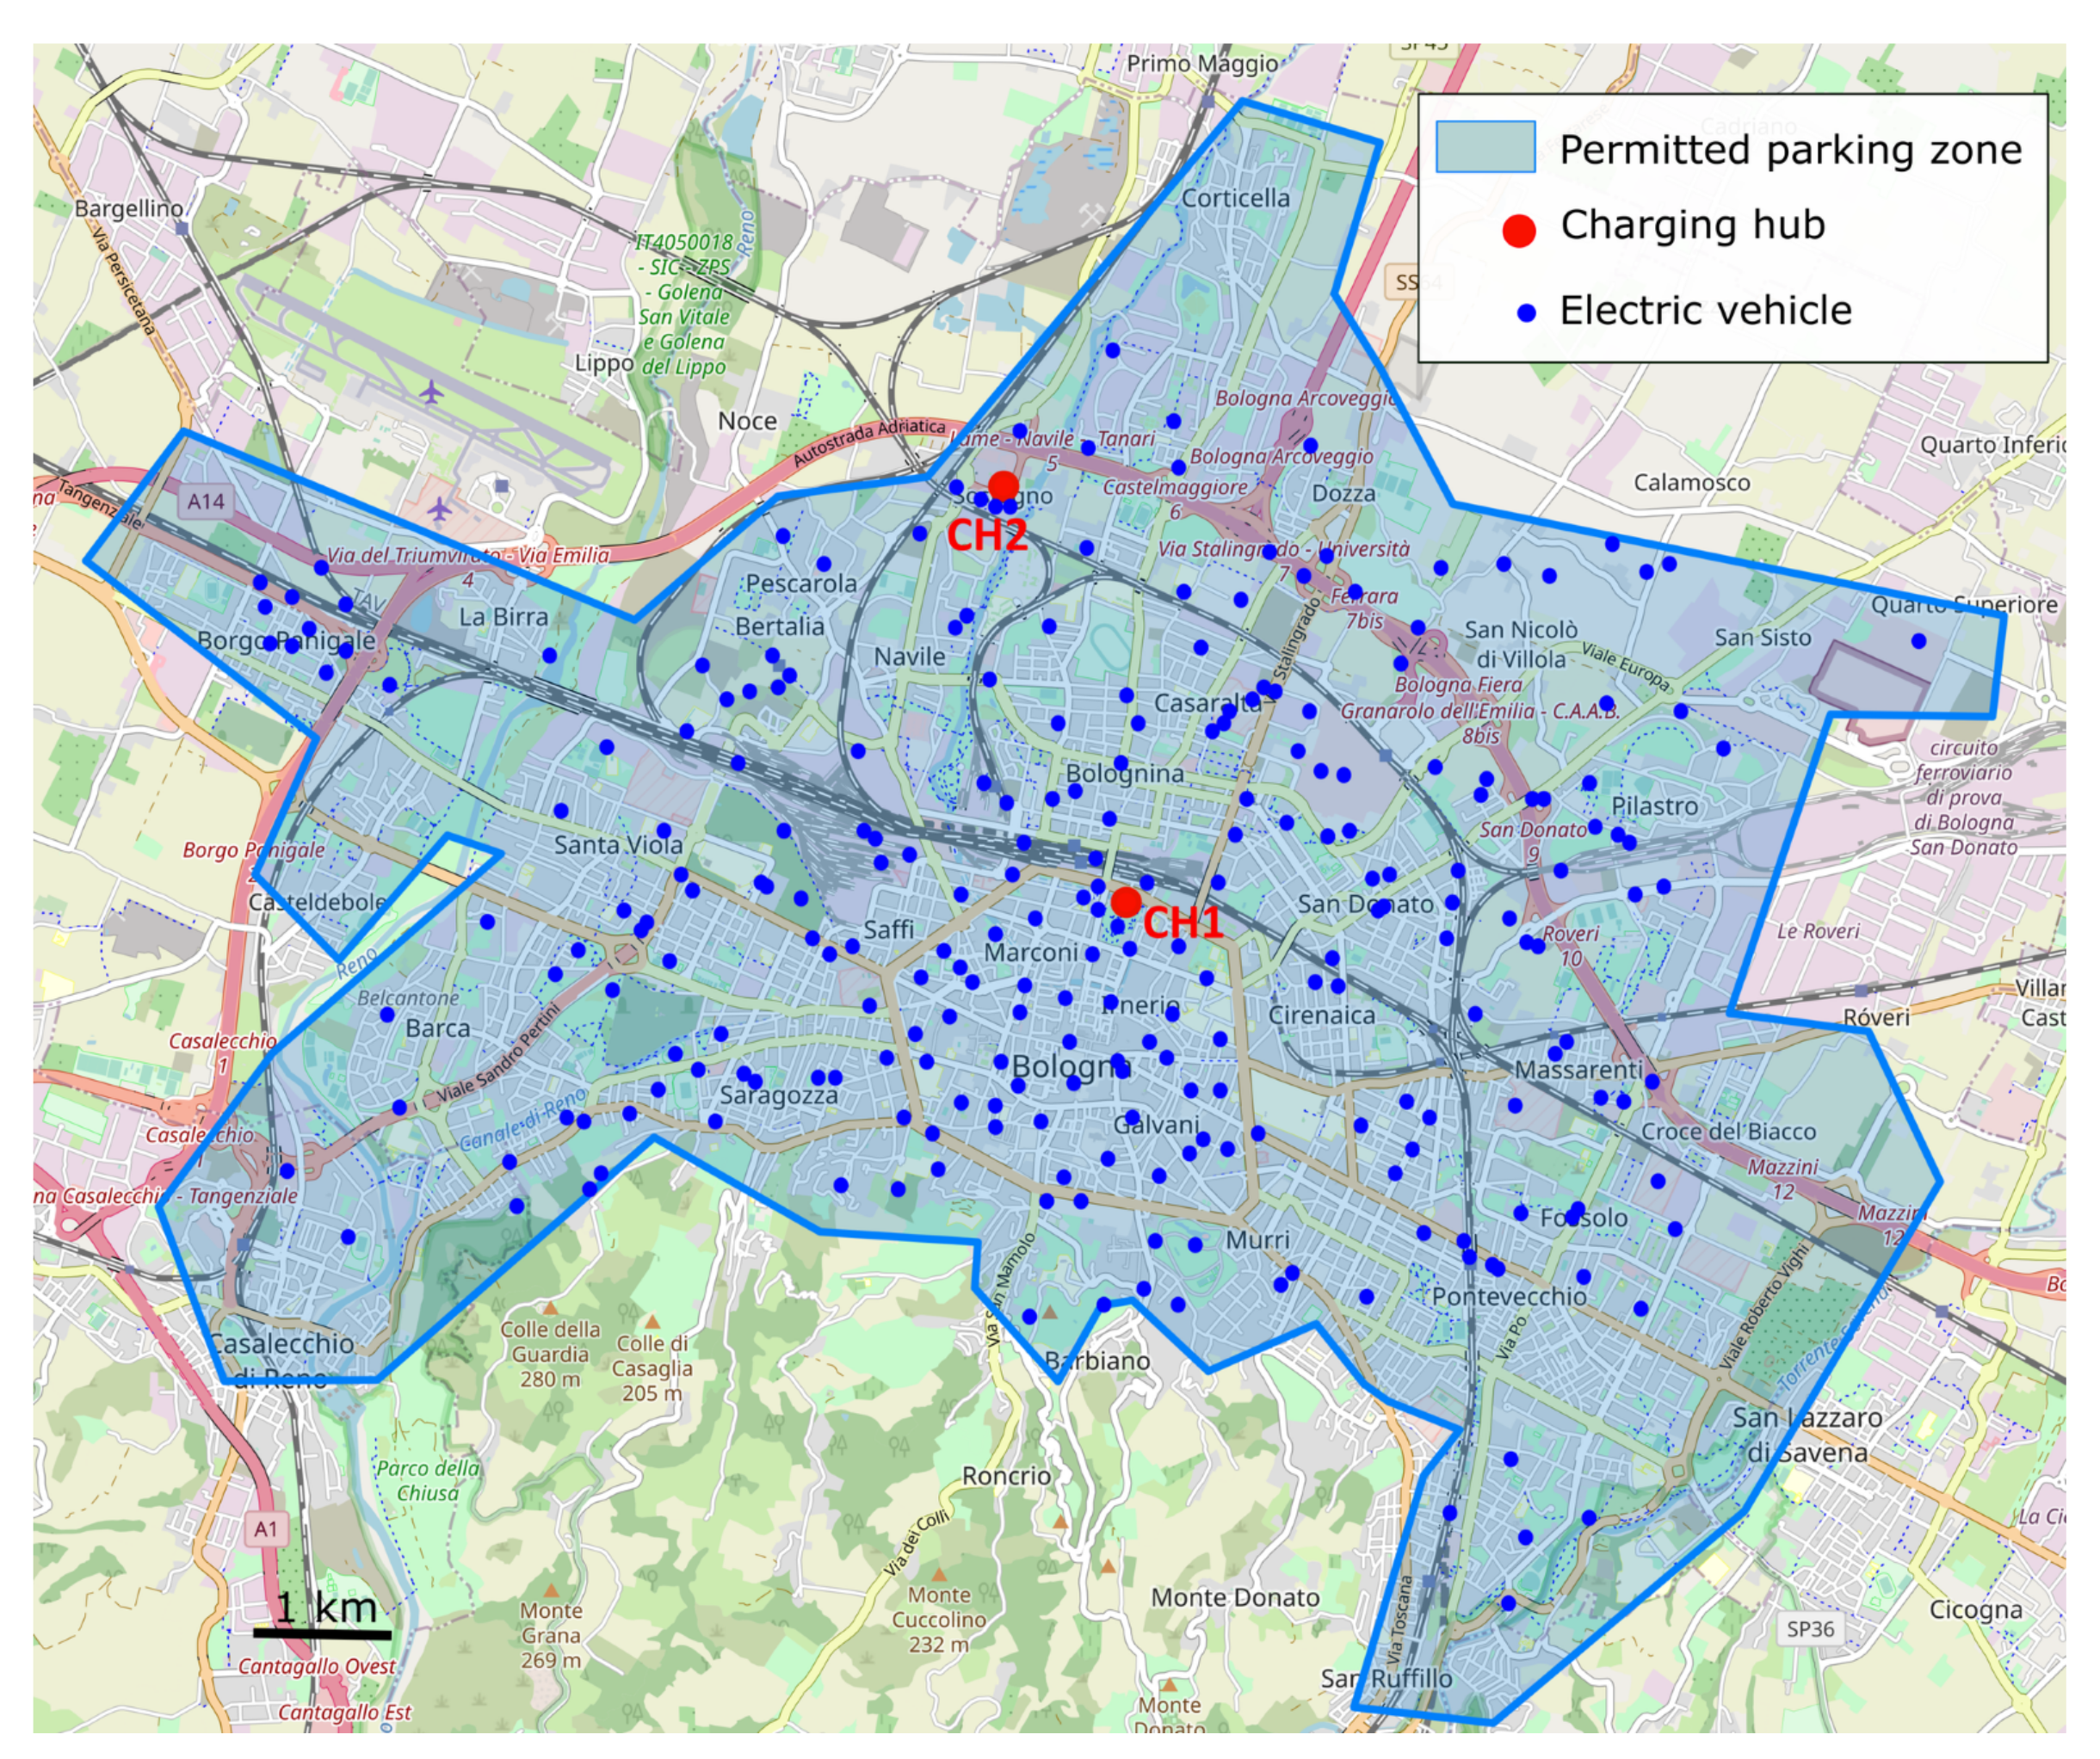
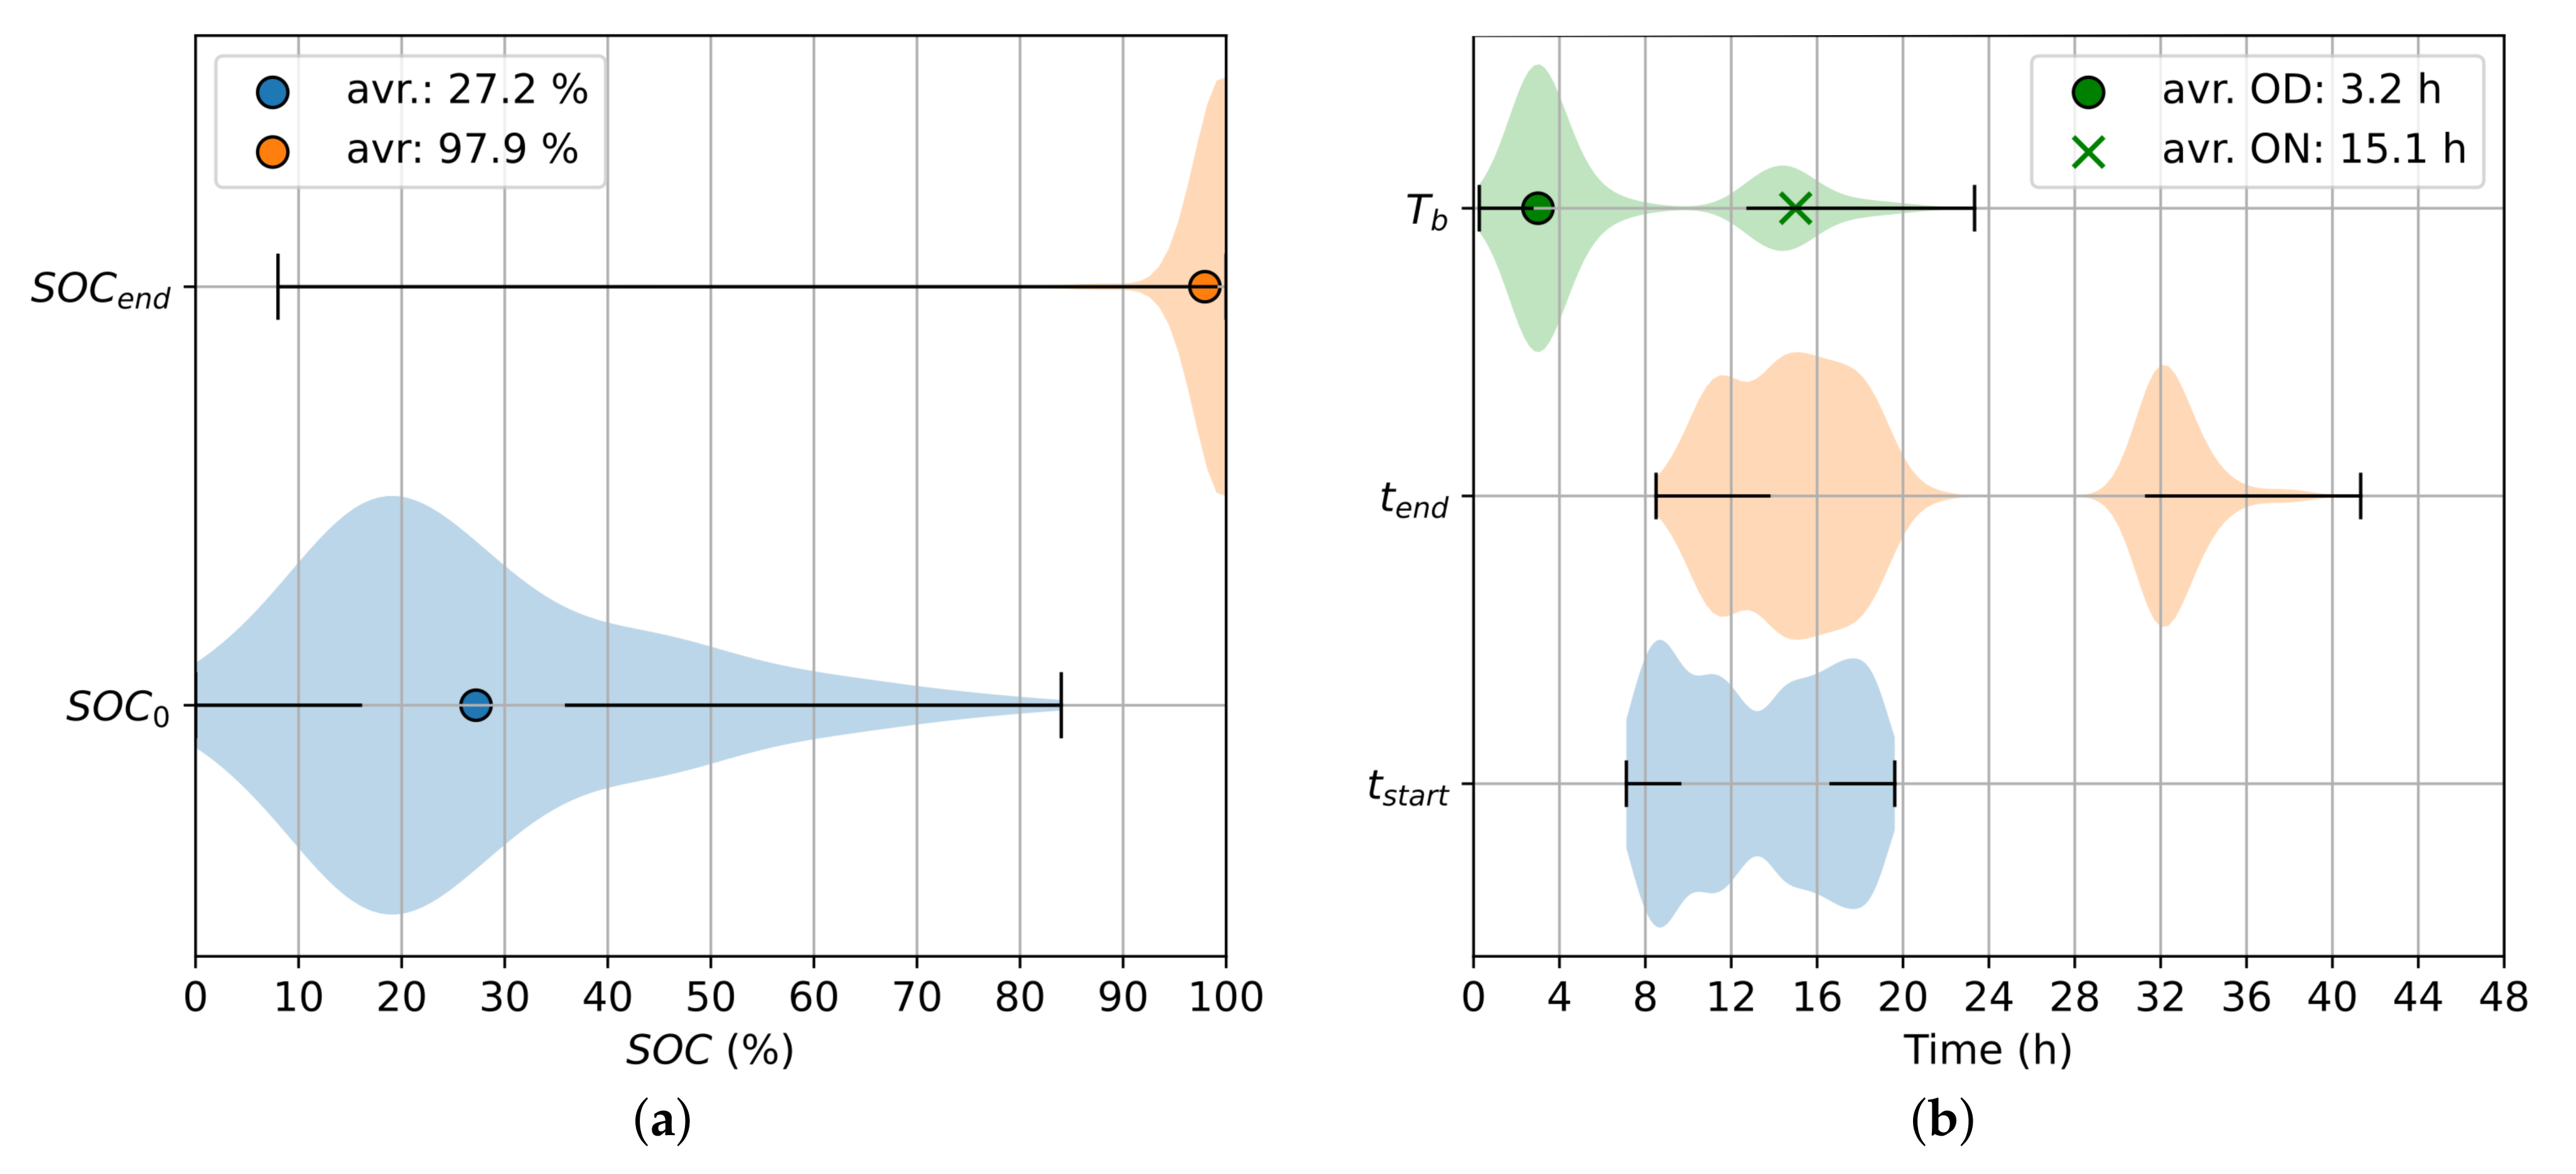
2. Description of the Reference Case Study
- The ID number of the EV;
- The EV model;
- The ID number of the charging point (CP) belonging to the CH;
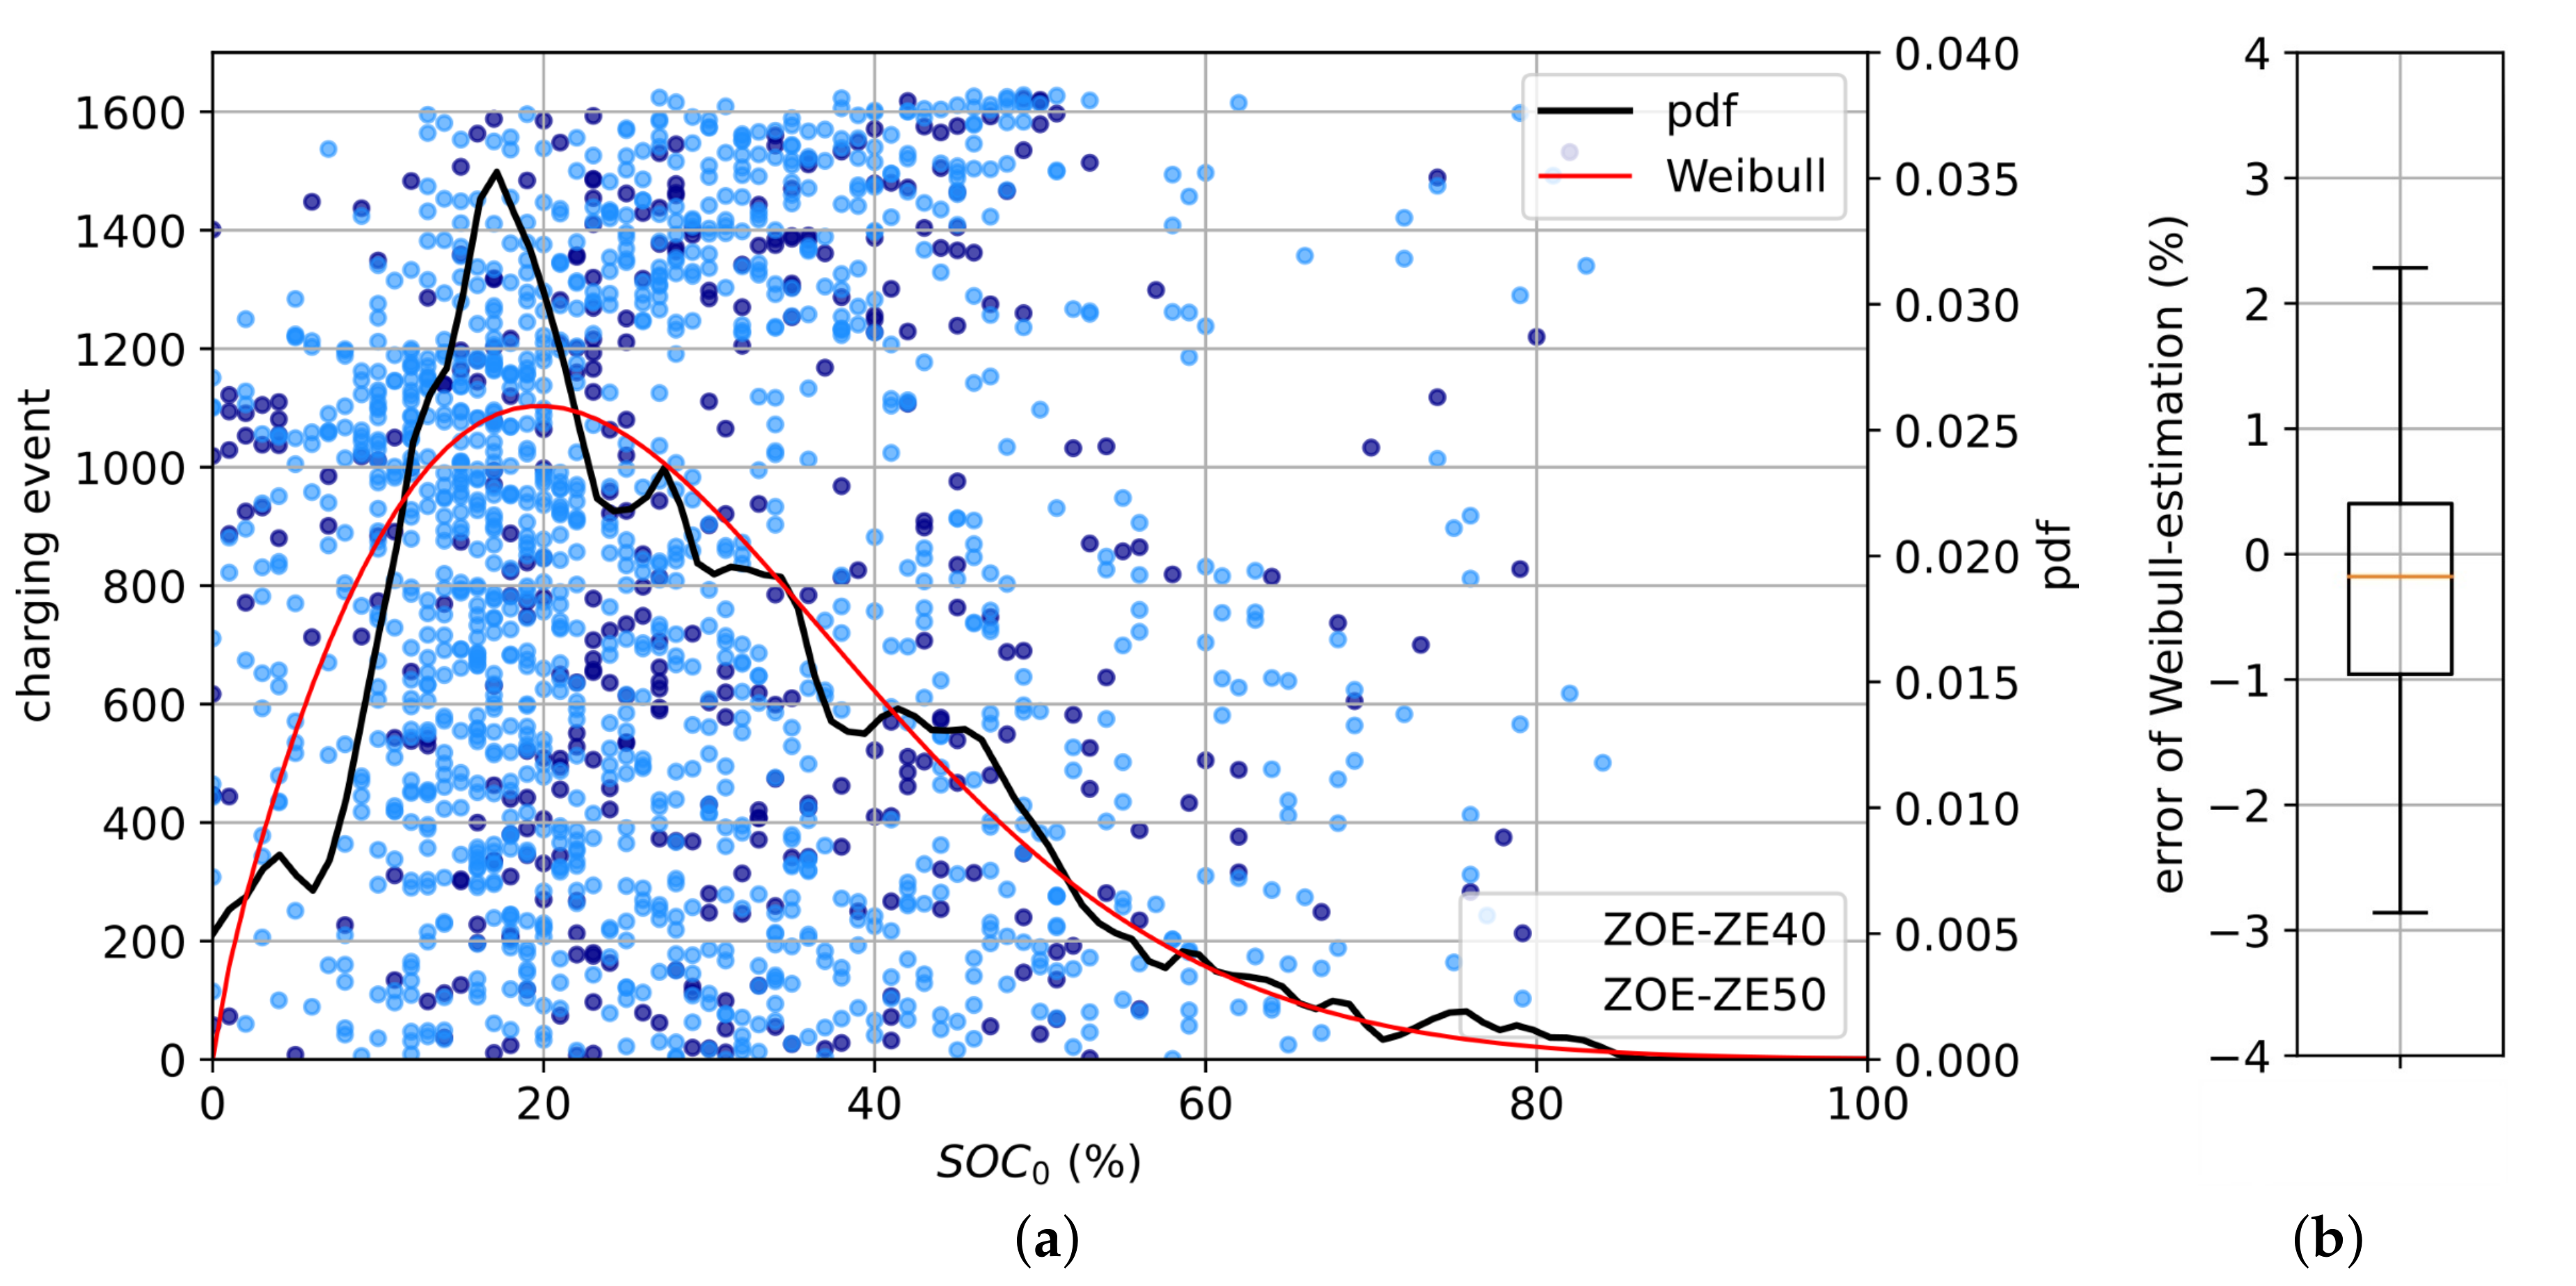
- The state of charge (pre-charging SOC);
- The state of charge at the end of the charging process, (post-charging SOC);
- The start timestamp of the charging process, (when the vehicle is connected to the charging point);
- The timestamp of the end-of-connection. (when the vehicle is disconnected from the charging point).
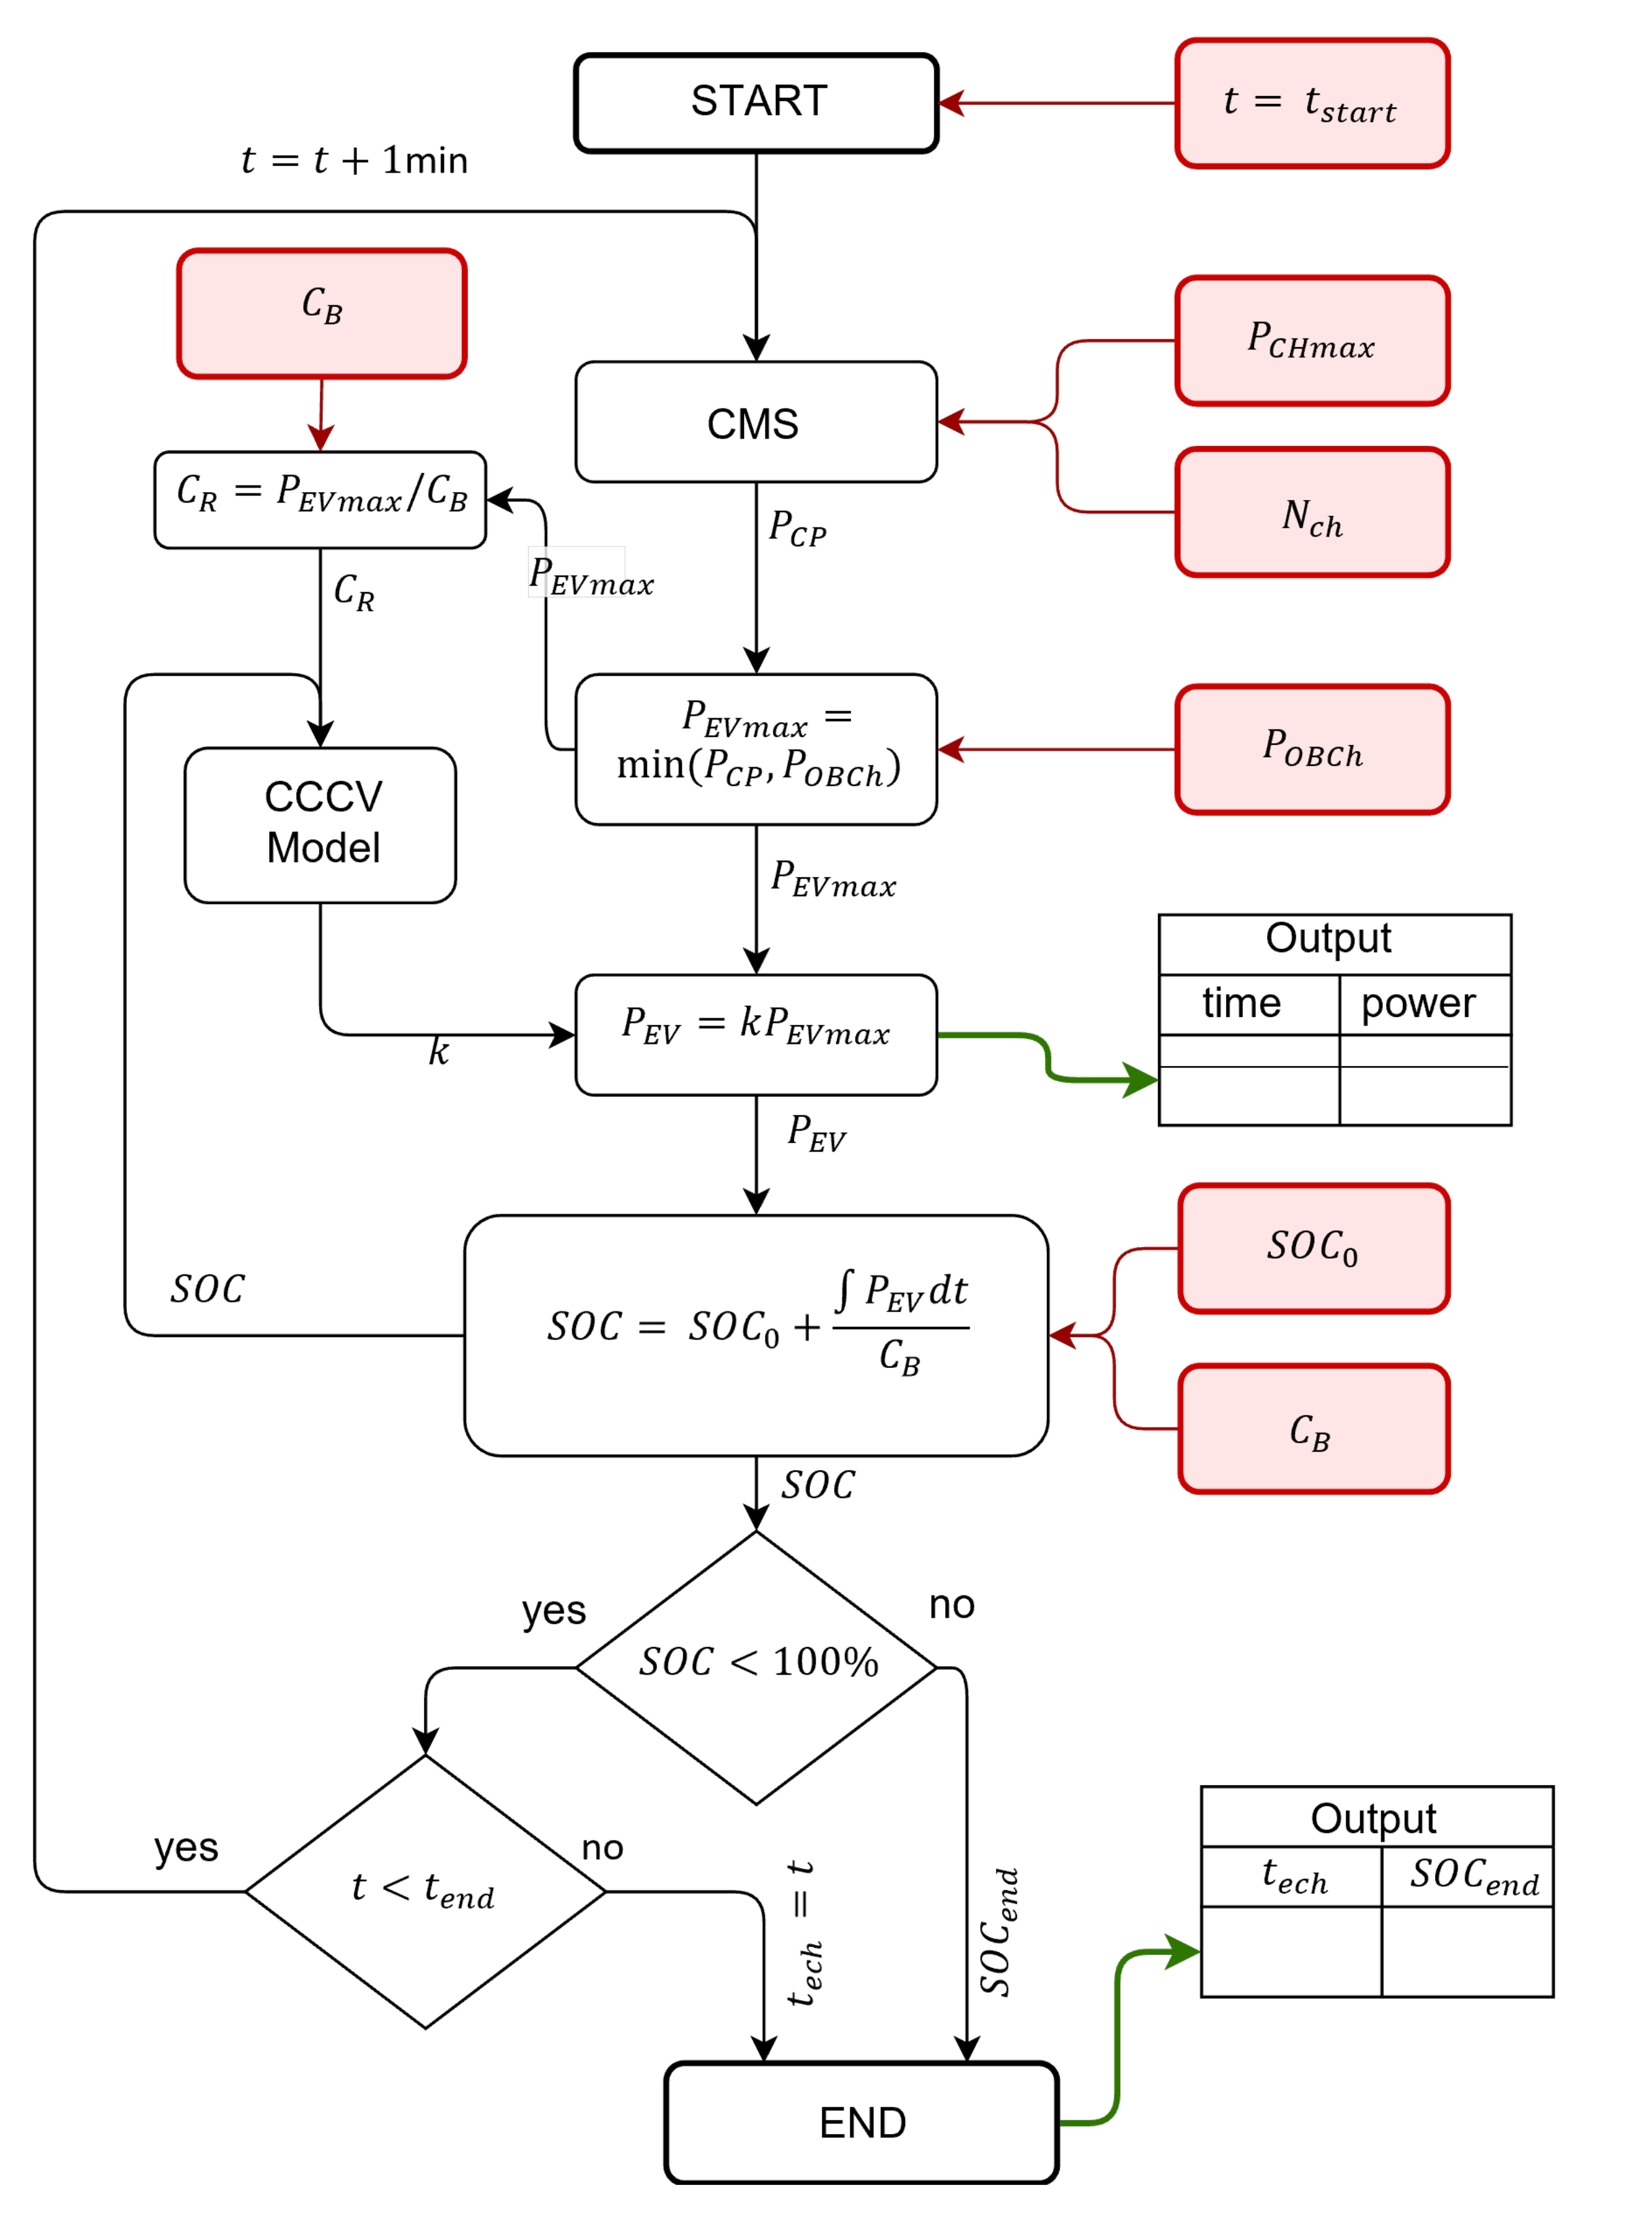
3. EV Charging Power Modeling and Management System
3.1. Current EV Charging Management System
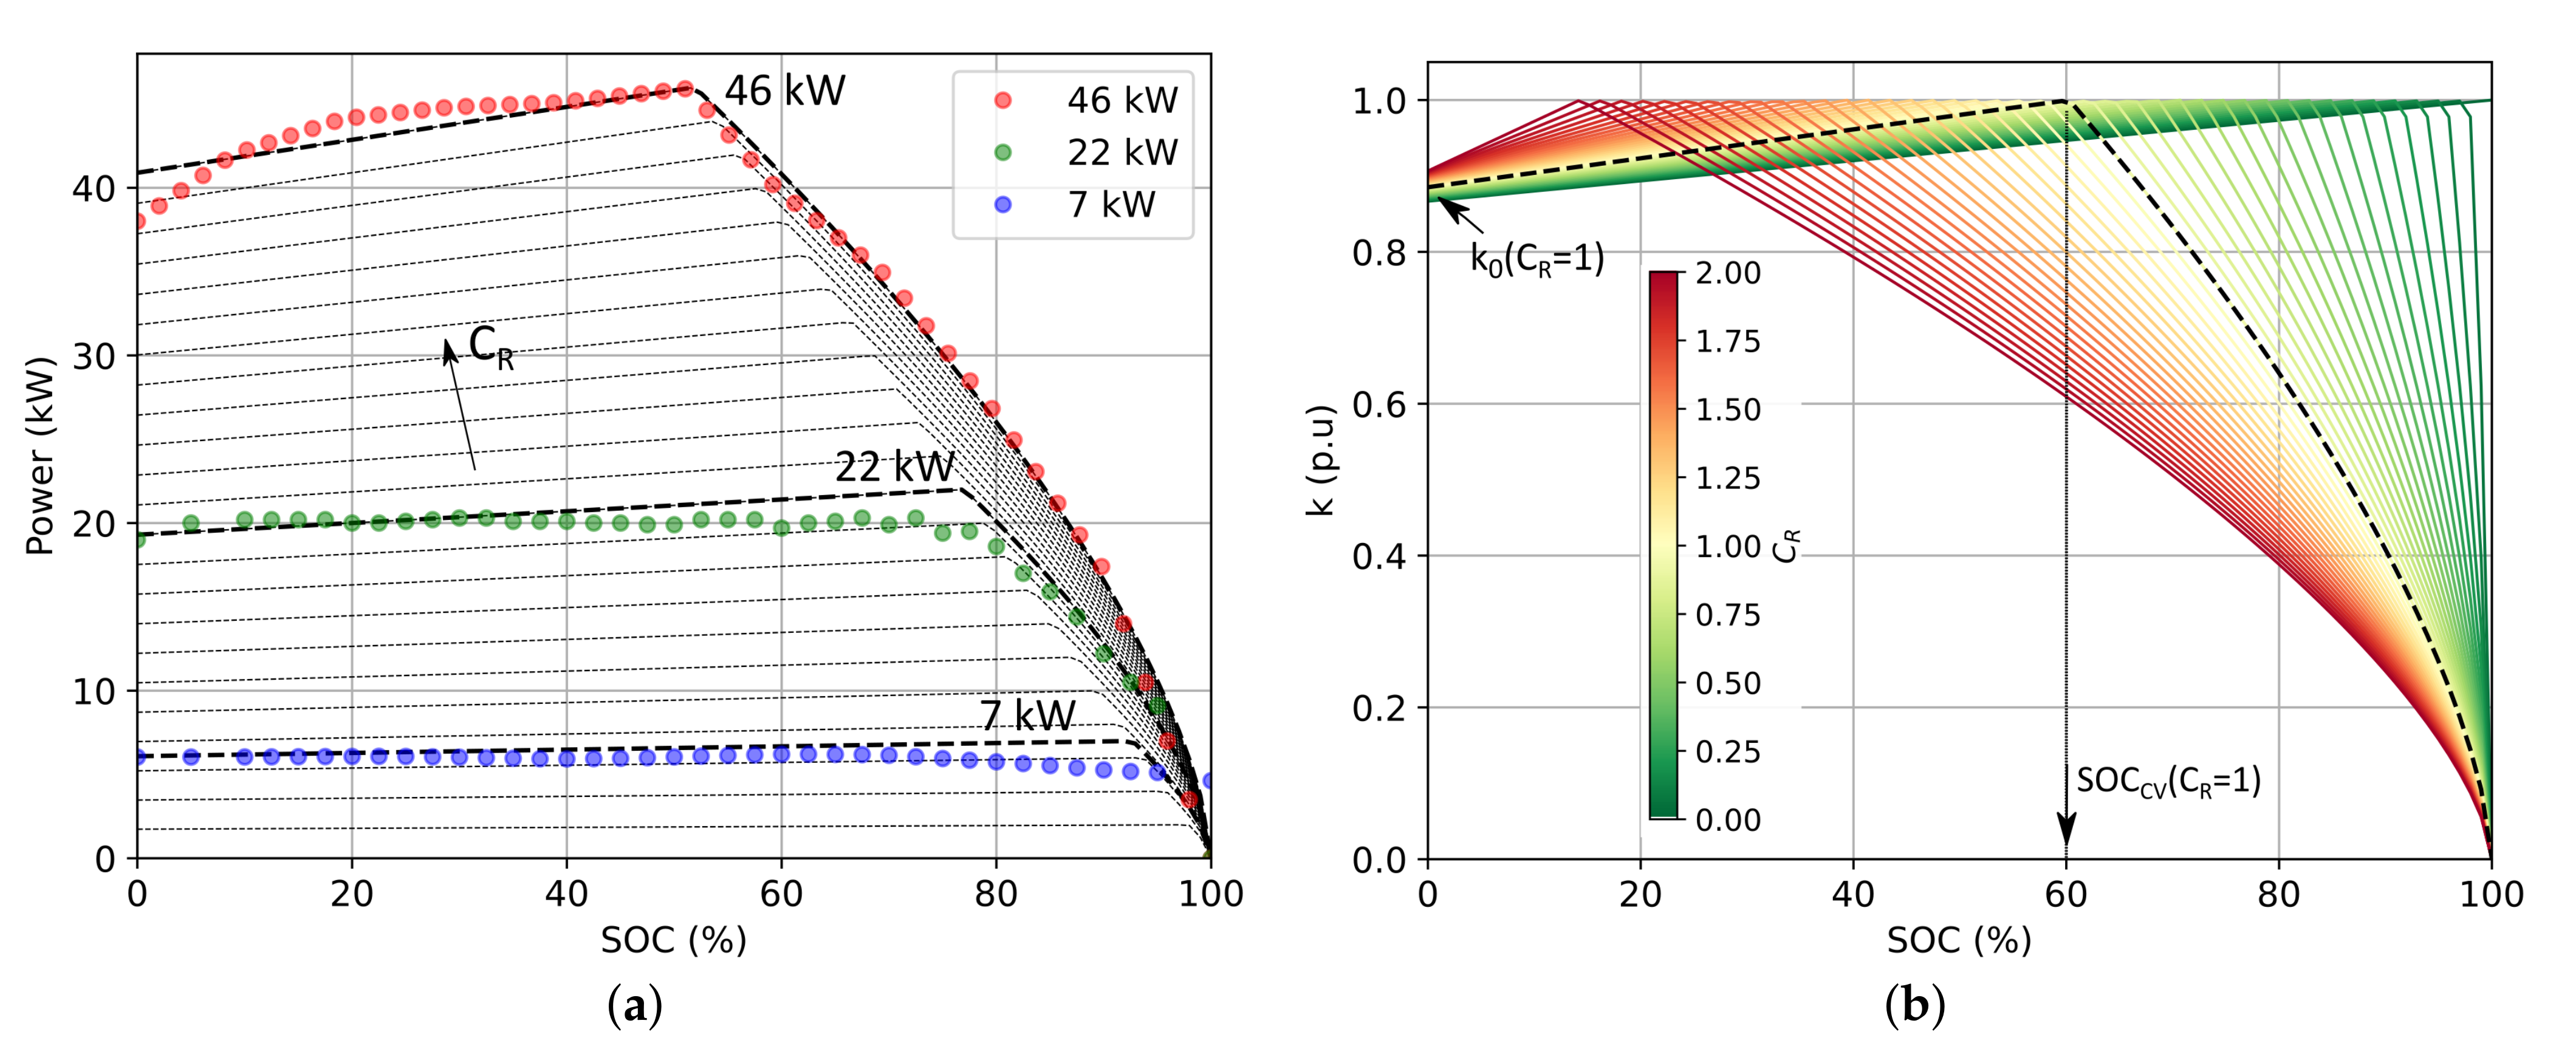
3.2. Battery Charging Behavioral Model
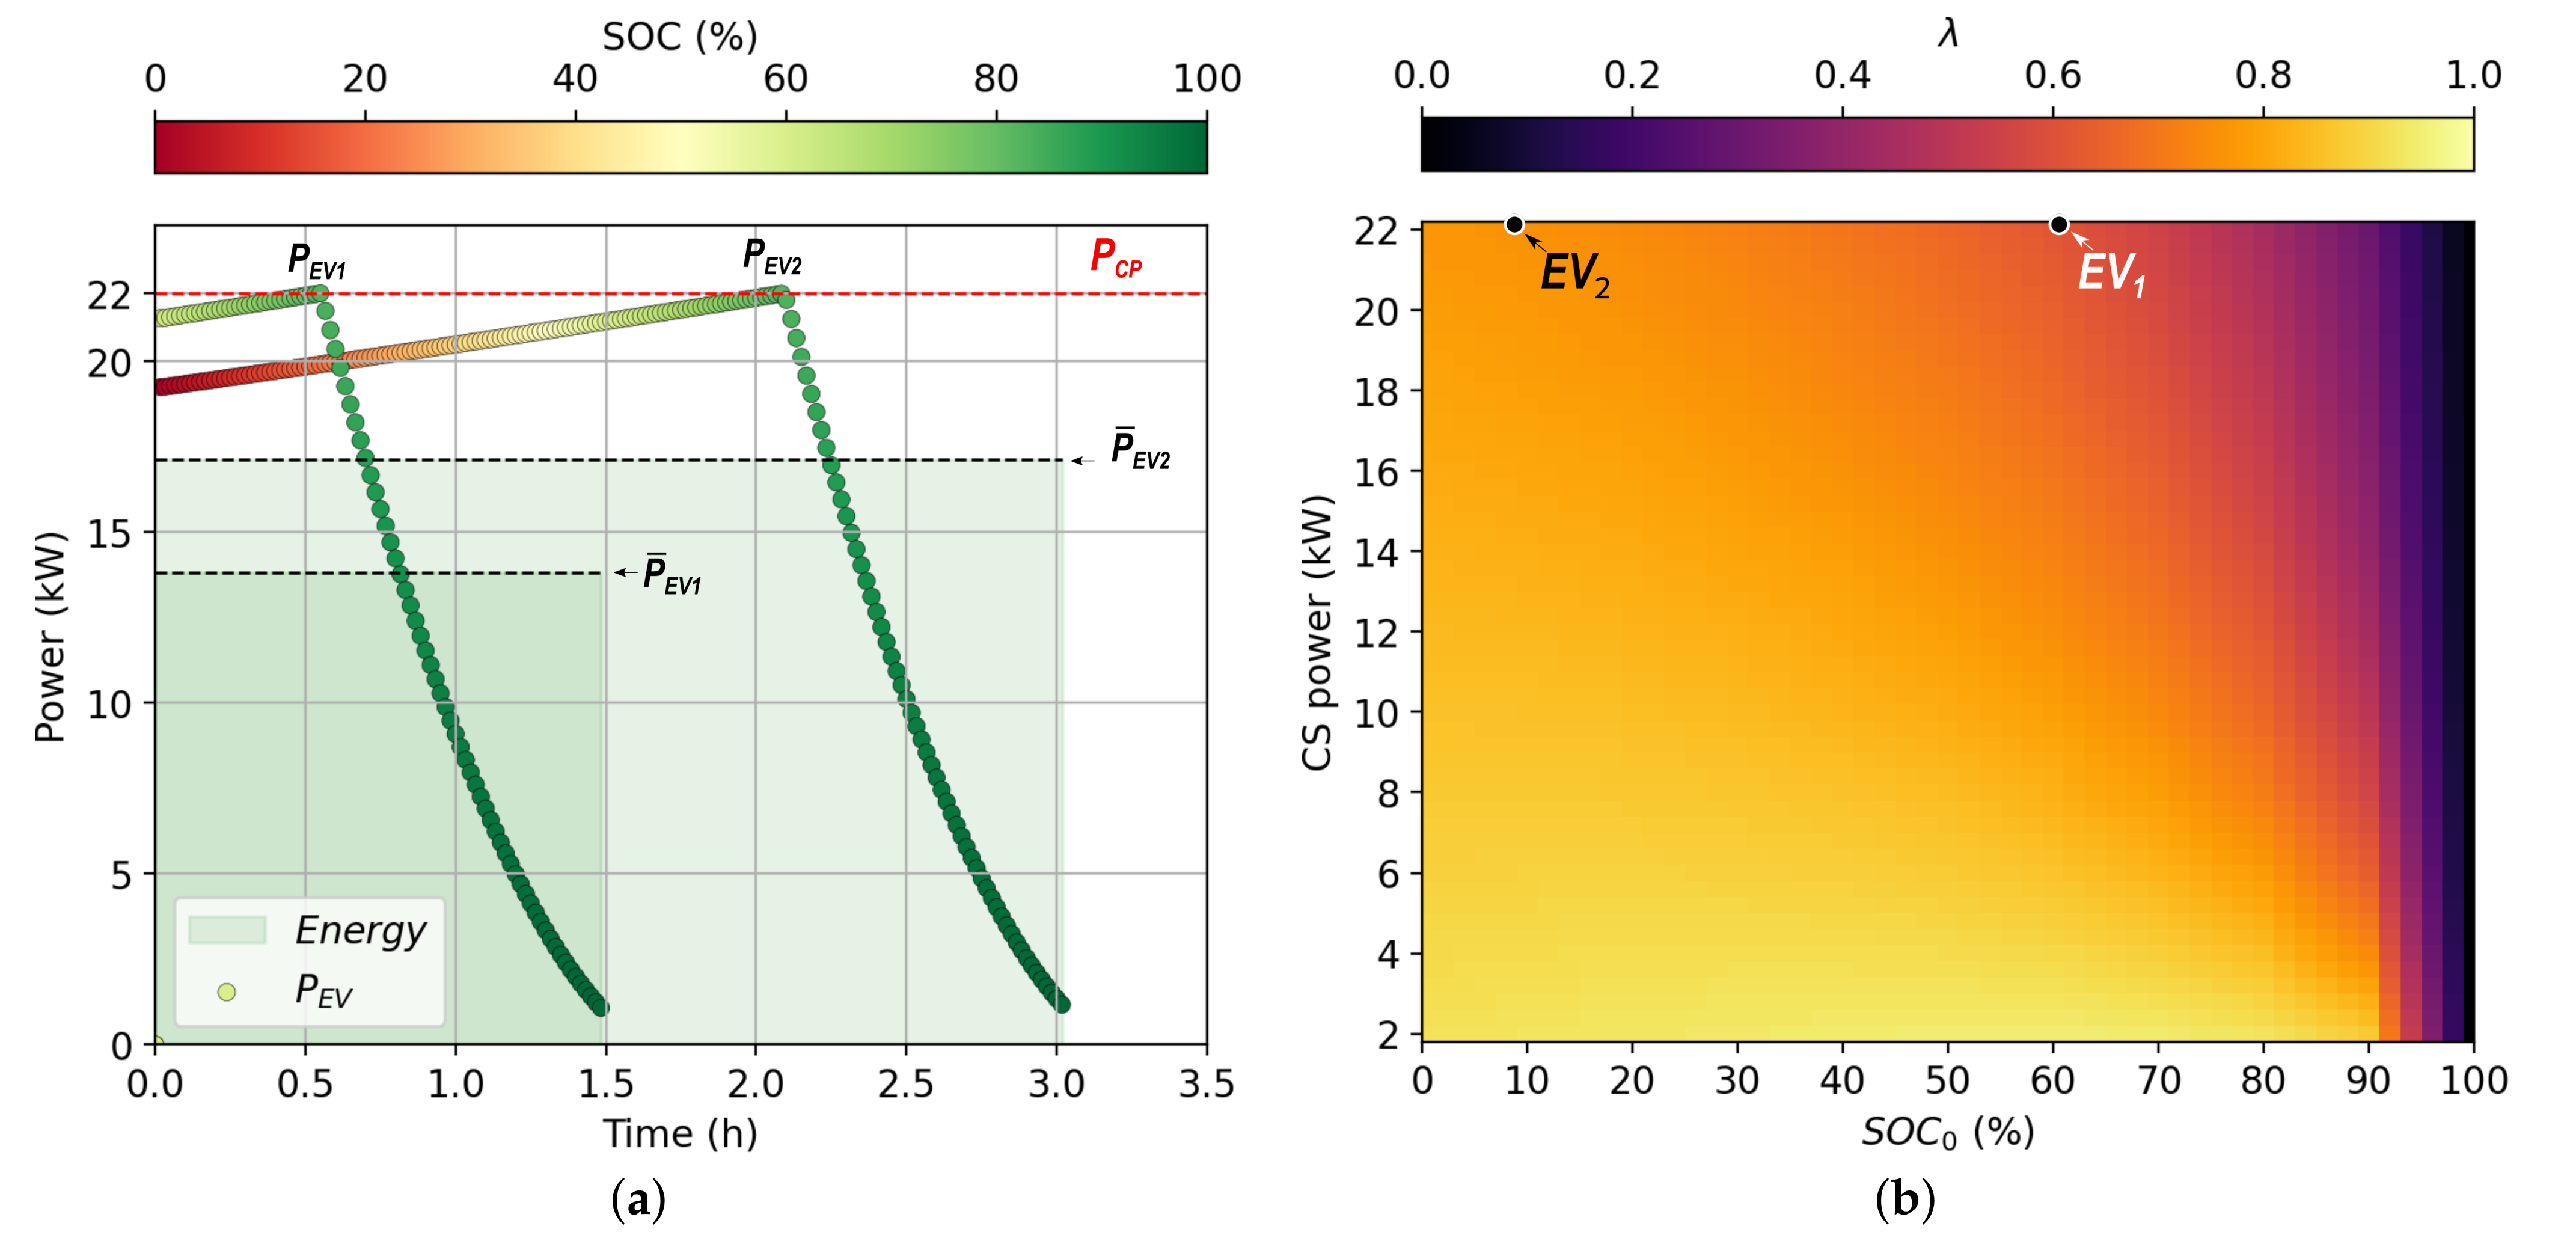
3.3. Charging Hub Power Flow Calculation
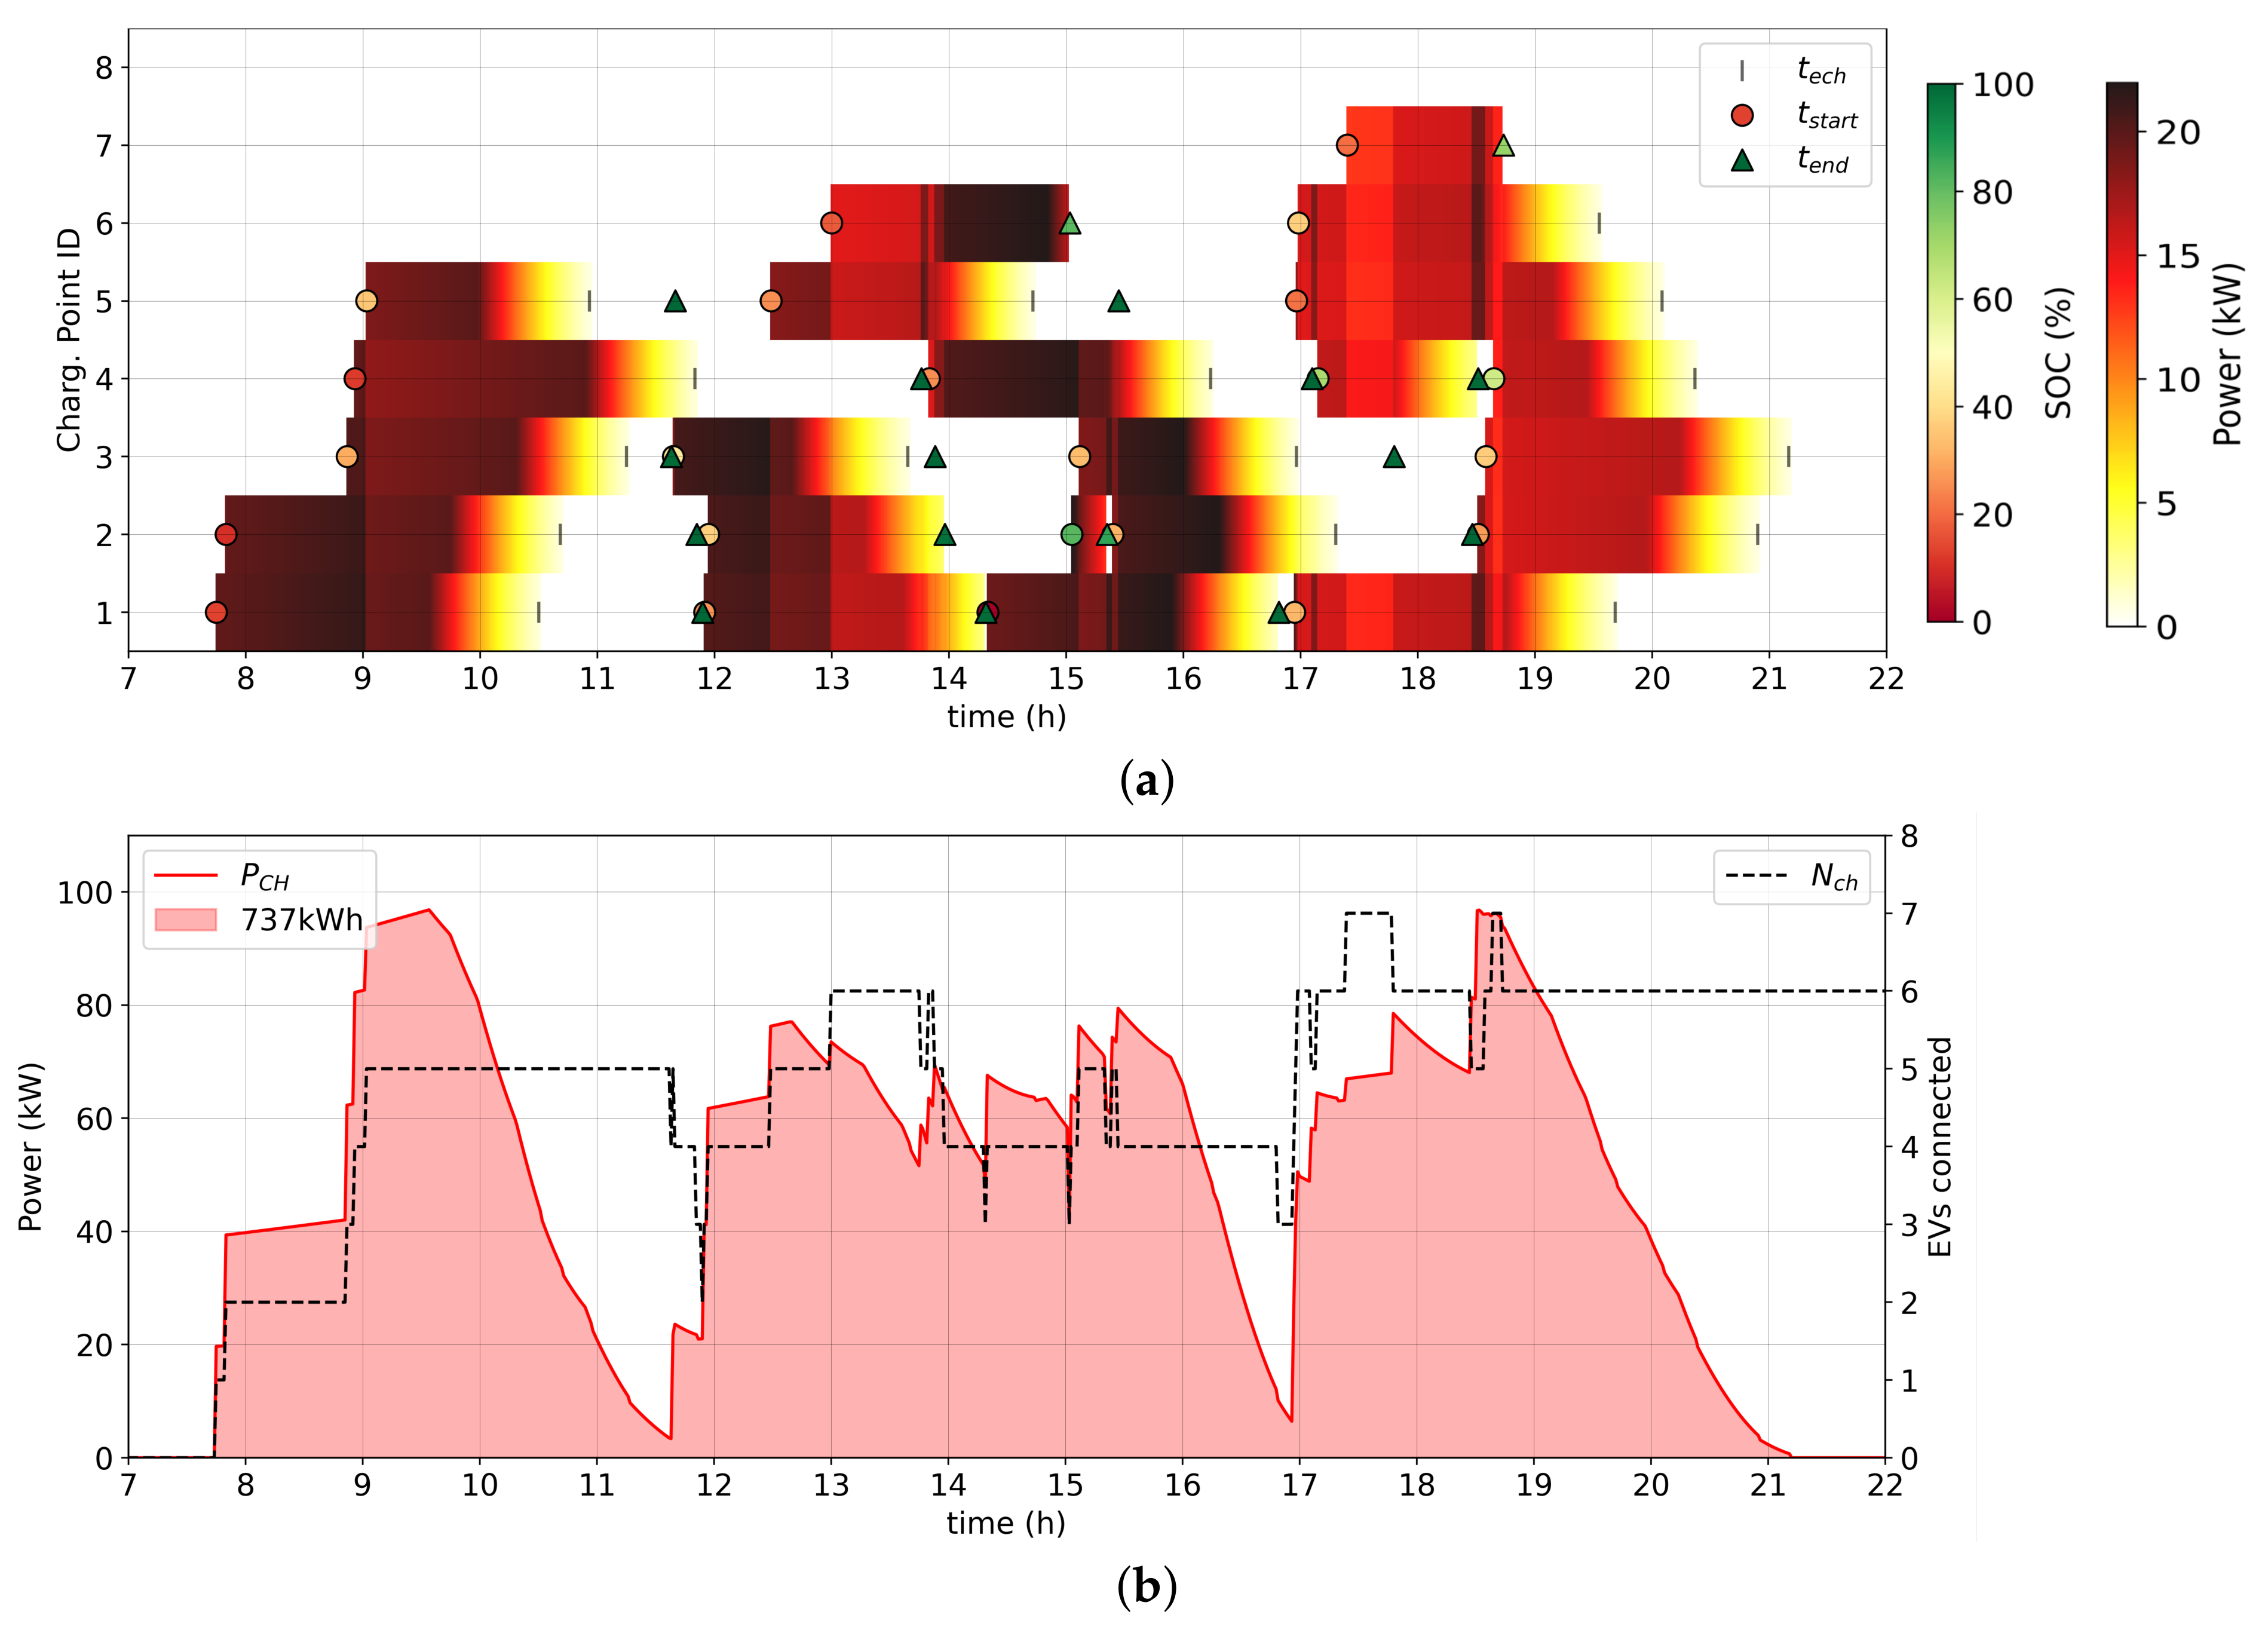
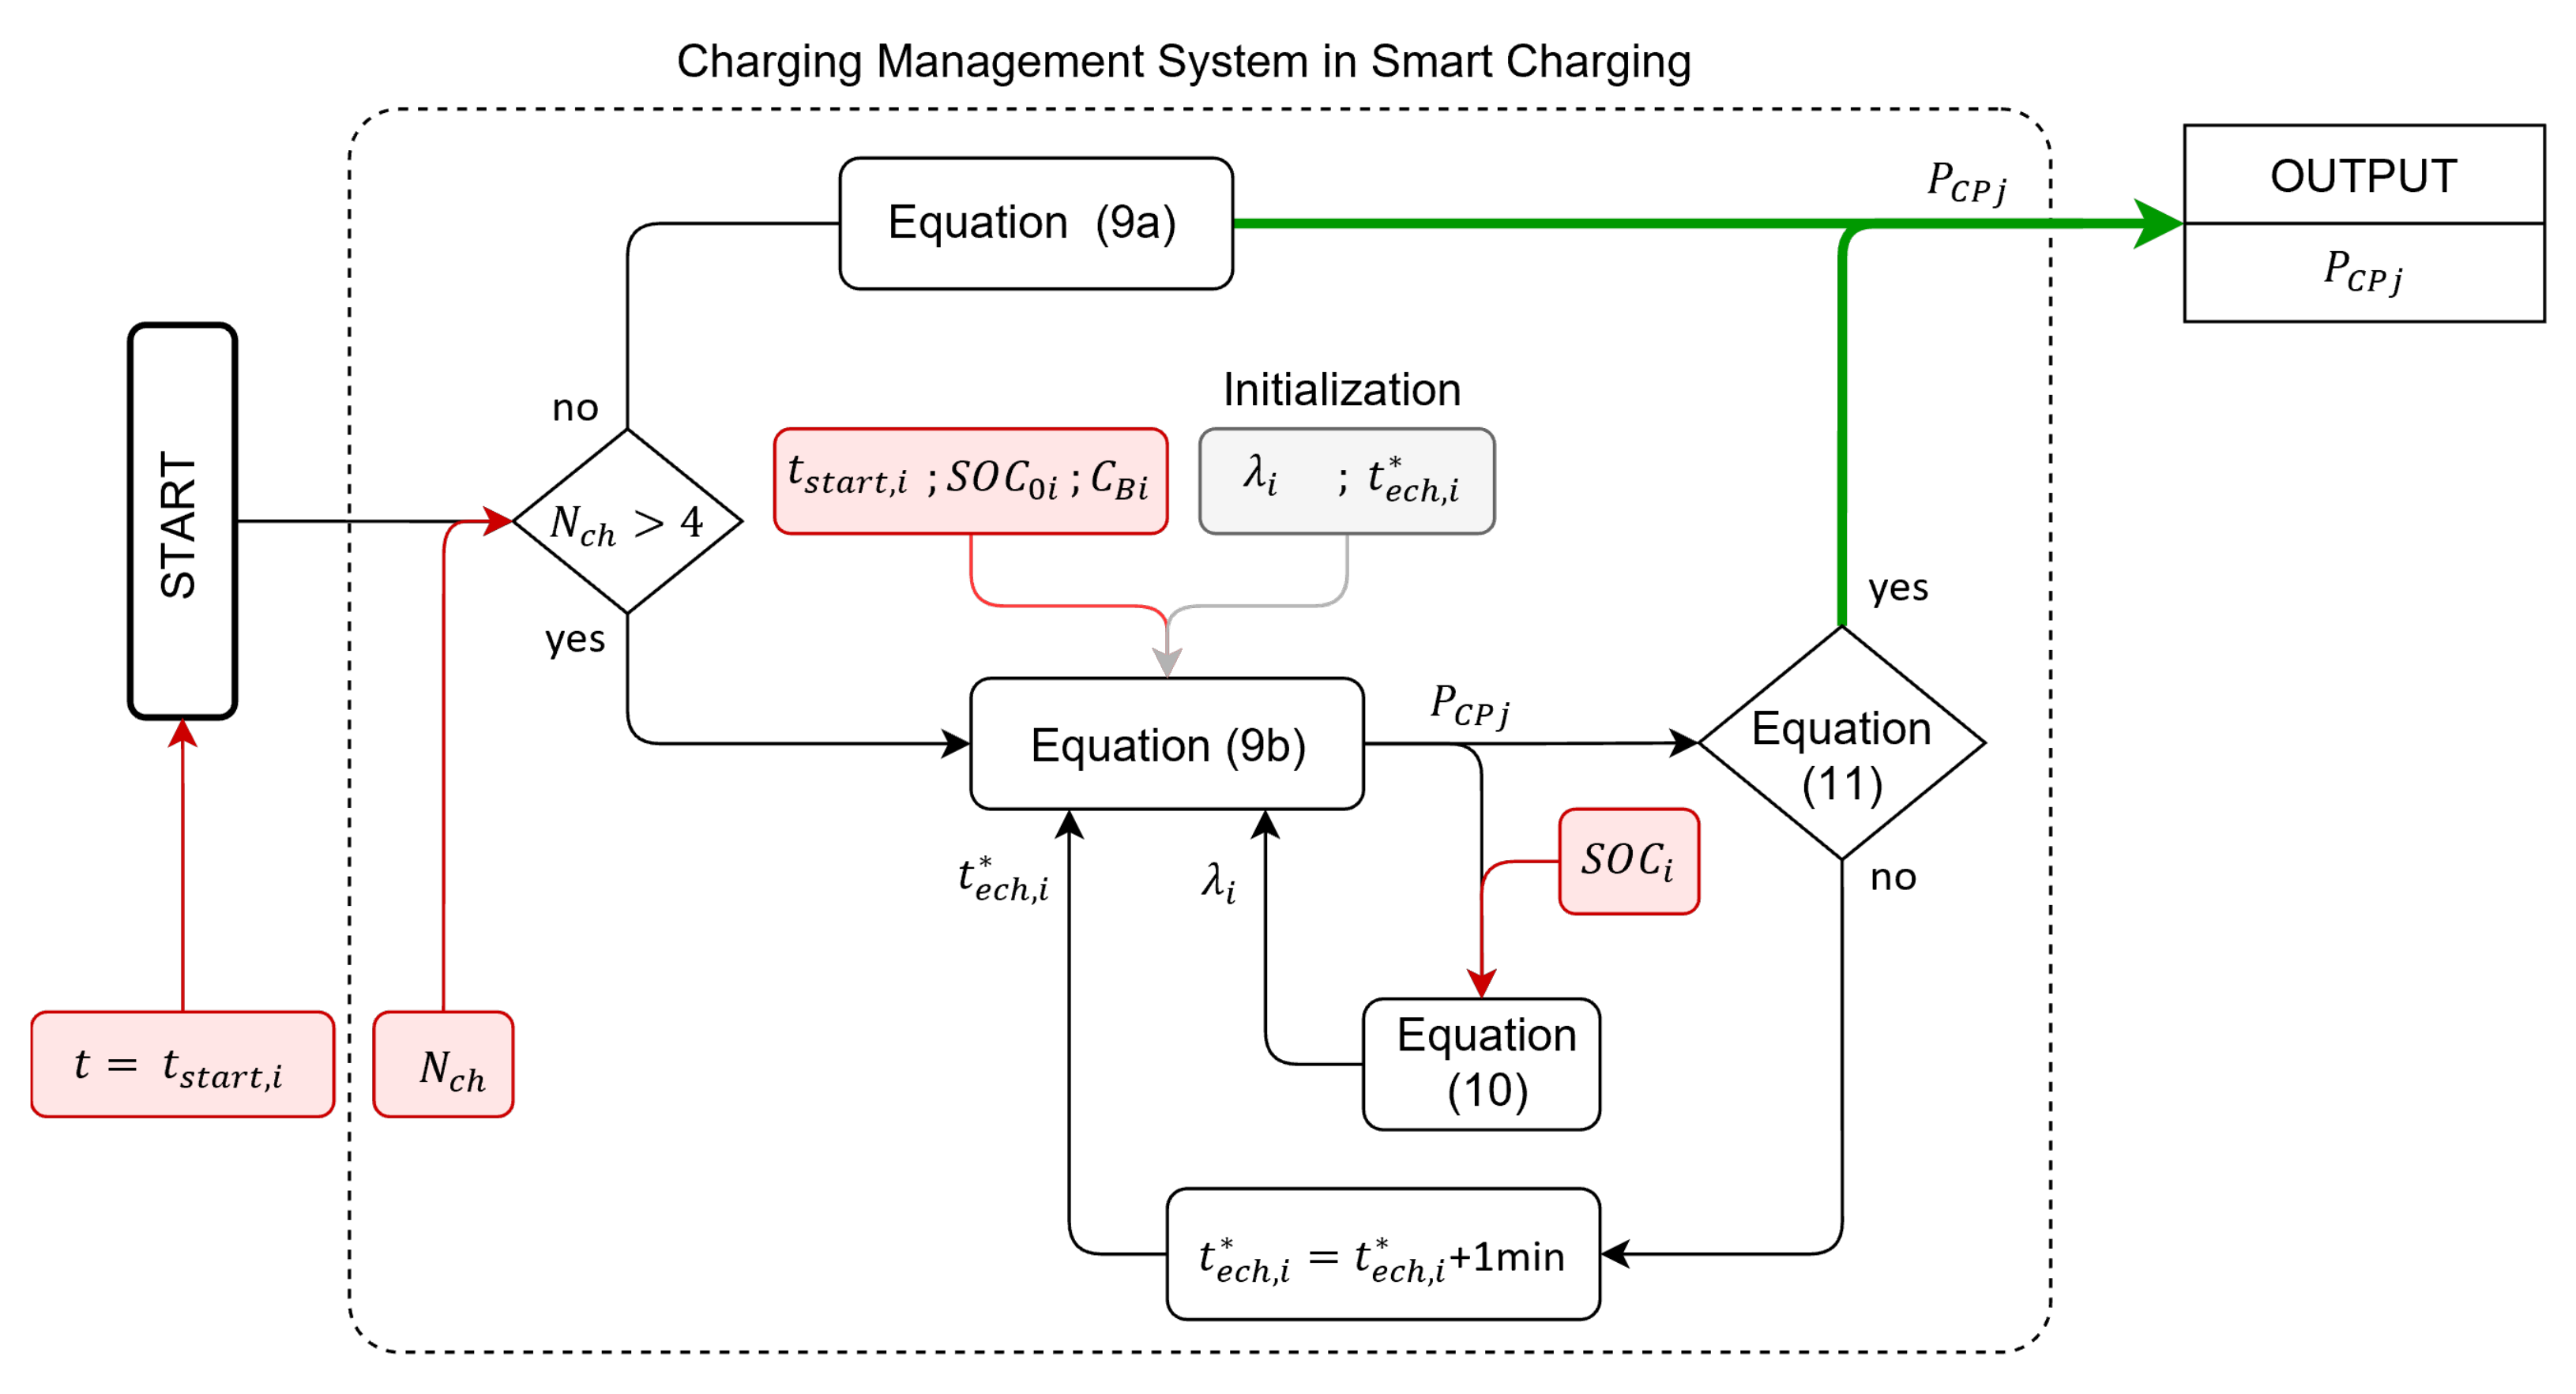
4. Smart Charging Method
5. Results
5.1. Simulations Settings
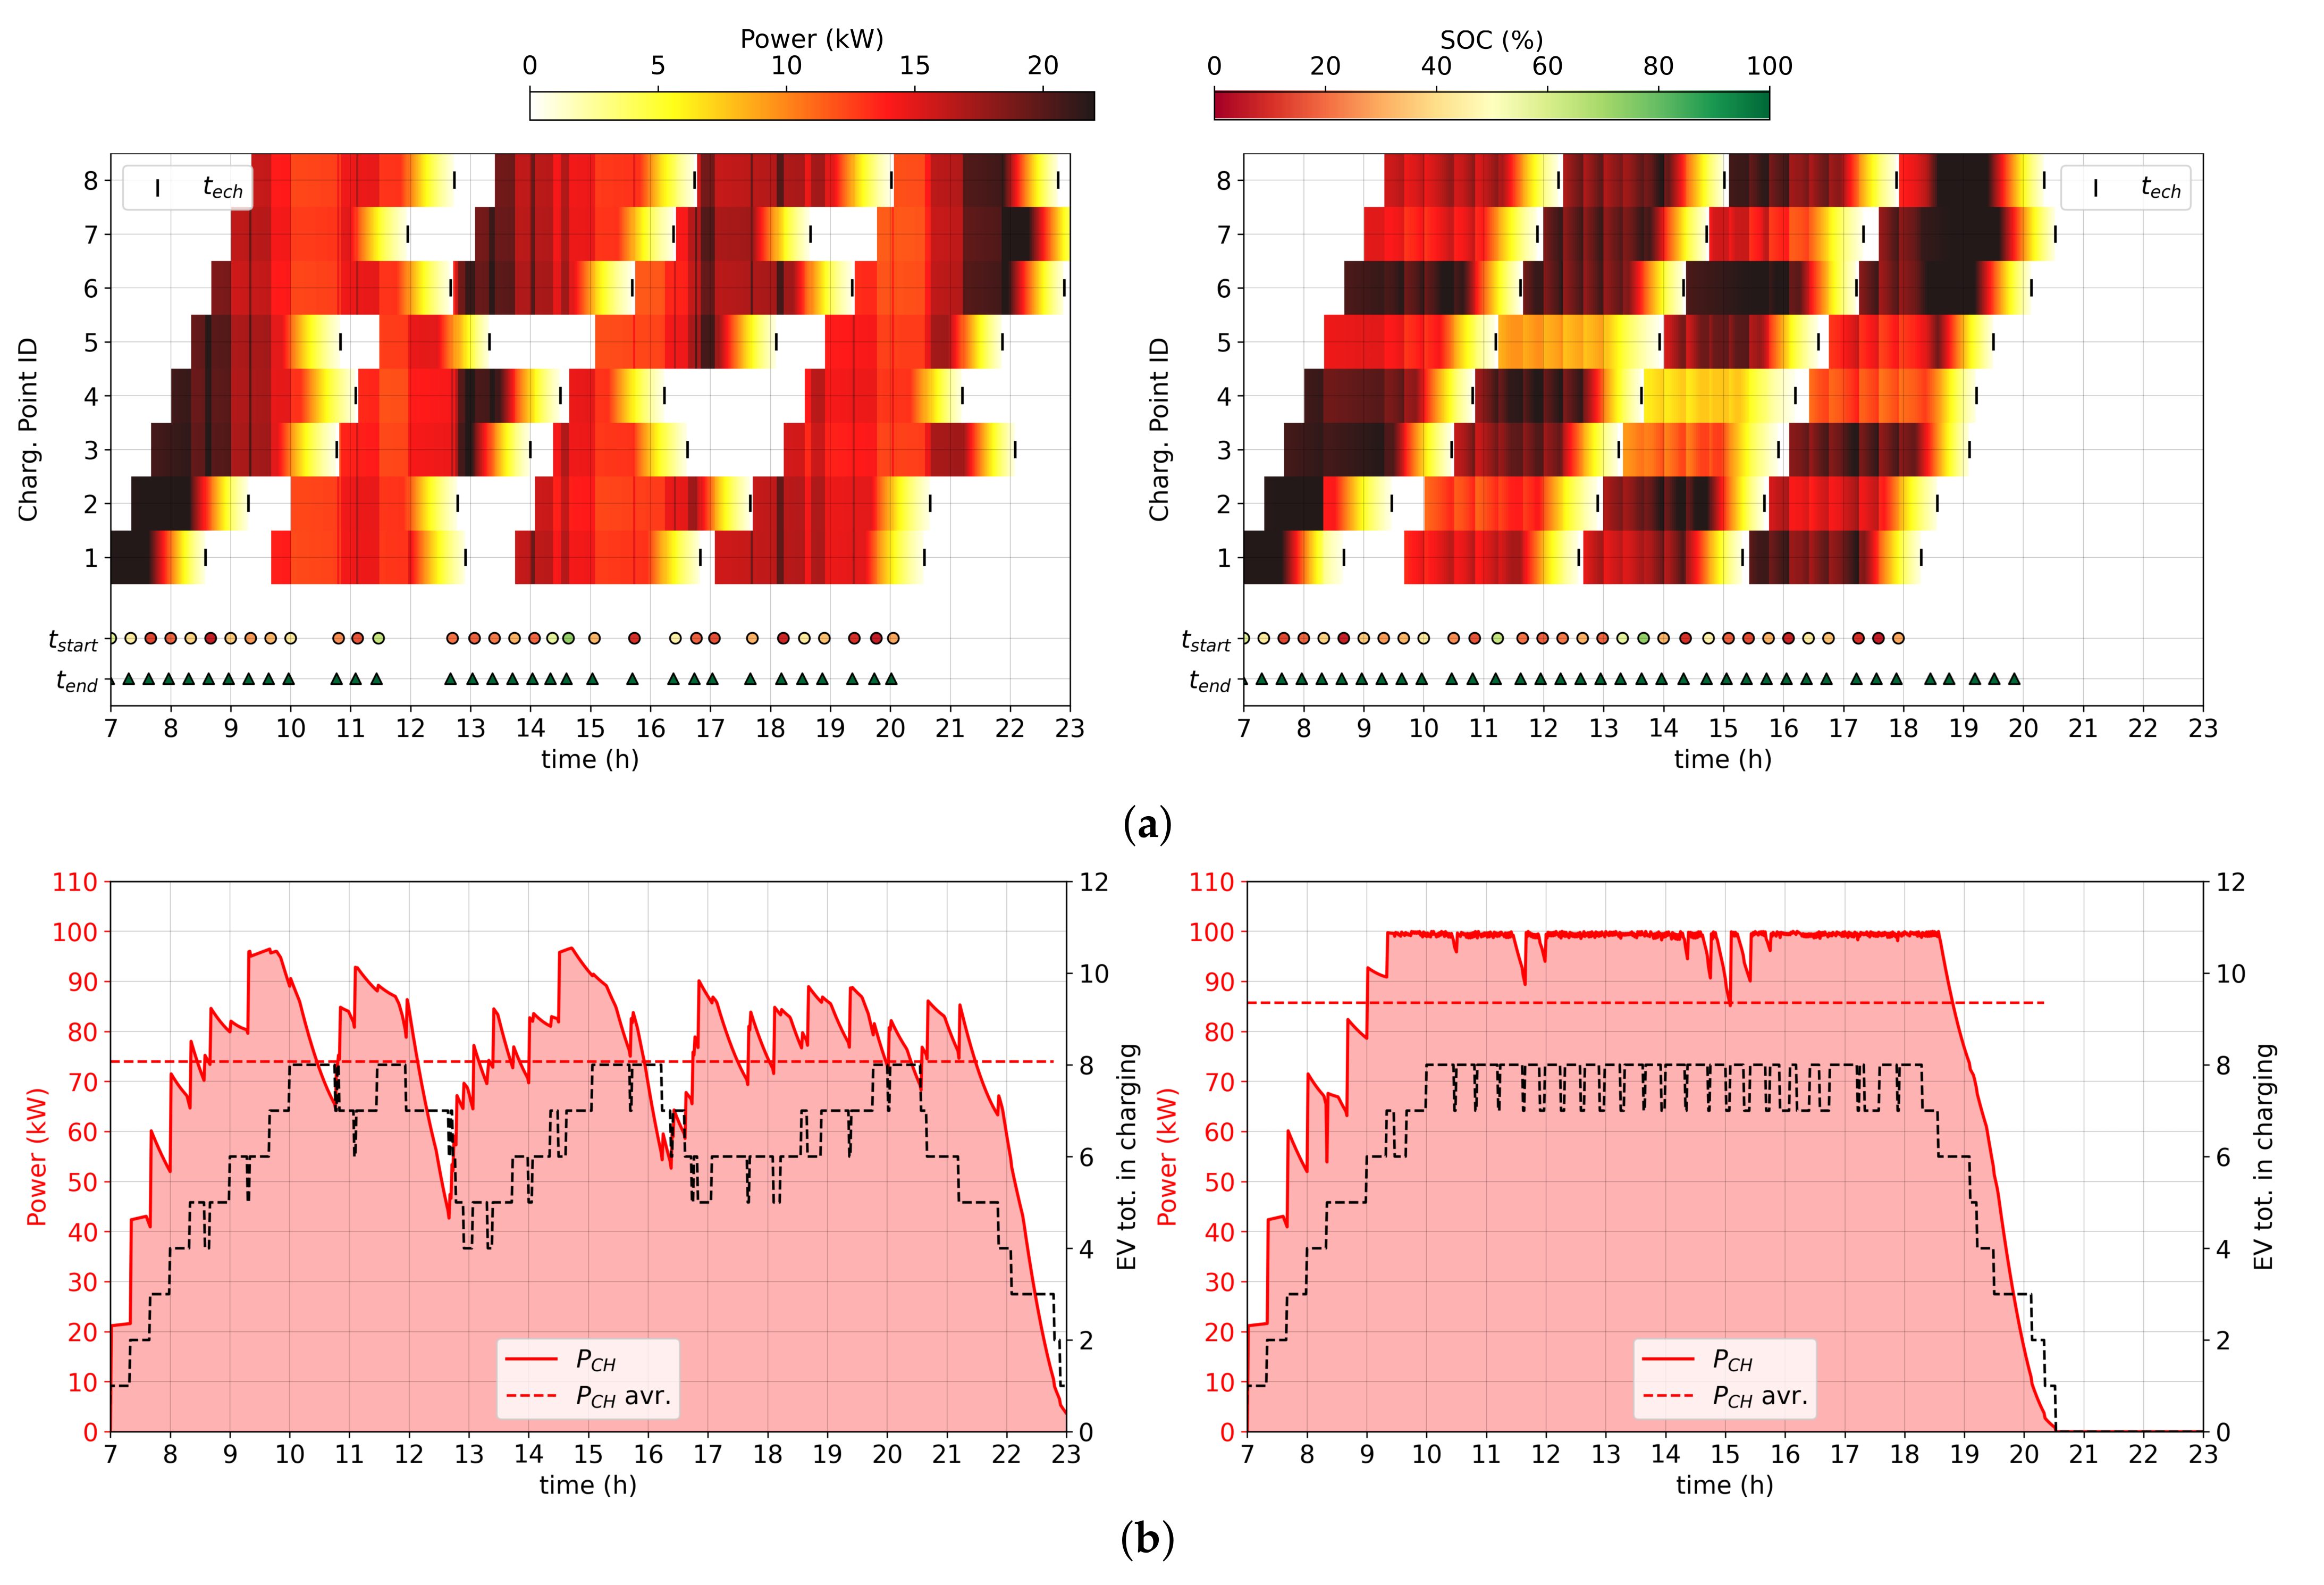
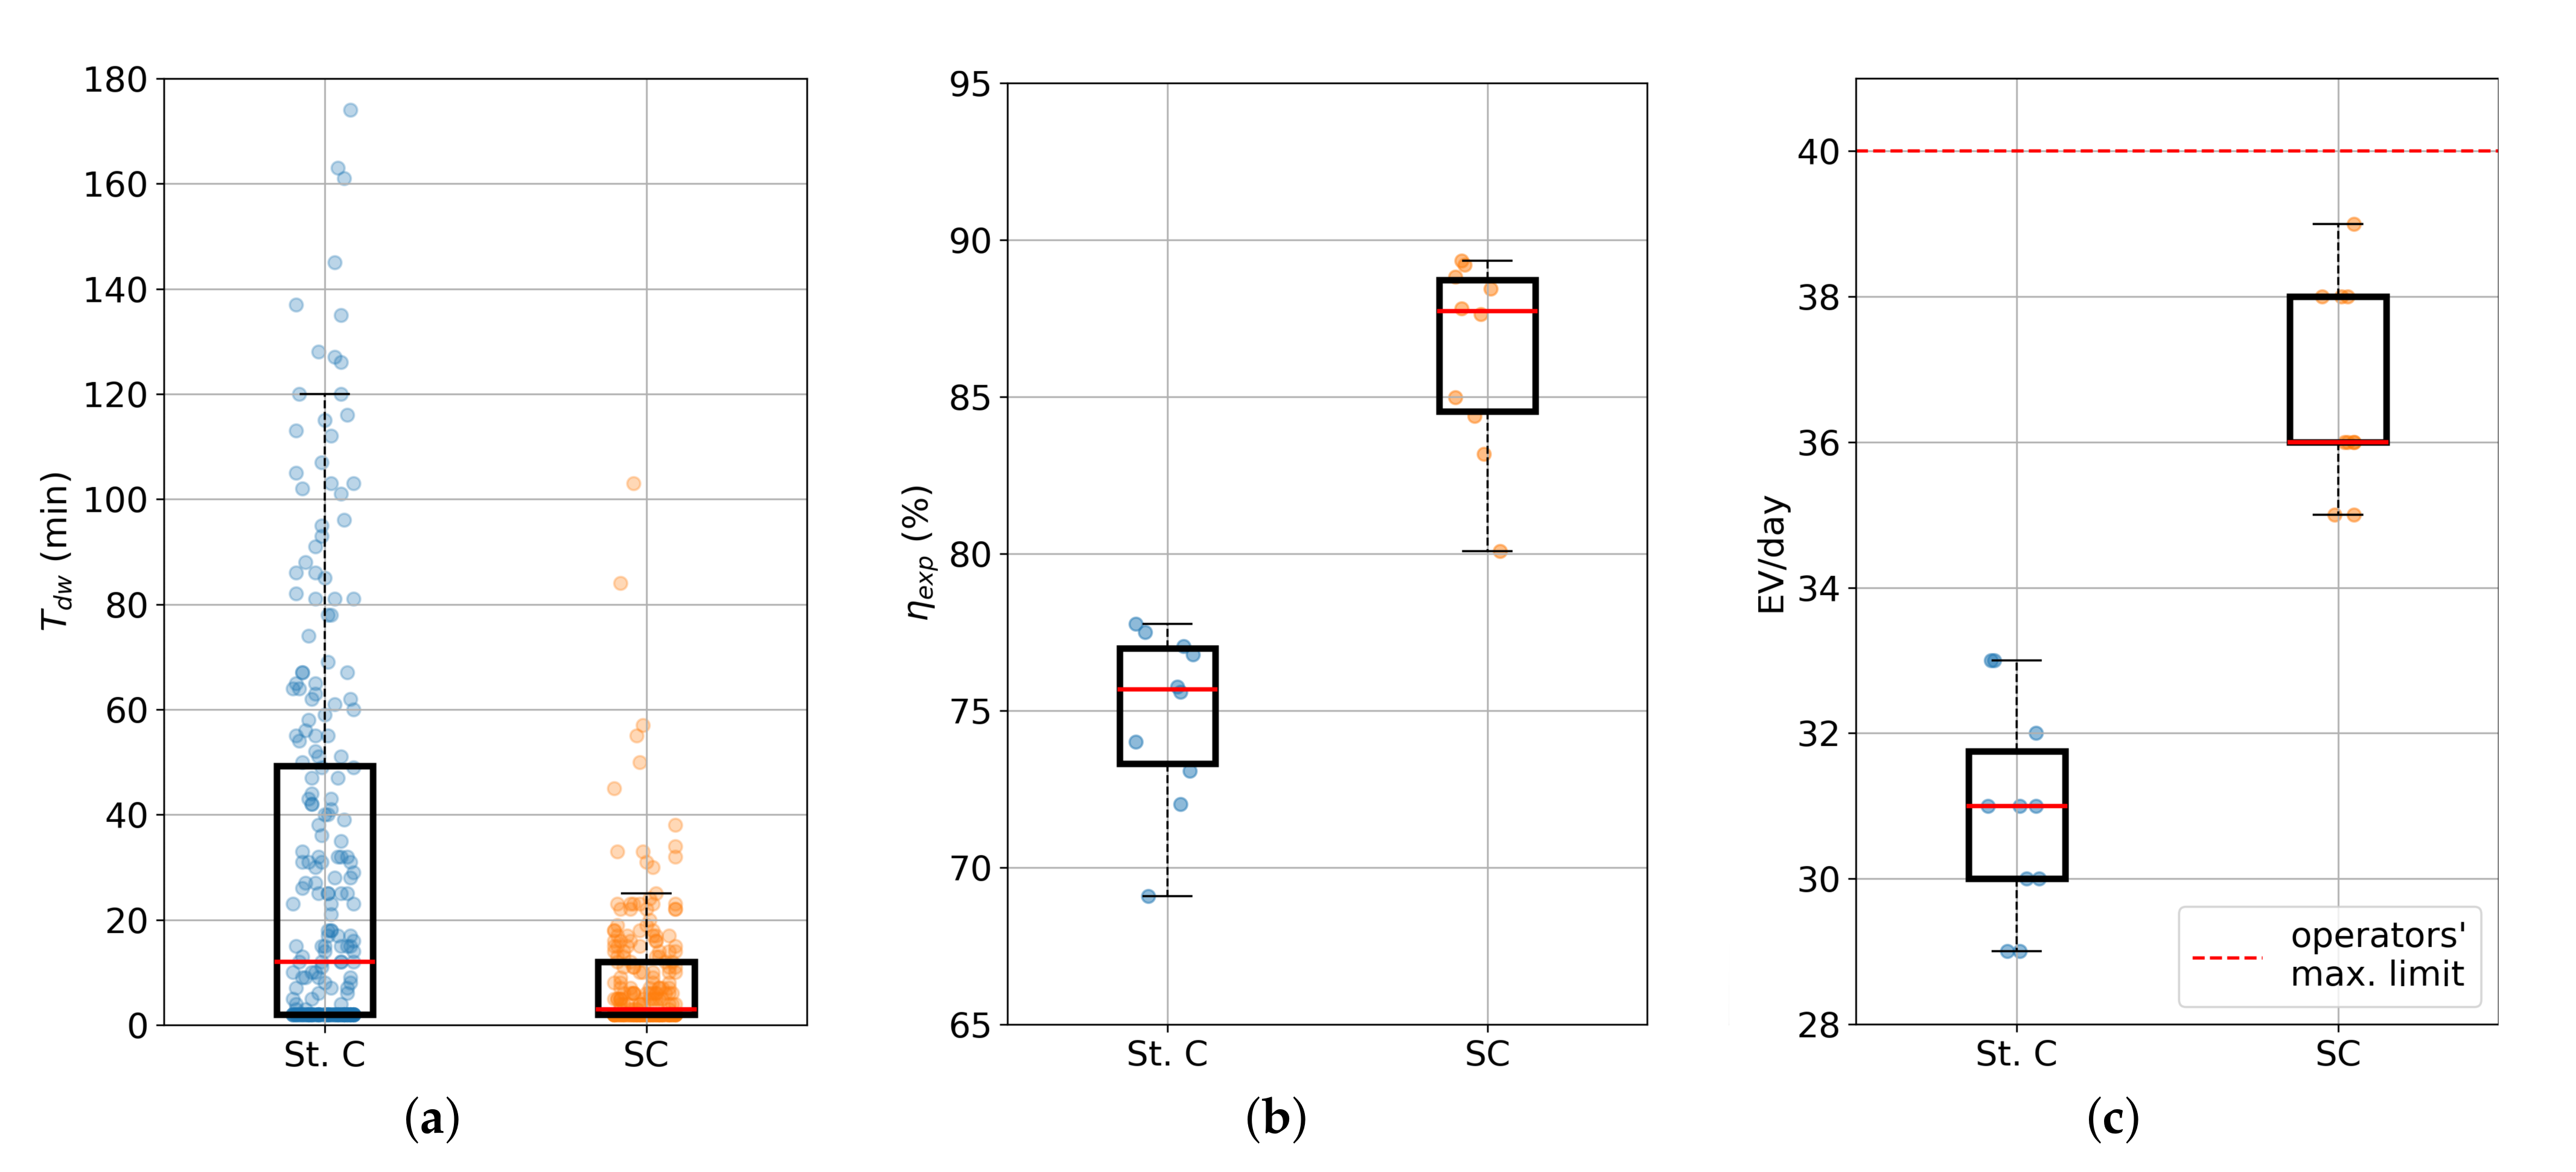
5.2. Simulation Results
- Whole downtime of the CPs ().
- CH power exploitation coefficient defined as , denoted as percentage.
- The total number of charging events occurred within the 24-h period (i.e., the whole number of EVs connected per day).
6. Conclusions
Author Contributions
Funding
Institutional Review Board Statement
Informed Consent Statement
Data Availability Statement
Acknowledgments
Conflicts of Interest
Abbreviations
| BCBM | Battery Charging Behavioral Model |
| CC-CV | Constant Current–Constant Voltage |
| CH | Charging Hub |
| CMS | Charging Management System |
| CP | Charging Point |
| ECS | Electric Car-Sharing |
| EV | Electric Vehicle |
| ID | Identification number |
| OD | Over-Day |
| ON | Over-Night |
| PWM | Pulse-Width Modulation |
| RES | Renewable Energy Sources |
| RMSE | Root-Mean-Square Error |
| SC | Smart Charging |
| St. C | Standard Charging |
| Battery energy capacity | |
| Charging Rate | |
| Number of EV in charging | |
| Total power required by the CH | |
| Charging power of a single EV | |
| State of Charge | |
| Pre-charging SOC | |
| Post-charging SOC |
References
- 2050 Long-Term Strategy. Available online: https://ec.europa.eu/clima/eu-action/climate-strategies-targets/2050-long-term-strategy_en (accessed on 9 September 2022).
- Luo, C.; Ooi, B.T. Frequency deviation of thermal power plants due to wind farms. IEEE Trans. Energy Convers. 2006, 21, 708–716. [Google Scholar] [CrossRef]
- Kroposki, B.; Johnson, B.; Zhang, Y.; Gevorgian, V.; Denholm, P.; Hodge, B.M.; Hannegan, B. Achieving a 100% renewable grid: Operating electric power systems with extremely high levels of variable renewable energy. IEEE Power Energy Mag. 2017, 15, 61–73. [Google Scholar] [CrossRef]
- Lo Franco, F.; Ricco, M.; Mandrioli, R.; Grandi, G. Electric Vehicle Aggregate Power Flow Prediction and Smart Charging System for Distributed Renewable Energy Self-Consumption Optimization. Energies 2020, 13, 5003. [Google Scholar] [CrossRef]
- Lo Franco, F.; Ricco, M.; Mandrioli, R.; Paternost, R.F.P.; Grandi, G. State of Charge Optimization-based Smart Charging of Aggregate Electric Vehicles from Distributed Renewable Energy Sources. In Proceedings of the 2021 IEEE 15th International Conference on Compatibility, Power Electronics and Power Engineering (CPE-POWERENG), Florence, Italy, 14–16 July 2021; IEEE: Piscataway, NJ, USA, 2021; pp. 1–6. [Google Scholar] [CrossRef]
- Lo Franco, F.; Mandrioli, R.; Ricco, M.; Monteiro, V.; Monteiro, L.F.C.; Afonso, J.L.; Grandi, G. Electric Vehicles Charging Management System for Optimal Exploitation of Photovoltaic Energy Sources Considering Vehicle-to-Vehicle Mode. Front. Energy Res. 2021, 9, 642. [Google Scholar] [CrossRef]
- Nour, M.; Said, S.M.; Ali, A.; Farkas, C. Smart Charging of Electric Vehicles According to Electricity Price. In Proceedings of the 2019 International Conference on Innovative Trends in Computer Engineering, ITCE 2019, Aswan, Egypt, 2–4 February 2019; pp. 432–437. [Google Scholar] [CrossRef]
- Electric Vehicle Demand Response—ENTSO-E. Available online: https://www.entsoe.eu/Technopedia/techsheets/electric-vehicle-demand-response (accessed on 9 September 2022).
- Integrated Smart GRID Cross-Functional Solutions for Optimized Synergetic Energy Distribution, Utilization Storage Technologies|InteGRIDy. Available online: http://www.integridy.eu/ (accessed on 9 September 2022).
- Borge-Diez, D.; Icaza, D.; Açıkkalp, E.; Amaris, H. Combined vehicle to building (V2B) and vehicle to home (V2H) strategy to increase electric vehicle market share. Energy 2021, 237, 121608. [Google Scholar] [CrossRef]
- Monteiro, V.; Monteiro, L.F.C.; Franco, F.L.; Mandrioli, R.; Ricco, M.; Grandi, G.; Afonso, J.L. The Role of Front-End AC/DC Converters in Hybrid AC/DC Smart Homes: Analysis and Experimental Validation. Electronics 2021, 10, 2601. [Google Scholar] [CrossRef]
- Lazzeroni, P.; Cirimele, V.; Canova, A. Economic and environmental sustainability of Dynamic Wireless Power Transfer for electric vehicles supporting reduction of local air pollutant emissions. Renew. Sustain. Energy Rev. 2021, 138, 110537. [Google Scholar] [CrossRef]
- Reche, C.; Tobias, A.; Viana, M. Vehicular Traffic in Urban Areas: Health Burden and Influence of Sustainable Urban Planning and Mobility. Atmosphere 2022, 13, 598. [Google Scholar] [CrossRef]
- Karagulian, F.; Belis, C.A.; Dora, C.F.C.; Prüss-Ustün, A.M.; Bonjour, S.; Adair-Rohani, H.; Amann, M. Contributions to cities’ ambient particulate matter (PM): A systematic review of local source contributions at global level. Atmos. Environ. 2015, 120, 475–483. [Google Scholar] [CrossRef]
- Agarwal, P.; Sarkar, M.; Chakraborty, B.; Banerjee, T. Phytoremediation of Air Pollutants: Prospects and Challenges. In Phytomanagement of Polluted Sites: Market Opportunities in Sustainable Phytoremediation; Elsevier: Berlin/Heidelberg, Germany, 2018; pp. 221–241. [Google Scholar] [CrossRef]
- Giesel, F.; Nobis, C. The Impact of Carsharing on Car Ownership in German Cities. Transp. Res. Procedia 2016, 19, 215–224. [Google Scholar] [CrossRef]
- María Arbeláez Vélez, A.; Plepys, A.; Olsson, L.; Guyader, H. Car Sharing as a Strategy to Address GHG Emissions in the Transport System: Evaluation of Effects of Car Sharing in Amsterdam. Sustainability 2021, 13, 2418. [Google Scholar] [CrossRef]
- Migliore, M.; D’Orso, G.; Caminiti, D. The environmental benefits of carsharing: The case study of Palermo. Transp. Res. Procedia 2020, 48, 2127–2139. [Google Scholar] [CrossRef]
- Trend Europe: Electrification in car-sharing fleets-electrive.com. Available online: https://www.electrive.com/2020/03/08/trend-europe-electrification-in-car-sharing-fleets/ (accessed on 9 September 2022).
- Electric Vehicle Car Sharing Platform|Interreg Europe—Sharing Solutions for Better Policy. Available online: https://www.interregeurope.eu/good-practices/electric-vehicle-car-sharing-platform (accessed on 9 September 2022).
- Nicholas, M.; Bernard, M.R. Success Factors for Electric Carsharing. 2021. Available online: https://movmi.net/ (accessed on 9 September 2022).
- He, L.; Ma, G.; Qi, W.; Wang, X. Charging an Electric Vehicle Sharing Fleet. SSRN Electron. J. 2019, 23, 471–487. [Google Scholar] [CrossRef]
- Deza, A.; Huang, K.; Metel, M.R. Charging station optimization for balanced electric car sharing. Discret. Appl. Math. 2022, 308, 187–197. [Google Scholar] [CrossRef]
- Wang, N.; Li, J.; Liu, X.; Guo, J. Study on the Charging Station Layout of Electric Car Sharing Mode. Lect. Notes Electr. Eng. 2022, 769, 785–802. [Google Scholar] [CrossRef]
- Zhang, T.Z.; Chen, T.D. Smart charging management for shared autonomous electric vehicle fleets: A Puget Sound case study. Transp. Res. Part D Transp. Environ. 2020, 78. [Google Scholar] [CrossRef]
- Ren, S.; Luo, F.; Lin, L.; Hsu, S.C.; LI, X.I. A novel dynamic pricing scheme for a large-scale electric vehicle sharing network considering vehicle relocation and vehicle-grid-integration. Int. J. Prod. Econ. 2019, 218, 339–351. [Google Scholar] [CrossRef]
- Home Page of “Corrente” Web Site. Available online: https://corrente.app/#home (accessed on 5 September 2022).
- Web Page of the Map of the Electric Car-Sharing Corrente in Bologna. Available online: https://corrente.app/pagina/estensionebologna/ (accessed on 8 September 2022).
- Schmenger, J.; Endres, S.; Zeltner, S.; März, M. A 22 kW on-board charger for automotive applications based on a modular design. In Proceedings of the 2014 IEEE Conference on Energy Conversion (CENCON), Johor Bahru, Malaysia, 13–14 October 2014; pp. 1–6. [Google Scholar] [CrossRef]
- Shen, W.; Vo, T.T.; Kapoor, A. Charging algorithms of lithium-ion batteries: An overview. In Proceedings of the 2012 7th IEEE Conference on Industrial Electronics and Applications (ICIEA), Singapore, 18–20 July 2012; IEEE: Piscataway, NJ, USA, 2012; pp. 1567–1572. [Google Scholar] [CrossRef]
- Lo Franco, F.; Ricco, M.; Mandrioli, R.; Viatkin, A.; Grandi, G. Current Pulse Generation Methods for Li-ion Battery Chargers. In Proceedings of the 2020 2nd IEEE International Conference on Industrial Electronics for Sustainable Energy Systems (IESES), Cagliari, Italy, 1–3 September 2020; IEEE: Piscataway, NJ, USA, 2020; Volume 1, pp. 339–344. [Google Scholar] [CrossRef]
- Schaden, B.; Jatschka, T.; Limmer, S.; Raidl, G.R. Smart Charging of Electric Vehicles Considering SOC-Dependent Maximum Charging Powers. Energies 2021, 14, 7755. [Google Scholar] [CrossRef]
- Vehicles-Fastned FAQ. Available online: https://support.fastned.nl/hc/en-gb/sections/4428932764573-Vehicles (accessed on 9 September 2022).
- Renault-Fastned FAQ. Available online: https://support.fastned.nl/hc/en-gb/articles/360035723373-Renault (accessed on 9 September 2022).
- Speak EV- Zoe Charge Curve-Mapped and Graphed. Available online: https://www.speakev.com/threads/zoe-q90-rapid-charge-curve-mapped-and-graphed.118785/ (accessed on 9 September 2022).
- Speak EV- R90 v Q90 Charging Times. Available online: https://www.speakev.com/threads/r90-v-q90-charging-times.74249/ (accessed on 9 September 2022).
- Speak EV-ZE50 versus ZE40-Renault Charging Data. Available online: https://www.speakev.com/threads/ze50-versus-ze40-renault-charging-data.152143/ (accessed on 9 September 2022).
- IEC Technical Committee 69 IEC 61851-1:2017 Electric Vehicle Conductive Charging System-Part 1: General Requirements 2017. Available online: https://webstore.iec.ch/publication/33644 (accessed on 9 September 2022).


| EV ID | EV Model | CH ID | CP ID | ||||
|---|---|---|---|---|---|---|---|
| 34 | ZE40 | CH1 | 3 | 13% | 98% | 13 December 2021 08:49:45 | 13 December 2021 10:06:51 |
| 107 | ZE50 | CH1 | 2 | 25% | 100% | 13 December 2021 09:12:45 | 13 December 2021 11:02:11 |
| 12 | ZE50 | CH1 | 1 | 8% | 97% | 13 December 2021 08:00:05 | 13 December 2021 09:01:22 |
| RMSE | ||||
|---|---|---|---|---|
| 0.65 | 0.87 | −42.85 | 0.02 | 0.88 |
Publisher’s Note: MDPI stays neutral with regard to jurisdictional claims in published maps and institutional affiliations. |
© 2022 by the authors. Licensee MDPI, Basel, Switzerland. This article is an open access article distributed under the terms and conditions of the Creative Commons Attribution (CC BY) license (https://creativecommons.org/licenses/by/4.0/).
Share and Cite
Lo Franco, F.; Cirimele, V.; Ricco, M.; Monteiro, V.; Afonso, J.L.; Grandi, G. Smart Charging for Electric Car-Sharing Fleets Based on Charging Duration Forecasting and Planning. Sustainability 2022, 14, 12077. https://doi.org/10.3390/su141912077
Lo Franco F, Cirimele V, Ricco M, Monteiro V, Afonso JL, Grandi G. Smart Charging for Electric Car-Sharing Fleets Based on Charging Duration Forecasting and Planning. Sustainability. 2022; 14(19):12077. https://doi.org/10.3390/su141912077
Chicago/Turabian StyleLo Franco, Francesco, Vincenzo Cirimele, Mattia Ricco, Vitor Monteiro, Joao L. Afonso, and Gabriele Grandi. 2022. "Smart Charging for Electric Car-Sharing Fleets Based on Charging Duration Forecasting and Planning" Sustainability 14, no. 19: 12077. https://doi.org/10.3390/su141912077
APA StyleLo Franco, F., Cirimele, V., Ricco, M., Monteiro, V., Afonso, J. L., & Grandi, G. (2022). Smart Charging for Electric Car-Sharing Fleets Based on Charging Duration Forecasting and Planning. Sustainability, 14(19), 12077. https://doi.org/10.3390/su141912077