Article

Digital Last Planner System Whiteboard for Enabling Remote Collaborative Design Process Planning and Control

1
Building Lifecycle Research Group, Department of Civil Engineering and Architecture, Tallinn University of Technology, 19086 Tallinn, Estonia
2
Innovative Design Lab (IDL), School of Arts and Humanities, University of Huddersfield, Queensgate, Huddersfield HD1 3DH, UK
3
Department of Civil Engineering, Aston University, Aston Street, Birmingham B4 7ET, UK
*
Author to whom correspondence should be addressed.
Sustainability 2022, 14(19), 12030; https://doi.org/10.3390/su141912030
Submission received: 9 August 2022 / Revised: 12 September 2022 / Accepted: 18 September 2022 / Published: 23 September 2022
(This article belongs to the Special Issue The Role of Digitalized Visual Management in Construction Projects)

Abstract

:
The coronavirus outbreak forced design companies to consider how the flow of information and work processes could be managed in the context of remote design work. This research aims to put a digital Last Planner System (LPS) whiteboard to the test in support of remote collaborative design process planning and control and identify its benefits and challenges. The synergies between lean and digital practices were explored by developing solutions in two different case studies, one in the UK and the other in Estonia. Research results were interpreted, and the main lessons learned were articulated. The digital LPS whiteboard enabled and supported the remote planning and control of design projects and processes. The digital LPS whiteboard had the following process-related benefits, including, for example, increased transparency, understanding, engagement, flexibility, and continuous improvement. Challenges in the use of the digital whiteboard were generally due to an excess of information and meetings, the social limitations of virtual meetings, and a lack of relevant IT competencies. Recommendations for individuals interested in planning, developing, and testing a digital whiteboard for remote implementation of the LPS are made. Further research on the entangled nature of digital whiteboard functionality and LPS behaviors is needed.

1. Introduction

At the beginning of 2020, the world was hit by an outbreak of the coronavirus (“a serious acute respiratory disorder”) [1]. The ensuing health crisis had a significant impact on the global economy and work [2]. Construction design delivery was influenced by the COVID-19 pandemic and related restrictions [3]. Architects, engineers, and managers moved out of their offices and began working from home, forcing companies to reconsider the organization and management of design work. In this setting, digitalization, in general, took on a key role in support of remote work [4] and collaboration [5]. The question of how to organize and manage collaborative remote design work was the starting point for this study, which began in 2020 and continued through 2022 in two different locations, the UK and Estonia.
Building information modeling (BIM) [5], BIM-based common data environments [6,7], and digital twins [8,9,10] have been proposed and developed to help improve the communication, coordination, and integration of design information and knowledge. In order to support project-based collaboration, the last planner system (LPS) for project and production planning and control was introduced in the early 1990s [11]. Recently, the connection between digitalization and LPS was established in off-the-shelf commercial systems such as VisiLean [12] and vPlanner [13] and prototype systems such as KanBIM [14].
However, such digital LPS solutions have focused on construction site production management needs, and design process planning and control needs have been neglected. Now, a new digital possibility has emerged for the support of design collaboration. This is the digital whiteboard, which can be used to support a collaborative remote implementation of the LPS [15]. While the LPS is a well-established collaborative project and design planning and control system based on a physical presence that supports the implementation of project-based production operating systems [11], the digital whiteboard is a flexible virtual and visual platform (i.e., white canvas) that affords the development of artifacts which support remote collaboration [16].
This exploratory action research aims to develop and test the first version of the digital LPS whiteboard as a tool to support the remote collaborative design process planning and control and to identify its benefits and challenges. Lean management and approaches can also contribute to achieving the U.N. Sustainable Development Goals. Overall, the presentation of this research is divided into five sections. First, the research background with core ideas and concepts relevant to the digital LPS whiteboard is provided. Then the research method and cases are described. Next, the action-taking and evaluation steps of the two cases, in the UK and Estonia, are presented. After this, the results of these cases are discussed and interpreted, and the main lessons learned are articulated. As is typical for action research, the specification of learning and interpretation of results is presented in the end because the study arose from the practical need to support remote collaborative planning and control of design processes rather than from theoretical propositions. Finally, our conclusions are presented.

2. Research Background

This section addresses design collaboration, the Last Planner System (LPS), and visual management as the key ideas and concepts involved in the development of digital visual and collaborative planning and control artifacts. Those concepts are addressed briefly because they are well known, and the paper length is limited.

2.1. Design Collaboration

The delivery of construction design projects demands an increasing breadth of knowledge and expertise and relies heavily on teamwork. Problems in design tend to emerge at the nexus of different disciplines [17]: client versus designer, architecture versus engineering, design versus construction production, etc. Collaboration and trust are needed to address design problems and improve design and design management processes [18,19,20,21,22]. Without collaboration and trust, non-value-adding activities such as over- and under-designing are more likely to occur [22,23].
Extensive research on design collaboration has been carried out in construction design [24,25,26,27], construction design management [19,28], and more general design contexts [29,30,31]. There is, however, a lack of common understanding of the meaning of collaboration [32]. The focus in construction design and construction design management research seems to be on the creation and evaluation of a digital means for facilitating efficient communication and enabling the coordination of systems [5,26,33,34,35]. In other words, current research on construction design collaboration appears to be rather limited in scope.
Numerous definitions for design collaboration have been proposed, all influenced by particular views and dispositions [32]. Kleinsmann [30] proposed a definition for collaboration that addresses both the technical and social aspects of design activity: “...the process through which actors from different disciplines share their knowledge about the design process and the design [task] itself. This creates shared understanding related to both process and artifact, helps integrate their knowledge, and helps them focus on bigger common objectives—the final product to be designed”. In other words, design collaboration is a complex concept [32], and a multi-tier approach is required to enable, facilitate, and improve design collaboration.
Designers and engineers work within different segmented “object worlds” (different paradigms, languages, and activity systems), dividing “the design task into different [but not independent] kinds of effort” [36]. What matters is how expertise is assembled and collaboration is managed to address design project needs:
  • Needs stemming from designers and engineers contributing to a common goal [36]: There is one associated set of design priorities (project, object, and client aspiration) [17].
  • Needs stemming from client expectations and requirements [37]: Defining and translating client (often aggregate client) needs into requirements necessitates interpretation, and prior solutions may not suffice.
  • Needs derived from a single and collective design process [38,39]: There is a need for the timely delivery of outputs, requiring the coordination and integration of design work.
  • Needs derived from the designed construction system, the whole, and its parts [40]: Parts must fit, and performance (functioning and behavior) must be achieved at the whole system level.
Design collaboration needs to be managed, and the LPS has been demonstrated to support project-based collaboration.

2.2. Last Planner System

The LPS was developed to improve collaborative project and production planning and control systems with functions to define the project, set and steer cost and time targets, and plan and control project production [11]. In the latest process benchmark for the LPS, presuppositions (assumptions about the world), conventions (activity/task break-down), principles (rules), processes (six processes from project planning through learning), and methods (a way of performing the operations within processes) have been described to explain the system, its elements, and relationships.
The LPS is implemented through the six interconnected processes as follows [11]: (1) project execution planning, (2) master planning, (3) phase planning, (4) lookahead planning, (5) weekly work planning, and (6) learning. Five metrics to measure the effectiveness of LPS implementation and promote continuous improvement have been defined as follows [11]: Commitment Level (CL), Percent Plan Completed (PPC), Tasks Anticipated (TA), Tasks Made Ready (TMR), and Frequency of Plan Failures (FPF). CL measures whether capacity has been allocated to critical/required tasks. PPC measures how well commitments are being kept (workflow reliability). TA measures whether operations have been defined in time to identify and remove constraints. TMR measures the timely removal of constraints. FPF measures the team’s effectiveness in learning from reoccurring plan failures.
The LPS has also been implemented in the design context to support collaborative design process planning and control [41,42]. Face-to-face and collaborative planning and control sessions have played a key role in the implementation of the LPS in construction design projects [43]. With the onset of the COVID-19 pandemic [3], however, architects, engineering designers, and design managers soon moved out of their offices and began working remotely from home. For facilitating and supporting remote lean design management, Pedó et al. [15] had already started the development of a digital whiteboard-based LPS and visual management artifact. The digital whiteboard is a blank canvas with the functionality to support existing practices and behaviors and enable new ones. Digital and visual collaborative whiteboards have thus presented a new opportunity to support remote design collaboration.

2.3. Visual Management
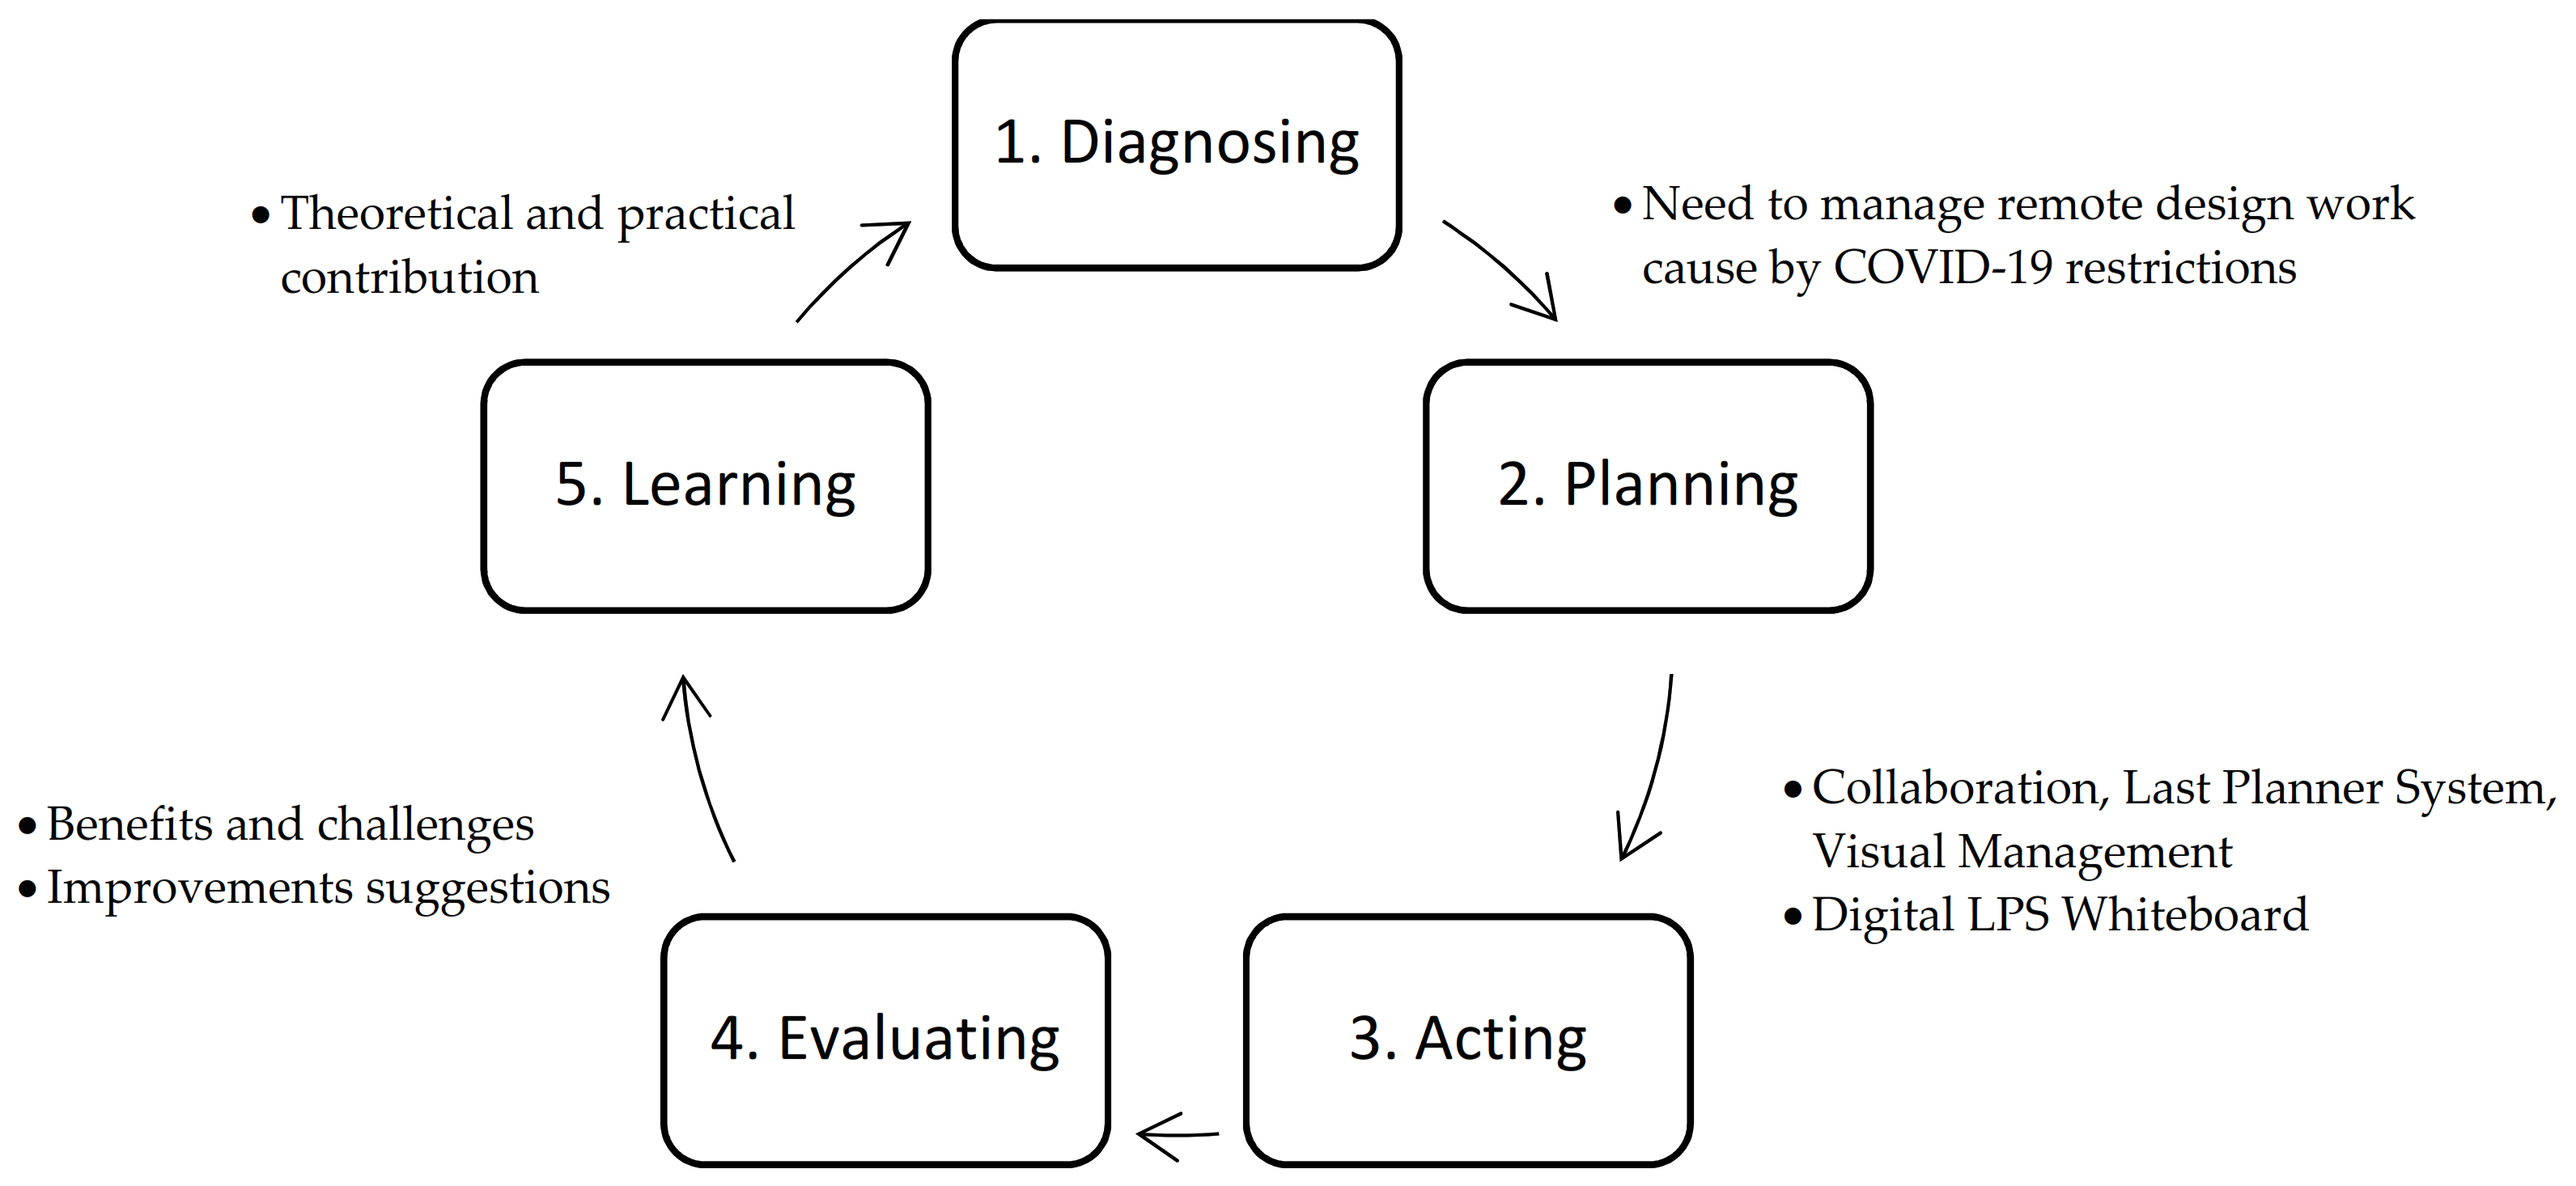
Visual management (VM), a central concept of lean management and lean construction [44], emphasizes the process perspective in information and knowledge management [45]. VM strategy aims to increase process transparency by purposefully designing sensory systems that address the five human senses [46]: visual, auditory, olfactory, gustatory, and tactile. This is used to create the capacity (affordances) of a design or production process (or its parts) to communicate (interact) with people [45,47]. Process transparency is achieved by making process flows visible and comprehensible to workers and managers [48].
VM is realized through visual (sensory) tools and systems (interlinked visual tools) [46,49]. Those tools are often developed through trial and error to address a practical need rather than being derived from theoretical propositions [45]. The tools are used to create an information field from which people can pull relevant information on a self-service basis [50]. The sensory stimuli induced by the tools should communicate necessary, relevant, correct, immediate, easy-to-understand, and stimulating information to help people understand the message and act on it by just looking at the tools [51]. Furthermore, abnormalities and deviations should be easily recognizable [52]. Visual tools thus contribute to the reduction of variability and the elimination of non-value-adding activities [45].
VM can, in this way, also contribute to information flow management in the construction design process. It can support increasing the accessibility of information, team communication, and the handling of ambiguity and uncertainty [15]. Visual systems and tools can render design teams more self-managing [53]—the desired outcome in the context of remote design work. Alongside these benefits, VM tools also have a management side to them. This means the integration of tools with managerial routines and the definition of ownership, maintenance, and standards for the tools in a work setting are necessary [54].

3. Research Method

For the trialing of the digital LPS whiteboard, the first iteration of the action research method was carried out and is presented in this paper. Compared to positivist research, it is a suitable method for researchers interested in developing practically relevant and theoretically interesting research involving the interplay of humans, technology, information, and social-cultural contexts [55]. Action research is also appropriate when studying the adaptation of new approaches or practices to empirical circumstances [56,57]. In action research, the researcher actively takes part in the diagnosis of a problem and the development of a solution [58].
The authors proposed and supported the adoption of the LPS using digital and visual whiteboards in two different construction design organizations, one in the UK and the other in Estonia, to support design work planning and control from late 2020 to early 2022. Except for the “problem diagnosis” step, the first iteration of the action research was as follows [59]: (1) diagnosing (problem identification), (2) planning (the consideration of alternatives), (3) acting (the course of action), (4) evaluating (consequences of the action), and (5) learning (general findings) (see Figure 1).
The first “diagnosis” step in the context of this research was omitted as the problem arose from the need to adapt to global COVID-19 restrictions. Both companies had also been implementing lean design management practices, including the LPS, before COVID-19. As designers and engineers began working from home, it led to the decision that the LPS would be implemented on a digital whiteboard with advanced data recording and visualization features. The prior experience of the researchers with Mural and Miro digital whiteboards facilitated the integration of digital whiteboard functionalities with LPS processes.
The research questions were initially explored and developed independently in the two different design management contexts, with the focus in the UK on infrastructure design and in Estonia on building design. Later, the researchers discovered by chance that they had been pursuing rather similar work. In the UK, the implementation of the whiteboard began in 2020, and in Estonia, in 2021. Given the independent starts, the implementation of the digital whiteboards and the evaluation methods in the two cases are different. As this is, however, an initial trialing of digital whiteboards, the two different focuses can be considered complementary and can provide good input for the planning of future research. Case organization, project characteristics, and evaluation methods are now briefly explained below.

3.1. UK Case: Organization, Project Description, and Action Description

The UK action research was carried out between June 2020 and June 2022 as part of a Knowledge Transfer Partnership (KTP) project (sponsored by InnovateUK) intended to promote collaboration between academia and industry. The project primarily explored the integration of lean and digital design practices in the civil engineering sector.
The UK infrastructure design company has been implementing lean design management practices for approximately the last six years. The company had also started implementing digital technologies before the COVID-19 pandemic, whose onset accelerated the development of the digitalization processes to support collaboration and information sharing. Nevertheless, the company still faced limited standardization, fragmentation, and quality challenges. Additional lean practices (especially VM) were identified as opportunities to address these issues.
Four projects were selected for testing the action research intervention. Projects 1, 2, and 4 were highway design projects, while project 3 was a railway design project. Those projects were chosen due to (1) the availability of the teams to participate in the research and (2) the identification of good lean and digitalization practices. All projects were analyzed from the perspective of the company, even when multiple partnering companies were involved in the design project. The design projects had a high level of organizational complexity and uncertainty. The organizational complexity was related to the great number of internal and external stakeholders and the interdependencies among them. The uncertainty was caused by the need to adapt the processes of all the organizations involved to the client’s requirements.
The intervention’s main actions related to the typical action research steps include (see Table 1): (1) participant observation of virtual LPS planning sessions, such as Master and Phase planning; (2) feedback collection (survey); (3) workshop with key stakeholders to assess the digital whiteboard interface and process (VM device development); (4) introduction of digital whiteboards for LPS planning sessions; (5) document and VM devices analysis; (6) development of training materials; and (7) conducting of training sessions. The researcher was involved in the introduction of the digital whiteboard and the training of staff to use it.

3.2. Estonian Case: Organization, Project Description, and Action Description

The Estonian action research was carried out in a design office founded in 2005 that provides construction design and design project management services. It has used BIM since 2009 and began its lean journey (e.g., implementing the LPS) in 2016 [43]. The coronavirus outbreak and restrictions imposed by the government had a significant impact on the company’s processes and practices. Architects, engineers, and design managers had to adjust to working from their home offices.
For the development and testing of a digital whiteboard-based LPS, a real estate development project was chosen. This research looked at the second phase of the development project, which involved the design of two new apartment buildings with a common underground garage, two repurposed and renovated office buildings and a restaurant building. Table 2 summarizes the main characteristics of the buildings being designed. In this table, the restaurant building was omitted, as it was relatively small and was considered to be part of the design scope of the old barracks building. All the buildings were relatively simple, but there were difficulties due to renovation and heritage protection issues. The old barracks building and the old sauna and guard buildings were originally constructed in the early 20th century and are now under heritage protection.
Altogether 15 different design offices took part in the design process, which involved architects, landscape and interior architects, structural and building services engineers, and fire safety and sound protection engineers. Consultants working in certain areas (e.g., solar panels and surveying) were not included in the digital whiteboard-based LPS sessions. The input from or output to these second-tier consultants was mediated by two design managers or by architects, engineers, or clients. The lead designer and design management company had prior experience implementing lean design management and the LPS in their projects.
A process performance analysis and a focus group interview to evaluate the implementation of the visual and digital LPS were conducted. During the preliminary design phase, the project documents (e.g., master plans) were collected, meetings were recorded, photos of the weekly version of the schedule were documented, and the design process was assessed against LPS metrics. In the case of process performance measurement, video recordings of digital whiteboard-based LPS meetings in Microsoft Teams were used to measure and analyze process metrics. Key metrics (Table 3) included the percentage of plans completed (PPC, %), tasks anticipated (TA, %), tasks made ready (TMR, %), and work in progress (WIP, %). A new metric, “weekly plan changes” (WPC), not originally part of the Last Planner System, was also introduced. This metric was used to measure design plan changes. The main reasons for not starting or completing design tasks on time were also addressed.
After the preliminary design phase, a focus group interview meeting with team members to evaluate the virtual LPS approach was organized by researchers. The same virtual collaborative pull planning Miro board was used for the organization, preparation, and carrying out of the focus group interview, which was recorded in Microsoft Teams. Questions and statements were added to the board and grouped into four sections: (1) General, (2) Last Planner System, (3) Digital Last Planner System (LPS), and (4) Miro Board Content and Structure. Interview results were analyzed and interpreted qualitatively with a focus on identifying the digital LPS whiteboard benefits and challenges.

4. Action Taking and Evaluation

This subsection describes the action-taking and evaluation steps of the action research for the UK and Estonian cases.

4.1. UK Case

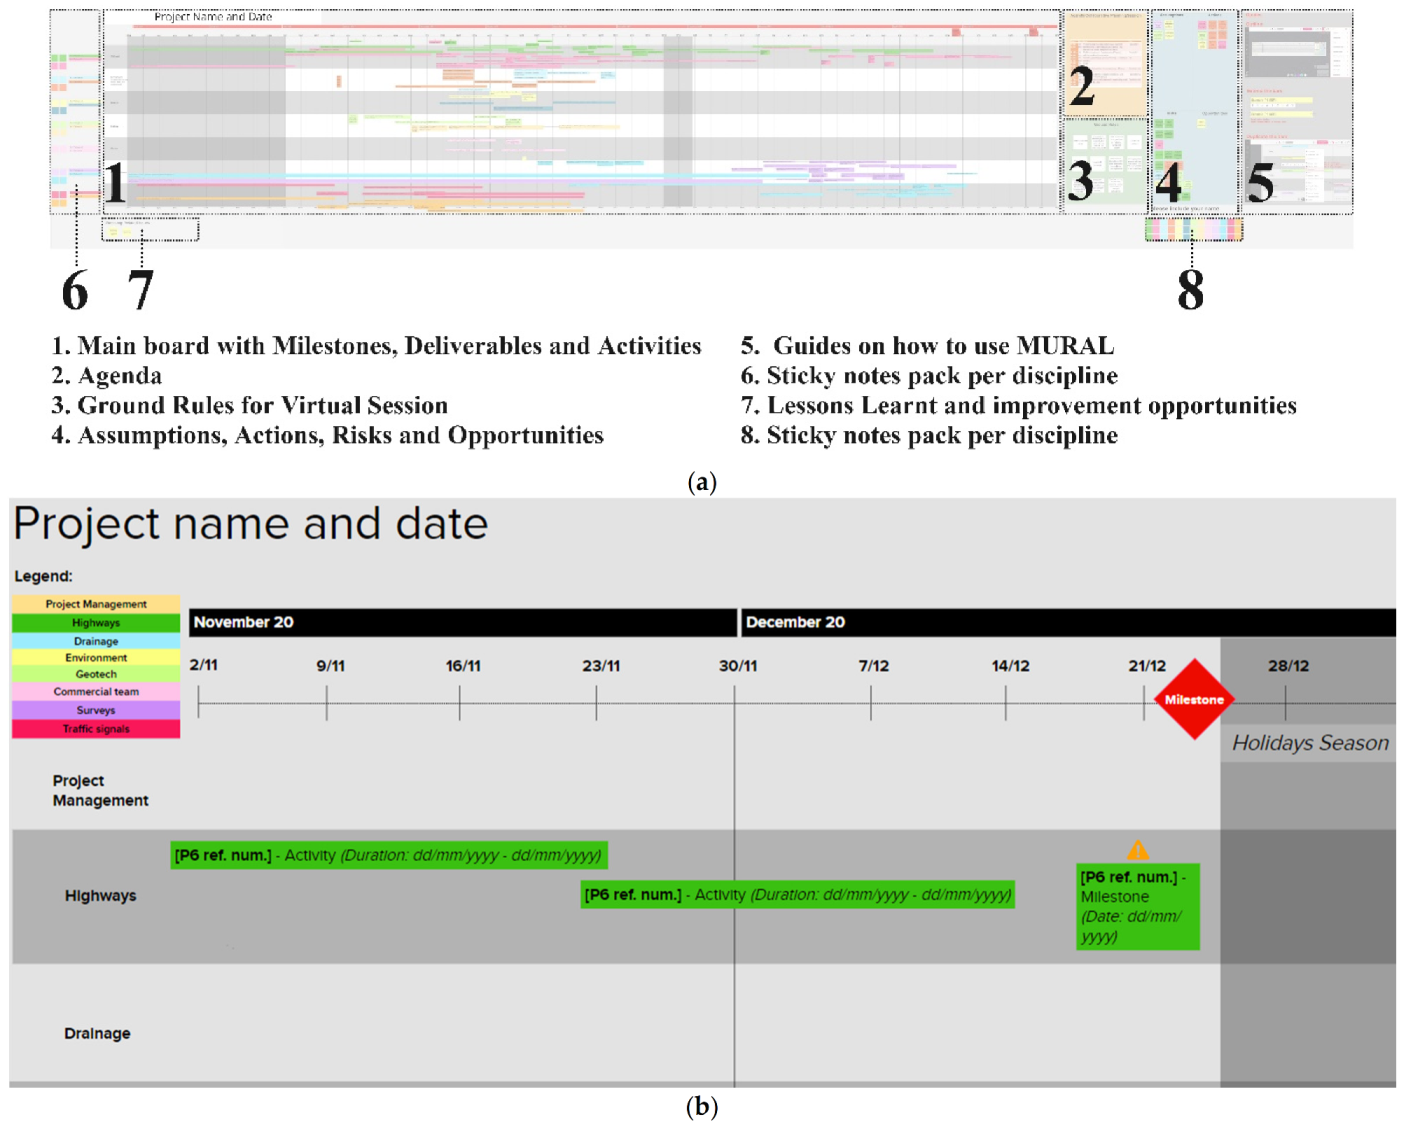
4.1.1. Collaborative Planning and Control Process

A digital whiteboard (i.e., MURAL) was adopted to support the collaborative LPS planning sessions for the four different projects. The LPS planning sessions were conducted throughout the entire design process to develop and manage the master and phase plans. Those sessions also focused on the identification and management of key constraints and agreement on long and medium-term plans to protect the baseline program. The latter required ensuring that all parties understood their responsibilities and the timeframes for deliverables defined in the long-term plan.
Typically, the continuous improvement team member (also called a lean practitioner), external to the project team, led the meetings, providing a neutral perspective and keeping the meetings focused. The meetings were carried out on the virtual MURAL and Microsoft Teams platforms. Microsoft Teams supported communication and the distribution of information. The digital whiteboard in MURAL was adopted to build the VM device for supporting LPS long and medium-term planning and control of the design projects.
The main board with milestones, deliverables, and activities is shown in Figure 2a (number 1), and its elements are illustrated in Figure 2b. Risks, assumptions, opportunities, and actions were identified, assessed, and logged during the sessions for continuous review and management (Figure 2a, number 4). Furthermore, the MURAL board included a section with the agenda (Figure 2a, number 2), ground rules for working in the digital environment (Figure 2a, number 3), guidelines on how to use the digital platform (Figure 2a, number 5), and lessons learned and improvement opportunities regarding the collaborative planning session (Figure 2a, number 7). Two virtual sticky note packages (with a specific color for each discipline) were added to the board (Figure 2a, numbers 6 and 8) to support user activities on the board. The packages were located close to the place of use.
The researcher and practitioner designed the VM device and supported the initial set-up, e.g., adjusting the project timeframe according to client requirements and adding key milestones according to the master schedule. The aims of and agenda for the meeting were defined by the project manager and practitioner at a project planning meeting. Both the Mural board link and agenda were shared with the team before the meeting to give the discipline lead designers time to analyze and populate the whiteboard before the session. This approach helped reduce the duration of meetings, as teams were then already familiar with the board content, including key activities and milestones. Compared to a traditional face-to-face LPS carried out in the company before COVID-19 restrictions, no initial discussion and planning for each discipline were required in the digitally organized project planning sessions.
The board could be used by all team members simultaneously, which means that all users were allowed to visualize the information, as well as edit it as required. The meeting facilitator (Lean practitioner) shared the screen with the whiteboard to facilitate discussions and be sure everyone was in the same place, focusing on the same topic on the whiteboard. The whiteboard platform (i.e., Mural) used in this case also makes it possible to move all participants on the board to the same location and view to ensure everyone is focused on the same information. The digital platform could also be used before and after meetings for asynchronous distributed collaboration, allowing the design team leads to use the board to support discussions within each discipline.
The master plan was reviewed every three or four months, depending on project requirements. The master plan was also used in weekly meetings to support short-term discussions and to ensure that the team was achieving the agreed milestones and deliverables. After each meeting, a backup (copy) of the board as an image was created, and the board was duplicated to track decisions. The project manager shared the board link and other key documents with the design team and project control team. The project control team transferred the information from the digital whiteboard to the master scheduling software (i.e., Primavera P6), updating the project program with new dates. The transfer of information from MURAL to the P6 master scheduling software required manual work. It was, however, simplified in this case since the information was already in a digital format, whereas the more traditional approach would have involved handwritten sticky notes. Thus, a step related to program validation with the discipline leads before the publication of a new version was eliminated.

4.1.2. Evaluation of Digital LPS Whiteboard Intervention

The implementation of a digital LPS whiteboard across four projects was evaluated using the actions in Table 1. A questionnaire was also prepared. While only 5 out of 15 people responded, much less than ideal, this limitation will certainly be addressed in future research. This paper, however, is the reporting of the first iteration of the action research, and as no survey methodology is followed, the study is considered a useful starting point for further research, and no statistical representativeness is aimed at.
Respondents were asked to evaluate 11 (S1–S11) statements concerning the digital LPS whiteboard usability on the 5-point Likert scale (Strongly agree, Agree, Neutral, Disagree, or Strongly Disagrees), as depicted in Figure 3. All either strongly agreed or agreed with the following statements: S1, S2, S5, S6, and S7. In the case of statements S4, S9, and S10, one was neutral, and the rest either agreed or strongly agreed. In the case of statements S3 and S8, one disagreed, one was neutral, and the rest agreed or strongly agreed. Finally, in the case of S11, two were neutral, one disagreed, and the rest agreed or strongly agreed. Overall, respondents then generally held favorable views towards the use of the visual dashboard.
Next, the general lessons learned, presented as benefits and challenges, are summarized based on a triangulation of observations (see Table 1) and survey responses. The benefits of implementing the LPS on a digital and visual whiteboard include the following:
  • Easy to set up meetings: Less effort and time are required and no physical space needs to be reserved for meetings.
  • Focused meetings: The structure, roles, and responsibilities in meetings were clearly defined.
  • Increased involvement and collaboration: One team member stated that “it was […] useful to pull all teams together and understand the key milestones and risks in the program”. According to the same team member, this heightened engagement and the commitment of different stakeholders to identify schedule abnormalities and solve problems in the same interface.
  • Better accessibility: Information in a digital format is accessible simultaneously at any time, in any place, and on any device.
  • Continuously improved shared templates and standards: It is easy to create and modify digital whiteboard templates and standards to create and re-create a common ground in a project and across projects. This facilitates and enables continuous improvement; however, it is difficult to keep everyone up to date with the changes.
  • Similar practices for physical and digital LPS: Digital whiteboard LPS practices mirrored physical LPS practices. The fact that the digital solution mirrored “manual” practices facilitated the use of the former.
  • Easy to use digital whiteboard: The company project director stated that “the use of MURAL allowed everyone to work and interact simultaneously through easy access and use of the whiteboard without being overwhelmed”.
  • Attention management: The selected digital whiteboard solution makes it possible to direct and manage the attention of participants, e.g., by moving them all to the same view.
  • Well-visualized data: Plan and control data on the digital whiteboard is well-structured and well-organized visually.
During the study, across four projects, the following challenges were identified:
  • Limited social dimension of digital meetings: In virtual meetings, it is difficult to develop and build personal relationships. For example, design project teams should benefit from face-to-face meetings at the beginning of projects.
  • Too many or overly long meetings: The ease with which meetings can be organized promotes the organization of more meetings. This can lead to an excess of virtual meetings and meeting fatigue.
  • Not all were equally involved and engaged: Not all participants were always equally involved and engaged in discussions. This reflects meeting practices rather than any shortcomings in the digital whiteboard itself.
  • Information overload: Because it is so easy to change or add information to the digital whiteboard, participants can lose their orientation or lose control of meetings.
  • Interactions on the digital whiteboard were time consuming: Compared to the physical LPS approach with paper stickies, preparing and inserting information in the digital environment and on the digital sticky notes required more time from participants.
  • Digital competencies and technical issues: (1) There were person-specific difficulties that arose, for example, from the need to manage and handle multiple platforms at the same time (Microsoft Teams and Mural), and (2) external difficulties, more general difficulties that arose, for example, when accessing the digital whiteboard or starting virtual meetings or due to the lack of interoperability between systems.
Some benefits and challenges in the list above are or seem opposing, for example, including the easy to set up meetings (nr 1 in benefits) versus too many or overly long meetings (nr 2 in challenges); or (nr 3 in benefits) increased involvement and collaboration versus (nr 3 in challenges) not all were equally involved and engaged. The exact nature of these and other similar contradictions needs to be investigated further.

4.2. Estonian Case

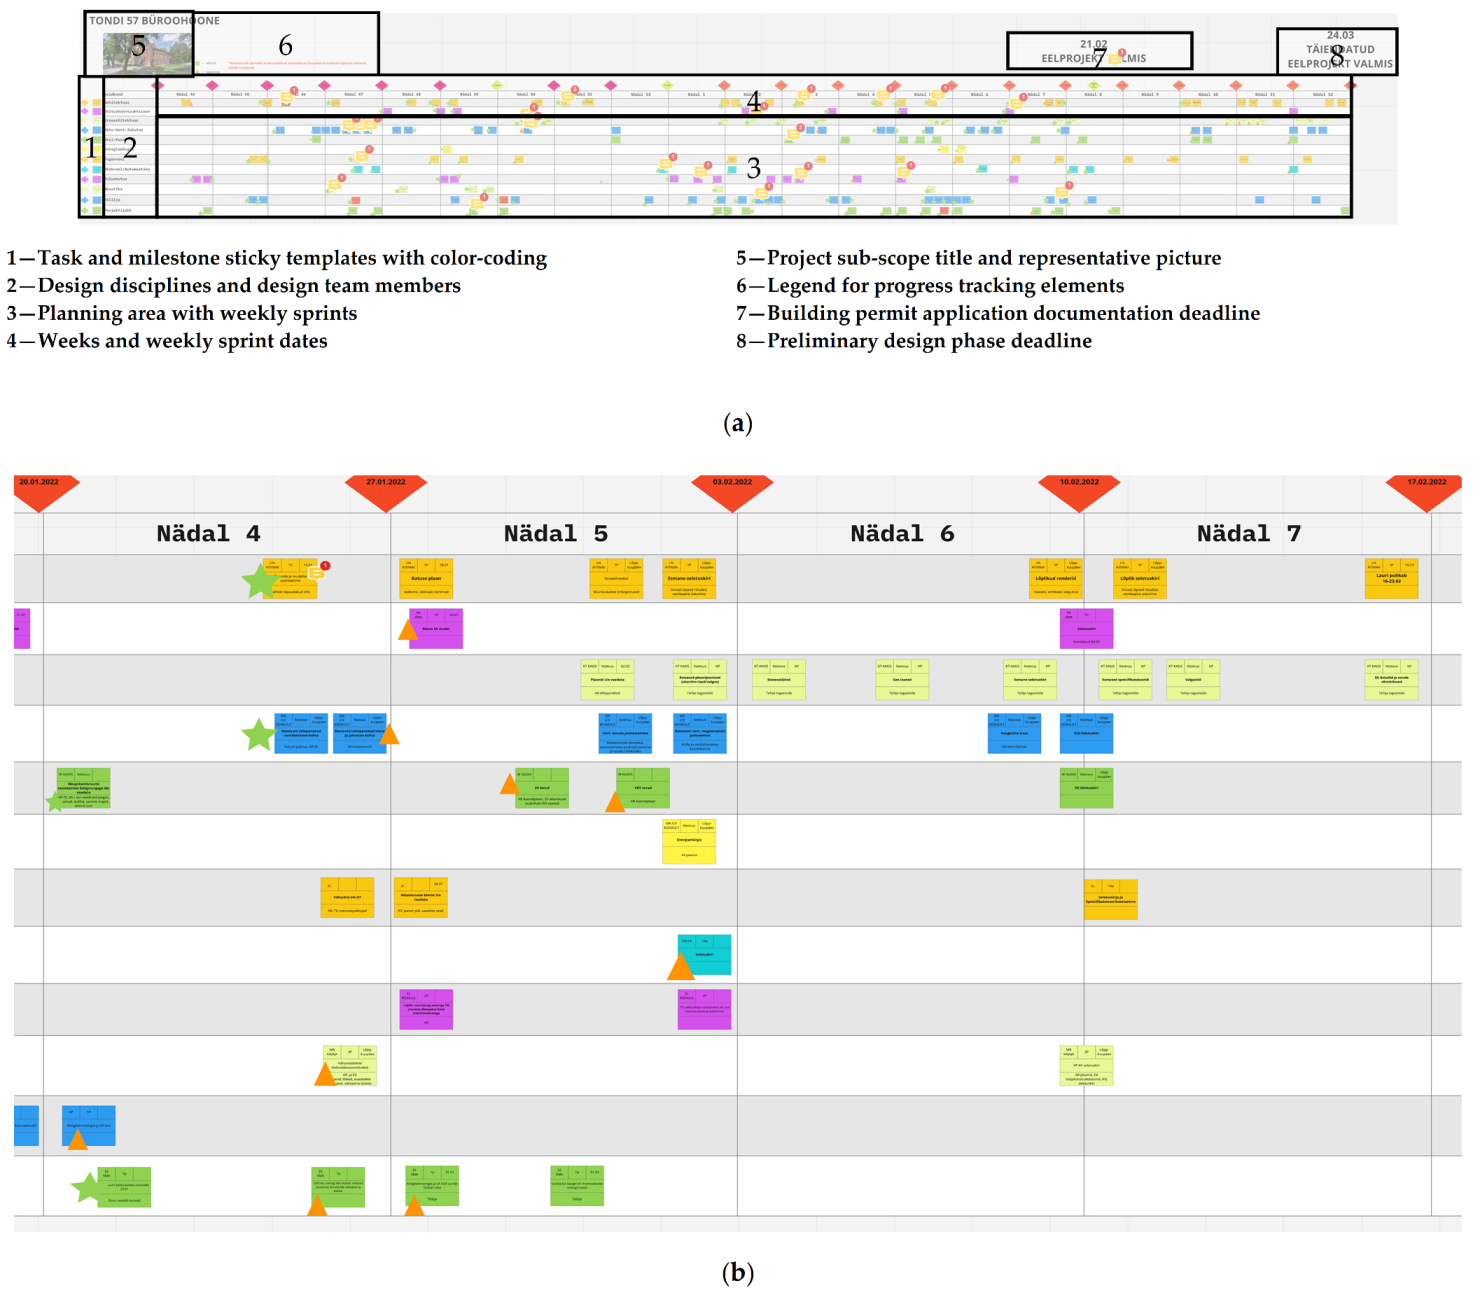
4.2.1. Collaborative Planning and Control Process

The Estonian “action taking” step of the action research was divided into three phases: (1) preparation and initial project and phase planning; (2) weekly planning and control meetings; and (3) an evaluation meeting at the end of the design phase. For the initial preparation and planning, the researchers and two design managers met to develop the project program. In order to simplify the design project program, the project scope was divided into three sub-scopes: (1) new apartment buildings, (2) old barracks (office building) + restaurant, and (3) old sauna (office building) and guard building. This division was also chosen because some designers were involved only within the specific scope, and the scopes had been given different priorities by the client. For the apartment buildings, the office building at the address Tondi 57, and the office building at Sõjakooli 6, two separate master plans were developed according to client priorities.
Initial pull planning session was prepared and organized face-to-face in the lead designer’s office. The design managers, together with the researchers, prepared all the necessary templates and materials for the first meeting. An invitation with meeting objectives, agenda, and instructions was sent to all key designers and engineers by email. Each designer and engineer was also asked to think out and plan their work for the preliminary design phase. Design periods were divided into week-long design sprints. In the physical phase planning meeting, all three scopes were planned on separate physical boards.
After the in-person meeting, the digital LPS whiteboard intervention (i.e., Miro) was introduced to enable remote collaborative design process planning and control. Design managers converted the physical plans into contents for the Miro board. One-and-a-half-hour weekly planning and control virtual meetings in Microsoft Teams were then held every Thursday: design work progress was monitored, and further work was planned on the digital Miro whiteboard. During the Teams meetings, the project manager’s screen and the digital whiteboard were shared with the others to facilitate discussions.
Weekly planning and control meetings focused on the management of the flow of information and work, possible constraints, and strategies to remove or eliminate constraints. Client representatives were also involved in the weekly planning meetings and were given their own tasks. Figure 4a is an illustration of the overall phase plan for the old barracks building and its key elements, each design discipline having its own row and color. During the weekly meetings, completed tasks were marked with a green star, and tasks in progress with an orange triangle (Figure 4b). Miro’s contextual comments were used to send requests for information, clarify issues, or send notifications and reminders related to specific tasks, in effect, partly replacing emails.

4.2.2. Process Performance Measurement

LPS metrics were used to evaluate design process performance. Table 4 summarizes the results for the three scopes according to the metrics in Table 3. The average is per entire period of a specific scope: 24 weeks for the apartment buildings (Tondi 57) and the old barracks building (Tondi 57) and 16 weeks for the old sauna and guard building (Sõjakooli 6). The positive and negative values for the linear ascent represent the linear trend. The initial and final values represent the trendline value at the beginning and the end of the period, respectively. The difference is calculated by subtracting the final from the initial.
The PPC for all three scopes was less than 50%: on average, about 38% for the Tondi 57 apartment buildings, about 31% for the Tondi 57 office building, and about 17% for the Sõjakooli 6 office building. There are several possible explanations for the low PPC. Firstly, it could mostly be due to the fact that the same architects and engineers worked on the three scopes, and capacity might have been exceeded. Secondly, the reason might lie in the nature of the early stages of design (the preliminary design phase), when designers were still focused on the clarification and conceptualization of the design task, thus also influencing the design process. In this case, the PPC would likely increase in subsequent phases, where the focus shifts to the delivery of designs. Thirdly, it might be because weekly sprint meetings were held on Thursdays, though designers and engineers could have still planned their weekly work from Monday to Friday.
A brief overview of the typical reasons for not starting or completing tasks on time is provided next. In general, the reasons for not starting or completing tasks on time can be divided into three categories: (1) client input and decisions (on average 12%, across all three scopes), (2) input from other designers and participants (on average 32.3%, across all three scopes), and (3) reasons related to other design processes (on average 55.7%, across all three scopes). The following are examples of the third category of reasons for delayed start and completion:
  • Design priorities changed.
  • Architectural and interior plans changed (especially at the beginning of the design phase).
  • Initial design solutions changed (e.g., fire safety and structural engineering solutions changed several times).
  • Designers were focused on another project scope.
  • New issues or questions were discovered during the design process.
  • Coordination needs (sizes and locations) of shafts and routes for building services.
  • Designers did not show up to meetings (because they were sick, etc.).
During the study, it was noticed that the dynamics for the three categories of reasons changed during the preliminary design phase. Specifically, the lack of client input and decisions and the input from other designers and participants decreased during the design process, while the other design process-related reasons increased closer to the end of the design phase. This is clearly due to the fact that at the beginning of the preliminary design stage, the focus was on the identification of requirements and the study of design alternatives, while closer to the end of the design phase, the focus was on the delivery of design decisions.
The tasks anticipated (TA) and tasks made ready (TMR) were also measured for the three scopes. Table 4 exposes that the team was able to identify the tasks relatively well (more than 70% on average). In the case of TMR, the average was above 60%. The linear trendline shows, albeit not significantly, that over time the removal of constraints improved. The high average percentage might be explained by the effectiveness with which virtual LPS meetings were prepared, organized, and carried out. From the beginning, attention was paid to identifying task inflows and assigning responsibility to specific individuals for removing constraints.
In the case of WIP, Table 4 shows that it increased closer to the end of the design phase. This could partly explain the low level of PPC and supports the third suggested reason for the low PPC suggested above, that is, that the weekly meetings were held on Thursdays, while the designers and engineers could have planned their weekly work from Monday to Friday. Another explanation for the WIP might be the motivation of the designers to show that they were working hard: intentional WIP to show that they were busy. This behavior is not helpful from the management perspective, as it makes it harder to track actual progress.
Weekly Plan Changes (WPC), a new metric, was introduced to understand how much design process plans change over time. The overall average for weekly plan changes was 42% for all three scopes (Table 4). Changes were often due to the fact that there was no time to complete the task within the initially planned week or that priorities had changed. In the early stages of design, it is also often very difficult to foresee all upcoming tasks. In other words, during the design process, new considerations and aspects were discovered, new tasks had to be added, or some needed to be deleted or moved.
The preliminary design phase for the office building (Sõjakooli 6) was due to be completed by the end of January, and for the apartment buildings and office building (Tondi 57) by the end of March. The team was, in fact, able to deliver the Sõjakooli office building designs on time. After submission, however, the client, together with the construction consultant (involved later in the process), decided to change the cooling solution. In the case of the Tondi apartment buildings and the office building, the submission of designs was delayed by three weeks. The delay was due to changes in the architectural and interior plans for the apartment buildings at the beginning of the preliminary design phase. This happened despite confirmation by the client and the architect that the architectural plans were final. Plans were, in fact, changed, and design changes were iterated by the architect and client over the course of six weeks. In spite of this, the team still managed to deliver the design within a reasonable timeframe.

4.2.3. Evaluation of Digital LPS Whiteboard Intervention

The focus group interview was used to evaluate digital LPS whiteboard practices and usability. At the beginning of the focus group interview, the thirteen participants were first asked to respond to the questions and evaluate the statements on the digital whiteboard. About ten participants actively responded. Participants included one structural engineer, two interior designers, two heating, ventilation, and cooling engineers, one water and sewage engineer, two high voltage electrical engineers, one acoustics specialist, three client representatives, and one design manager. The open-ended questions were then addressed orally to reflect on answers and share additional information. The meeting was recorded.

General Questions

The first question was as follows: “Have you attended the face to face collaborative design planning sessions before?”. Three out of ten (30%) had attended the face-to-face collaborative LPS planning and control meetings. These were the designers and design managers from the lead design company with several years of experience implementing the LPS. The second question was as follows: “How would they rate the virtual pull planning sessions generally?”. All respondents stated that the new approach was rather positive.
The third question was as follows: “What was the most positive aspect of the session?”. Most believed that the approach implemented improved the general overview and understanding of the design process plan and progress across design disciplines. Two respondents, the design manager, and water and sewage engineer, added that the virtual Miro last planner approach improved team engagement and collaboration. The mechanical engineer also added that having all the tasks on the digital whiteboard helped to remember everything that had to be performed. The structural engineer and the two client representatives stated that the meetings were well-organized and effective.
Some answered that meetings took place too often or were too long. Others argued, however, that the scope for planning was large, and the 1.5 h for all three sub-scopes was optimal. Two client representatives added that although the meetings had been recorded, no written memos of the meetings had been prepared. The problem is that if there is a need to review decisions, it is difficult to find relevant information from the recordings. The design manager added that some designers did not show up and had not shared their progress and status information before the meetings.
The fifth question was as follows: “What are your thoughts about the virtual meetings for collaborative planning compared to the face-to-face ones?”. Most responded that the virtual planning sessions helped them save time, as they did not have to travel between meetings, and increased the likelihood of participation. Respondents added that this is important because, unlike construction production engineers, architects and engineering designers work on several projects at the same time, often at different locations. Two respondents also wrote that the meetings were flexible (designers came to the meetings at different times to discuss the agenda points relevant to their work), and when the focus of the meetings was not on their tasks, they were free to work on other things. One client added that although it helped save time, something was missing from digital whiteboard-based communication and interaction that was present in physical meetings.
Finally, the participants were asked the following question: “Was the learning of Miro and Last Planner System a challenge? Why?”. Eight out of ten responded that it was simple and intuitive. Two responded that it took a few weeks to get used to the new way of working. Several stated that using the digital LPS whiteboard was easy because templates had already been prepared by the design managers and researchers. The design managers added that it was easy to update and change templates and plans.

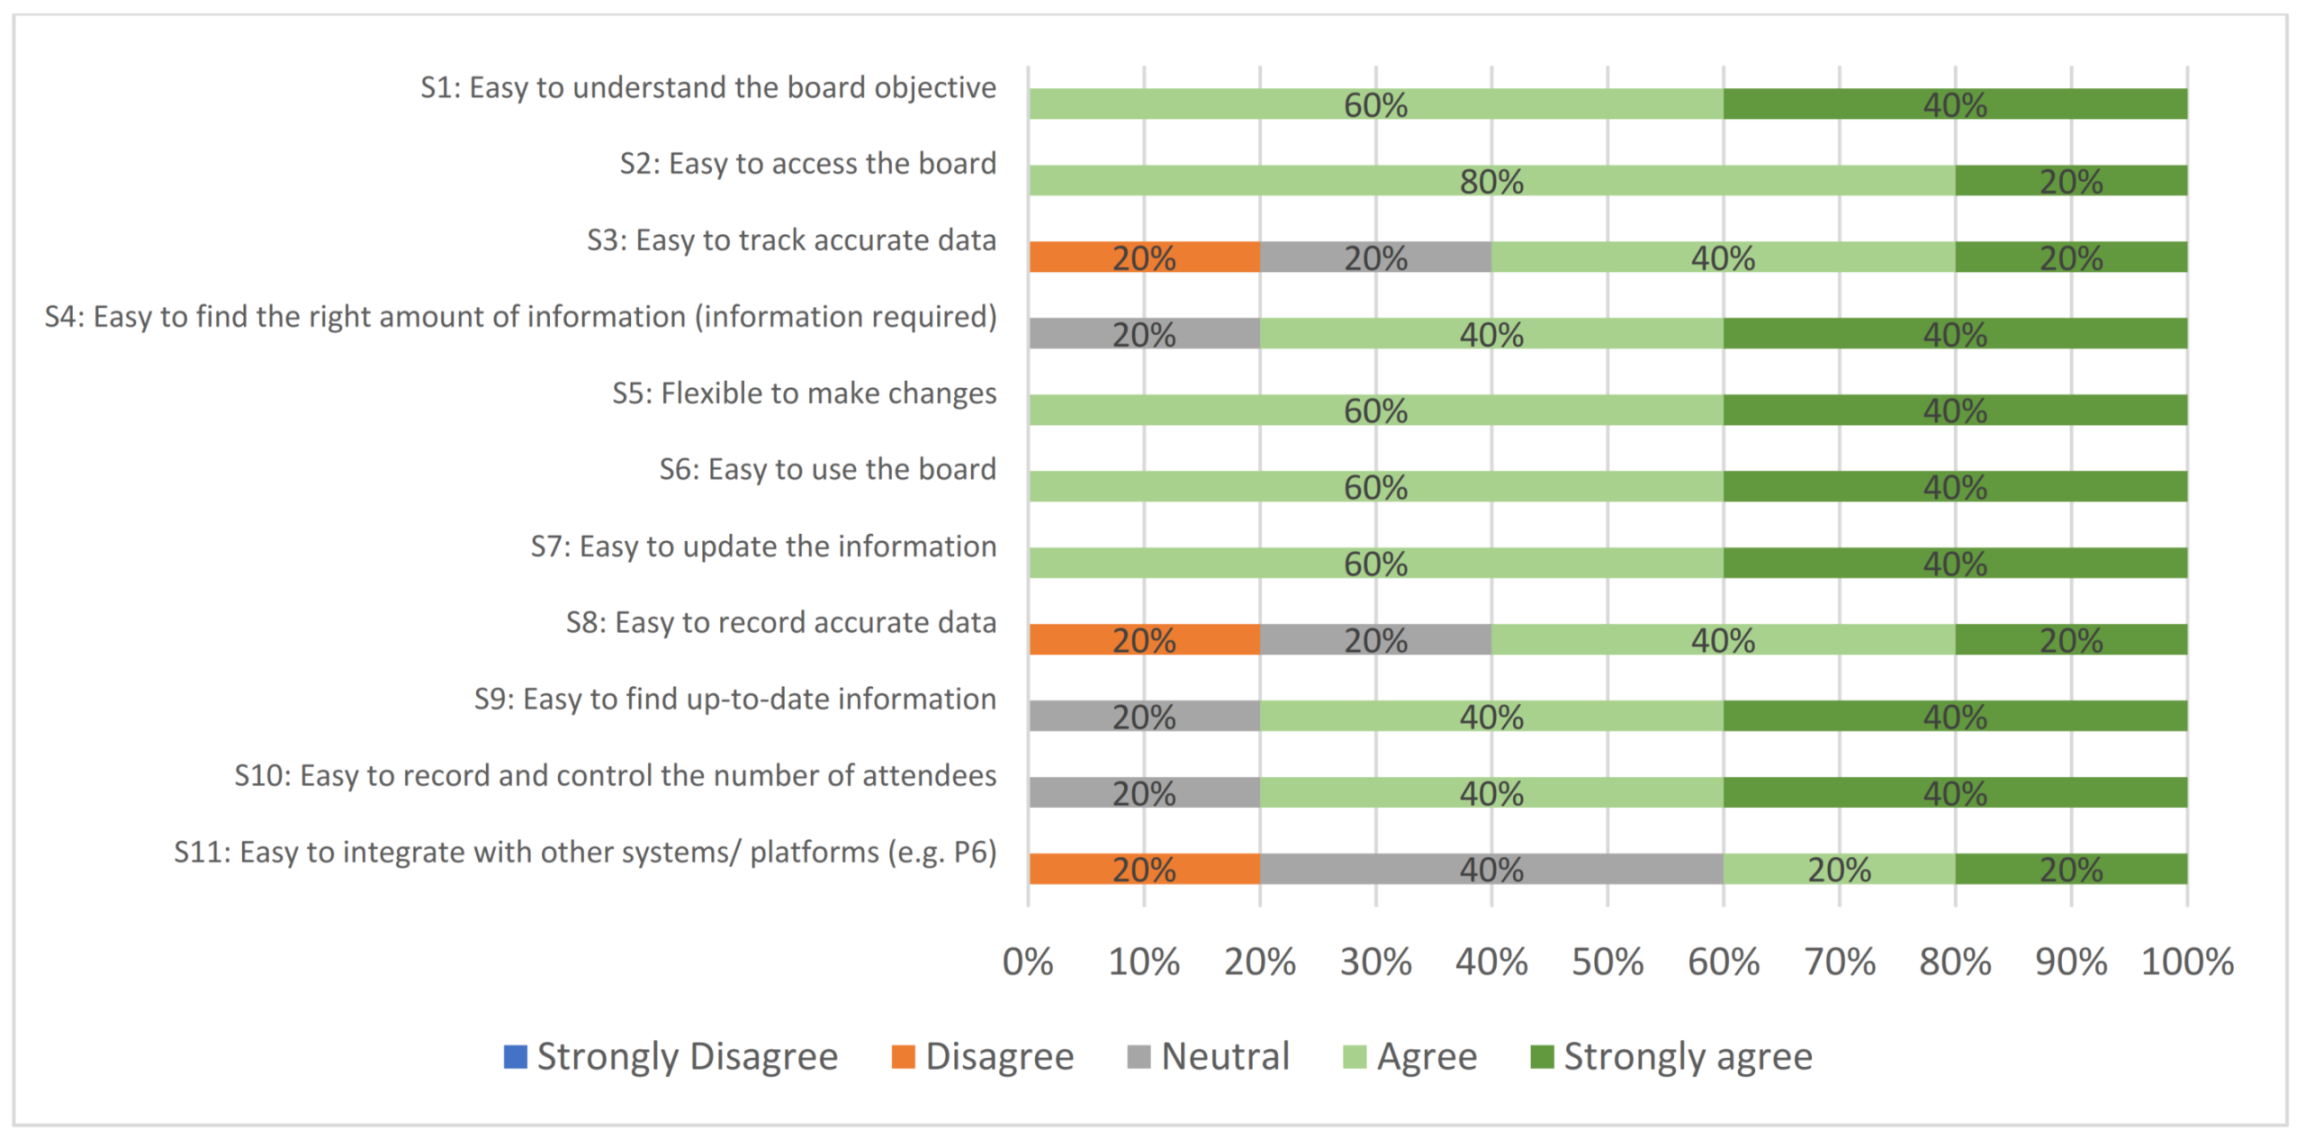
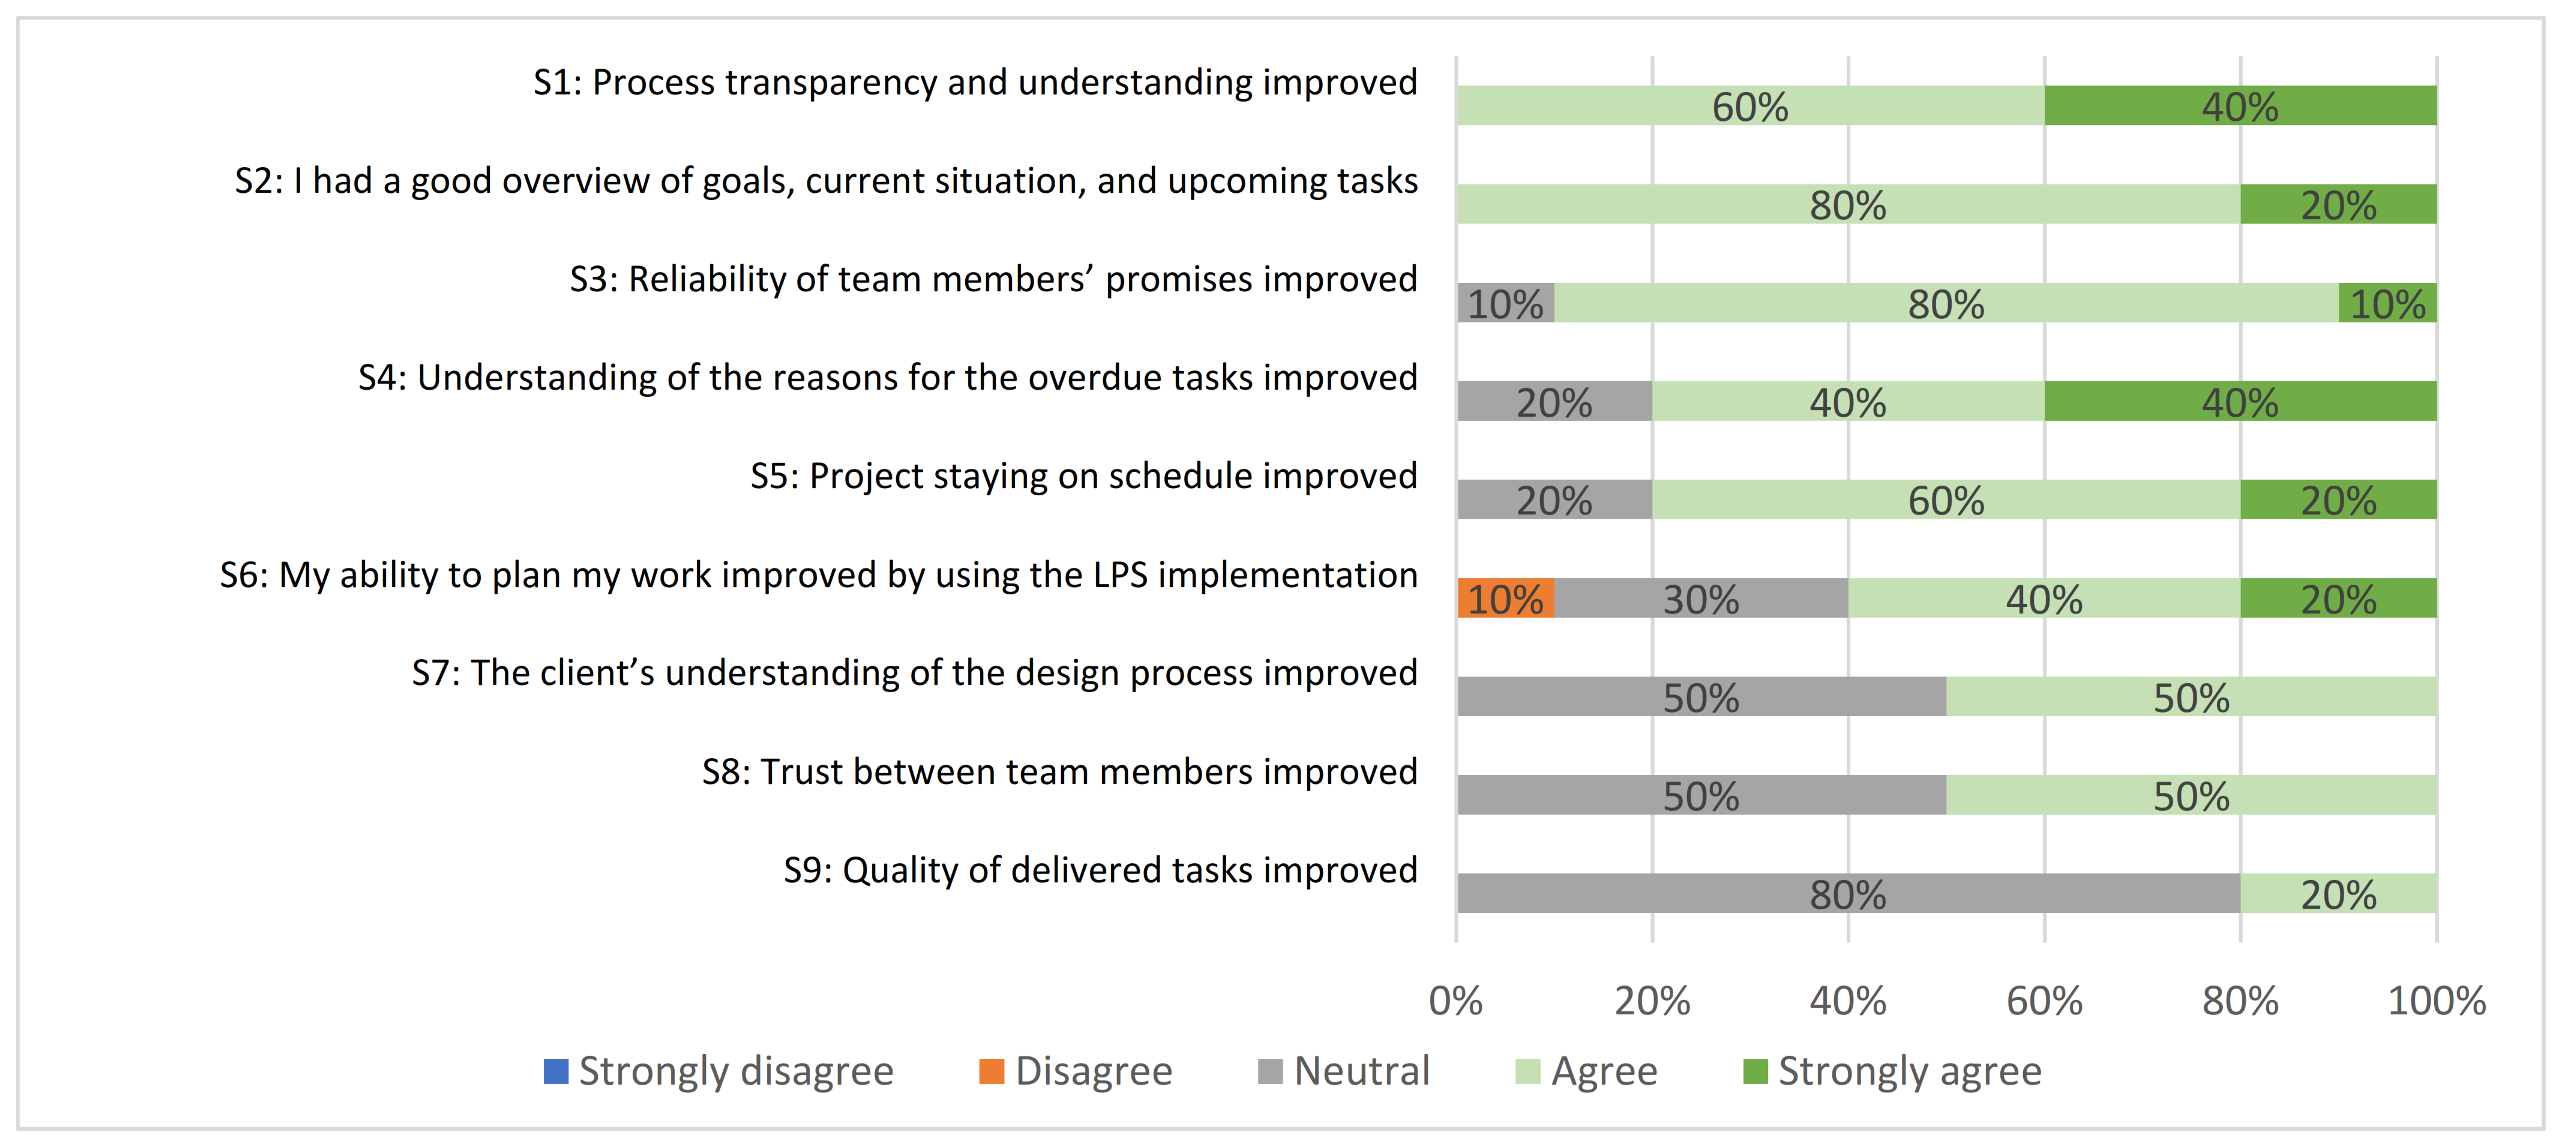
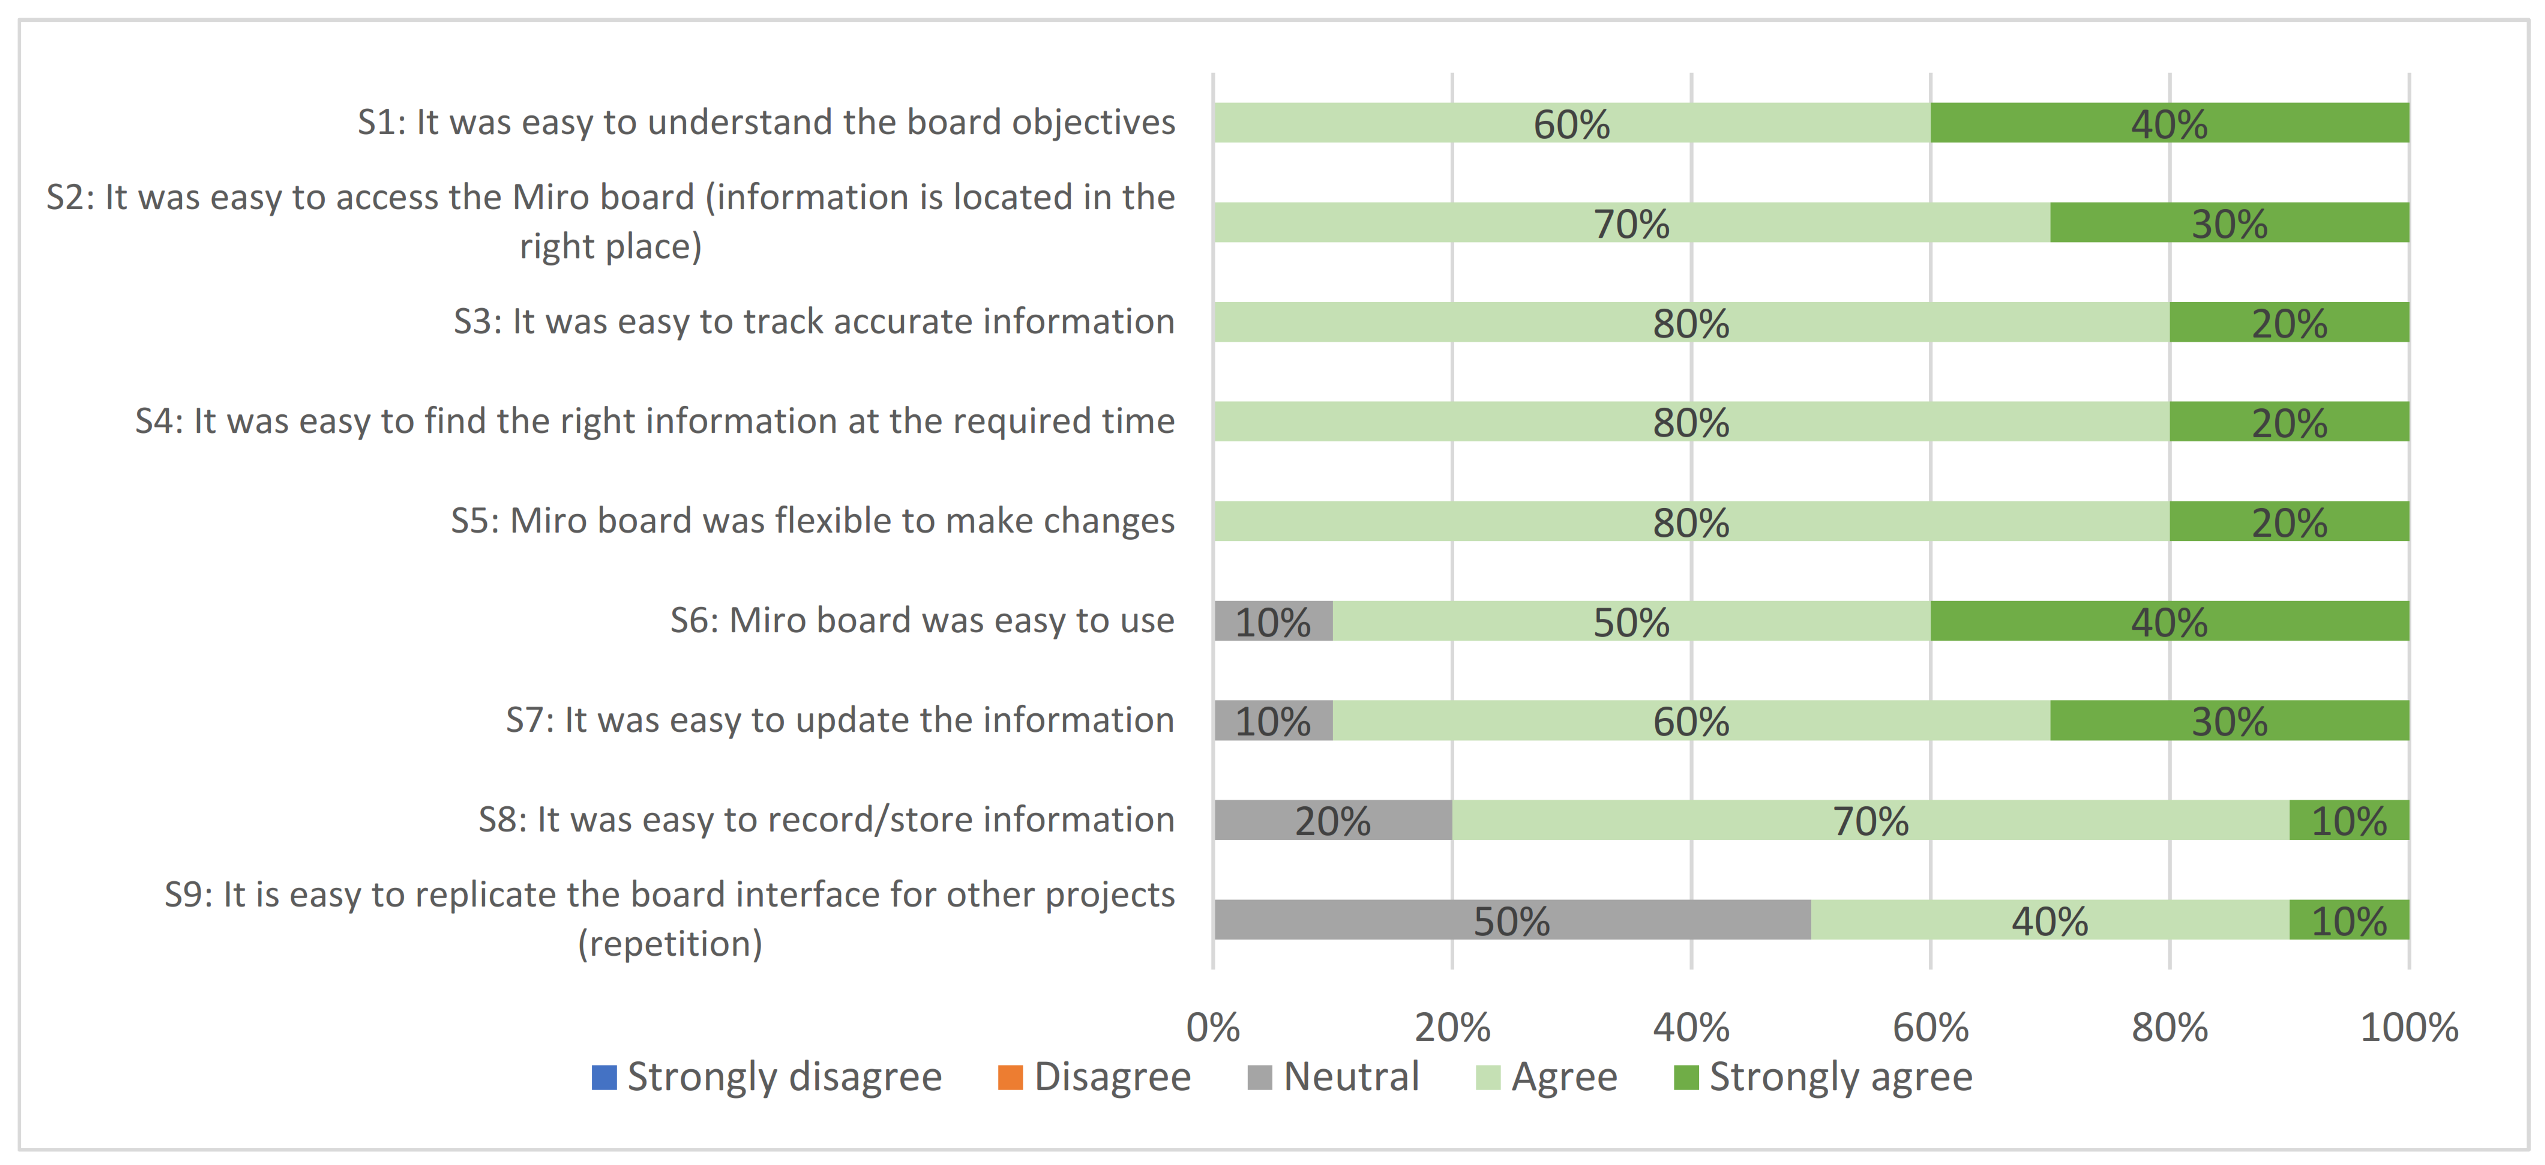
Evaluation of the LPS and Miro Statements

The other three interview sections, (2) LPS, (3) Digital LPS, and (4) Miro Board Content and Structure, listed statements that attendants were asked to evaluate on the 5-point Likert scale (see Research Methods section). Ten people from different disciplines responded to each discipline.
Figure 5 shows the distribution of the responses for the LPS statements. All agreed or strongly agreed that process transparency and understanding (S1) and overview of goals, current state, and upcoming tasks (S2) had improved. In the case of the reliability of promises (S3), the understanding of the reasons for overdue tasks (S4), and the project staying on schedule (S5), one or two respondents remained neutral, and the rest either agreed or strongly agreed with the statements. Half or more were neutral to S7 (client’s understanding of the design process), S8 (trust between team members), and S9 (quality of deliverables), while the others agreed or strongly agreed. In the case of S6 (my ability to plan my work improved), the structural engineer disagreed with the statement, while three were neutral, and the others agreed or strongly agreed. The structural engineer added that the digital LPS meetings helped to plan and coordinate work across disciplines but did not necessarily improve individual planning.
Figure 6 shows the distribution of responses to the Digital LPS statements. Participants agreed or strongly agreed with S1 (meeting structure and focus) and S2 (flexibility of the whiteboard when updating plans) statements. In the case of S3 (engagement and discussion quality), the structural engineer disagreed, and the others either agreed or strongly agreed. Six out of ten either agreed or strongly agreed with S4 (discussions on interdependencies), and the rest were neutral.
Figure 7 shows the distribution of responses to Miro Board Content and Structure statements related to the evaluation of Miro usability. All respondents agreed or strongly agreed with statements S1 to S5. One or two responded neutrally to statements S6, S7, and S8. Five out of ten responded neutrally to S9 (“It is easy to replicate the board interface for other projects”), while the others agreed or strongly agreed. This can be explained by the fact that the designers had no experience implementing the board in other projects.

Discussion and Improvement Suggestions

After each section, respondents were asked to explain their answers orally and make suggestions for improvement of the implementation. The client representative and a few designers commented that the meetings were well-structured and focused. Whenever the focus of discussion turned to design problems or designing solutions, the design managers redirected the focus back to the design process. A separate design meeting for discussing design questions was then added to the schedule on the digital whiteboard.
A few improvement suggestions were made. For example, adding a separate swimlane for meetings was suggested. The reason was that whenever a meeting was scheduled, it was added as a sticky task note to the swimlane of the design manager or discipline responsible for organizing the meeting. It turned out to be challenging, however, to find these meetings later. A separate swimlane for design meetings would make it possible to keep better track of this information.
The acoustics specialist and client representatives brought up another issue. Namely, there were no traditional meeting minutes prepared after meetings, as design managers had decided at the beginning of the project to only record the meetings. The client representative recommended uploading these recordings to the project information management platform and making them accessible to all project members. The client manager also suggested keeping meeting minutes but not the kind of design managers typically prepare. Instead, they should be written in short memo form summarizing the main decisions and events and other related matters.
A similar suggestion came up in connection with another issue related to the scattered and distributed nature of the information that became especially salient during the coronavirus pandemic when many different systems and platforms came into use across different design projects. This led, for example, to information being scattered between emails, Miro, Microsoft Teams, project information and document management systems, etc. Again, it was suggested that design managers prepare a weekly memo/report containing essential information about decisions, events, issues, and progress.
A final suggestion was related to the design and design process and not to the digital LPS meetings. The client representative suggested that designers more actively propose times for presenting and discussing design alternatives, for example, when architects or interior designers are selecting materials or products or mechanical engineers have identified alternative ventilation and cooling solutions. These tasks could be scheduled and added to the digital LPS Miro board. The goal would be to avoid later questions, which can lead to changes.

4.3. Cross-Case Comparison and Main Results

In both cases, a digital LPS whiteboard was implemented to enable and support remote collaborative design projects and process planning and control. The focus, contexts, and approaches of the two cases, however, were different. In the UK case, the company provides infrastructure design services, and the focus of the digital LPS whiteboard intervention was on the design system management. In the Estonian case, the company provides mainly building design services, and the focus of the digital LPS whiteboard intervention was on design operations management. Furthermore, the evaluation approaches and methods were different in the two cases. That is, the cross-case comparison of results is limited and partial but could still be useful for future research planning. The plan is now to coordinate the implementation and evaluation of the digital whiteboard in both countries in new projects in future research.
In the UK case, the focus was on supporting collaborative master and phase planning. The digital whiteboard was used to plan and review master and phase plans, deliverables, constraints, and assumptions. Risks and actions were also identified, assessed, and logged at those meetings. LPS lookahead planning or weekly work planning at the level of design operations was carried out using a spreadsheet and not the digital LPS whiteboard. Both the PPC and the reasons for not starting or completing design tasks were also tracked in the spreadsheet. The digital whiteboard master and phase plans were sometimes used at weekly work planning meetings to support and guide discussions.
In the Estonian case, master and initial phase planning were carried out without the aid of the digital LPS whiteboard. Once the baseline master and phase plans had been established, the team continued their planning work on the digital whiteboard. The focus was then on lookahead and weekly work planning and control of design processes at the operational level. Weekly meetings were recorded, and process performance was measured. Unlike in the UK implementation, neither the master plan nor other elements such as the agenda, constraints, assumptions, risks, and actions were managed on the Estonian digital whiteboard.
Despite the different nature of the cases, the digital LPS whiteboard usability statements in Figure 3, for the UK case, and in Figure 7, for the Estonian case could be compared as the results are quite well aligned. In both countries, respondents either strongly agreed or agreed with whiteboard-related statements S1, S2, and S5 (Figure 3 and Figure 7), while respondents agreed less with statements S3, S4, S6, S7, S8, S9, and S10 (Figure 3 and Figure 7). The explanation might be that these statements evaluated activities that required users to actively interact with the board and its elements, while users may not have had the necessary competencies to interact with the board fluently, or they may not have had any experience using a whiteboard for such purposes.
Next, the benefits and challenges across the UK and Estonian cases are summarized in Table 5. Similar, probably not the same, process management benefits were observed in both cases. For example, it is easy to set up, meetings are focused, engagement and collaboration are increased, process transparency is greater, and it is easy to manage the attention of participants. Other benefits are more case-specific, probably stemming from the fact that two different approaches were taken to the implementation of the digital LPS whiteboard. In the UK case, the similarity of a whiteboard-based LPS to a more conventional physical with well-visualized data was noted. The importance of using a digital whiteboard as a memory aid to help keep track of what has to be performed was explicitly mentioned in the Estonian case.
Table 6 summarizes the challenges encountered in the two cases. Three are similar for both implementations: difficulty developing personal relationships in the digital environment; too many meetings or were too long; lack of IT competencies. Other challenges in the UK case were related to its focus on master and phase planning and additional elements on the whiteboard. Other challenges observed in the Estonian case were related more to operational design process planning and control, for example, the fact that video recordings of meetings poorly supported the tracking and checking of decisions and action items. As in the case of benefits, some of these challenges (e.g., engagement of participants and the shifting focus of meetings) were not directly related to the implementation of the digital-whiteboard-based LPS but rather to how the meetings were prepared, organized, and carried out.

5. Specifying Learning: Interpretation and Lessons Learned

Clarifying and specifying the learning and contribution is the last step in the action research method. This section is divided into two parts: (1) interpretation of the action and evaluation results and (2) key lessons learned presented in the form of good practices when implementing a digital whiteboard.

5.1. Interpretation of Results

The coronavirus outbreak forced construction design companies to consider how to organize and manage remote design work. Digitalization played a key and somewhat inevitable role in support of remote construction design work and collaboration. This was the starting point for this study in both the UK and Estonian cases, with a focus on addressing design process needs [38,39].

5.1.1. General Benefits and Challenges of Digitalization

It is important to clarify the differences between design activities and construction activities. Design mainly involves the processing of information (not necessarily bound by location), while production activities mainly involve physical material (bound by location) [48]. The delivery of construction design projects also requires an ever-growing wealth of knowledge and specialization [19]. Architects and engineers, typically from different companies, must often work on several projects located in different places at the same time. In this setting, digital technologies supporting collaborative design work can help save time and resources.
The ease with which meetings could be set up and organized without the need to travel between meetings was highlighted in both cases. In the Estonian case, designers also stated that virtual meetings were more flexible. This is important because traditional design meetings tend to be lengthy, and not all participants are equally engaged in them. For example, it is easy to divide virtual meetings into time slots and require participation per request (pull participation). Overall, it seems that COVID19 restrictions have made “unnecessary transport” (movement between meetings) and “waiting” (designers sitting idle in meetings) [41,60], key lean wastes, more apparent to designers and design managers. The reduction of unnecessary transportation (movement) and waiting contributes to the U.N. Sustainable Development Goals (as articulated in the description of the special issue): 1—No Poverty; 8—Decent work and Economic Growth; 9—Industry, Innovation, and Infrastructure; 12—Responsible Consumption and Production.
Typical challenges related to digitalization were also observed in both cases. Due to the ease with which meetings could be set up and organized, designers felt that there were too many meetings or that meetings were often too long. Meeting management in the remote design context thus needs to be addressed in future research. Some designers also observed that virtual meetings lacked the social aspects of in-person meetings. It may benefit project teams to begin design work with a physical meeting first. Further, new digital technologies, methods, and procedures can be demanding in terms of expected IT competencies, and an excess of information may quickly overwhelm designers and design managers. Moreover, with a higher dependence on information and communication technologies, IT problems tend to become proportionally more perceptible.

5.1.2. Justifying Digital LPS Whiteboard

Different strategies for establishing and sustaining the flow of information and work in design have been recognized and proposed: e.g., stigmergy (acting on the work accomplished by others) [61] and shared artifacts [5]. The former is common practice and tends to result in partial designs coordinated retrospectively [43]. In the latter case, individual and shared artifacts and objects (e.g., BIM), are used [62] to guide and shape mental and external activities [63] and to support coordination, integration, and collaboration across disciplines [5].
In the case of shared artifacts, the focus in construction design and construction design management research seems to be on the creation and evaluation of a digital means for facilitating efficient communication and enabling coordination of technical systems [26,33,34,35]. Essentially, although examples from a process perspective are given, the focus of theoretical discussions on and the practical development of shared artifacts is on the product being designed [5,33,62,64].
Several new information systems (e.g., vPlanner and VisiLean) have recently been developed that enable and support the implementation of the LPS and VM. These are, however, rather specialized and complicated systems, mainly used to support construction production management. No such information systems have yet been developed or adopted to enable or support construction design process management. There are solutions available, such as ADePT [65] and Plannerly (www.plannerly.com), dedicated to facilitating or supporting construction design management, but they do not support the collaborative and remote implementation of the LPS.
We argue that this is very likely due to the special nature of design activities. First, in design activities, the end state, method, and often even the starting state are not well-known, meaning that the problem, solution [66], audience [67], and process [38] co-evolve. In addition to typical and generic (linear, parallel, location) task dependencies, design tasks may also be mutually interdependent [68,69]: a change in one can bring about changes in another, and the other way around. Design also encompasses significant elements of novelty [70], complexity [71], iteration [72], interpretation [73], and causality [74]. Because of these aspects, designers and design managers “often do not fully understand the processes by which they generate their designs” [75]. As a consequence, it is difficult to manage and execute design processes effectively, especially in the early stages of design.
The above characteristics highlight the important differences between design and construction activities, helping to explain why information systems that support design process management have not yet emerged. They also support the argument put forth by several scholars that design teams are not just designing products but are at the same time also developing and re-developing a shared understanding of the design process [11,38]. In other words, design project delivery systems are both social and technical, where planning is dynamic and hierarchical and involves uncertainty, negotiation, and collaboration when establishing common objectives, considering and evaluating alternatives, and learning from variation [12,38,43].
In this research, the digital LPS whiteboard, as a new digital opportunity, was proposed, developed, and tested in the course of remote design process planning and control. The digital whiteboard-based approach to implementing the LPS was expected to help address design process needs stemming from the design activity characteristics discussed above. It is a flexibility that users need to manage according to their needs, i.e., digital whiteboards are what users make them be. We will soon probably see the emergence of digital whiteboard templates for specific purposes (very much like Excel templates), for example, for LPS virtual sessions. This initial exploratory research is the first step in this direction.

5.1.3. Summative Reflections

The study revealed that digital whiteboard functionality and LPS routines and procedures enabling, directing, or supporting behavior are quite entangled (Figure 8) and sometimes difficult to analyze. Digital whiteboard functionalities support LPS routines and procedures as well as different communication and collaboration objectives. Digital whiteboards also support new useful routines, procedures, and activities, i.e.:
  • Concurrent design processes, planning/re-planning, and problem-solving for establishing and continuously re-constructing a shared understanding,
  • Access to information at any time, place, and device, making it easy to pull information (very much in line with the VM strategy),
  • The use of a common platform for different purposes at the same time (e.g., team and discipline-specific work planning and control),
  • Early identification of deviations and abnormalities,
  • New modes of team communication, collaboration, and visualization with the creation and re-creation of common ground.
High flexibility, though desirable, also poses the main challenge when implementing a digital whiteboard: it becomes difficult to manage behavior, it is easy to overload the whiteboard with information, and there are ownership problems and responsibility issues. Digital whiteboard guidelines and templates for specific purposes, therefore, need to be developed. Further investigation of the entanglement of digital media, the LPS, and human behavior is also needed.

5.2. Lessons Learned

There are two general recommendations for individuals interested in planning, developing, and testing a digital whiteboard for remote implementation of the LPS. Traditional design theories, approaches, and methods for developing artifacts consider function (what the artifact should do) to be the central concept [76]. Here, as the objective is to enable and support remote design planning and control through digitalizing interactions (user to artifact, user to user mediated by the artifact) among design team members, it is recommended to apply the concept of affordance [77]. Affordance theory supports the conceptualization of relationships as links/interactions among users and artifacts, enabling new behaviors or supporting existing ones. This is not possible when users and artifacts are addressed in isolation. In order to operationalize the concept, it is recommended to apply the user story method (used in agile software engineering) to plan artifact scope and interactions. A detailed explanation and description of this method are beyond the scope of this paper (see [78]).
The second main recommendation is to implement the plan-do-check-act method (PDCA) in the project context [11] and continuous improvement cells [79] in an organizational context when planning, developing, and testing the implementation of the digital whiteboard for remote LPS and visual management strategy. These two different approaches are recommended because organization and project needs are different. The PDCA, a well-established practice in lean management, can help project-specific teams learn from variations in the project context, while continuous improvement cells are more useful when supporting continuous improvement beyond projects.
Next, a short list of lessons learned based on experiences from the UK and Estonian cases are presented:
  • Plan and establish the scope of digital whiteboard implementation with the involvement of key people (start small and include more over time).
  • Use, experiment with, and agree on a board and sticky note template.
  • Train and support team members in the adoption of new ways of working in the digital environment.
  • Develop and adopt meeting management practices, regimes, and rules (e.g., limit the attention of participants to a specific area on the digital whiteboard, etc.).
  • Track access to the boards and log weekly versions of board content.
  • Follow an agenda that gives each discipline a chance to speak and interact with the board and other team members.
  • Direct discussions, so they focus on design process planning and control rather than on design issues.
  • Keep records of past meetings, plans, and boards to aid learning.
  • Link and execute the continuous improvement activities necessary for the LPS on the boards.

6. Conclusions

In this exploratory research, an initial trial of a digital LPS whiteboard to enable and support remote collaborative design process planning and control was conducted. Action research was used to plan, carry out, evaluate and discover the main benefits and challenges of the implementation of a digital LPS whiteboard for design process planning and control in the context of remote and distributed design teams. The overall benefit is that the digital LPS whiteboard and visual management strategy rather effectively supported the process perspective of delivering design projects (e.g., transparency, understanding, engagement, flexibility, and continuous improvement). Challenges, on the other hand, were mostly related to excess information and meetings, the social limitations of virtual meetings, and the lack of IT competencies. However, many issues and questions regarding a digital LPS whiteboard remain. Future research is required to further articulate key concepts, constructs, and relationships among them when planning, developing, and testing digital whiteboards in the implementation of the LPS and VM.

Author Contributions

All authors participated in discussions and planning of the research article. E.P. generally wrote and reviewed the paper and content. B.P. contributed with the original text and figures of the UK case description, results, and Figure 8, which were developed through a Knowledge Transfer Partnership (KTP) Project and are associated with B.P.’s ongoing Ph.D. investigations. A.T. contributed to the research background and research method with text and reviewed, edited, and commented on the paper. L.K. reviewed and commented on the paper. M.V. prepared the original table and figures for the Estonian case. All authors have read and agreed to the published version of the manuscript.

Funding

E.P. was funded by the Estonian Research Council, grant number MOBTP1026. B.P., L.K., and A.T. are involved in a Knowledge Transfer Partnership (KTP) project that received financial support from UKRI through Innovate UK, grant number KTP012108.

Institutional Review Board Statement

Not applicable.

Informed Consent Statement

Informed consent was obtained from all subjects involved in the study.

Data Availability Statement

Data available on request from the authors.

Acknowledgments

The authors would like to thank the Estonian and UK design companies and client organizations that graciously provided access to projects and data and thus made it possible to develop this study and the present article. The authors would like to acknowledge the support received from UKRI through Innovate UK (Knowledge Transfer Partnership ID 1026435).

Conflicts of Interest

The authors declare no conflict of interest.

References

  1. WHO. Coronavirus Disease 2019 (COVID-19): Situation Report, 73. Available online: https://www.who.int/emergencies/diseases/novel-coronavirus-2019 (accessed on 6 July 2022).
  2. Wang, B.; Liu, Y.; Qian, J.; Parker, S.K. Achieving Effective Remote Working during the COVID-19 Pandemic: A Work Design Perspective. Appl. Psychol. 2021, 70, 16–59. [Google Scholar] [CrossRef] [PubMed]
  3. Ogunnusi, M.; Hamma-Adama, M.; Salman, H.; Kouider, T. COVID-19 Pandemic: The Effects and Prospects in the Construction Industry. Int. J. Real Estate Stud. 2020, 14, 120–128. [Google Scholar]
  4. Pamidimukkala, A.; Kermanshachi, S. Impact of Covid-19 on Field and Office Workforce in Construction Industry. Proj. Leadersh. Soc. 2021, 2, 100018. [Google Scholar] [CrossRef]
  5. Paavola, S.; Miettinen, R. Dynamics of Design Collaboration: BIM Models as Intermediary Digital Objects. Comput. Support. Coop. Work 2019, 28, 1–23. [Google Scholar] [CrossRef]
  6. Patacas, J.; Dawood, N.; Kassem, M. BIM for Facilities Management: A Framework and a Common Data Environment Using Open Standards. Autom. Constr. 2020, 120, 103366. [Google Scholar] [CrossRef]
  7. Preidel, C.; Borrmann, A.; Tretheway, M. Seamless Integration of Common Data Environment Access into BIM Authoring Applications: The BIM Integration Framework. In eWork and eBusiness in Architecture, Engineering and Construction; CRC Press: Boca Raton, FL, USA, 2017; pp. 119–128. [Google Scholar] [CrossRef]
  8. Boje, C.; Guerriero, A.; Kubicki, S.; Rezgui, Y. Towards a Semantic Construction Digital Twin: Directions for Future Research. Autom. Constr. 2020, 114, 103179. [Google Scholar] [CrossRef]
  9. Kaewunruen, S.; Rungskunroch, P.; Welsh, J. A Digital-Twin Evaluation of Net Zero Energy Building for Existing Buildings. Sustainability 2019, 11, 159. [Google Scholar] [CrossRef]
  10. Sacks, R.; Brilakis, I.; Pikas, E.; Xie, H.S.; Girolami, M. Construction with Digital Twin Information Systems. Data-Cent. Eng. 2020, 1, 26. [Google Scholar] [CrossRef]
  11. Ballard, G.; Tommelein, I. 2020 Current Process Benchmark for the Last Planner® System of Project Planning and Control; Technical Report; Project Production Systems Laboratory (P2SL), University of California: Berkeley, CA, USA, 2021; 111. [Google Scholar]
  12. Dave, B.; Kubler, S.; Främling, K.; Koskela, L. Addressing Information Flow in Lean Production Management and Control in Construction. In Proceedings of the 22nd Annual Conference of the International Group for Lean Construction, Oslo, Norway, 25–27 June 2014; pp. 581–592. [Google Scholar]
  13. Daniel, E.I.; Pasquire, C.; Dickens, G. Exploring the Implementation of the Last Planner® System through IGLC Community: Twenty-One Years of Experience. In Proceedings of the 23rd Annual Conference of the International Group for Lean Construction, Perth, Australia, 29–31 July 2015; pp. 153–162. [Google Scholar] [CrossRef]
  14. Sacks, R.; Barak, R.; Belaciano, B.; Gurevich, U.; Pikas, E. KanBIM Workflow Management System: Prototype Implementation and Field Testing. Lean Constr. J. 2013, 2013, 19–35. [Google Scholar]
  15. Pedó, B.; Brandalise, F.M.P.; Viana, D.D.; Tzortzopoulos, P.; Formoso, C.T.; Whitelock-Wainwright, A. Digital Visual Management Tools in Design Management. In Proceedings of the 28th Annual Conference of the International Group for Lean Construction (IGLC), Berkeley, CA, USA, 6 July 2020; pp. 901–912. [Google Scholar]
  16. Gumienny, R.C. Understanding the Adoption of Digital Whiteboard Systems for Collaborative Design Work. Ph.D. Thesis, Universität Potsdam, Potsdam, Germany, 2013. [Google Scholar]
  17. Fischer, M.; Ashcraft, H.W.; Reed, D.; Khanzode, A. Integrating Project Delivery; Wiley Online Library: Hoboken, NJ, USA, 2017. [Google Scholar]
  18. Abou-Ibrahim, H.; Hamzeh, F. BIM: A TFV Perspective to Manage Design Using the LOD Concept. In Proceedings of the 24th Annual Conference of the International Group for Lean Construction, Boston, MA, USA, 18–24 July 2016; pp. 3–12. [Google Scholar] [CrossRef]
  19. Emmitt, S.; Ruikar, K. Collaborative Design Management; Routledge: Abingdon, UK, 2013; ISBN 0-203-81912-8. [Google Scholar]
  20. Kleinsmann, M.; Deken, F.; Dong, A.; Lauche, K. Development of Design Collaboration Skills. J. Eng. Des. 2012, 23, 485–506. [Google Scholar] [CrossRef]
  21. Knotten, V.; Laedre, O.; Hansen, G.K. Building Design Management—Key Success Factors. Archit. Eng. Des. Manag. 2017, 13, 479–493. [Google Scholar] [CrossRef]
  22. Uusitalo, P.; Seppänen, O.; Peltokorpi, A.; Olivieri, H. Solving Design Management Problems Using Lean Design Management: The Role of Trust. Eng. Constr. Arch. Manag. 2019, 26, 1387–1405. [Google Scholar] [CrossRef]
  23. da CL Alves, T.; Lichtig, W. Integrated Project Delivery: Basic Tenets and Recommendations. In Lean Construction; Routledge: Abingdon, UK, 2020; pp. 162–185. [Google Scholar]
  24. Achten, H.H. Requirements for Collaborative Design in Architecture. 2002. Available online: https://research.tue.nl/en/publications/requirements-for-collaborative-design-in-architecture (accessed on 6 July 2022).
  25. Arroyo, P.; Fuenzalida, C.; Albert, A.; Hallowell, M.R. Collaborating in Decision Making of Sustainable Building Design: An Experimental Study Comparing CBA and WRC Methods. Energy Build. 2016, 128, 132–142. [Google Scholar] [CrossRef]
  26. El-Diraby, T.; Krijnen, T.; Papagelis, M. BIM-Based Collaborative Design and Socio-Technical Analytics of Green Buildings. Autom. Constr. 2017, 82, 59–74. [Google Scholar] [CrossRef]
  27. Zimina, D.; Ballard, G.; Pasquire, C. Target Value Design: Using Collaboration and a Lean Approach to Reduce Construction Cost. Constr. Manag. Econ. 2012, 30, 383–398. [Google Scholar] [CrossRef]
  28. Bølviken, T.; Gullbrekken, B.; Nyseth, K. Collaborative Design Management. In Proceedings of the 18th annual conference of the International Group for Lean Construction, Haifa, Israel, 14–16 July 2010. [Google Scholar]
  29. Ball, L.J.; Christensen, B.T.; Halskov, K. Sticky Notes as a Kind of Design Material: How Sticky Notes Support Design Cognition and Design Collaboration. Des. Stud. 2021, 76, 101034. [Google Scholar] [CrossRef]
  30. Kleinsmann, M.S. Understanding Collaborative Design. Ph.D. Thesis, Delft University of Technology, Delft, The Netherlands, 2006. [Google Scholar]
  31. McDonnell, J. Design Roulette: A Close Examination of Collaborative Decision-Making in Design from the Perspective of Framing. Des. Stud. 2018, 57, 75–92. [Google Scholar] [CrossRef]
  32. Gomes, D.; Tzortzopoulos, P. Metaphors of Collaboration in Construction. Can. J. Civ. Eng. 2020, 47, 118–131. [Google Scholar] [CrossRef]
  33. Çıdık, M.S.; Boyd, D. “Shared Sense of Purposefulness”: A New Concept to Understand the Practice of Coordinating Design in Construction. Constr. Manag. Econ. 2020, 38, 18–31. [Google Scholar] [CrossRef]
  34. Heintz, J. Coordinating Virtual Building Design Teams. In ACCOLADE—Architecture, Collaboration, Design; Delft University Press: Delft, The Netherlands, 2001; pp. 65–76. [Google Scholar]
  35. Idi, D.B.; Khaidzir, K.A.M. Critical Perspective of Design Collaboration: A Review. Front. Arch. Res. 2018, 7, 544–560. [Google Scholar] [CrossRef]
  36. Bucciarelli, L.L. Between Thought and Object in Engineering Design. Des. Stud. 2002, 23, 219–231. [Google Scholar] [CrossRef]
  37. de Vries, M.J. Translating Customer Requirements into Technical Specifications. In Philosophy of Technology and Engineering Sciences; Elsevier: Amsterdam, The Netherlands, 2009; pp. 489–512. [Google Scholar] [CrossRef]
  38. Ballard, G.; Koskela, L. Design Should Be Managed as a Physical Process Too. In Design Theory and Research Methodology, Proceedings of the International Conference on Engineering Design, Palo Alto, CA, USA, 24–27 August 2009; University of Stanford: Stanford, CA, USA; Volume 2, pp. 251–262.
  39. Fujimoto, T. Architecture-Based Comparative Advantage—A Design Information View of Manufacturing. Evol. Inst. Econ. Rev. 2007, 4, 55–112. [Google Scholar] [CrossRef]
  40. Forsberg, K.; Mooz, H.; Cotterman, H. Visualizing Project Management: Models and Frameworks for Mastering Complex Systems, 3rd ed.; John Wiley & Sons: Hoboken, NJ, USA, 2005; ISBN 978-0-471-74674-4. [Google Scholar]
  41. Fosse, R.; Ballard, G. Lean Design Management in Practice with the Last Planner System. In Proceedings of the 24th Annual Conference of the International Group for Lean Construction, Boston, MA, USA, 18–24 July 2016. [Google Scholar]
  42. Hamzeh, F.R.; Ballard, G.; Tommelein, I.D. Is the Last Planner System Applicable to Design? A Case Study. In Proceedings of IGLC17: 17th Annual Conference of the International Group for Lean Construction, Taipei, Taiwan, 15–17 July 2009; pp. 165–176. [Google Scholar] [CrossRef]
  43. Pikas, E.; Koskela, L.; Seppänen, O. Improving Building Design Processes and Design Management Practices: A Case Study. Sustainability 2020, 12, 911. [Google Scholar] [CrossRef]
  44. Tezel, A.; Aziz, Z. From Conventional to IT Based Visual Management: A Conceptual Discussion for Lean Construction. J. Inf. Technol. Constr. (ITcon) 2017, 22, 220–246. [Google Scholar]
  45. Koskela, L.; Tezel, A.; Tzortzopoulos, P. Why Visual Management? In Proceedings of the 26th Annual Conference of the International Group for Lean Construction, Chennai, India, 18 July 2018; pp. 250–260. [Google Scholar]
  46. Galsworth, G.D. Visual Systems: Harnessing the Power of the Visual Workplace; American Management Association: New York, NY, USA, 1997; ISBN 0-8144-0320-4. [Google Scholar]
  47. Formoso, C.T.; dos Santos, A.; Powell, J.A. An Exploratory Study on the Applicability of Process Transparency in Construction Sites. J. Constr. Res. 2002, 3, 35–54. [Google Scholar] [CrossRef]
  48. Koskela, L. An Exploration towards a Production Theory and Its Application to Construction. Ph.D. Thesis, VTT Technical Research Centre of Finland, Espoo, Finland, 2000. [Google Scholar]
  49. Brady, D.A.; Tzortzopoulos, P.; Rooke, J.; Formoso, C.T.; Tezel, A. Improving Transparency in Construction Management: A Visual Planning and Control Model. Eng. Constr. Arch. Manag. 2018, 25, 1277–1297. [Google Scholar] [CrossRef]
  50. Bilalis, N.; Scroubelos, G.; Antoniadis, A.; Emiris, D.; Koulouriotis, D. Visual Factory: Basic Principles and the ‘Zoning’ Approach. Int. J. Prod. Res. 2002, 40, 3575–3588. [Google Scholar] [CrossRef]
  51. Greif, M.; Hamilton, B. The Visual Factory: Building Participation through Shared Information; Routledge: Abingdon, UK, 1991; ISBN 0-203-71911-5. [Google Scholar]
  52. Igarashi, R. The Big Picture. Visual Control Systems; Productivity Press: Cambridge, MA, USA, 1991; pp. 3–12. [Google Scholar]
  53. Tjell, J.; Bosch-Sijtsema, P.M. Visual Management in Mid-Sized Construction Design Projects. Procedia Econ. Financ. 2015, 21, 193–200. [Google Scholar] [CrossRef] [Green Version]
  54. Nicolini, D. Studying Visual Practices in Construction. Build. Res. Inf. 2007, 35, 576–580. [Google Scholar] [CrossRef]
  55. McKay, J.; Marshall, P. The Dual Imperatives of Action Research. Inf. Technol. People 2001, 14, 46–59. [Google Scholar] [CrossRef]
  56. Altrichter, H.; Kemmis, S.; McTaggart, R.; Zuber-Skerritt, O. The Concept of Action Research. Learn. Organ. 2002, 9, 125–131. [Google Scholar] [CrossRef]
  57. Bresnen, M.; Marshall, N. Understanding the Diffusion and Application of New Management Ideas in Construction. Eng. Constr. Archit. Manag. 2001, 8, 335–345. [Google Scholar] [CrossRef]
  58. Bell, E.; Harley, B.; Bryman, A. Business Research Methods; Oxford University Press: Oxford, UK, 2022. [Google Scholar]
  59. Susman, G.I.; Evered, R.D. An Assessment of the Scientific Merits of Action Research. Adm. Sci. Q. 1978, 23, 582–603. [Google Scholar] [CrossRef]
  60. Bonnier, K.E.; Kalsaas, B.T.; Ose, A.O. Waste in Design and Engineering. In Proceedings of the 23rd Annual Conference of the International Group for Lean Construction, Perth, Australia, 29–31 July 2015; pp. 463–472. [Google Scholar]
  61. Christensen, L.R. Practices of Stigmergy in the Building Process. Comput. Support. Coop. Work. 2014, 23, 1–19. [Google Scholar] [CrossRef]
  62. Subrahmanian, E.; Monarch, I.; Konda, S.; Granger, H.; Milliken, R.; Westerberg, A. Then-dim group Boundary Objects and Prototypes at the Interfaces of Engineering Design. Comput. Support. Coop. Work 2003, 12, 185–203. [Google Scholar] [CrossRef]
  63. Poirier, E.A.; Forgues, D.; Staub-French, S. Understanding the Impact of BIM on Collaboration: A Canadian case study. Build. Res. Inf. 2017, 45, 681–695. [Google Scholar] [CrossRef]
  64. Ewenstein, B.; Whyte, J. Knowledge Practices in Design: The Role of Visual Representations as ‘Epistemic Objects’. Organ. Stud. 2009, 30, 07–30. [Google Scholar] [CrossRef]
  65. Austin, S.; Baldwin, A.; Li, B.; Waskett, P. Analytical Design Planning Technique (ADePT): A Dependency Structure Matrix Tool to Schedule the Building Design Process. Constr. Manag. Econ. 2000, 18, 173–182. [Google Scholar] [CrossRef] [Green Version]
  66. Dorst, K. Co-Evolution and Emergence in Design. Des. Stud. 2019, 65, 60–77. [Google Scholar] [CrossRef]
  67. Halstrøm, P.L.; Galle, P. Design as Co-Evolution of Problem, Solution, and Audience. Artifact J. Des. Pract. 2015, 3, 3.1–3.13. [Google Scholar] [CrossRef]
  68. Eppinger, S.D.; Browning, T.R. Design Structure Matrix Methods and Applications; MIT Press: Cambridge, MA, USA, 2012; ISBN 978-0-262-52888-7. [Google Scholar]
  69. Knotten, V. Building Design Management in the Early Stages. Ph.D. Thesis, Norwegian University of Science and Technology, Trondheim, Norway, 2018. [Google Scholar]
  70. Kroll, E.; Koskela, L. Studying Design Abduction in the Context of Novelty; The Design Society: Glasgow, Scotland, 2017. [Google Scholar]
  71. Kleinsmann, M.; Buijs, J.; Valkenburg, R. Understanding the Complexity of Knowledge Integration in Collaborative New Product Development Teams: A Case Study. J. Eng. Technol. Manag. 2010, 27, 20–32. [Google Scholar] [CrossRef]
  72. Wynn, D.C.; Eckert, C.M. Perspectives on Iteration in Design and Development. Res. Eng. Des. 2017, 28, 153–184. [Google Scholar] [CrossRef]
  73. Halstrøm, P.L. Rhetorical Design Studies: The Art of Making Design Choices Explicit. Ph.D. Thesis, The Royal Danish Academy of Fine Arts, Copenhagen, Denmark, 2017. [Google Scholar]
  74. Pikas, E.; Koskela, L.; Seppänen, O. Causality and Interpretation: A New Design Model Inspired by the Aristotelian Legacy. Constr. Manag. Econ. 2021, 40, 507–525. [Google Scholar] [CrossRef]
  75. Wynn, D.C.; Clarkson, P.J. Process Models in Design and Development. Res. Eng. Des. 2018, 29, 161–202. [Google Scholar] [CrossRef]
  76. Maier, J.R.A.; Fadel, G.M. Affordance Based Design: A Relational Theory for Design. Res. Eng. Des. 2009, 20, 13–27. [Google Scholar] [CrossRef]
  77. Maier, J. Affordance Based Design: Theoretical Foundations and Practical Applications; VDM Verlag Dr. Müller: Saarbrücken, Germany, 2011; ISBN 978-3-639-32501-0. [Google Scholar]
  78. Cohn, M. User Stories Applied: For Agile Software Development; Addison-Wesley Professional: Boston, MA, USA, 2004. [Google Scholar]
  79. Tezel, A.; Koskela, L.; Tzortzopoulos, P. Implementation of Continuous Improvement Cells: A Case Study from the Civil Infrastructure Sector in the UK. Prod. Plan. Control 2021, 1–23. [Google Scholar] [CrossRef]
Figure 1. The action research cycle and elements of this study (adapted from [59]).
Sustainability 14 12030 g001
Figure 2. (a) Master plan and related elements as represented on the digital whiteboard and (b) illustration of elements on the digital whiteboard.
Sustainability 14 12030 g002
Figure 3. Distribution of responses related to Mural board usability statements.
Sustainability 14 12030 g003
Figure 4. (a) Overall phase plan and related digital whiteboard elements for the old barracks building and (b) sub-region of the phase plan to illustrate elements on the digital whiteboard.
Sustainability 14 12030 g004
Figure 5. The distribution of responses to the Last Planner System statements.
Sustainability 14 12030 g005
Figure 6. The distribution of responses to Digital LPS statements.
Sustainability 14 12030 g006
Figure 7. The distribution of responses to Miro Board Content and Structure statements.
Sustainability 14 12030 g007
Figure 8. Entanglement of digital media, the LPS, and stakeholder behavior.
Sustainability 14 12030 g008
Table 1. The intervention’s main actions for the UK action research case.
IDResearch Actions From/What/WhoAimProjects
1Participant
observation
1.1. Initial Planning meetingsBasic understanding of the planning and control system, the collaborative definition of the meeting structure (agenda, aim, etc.)1, 2, 4
1.2. LPS planning sessions:
Master and Phase Planning meetings
Understanding the impact of
changes in the planning and control system
1, 2, 4
2Feedback
collection
2.1. Four participants (Project Manager, Discipline Leads)Collection of feedback from users about the virtual LPS sessions (Master and Phase planning) and adoption of the digital whiteboard1, 2
3Workshop 3.1. Practitioners part of the
continuous improvement team
Assessment of the digital whiteboard interface and process-
4The proposition
of digital
whiteboards
4.1. Digital whiteboard interface and new routines developedDevelopment of the digital whiteboard interface and routines in collaboration with company staff1, 2, 3, 4
5Document and
VM devices
analysis
5.1. Planning and control documentation, e.g., Primavera P6 programUnderstanding the project schedule4
5.2. Collaborative digital whiteboard interface analysisAnalysis of digital whiteboards adopted as VM to support collaborative planning sessions1, 2, 3, 4
6Development
of training
materials
6.1. Training material for the LPS implementationDevelopment of a basic understanding of the LPS in the project team-
6.2. Training material and guidance on how to use the digital whiteboardDevelopment of a basic understanding of digital whiteboard adoption in the project team-
7Training sessions-Training sessions introducing the LPS and providing instructions on how to use the board (as described above)1, 2, 4
Table 2. Characteristics of designed buildings.
CharacteristicsApartment Buildings (Tondi 57)Old Barracks (Tondi 57)Old Sauna and Guard Building (Sõjakooli 6)
PicturesSustainability 14 12030 i001Sustainability 14 12030 i002Sustainability 14 12030 i003
Use typeLivingOfficeOffice
Design project typeNew buildRepurposing and renovation Repurposing and renovation
Area under construction, m2 Overground 1569 m2
Underground 1935 m2
1765 m2954 m2
Gross area, m26195 m2
Overground 4258 m2
Underground 1938 m2
4323 m2Currently unknown
Closed net area, m2Currently unknown3585 m21282 m2
Number of floors above and below ground3 above and 1 below ground2 above ground1.5 above ground
Planned design phase durationOctober 2021–March 2022 (6 months)October 2021–January 2022 (4 months)
Table 3. Metrics that were used in the research to evaluate the design process performance.
NrMetricCalculation MethodExampleObjective
1Percentage of Plan Completed (PPC), %PPC = Tasks completed on time/Tasks planned for the sprintPPC = 5 tasks completed on time/10 tasks planned for the sprint = 50%Measures workflow reliability
2Tasks Anticipated (TA), %TA = Tasks anticipated to be committed within the next two weeks/Tasks that can be completed TA = 4 tasks anticipated/(4 anticipated tasks + 2 tasks added during sprint) = 67%Measures the team’s ability to advance the design process
3Tasks Made Ready (TMR), %TRM = Tasks with necessary prerequisites/Tasks planned to be taken on within two weeks TRM = 2 tasks with necessary prerequisites/4 tasks planned to be taken on within two weeks = 50%Measures the team’s ability to identify and remove design task constraints
4Work in Progress (WIP), %WIP = Tasks started during the sprint but not completed/Planned sprint tasksWIP = 3 tasks started during sprint, but not completed/10 tasks planned for sprint = 30%Measures work in progress
5Weekly Plan Changes (WPC), %WPC = (Tasks added during sprint planning + postponed tasks)/Tasks planned for the sprint WPC = (3 tasks added + 4 tasks postponed)/10 tasks planned for the sprint = 70%Measures plan changes relative to the previous version
Table 4. Summary of process performance for the three scopes.
MetricAverageLinear AscentInitialFinalDifference
Tondi 57 Apartment Buildings
Percent Plan Complete (PPC), %38%−0.001940%35%−5%
Tasks Anticipated (TA), %72%0.000775%76%1%
Tasks Made Ready (TMR), %78%0.011168%88%20%
Work in Progress (WIP), %35%0.013918%52%34%
Weekly Plan Changes (PCS), %41%0.004235%46%11%
Tondi 57 Office Building
Percent Plan Complete (PPC), %31%−0.004937%25%−12%
Tasks Anticipated (TA), %73%−0.002775%70%−5%
Tasks Made Ready (TMR), %67%0.00364%70%6%
Work in Progress (WIP), %28%0.006120%35%15%
Weekly Plan Changes (PCS), %47%0.011134%60%27%
Sõjakooli 6 Office Building
Percent Plan Complete (PPC), %17%0.004914%20%6%
Tasks Anticipated (TA), %76%0.016270%82%11%
Tasks Made Ready (TMR), %77%0.00276%78%1%
Work in Progress (WIP), %25%0.03574%47%43%
Weekly Plan Changes (PCS), %38%0.017128%48%21%
Table 5. Benefits in the UK and Estonian cases.
BenefitsUK CaseEstonian Case
Easy to organize meetings, no need to travel, and flexibility from the participant’s perspective++
Meetings well focused++
Increased team engagement and collaboration ++
Better process overview, transparency, and understanding ++
Easy to create, update and manage whiteboard templates and standards++
Easy to learn and use the digital whiteboard ++
Easy to manage participants’ attention in meetings++
The whiteboard based LPS similar to the traditional LPS +
Well-visualized design planning and control data +
Reminder of things to be performed (memory aid) +
Table 6. Challenges in the UK and Estonian cases.
ChallengesUK CaseEstonian Case
Difficult to develop personal relationships in the digital environment++
Too many or long meetings++
Lack of IT competencies ++
Not all meeting participants were always equally involved and engaged+
Information overload and getting lost on the digital whiteboard+
When compared to the physical LPS, more time is needed to insert information+
Technology issues (e.g., interoperability)+
The meeting focus shifted from planning to designing and problem-solving +
Difficult to track and check decisions, actions items, etc. from videos +
Publisher’s Note: MDPI stays neutral with regard to jurisdictional claims in published maps and institutional affiliations.

