Article

Air Quality and Thermal Environment of Primary School Classrooms with Sustainable Structures in Northern Shaanxi, China: A Numerical Study

1
School of Humanities, Xi’an Shiyou University, Xi’an 710065, China
2
School of Human Settlements and Civil Engineering, Xi’an Jiaotong University, Xi’an 710049, China
*
Author to whom correspondence should be addressed.
Sustainability 2022, 14(19), 12039; https://doi.org/10.3390/su141912039
Submission received: 11 August 2022 / Revised: 30 August 2022 / Accepted: 20 September 2022 / Published: 23 September 2022
(This article belongs to the Special Issue Ventilation and Indoor Air Quality in Sustainable Buildings)

Abstract

:
In northern Shaanxi, China, the air quality and thermal insulation properties of primary school classrooms should be given more attention due to the relatively low temperatures in the winter, which are significant to the learning processes of students in classrooms. Some sustainable building measures have been designed and constructed to improve the air quality and thermal comfort of classrooms in this region; however, is still unclear how these measures influence air quality and temperature. This study investigated the indoor air quality and thermal environment of a typical primary school classroom in Yulin city, Shaanxi Province, China. The classroom was characterized by sustainable structures, including double-sided corridors and an underground ventilation pipe, for better thermal insulation. By conducting on-site monitoring in the classroom and performing various numerical simulations based on finite element software, the variations in the indoor air quality (carbon dioxide, water vapor concentration) and temperature over time, and under different conditions, were investigated. Moreover, influences (i.e., of corridors, ventilation pipes, window areas, classroom areas, and the number of students) on the air quality and temperature were analyzed. It was proven that double-sided corridors, underground ventilation pipes, and windows with heights/widths equaling 1 could provide energy-efficient and livable building structures for primary school classrooms in the northern Shaanxi region of China.

1. Introduction

Indoor air quality and thermal environments are two basic and important needs for students who study in classrooms, as students spend a lot of their time in these classrooms, increasing their knowledge and skills [1]. Student performances are directly linked to the indoor environmental quality and indoor comfort domain [2]. There is a correlation between a classroom’s air quality (i.e., elementary and secondary school classrooms) and learning outcomes [3]. Previous studies have indicated that indoor air quality and the thermal environment in primary school classrooms are not in accordance with the actual requirements of students [4]. This has resulted in adverse influences on the learning processes of students in classrooms [5]. An increase in CO2 concentrations can result in impaired attention spans, concentration loss, and tiredness [6]. In addition, a series of studies have found a direct relationship between poor indoor air quality in the classroom and the health problems of students [7]. It has been reported that children exposed to high levels of air pollution suffer from increases in respiratory diseases [8]. Moreover, pupils exposed to air pollutants in school buildings could experience severe health damages [9].
The ventilation conditions of school classrooms affect the air quality and thermal environment [10]; thus, various studies have been conducted through field monitoring, questionnaires, model tests, and numerical simulations. For instance, Stabile et al. [11] evaluated the influences of different ventilation/airing strategies on both indoor air quality and energy consumption in high-energy-demanding naturally-ventilated classrooms; the air quality was assessed in terms of indoor CO2 concentrations but energy consumption was evaluated through the asset-rating approach. Chatzidiakou, et al. [12] compared energy, ventilation performances, and the levels of pollutants in six school classrooms; they concluded that increased ventilation rates may mitigate overheating, and improve satisfaction with indoor air quality. Saif, Wright, Khattak, and Elfadli [5] analyzed a ventilation and cooling system for classrooms using a wind catcher for natural ventilation and evaporative cooling; they found that a wind catcher with evaporative cooling reduced energy use by 52% during the summer months and increased the comfortable hours from 76% to 100% without any supplementary air conditioning. Stazi et al. [13] investigated the relation between window use and environmental stimuli in an Italian classroom, and they concluded that indoor temperature was the best predictor for window opening and closing. Karimipanah et al. [14] investigated an indoor environment in the classroom using a confluent jet ventilation experimental setup and CFD numerical simulation; the effects of the ventilation, air exchange, flow rate, and radiation were analyzed. Liu et al. [15], via a field survey, studied the thermal comfort of students and air quality in naturally ventilated classrooms; the results demonstrated that the students’ acceptability of indoor air quality was mainly affected by thermal sensations. Ghaffarianhoseini et al. [16] used ENVI-met software to simulate the thermal performances of courtyards in the hot and humid climate of Kuala Lumpur, Malaysia, and stressed that only well-designed courtyards may represent a valid option for sustainable built environments. Calautit et al. [17] adopted numerical modelling, wind tunnels, and far-field testing to study the thermal comfort and indoor air quality of buildings ventilated with a passive cooling windcatcher during the summer. It was recommended that further analysis of the spatial distribution of temperature and carbon dioxide in a room with different geometries be conducted.
As indicated above, to date, research studies regarding the thermal environment and air quality (in diverse indoor spaces) have focused on naturally ventilated classrooms in different climate zones across the world. The investigations on thermal comfort and air quality in buildings are given more attention in dry climates and moist continental climates [15,18]. However, in cold climate zones, research studies regarding thermal comfort and air quality on cold days in natural ventilation spaces are rare.
The northern Shaanxi region of China is located on the Loess Plateau; it is in a cold region [19]. Temperatures in this area are cooler in the winter and moderately cool in the summer. In the process of classroom designing, the focus should be given to the thermal insulation of buildings in the winter. However, due to unreasonable building models, poor heat transfer performances of building envelopes, and weak air tightness of buildings, it is difficult to reach the ideal temperature in the indoor environment. Moreover, in the winter, the doors and windows are closed for a long time, and there is a lack of building ventilation and circulation systems [20]. The indoor air circulation is not smooth, and it is difficult for fresh air to enter the room in time. The air quality is poor, which seriously threatens the physical and mental health of teachers and students. Given those concerns, corridors and ventilation pipes have been proposed/constructed in classrooms to maintain the temperature in the winter and provide fresh air [21,22]. However, it is still unclear as to how these measures improve insulation and air quality in the classroom. In addition, the association between the opening (for ventilation) and closing (for insulation) of windows in the newly-designed classroom in this region is worthy of discussion.
In this study, sustainable structures for primary school classrooms in Yulin city, Shaanxi, China, were designed to ensure the thermal environment and improve the air quality in the classroom. The sustainable structures mainly involved double-sided corridors and underground ventilation pipes. A typical classroom was selected to study and analyze the effects of such a design. The CFD simulation technique combined with on-site monitoring was used to study the indoor air quality and thermal environment of the classroom. By establishing a numerical model of indoor air environment quality in typical classrooms, the influences of parameters (e.g., corridors, ventilation pipes, window status/areas, classroom areas, and the number of students) on the air quality and temperature distribution in classrooms were analyzed. The reasonable building structure, measures for insulation, air quality improvement, and the opening frequencies of the window, were also discussed. We concluded that setting double-sided corridors, underground ventilation corridors, and windows with heights/widths equaling 1 could provide an energy-efficient and livable building structure. The sustainable structure, related design, and the results in this study can provide useful references for the design of primary school classrooms in regions with similar climate conditions in this case.

2. Materials and Methods

2.1. Case Description and Measuring Method

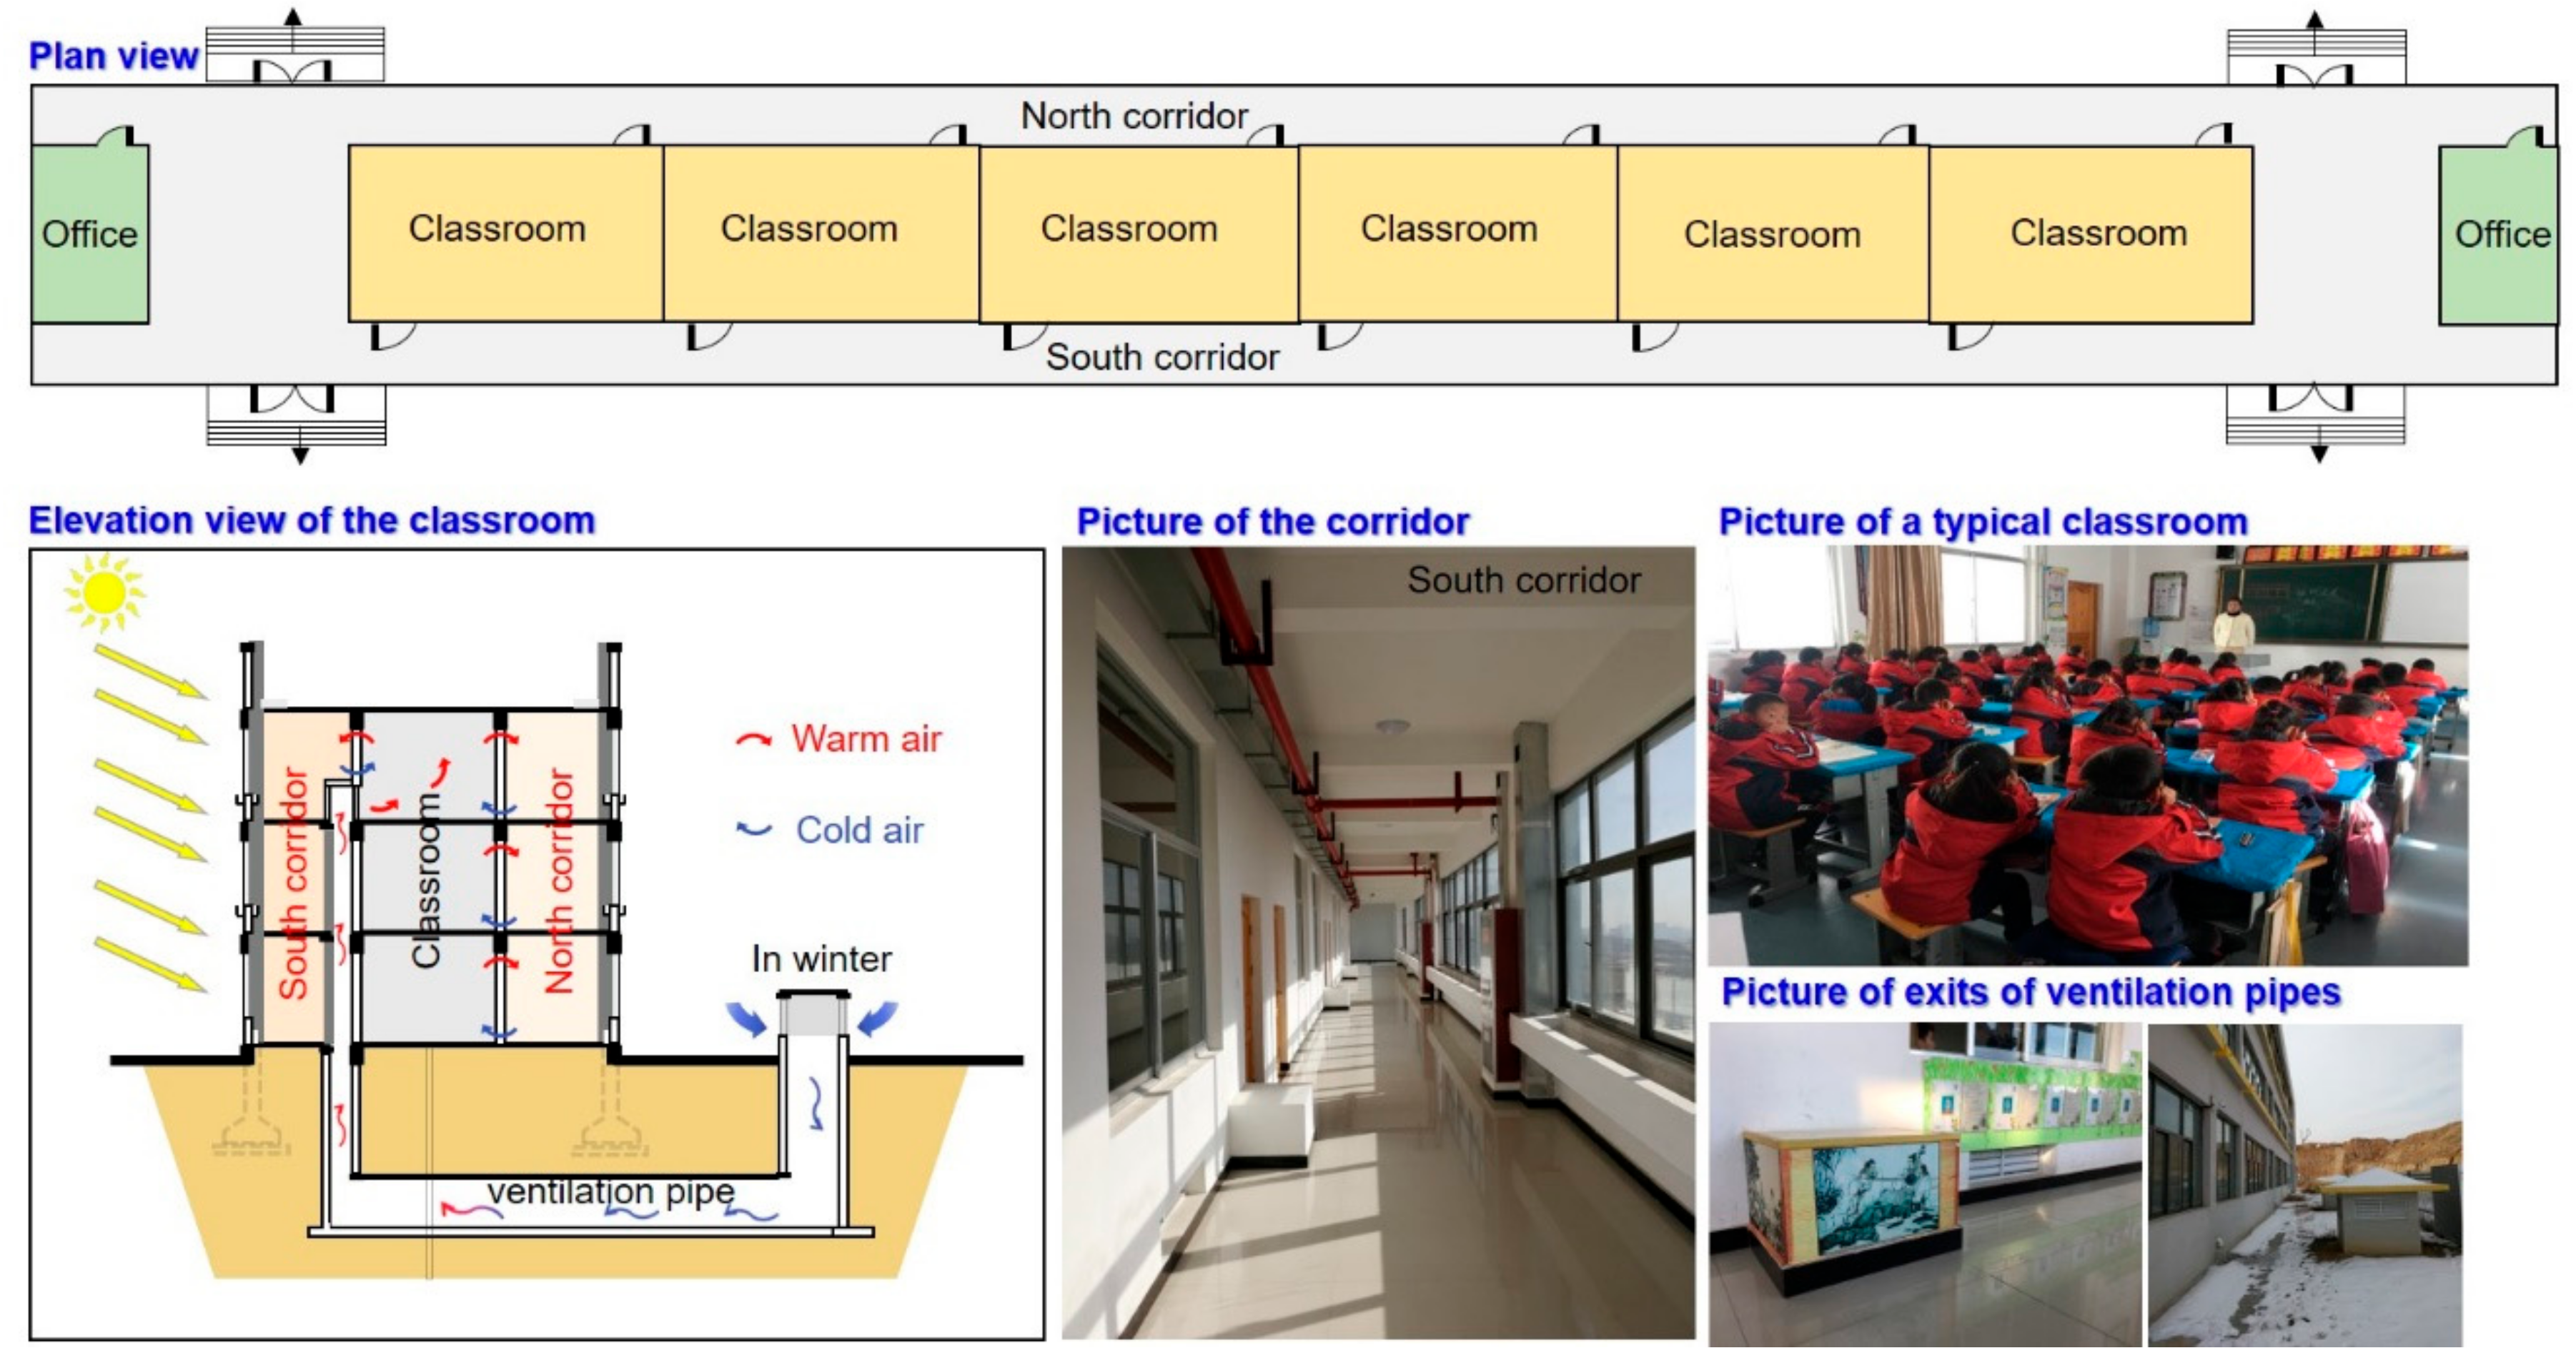
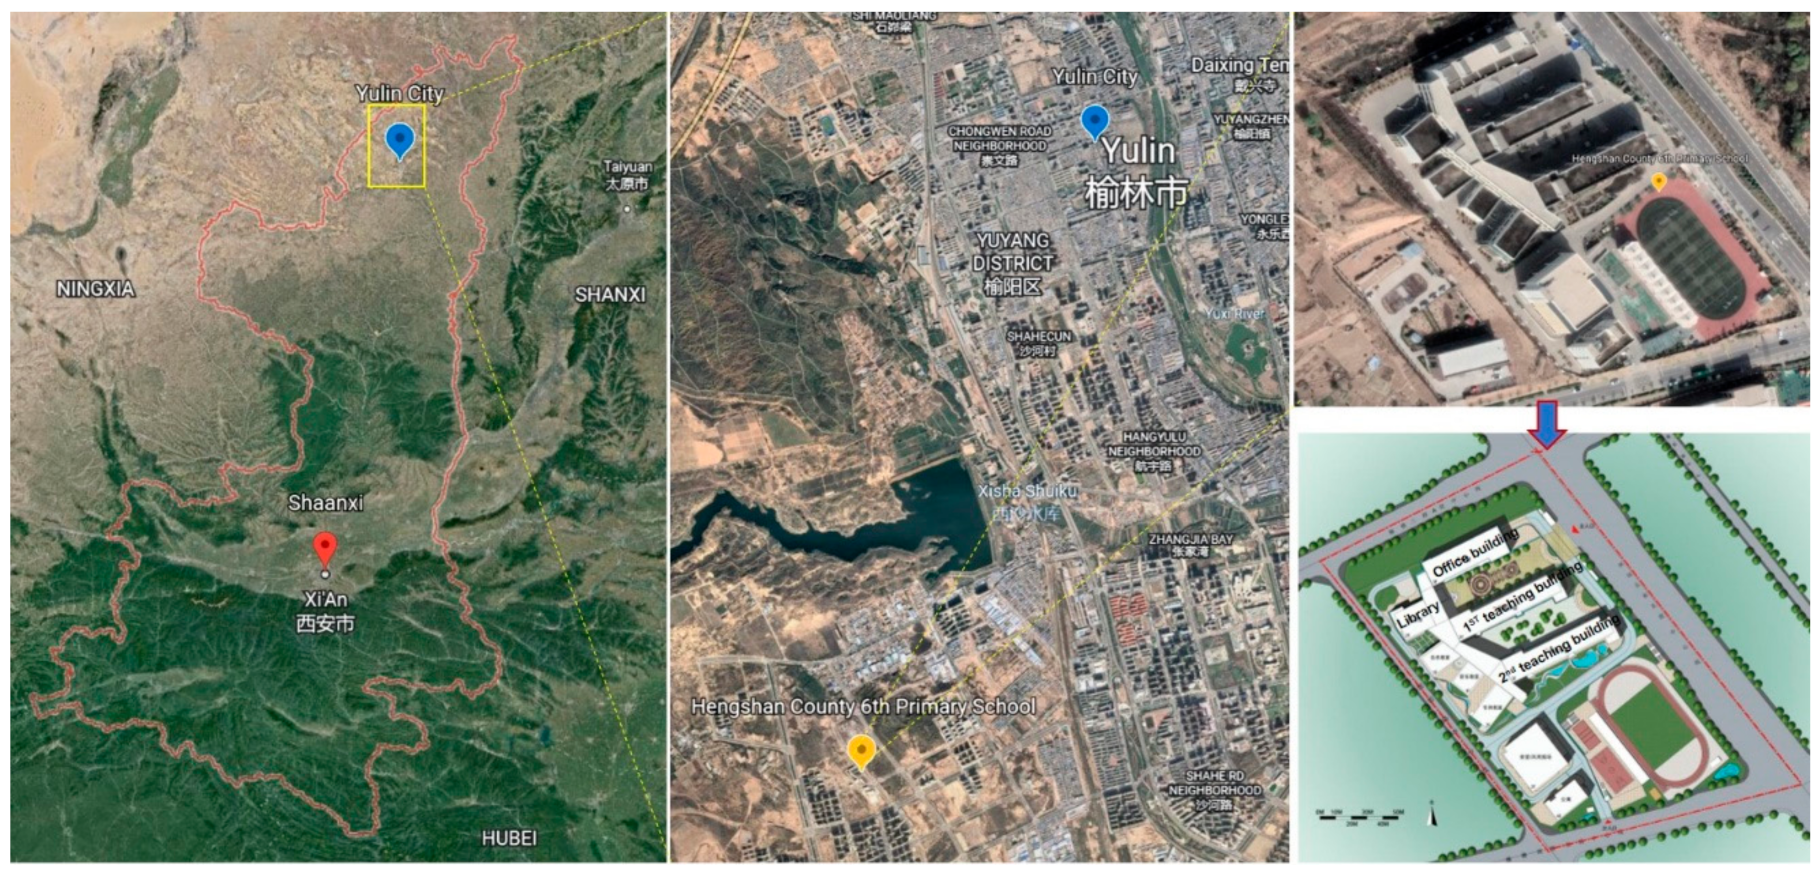
2.1.1. Background and Study Case

The Hengshan County 6th primary school (the research case of our study) is located in Yulin City, Shaanxi Province, China. As shown in Figure 1, the school includes two teaching buildings and one office building. According to local meteorological data from China’s Meteorological Data Service Center (http://data.cma.cn/en (accessed on 10 June 2020)) [23], the average temperature in Yulin can only meet the thermal environment requirements in July and August, while the temperatures from October to March (of the next year) will be below 10 °C. The temperature in this region is relatively low for a long time. For the classroom in the school, some insulation measures are required to maintain the temperature and to create a better study environment for the students. The distribution of sunshine in this area is even and the total amount of sunshine throughout the year is rich, with an annual average solar radiation of about 1500 kWh/m2.
To fully utilize the sunshine in this area, the teaching buildings in this school were designed with double-sided corridors in both south and north, as shown in Figure 2. The corridors were designed sealed with glass so that they ensure lighting and warmth under the sunshine in the winter. The area of each classroom is 9.8 m in length, 7.9 m in width, and the height of each classroom is 3.9 m (the maximum distance from the classroom floor to the top). The classroom was designed to have two doors, which face the north and south corridors, respectively. The width of the door is 1 m, and the height is 2.5 m. In addition, the classroom has two large windows and one small window on both the north and south sides, respectively, for better ventilation conditions. The width and height of the large window are both 2.1 m, and the distance from the window bottom to the ground is 0.4 m; while the width and the height of the small window are 0.9 and 2.1 m, respectively, with a corresponding distance to the ground of 0.4 m. The material of the windows adopts ordinary insulating glass, and there are no substances filled. According to its design, the average value of daylighting coefficient is about 9.42%, all of which are greater than 3%. The average value of daylighting illumination is about 2544.42 lx, and 99.97% of the area is above 900 lx.
To achieve the goal of energy saving, underground ventilation pipes were designed and installed in the teaching building, and the ventilation pipe connects the outdoors and the classroom, as shown in the elevation view of the classroom. During the winter, the cold fresh air can enter the pipe from the outdoor side and gradually becomes warm due to the underground thermal energy, and finally, the fresh and warm air enters the classroom, which provides relatively warm fresh air for a better study environment in the classroom, as illustrated in Figure 2. Conversely, during the summer, the hot fresh air in the outdoor becomes cool fresh air through the underground ventilation pipe and enters the classroom for a better study environment.

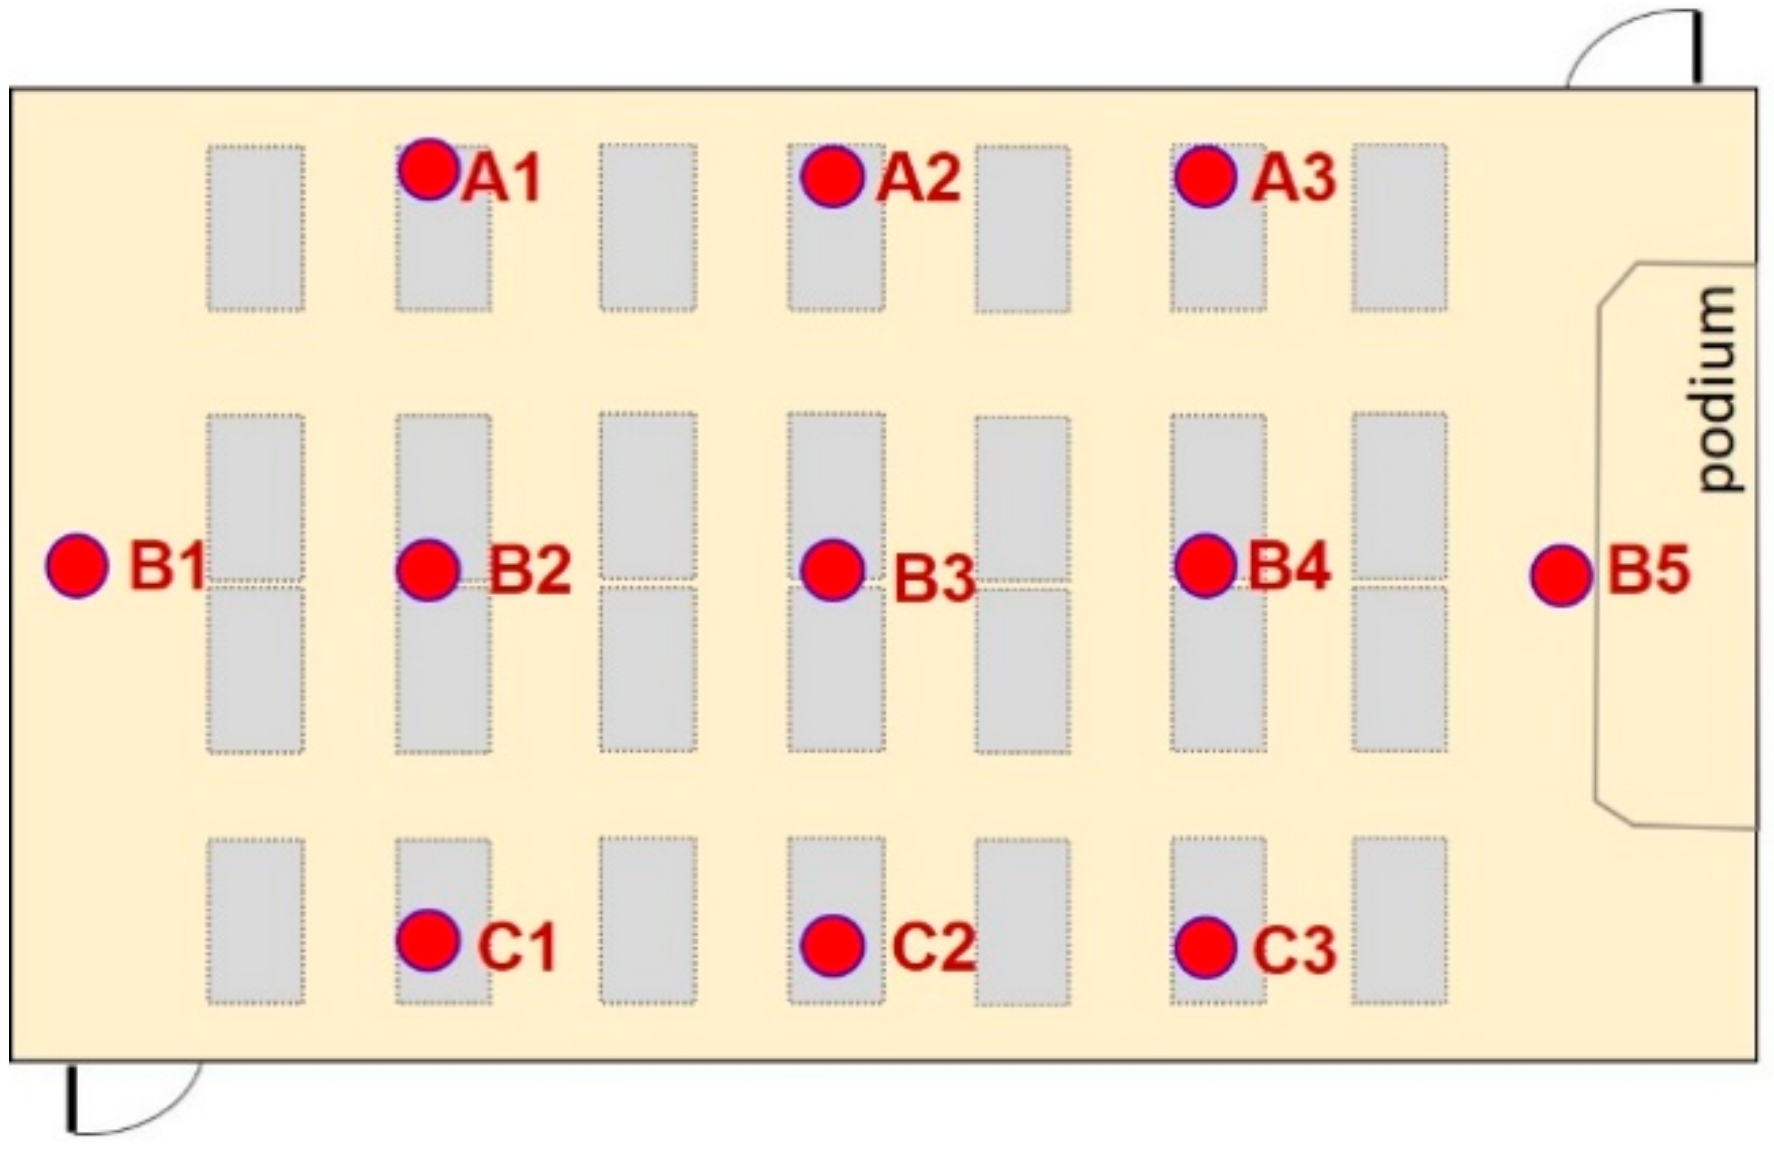
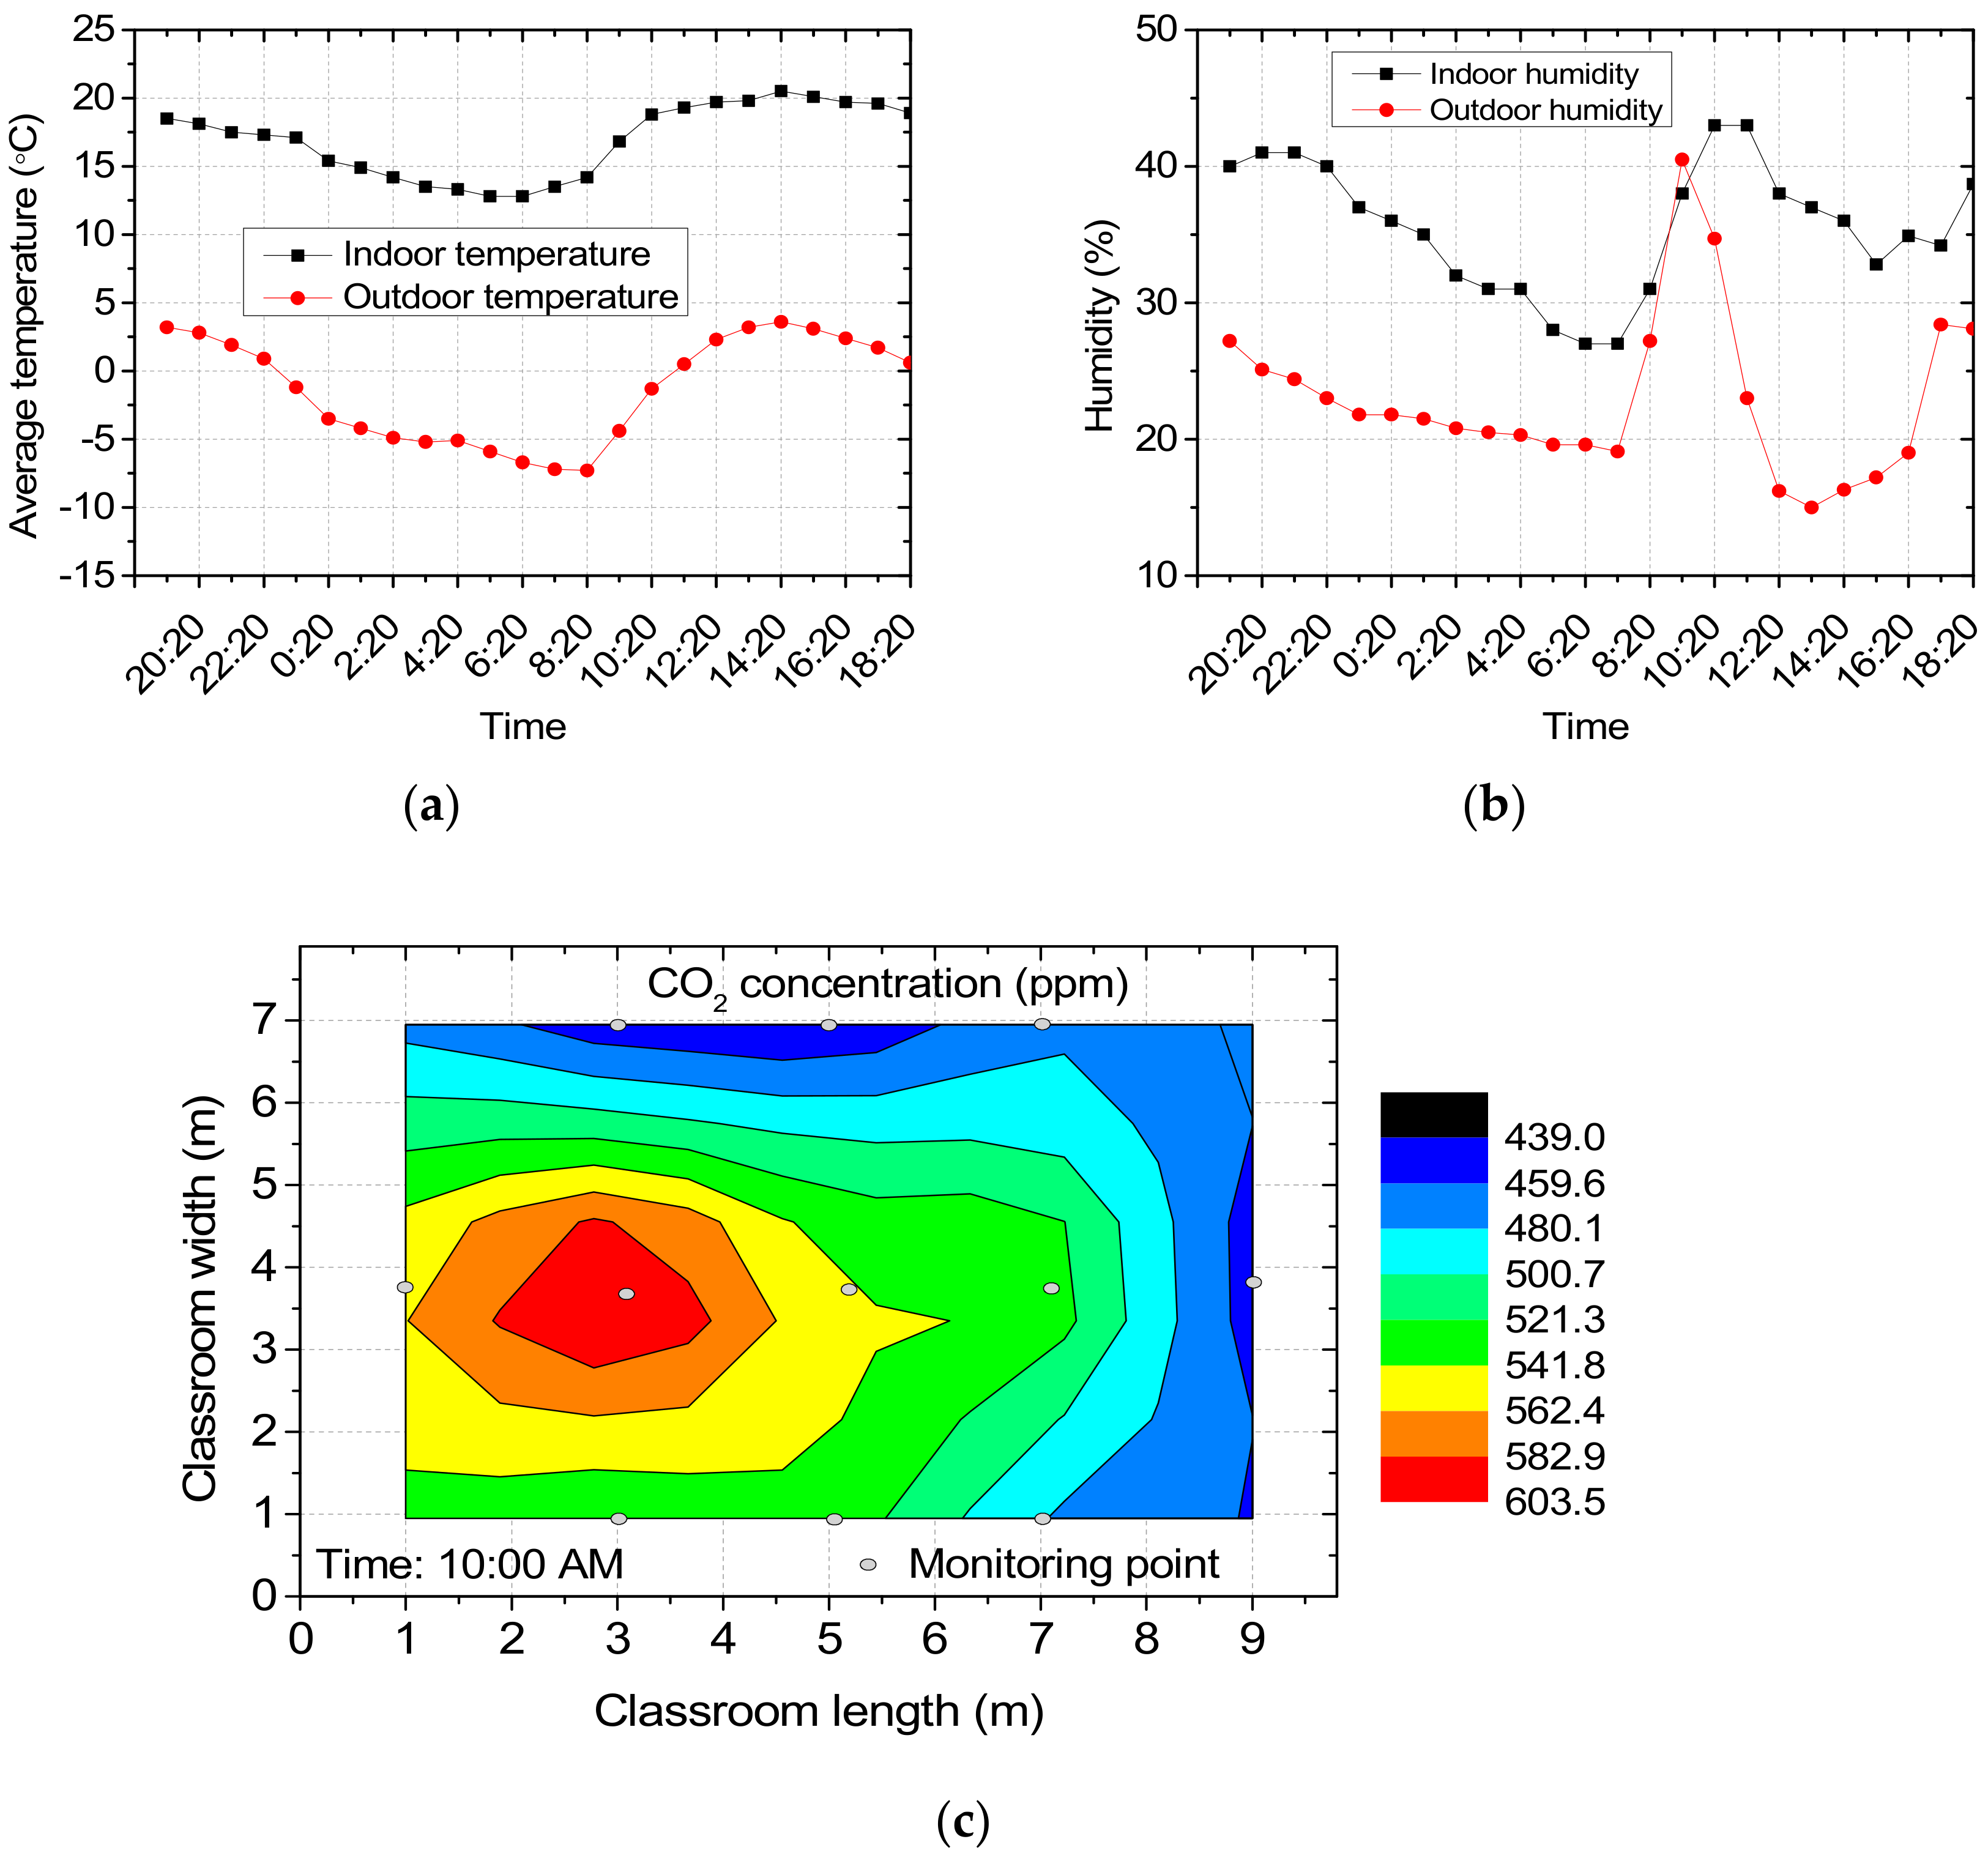
2.1.2. Test Method and Monitoring Results

To investigate the air quality and thermal environment and examine the rationality of the design, a typical classroom was selected to conduct monitoring; the classroom is in the middle of the second floor in the 1st teaching building of a primary school. A total of 10 monitoring points were arranged in the classroom, and the detailed layout of the monitoring points is presented in Figure 3. The self-recording temperature and humidity meter were used to record the temperature and humidity conditions of the exterior and interior walls of the classroom, in the coldest seasons from December to January. The carbon dioxide concentrations in the classroom were also measured five times a day, i.e., at 8:00, 10:00, 12:00, 15:00, and 17:00, on these monitoring points. The height of the measuring points was approximately equal to the height of the breathing line (about 850–1000 mm) when the students were sitting in the classroom.

2.2. Numerical Model and Simulation Scenarios

2.2.1. Governing Equations and Numerical Implementation

The numerical simulation in this study was conducted based on the computational fluid dynamics (CFD) technique. The RANS simulation is described using a 3D, fully-turbulent, and incompressible flow; the modeling of the turbulent nature of the flow was conducted using the k-ω model, which solved the turbulent kinetic energy, k, and the dissipation per unit turbulent kinetic energy, ω [24]. The k-ω model can give results that are superior to those obtained with the k-ε model in some studies [25,26,27]. The governing equation for the turbulent motion of air is given as
ρ u = 0
ρ u t + ρ u u = p I + μ + μ T u + u T + F + ρ g
ρ C p T t + ρ C p u T + q = Q + Q p + Q v d
Equations (1)–(3) denote the mass, momentum, and energy conservation equation, respectively, in which ρ denotes air density; u denotes air velocity; p denotes pressure; t denotes time, μ is the dynamic viscosity; F is the body force vector; g is gravitational acceleration; Cp is the specific heat capacity at constant pressure; q is the heat flux by conduction; T is absolute temperature;  and Q contains heat sources other than viscous heating.
The governing equation for the component diffusion can be expressed as the mass conservation of each gas component, which can be given as
ρ Y i t + j i + ρ u Y i = R i
where Yi denotes the mass fraction of component i; Ri denotes the source terms of component i; ji denotes mass flux of component i, which can be described using mixture-averaged approximation and Knudsen diffusion and can be expressed as
j i = ρ D i m k Y i + ρ Y i D i m k M n M n ρ Y i k M i M n D k m x k + D i T T T
where DiT is the thermal diffusion coefficient; Dimk denotes the mixture-averaged diffusion coefficient; Dkm denotes the diffusion coefficient of component k in the gas mixture; Mn and Mi is the mean mole mass and mole mass of component i, respectively; and xk denotes the mole fraction of component k.
The above governing CFD equations can describe the variations of the thermal environment and the air quality in a room. They are discretized and numerically solved using the finite element method and implemented in a commercial software Comsol Multiphysics 5.6, which runs the numerical analysis together with an adaptive meshing and error control by selecting a series of numerical solvers. The software is a cross-platform finite element analysis and multiphysics simulation software and allows conventional physics-based user interfaces and coupled systems of partial differential equations (PDEs). It has been gradually used for the analysis of thermal comfort in rooms [28,29].

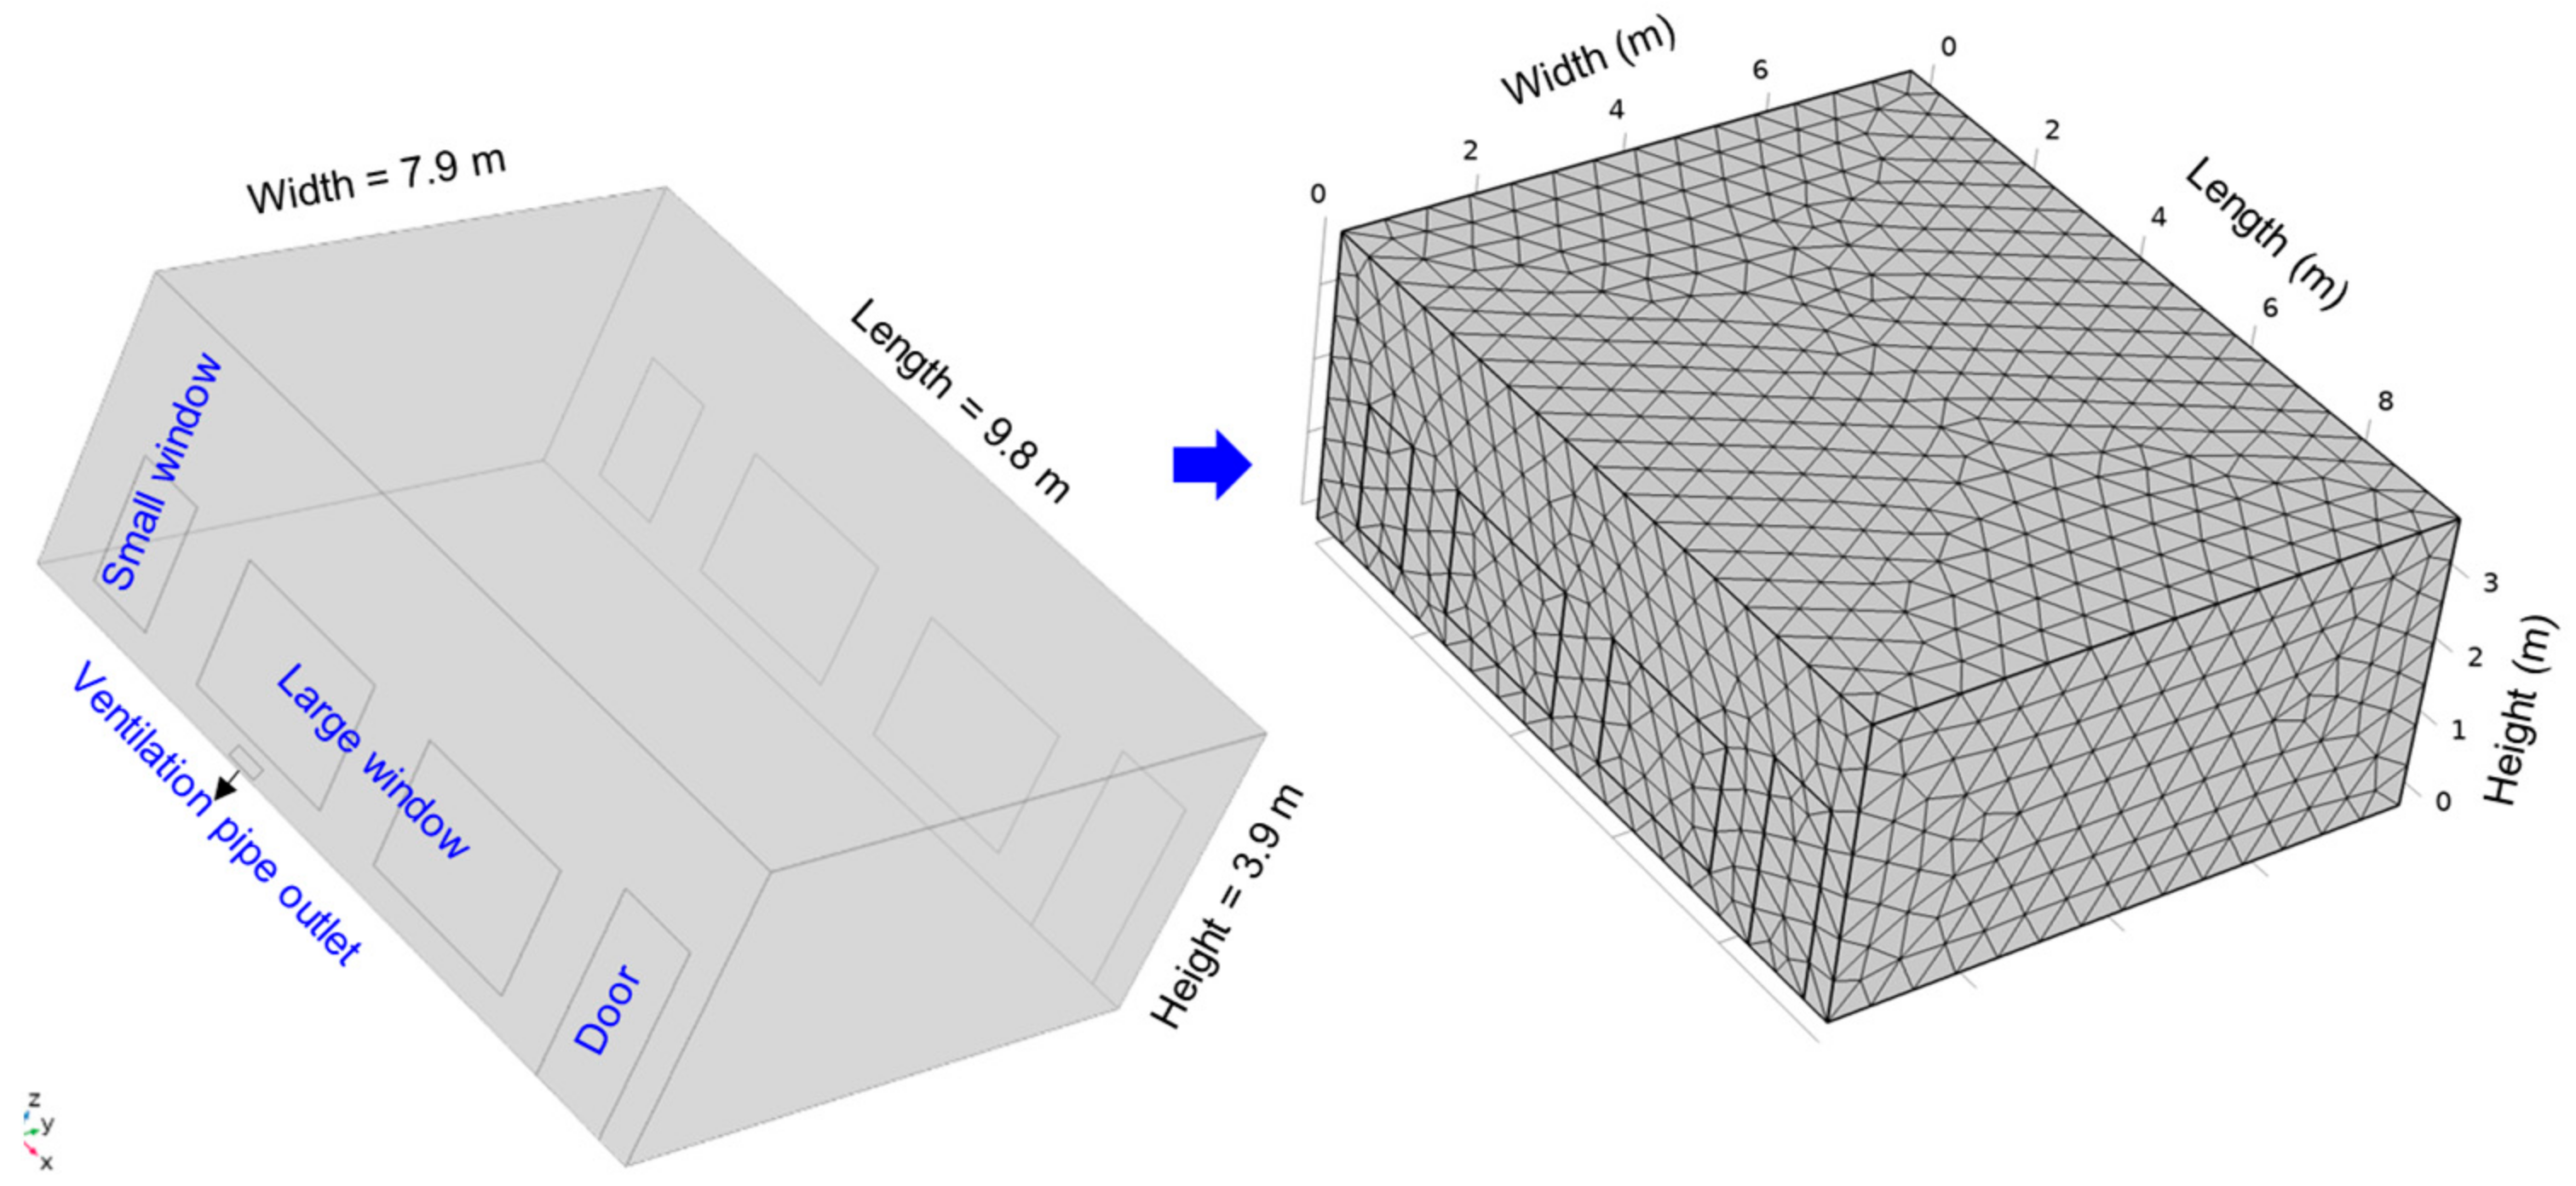
2.2.2. Geometry Model and Mesh Generation

The typical classroom in Hengshan 6th primary school was selected to investigate the indoor thermal environment and air quality by performing numerical simulations. The numerical model was developed according to the actual size of the classroom, as shown in Figure 4, and the parameters for the doors and windows are given in Table 1. In view of the large size of the classroom, and considering the uncertainty of the placement of tables and chairs in the classroom and the mobility of students, as well as the long calculation time required for gas simulation, the indoor physical structure of the classroom was appropriately simplified. The heat generation of lights and lamps was neglected. The following assumptions were also adopted: (1) The students’ breathing (oxygen consumption and carbon dioxide increase) was simplified, and the production rate of CO2 and water vapor by a student is 32 g/h/person and 16.7 g/h/person, respectively, according to the previous publications [30], ignoring the speed of exhaled air and heat generated by students. (2) The exhaled CO2 by students was assumed to be generated at the bottom of the classroom for relatively easy implementation at the model boundary. (3) The temperature at the outlet of the ventilation pipe was assumed to be 15 °C (288 K) in view of the relatively constant underground thermal environment. (4) During the simulation, the influences from the students and desks on the indoor air temperature field, velocity field, and CO2 concentration distribution were not considered.
Considering that the size of the classroom is relatively regular, structured tetrahedral cells were selected to generate the mesh of the geometry model, and local mesh refinement was applied at the entrances and the exits. The size of the mesh varied from 0.165 to 0.552 m, with a curvature factor of 0.7. A total of 13,422 tetrahedra meshes were generated for the numerical model to achieve a balance between grid convergence and computational efficiency. In addition, the mesh dependencies with fine meshes (39,614 tetrahedra meshes) and coarse meshes (13,422 tetrahedra meshes) were also analyzed to ensure acceptable results using the selected meshes.

2.2.3. Model Parameters and Boundary Conditions

According to the monitoring data of all-weather stations in Yulin, northern Shaanxi, the initial boundary conditions of the entrance, exit, and classroom were set, i.e., the CO2 concentration of the outdoor air is about 400 ppm, and that of the water vapor was 100 ppm. In the summer, the average wind speed in August is set as 2 m/s, and the average outdoor temperature is 27 °C; while in the winter, the average wind speed is 1.5 m/s in January (without corridors), and the average outdoor temperature is about −3 °C. For the boundary of the numerical model, the surrounding wall, top, and bottom of the classroom were assumed to be relatively insulated. In addition, the generation of CO2 and water vapor were set at the bottom of the model. The inlet adopted the wind speed as the boundary condition, and the outlet adopted the pressure boundary. The details for the boundary conditions are summarized in Table 2.
The numerical simulation adopted the transient method to analyze the changes of the indoor carbon dioxide, water vapor components, and temperature parameters with time for the situations with doors or windows opened or closed. The k-ω turbulent model was used to describe the indoor airflow, and the SIMPLE (Semi-Implicit Method for Pressure Linked Equations) algorithm was adopted to decouple the pressure and velocity of airflow equations. The initial time step for the simulation was set as 1 s.

2.2.4. Simulation Scenarios

In this study, a total of 10 numerical cases were established to compare and analyze the influence of ventilation pipes, corridors, window height ratios, and outdoor temperatures (in different seasons) on the indoor thermal environment and air quality of classrooms. The main simulation conditions for the 10 simulation scenarios are listed in Table 3. By comparing the results of different scenarios, the effects of different factors can be analyzed.
Comparing cases 1, 2, 3, and 4, the influence of corridors on indoor air quality and thermal environment can be analyzed. The corridor significantly reduces the speed and increases the temperature at the entrance. Therefore, the temperature at the entrance was set to be 5 °C higher than that of the outdoors, and the speed at the entrance was set to 0.3, 0.4, 0.5, and 1 m/s, respectively. Comparing cases 5 and 6, the differences in the indoor temperature field, velocity field, and CO2 concentration distribution under two different initial conditions in the winter and summer could be analyzed. Comparing cases 6, 7, and 8, the effects of the width/height ratio of the windows could be analyzed. By comparison of cases 6 and 10, the influences of the underground ventilation pipes in the classrooms on the air temperature field, velocity, CO2 concentration, and water vapor concentration could be obtained. Comparing cases 5 and 10, the influence of the opening of large and small windows on the air quality and the thermal environment could be analyzed.

3. Results

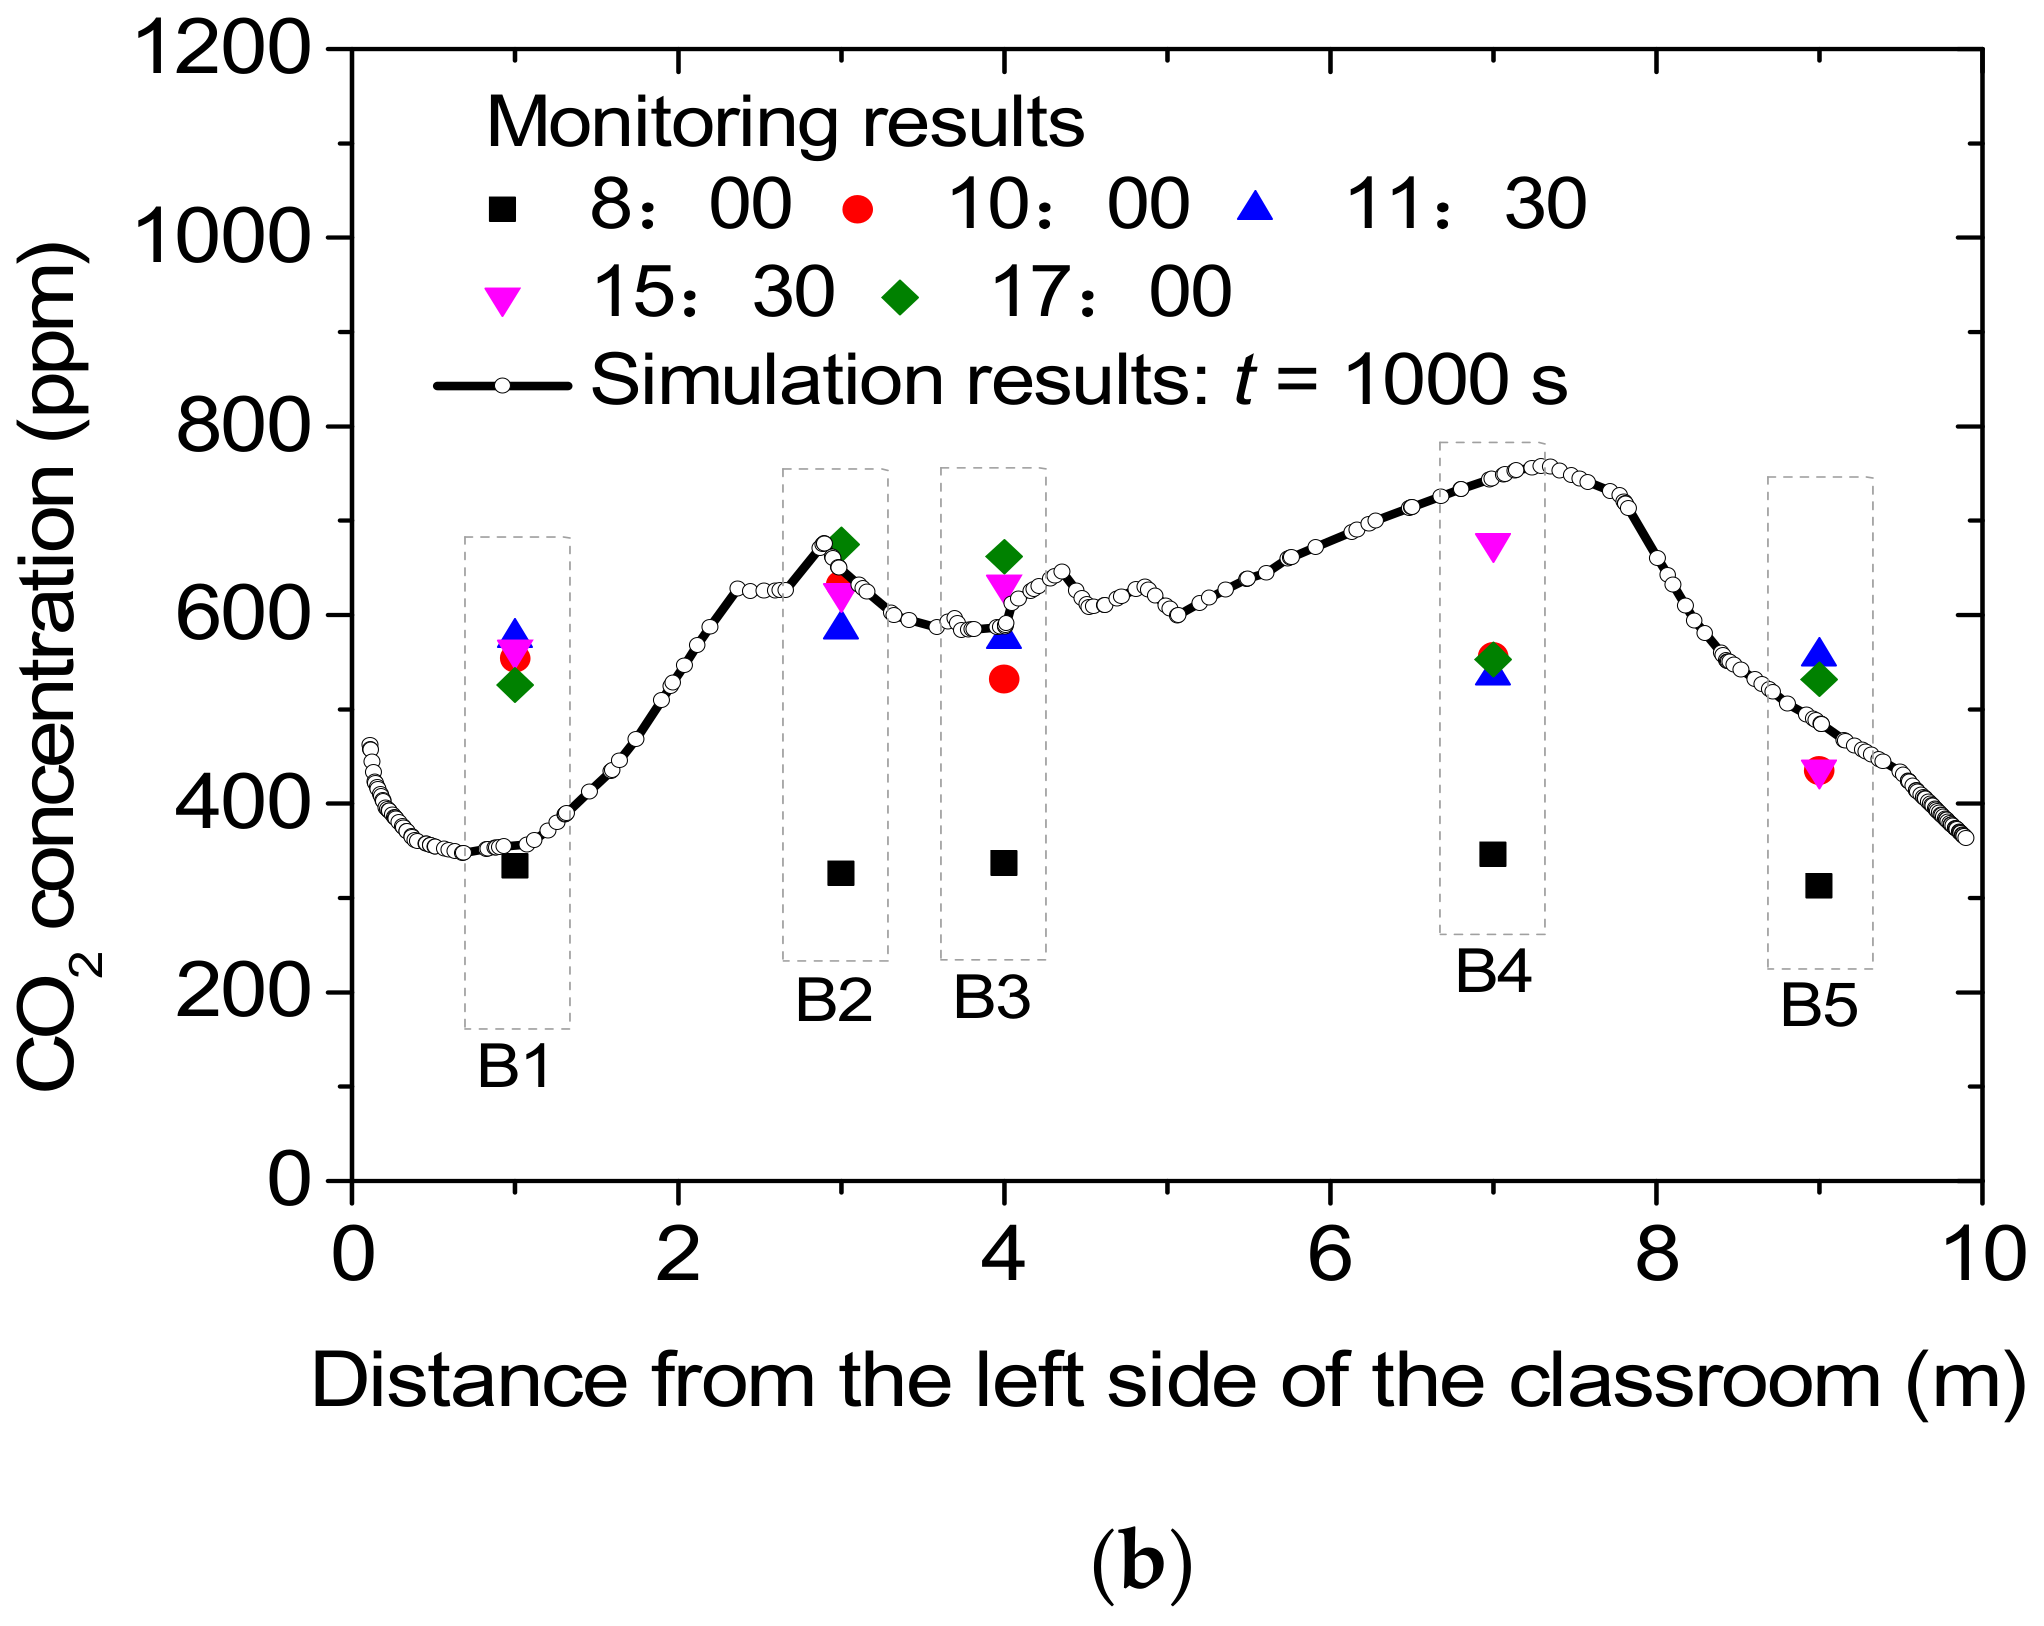
3.1. Monitoring Results of the Classroom

The monitoring results of the thermal environment, including both temperature and humidity, are presented in Figure 5. The results denote the average value of those points. In the winter, the temperature in the classroom was higher; thus, the indoor thermal insulation performance was better. The heat dissipation was relatively slow at night, and the design could better resist the invasion of low temperatures and the northwest wind, which meet the basic needs of teachers and students in a thermal environment. By comparing the temperature results—the designs (of using the external insulation measures of the wall and the double-sided corridors) were effective in this case. For the results of humidity, the design helped retain the humidity of the classroom, compared to that outside the classroom. The relatively larger humidity could make teachers and students feel comfortable in the winter. Overall, the monitoring results demonstrate that such a design (using double-sided corridors and an underground ventilation pipe) is feasible to create a comfortable thermal environment for the study of students in the Northern Shaanxi regions. The monitoring results of concentrations of CO2 are given in Table 4. The CO2 concentration at 17:00 reached the largest value due to the activities of students in the classroom. Figure 5c further illustrates the CO2 concentration contour at 10:00 AM by interpolation based on the monitoring results. Evidently, the CO2 concentration in the middle part of the classroom was relatively large due to the large distance to the doors or windows. In summary, the concentration of CO2 in the classroom could be reduced to a relatively small value by adopting reasonable window-open and door-open measures.

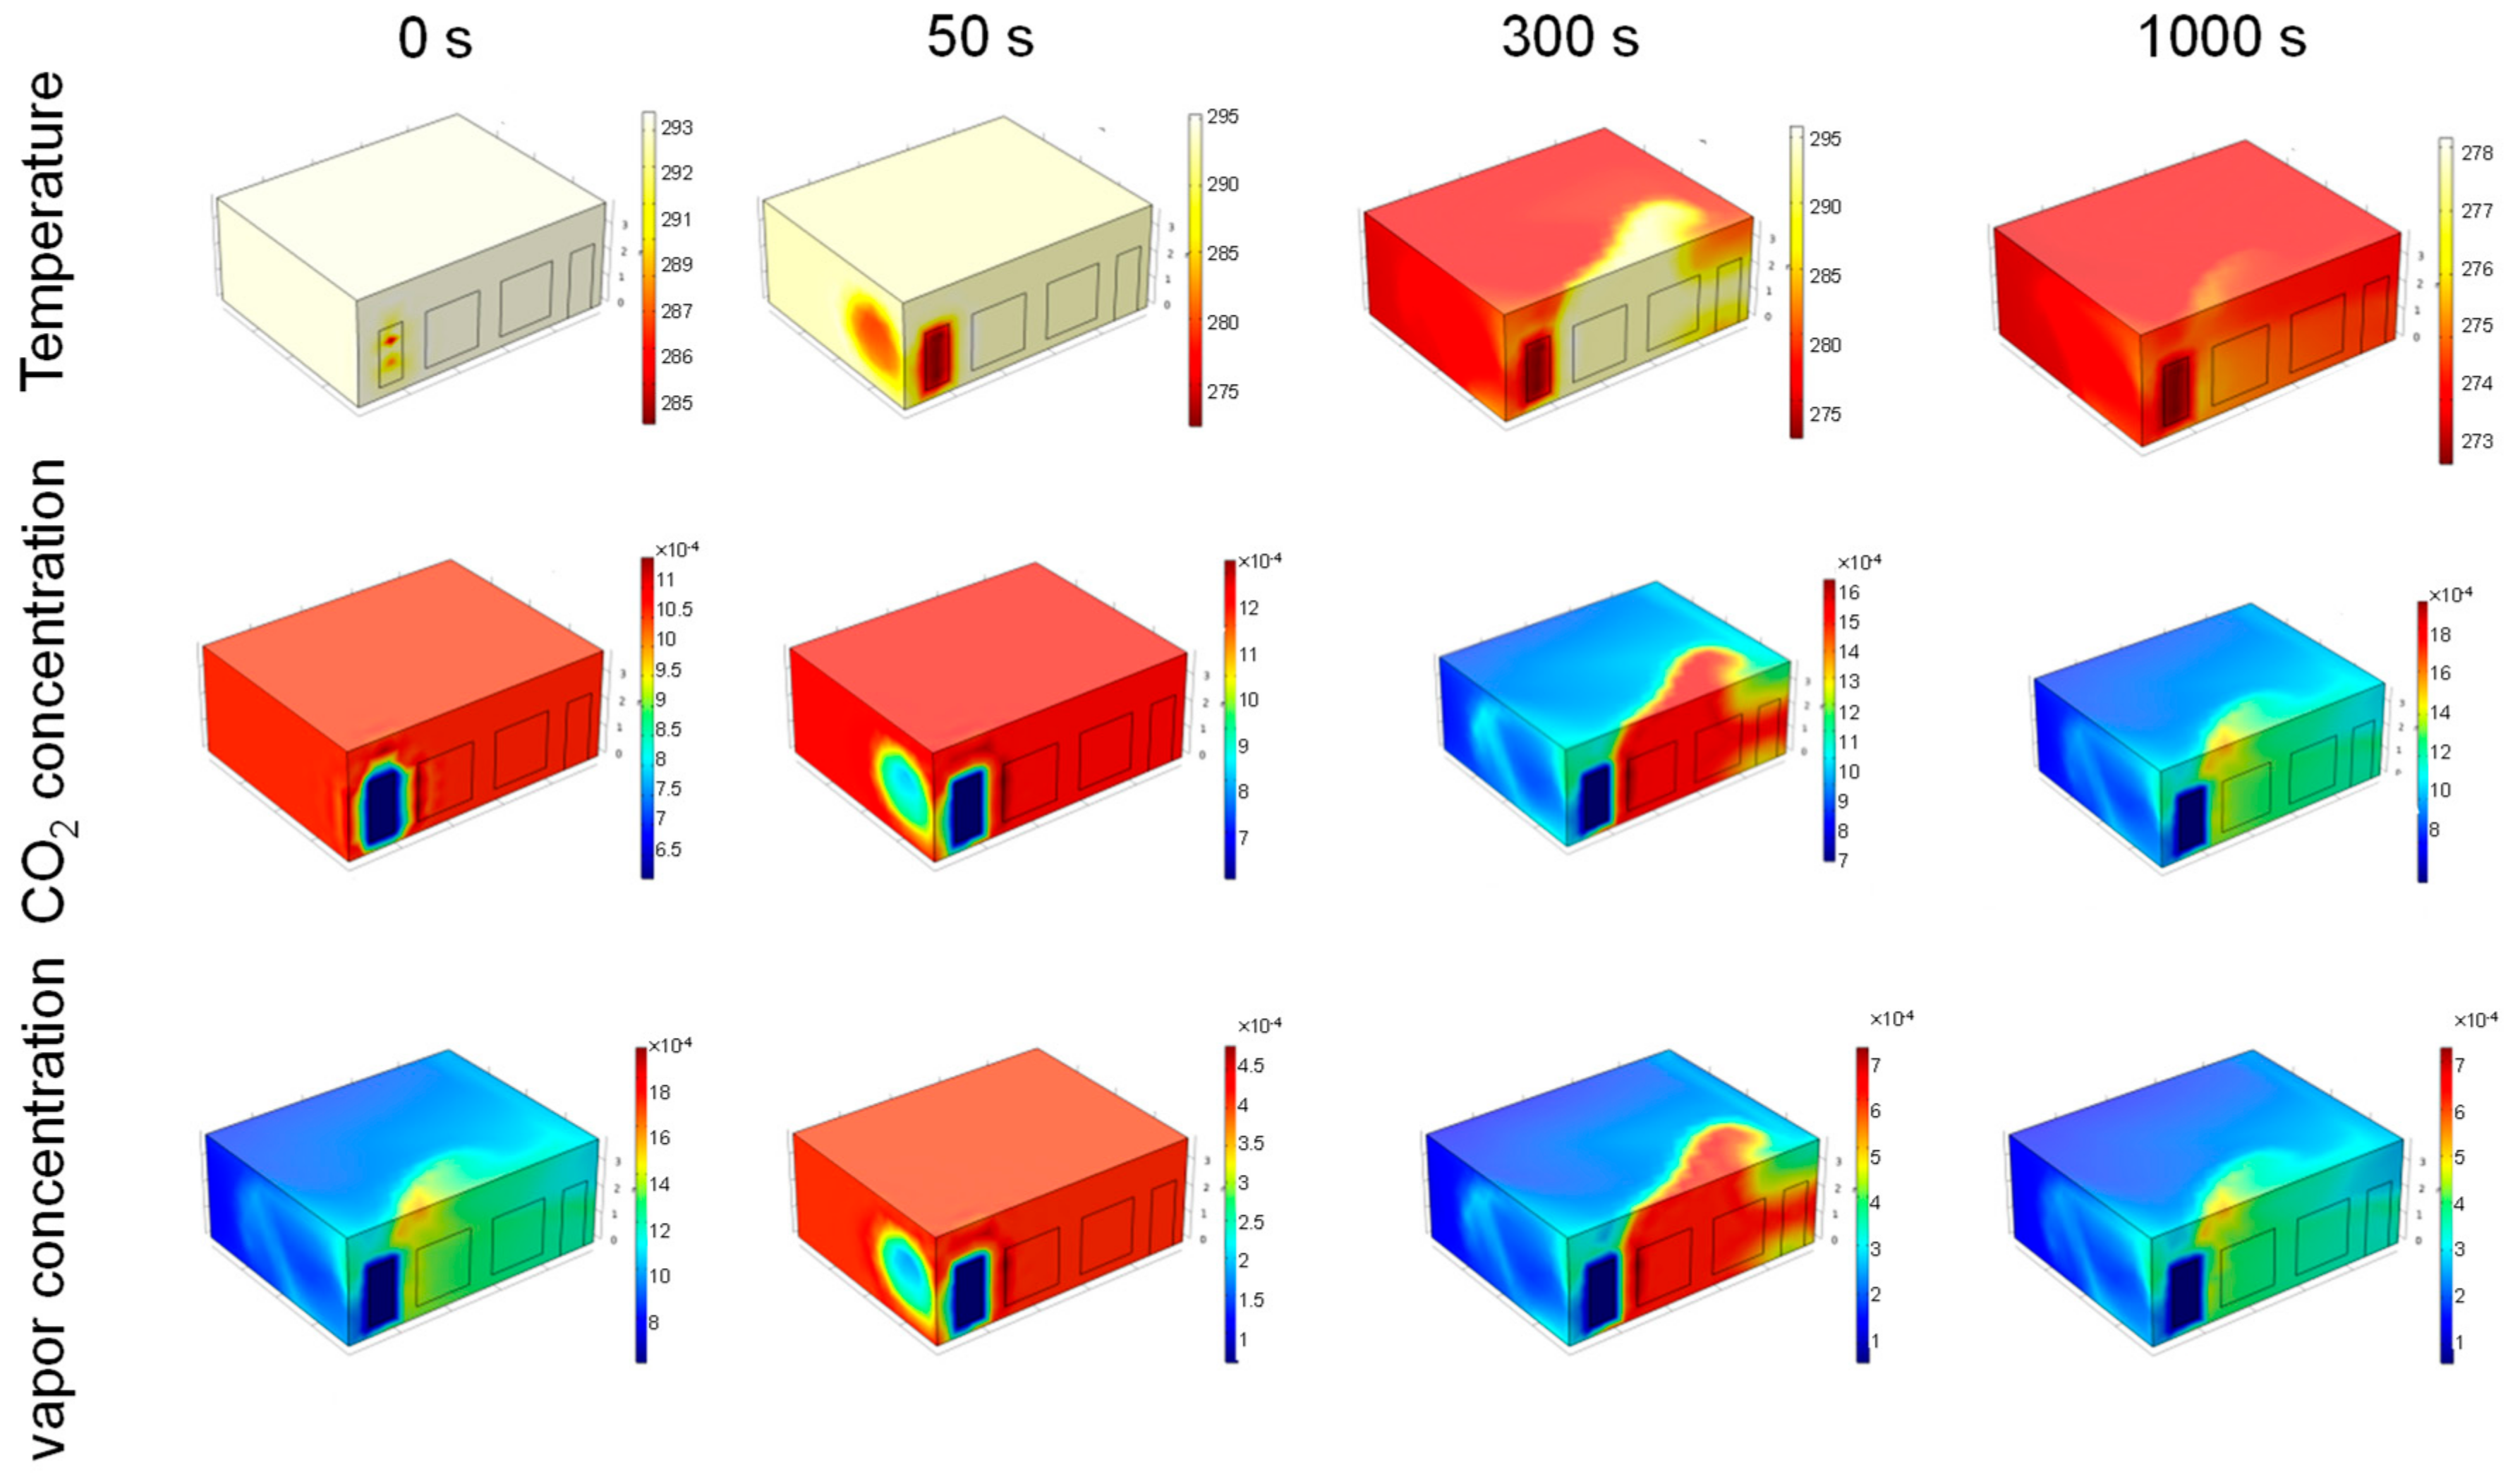
3.2. Simulation Results and Model Validation

Figure 6 shows the contours of CO2 mass concentration, water vapor mass concentration, and temperature in different periods for case 1. It can be clearly seen that with the increase of the inlet speed, the indoor temperature gradually increased to the temperature at the entrance earlier, and the temperature opposite the entrance reached the outdoor temperature earlier. When the inlet velocity was small, even in the calculated 1000 s, there was still a local air temperature that did not reach the temperature at the inlet. In the indoor carbon dioxide cloud map at 500 s, 800 s, and 1000 s, it could be clearly seen that with the increase of the inlet velocity, the indoor carbon dioxide could reach the carbon dioxide concentration in the outdoor air earlier. When the inlet velocity was small, even after the calculation of 1000 s, there were local carbon dioxide concentrations that did not reach the carbon dioxide concentration at the inlet. The indoor water vapor cloud map at 500 s, 800 s, and 1000 s was close to the changing trend of carbon dioxide, but the distribution at the height of the classroom was slightly different, mainly due to the different molar masses of carbon dioxide and water vapor.
Further, the distribution of the CO2 mass concentration for case 1 at the monitoring surface (1 m from the bottom) is illustrated in Figure 7a. In addition, the simulation results along the line for the monitoring test points B1–B5 were compared with the monitoring results, as given in Figure 7b. Evidently, the maximum value of CO2 mass concentration occurred in the middle part of the classroom. The concentration of CO2 closing the inlet was much less than that in other positions. Moreover, the simulation results along the line from test points B1 to B5 basically varied within the range of the monitoring results of the CO2 concentration. Overall, the spatial distribution of CO2 mass concentration in the classroom agreed well with the monitoring results, as illustrated in Figure 5c, which demonstrate that the numerical model is effective to investigate the influence of the corridors, ventilation pipes, window area, and classroom area on the air quality and temperature in the classroom.

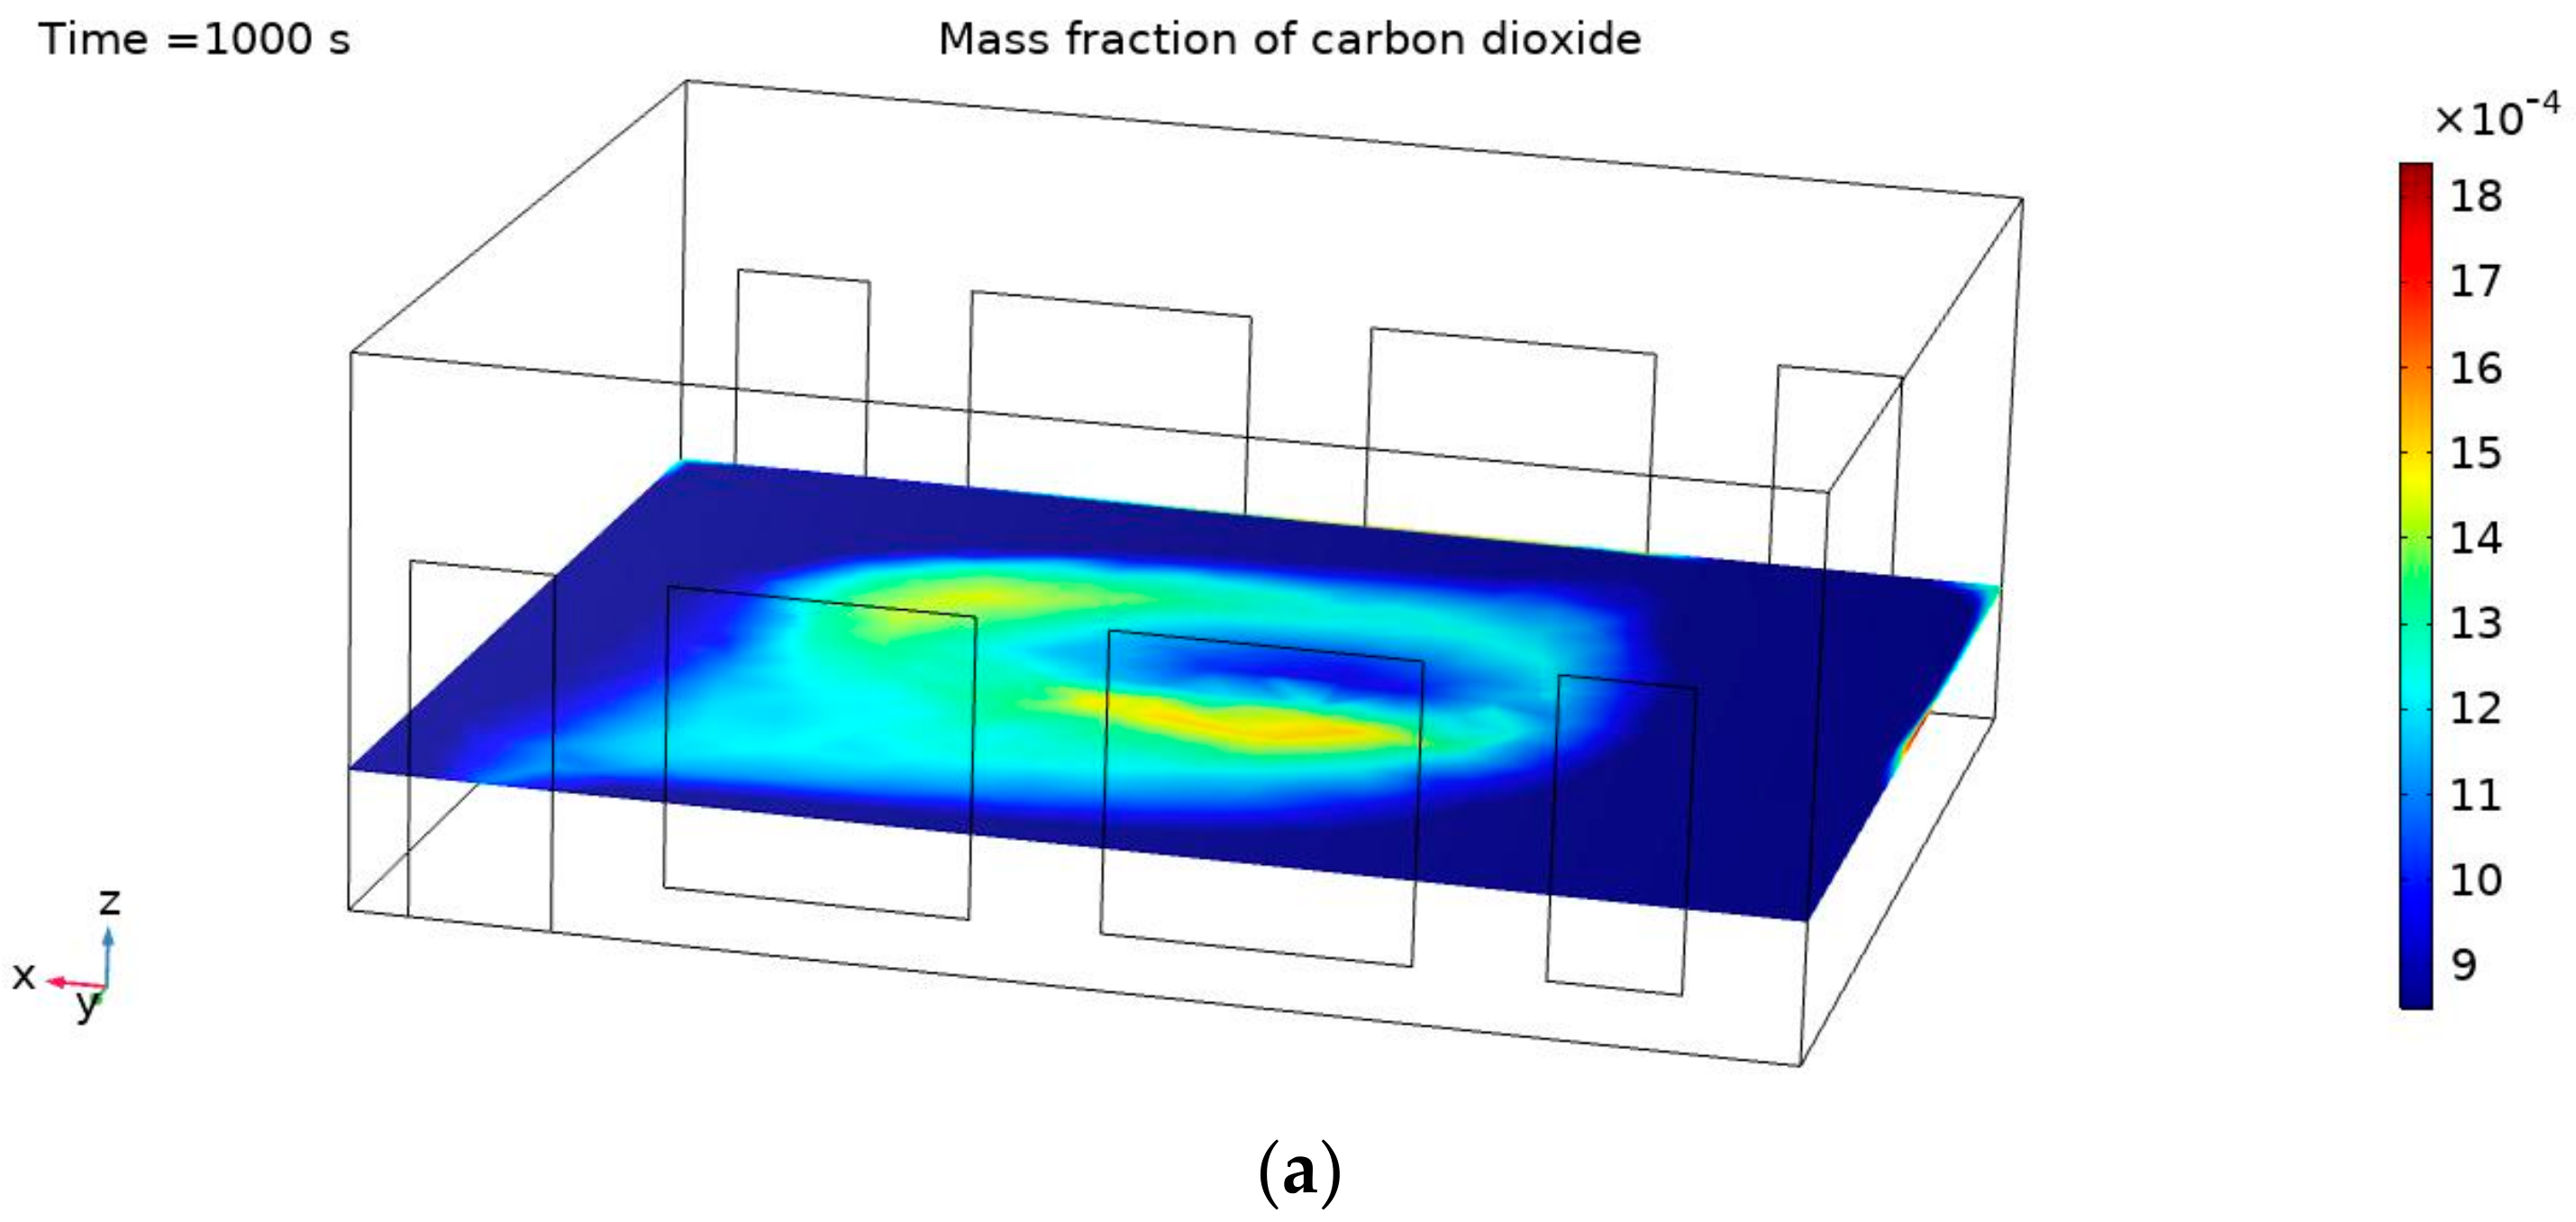
3.3. Air Quality and Thermal Environment Analysis

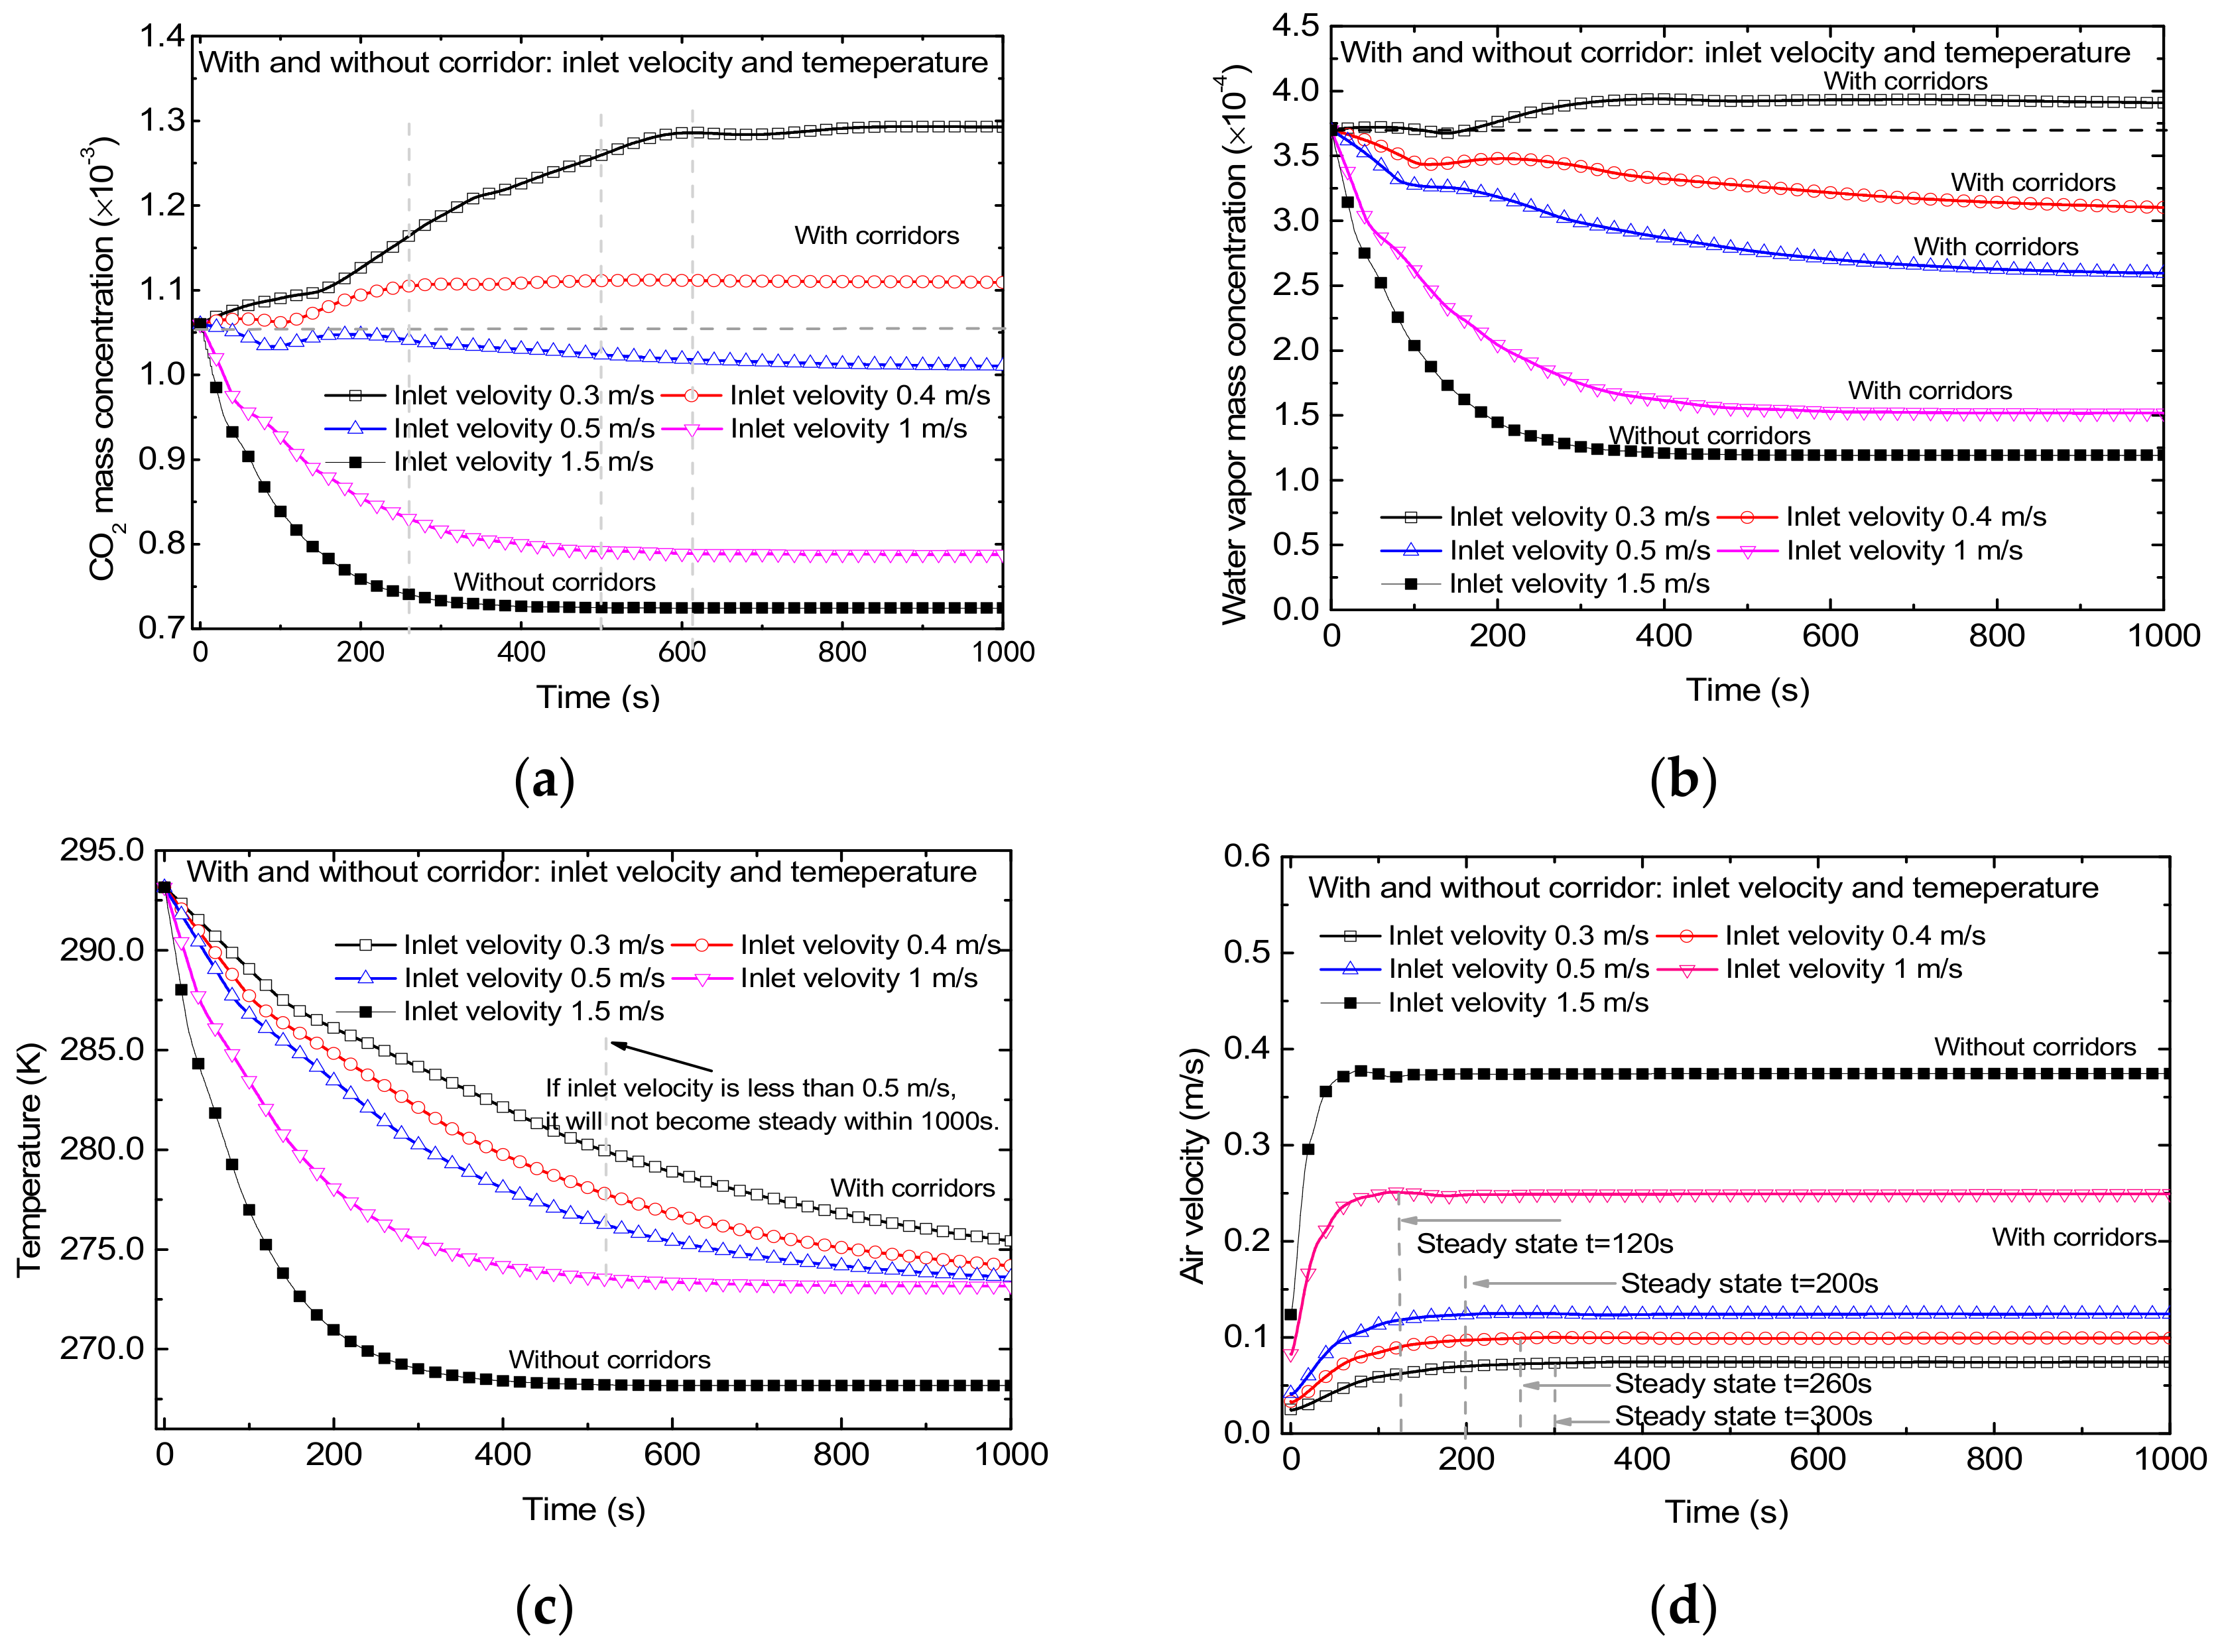
3.3.1. Effects of Corridors

According to relevant investigation and engineering experiences, the corridor has an important influence on the thermal environment of a room. If there is a corridor and glass window outside the corridor, the existence of corridors will not only increase the temperature inside the corridors but also reduce the velocity of the airflow caused by the wind. In this study, for the case with corridors, the temperature in the corridors was set to be 5 °C higher than the outdoor temperature, and the airflow velocity at the inlet of the classroom was set to be 0.3, 0.4, 0.5, and 1 m/s, respectively. The concentration of CO2 and water vapor in the corridors was 400 and 100 ppm, respectively.
Figure 8 presents the variations of CO2 mass concentrations, water vapor mass concentrations, temperatures, and airflow velocity within the classroom with time. Noticeably, the results in the figure denote the average value among the whole classroom for a better comparison. Evidently, when the velocity at the entrance was less than 0.5 m/s (case 3, with corridors), opening a window did not significantly improve the indoor carbon dioxide concentration. When the indoor carbon dioxide concentration reached 700 ppm and the wind speed was less than 0.5 m/s, opening one door and one window did not reduce the CO2 concentration in the classroom. If we want to improve indoor air quality, we need to increase the window area for airflow by opening more windows. Similarly, when the velocity at the entrance is less than 0.4 m/s (Case 2), opening the window will not significantly improve the indoor water vapor concentration. At that time, an additional area for a window opening is required to reduce the water vapor concentration in the classroom. In addition, the faster the inlet velocity is, the faster the indoor temperature changes. Among the four cases, only when the inlet velocity was 1 m/s (Case 4, with corridors), the temperature could be stabilized within the calculation time of 1000 s, which demonstrated that the temperature was still higher than that in the corridors. It could also be seen that the greater the inlet velocity, the greater the average turbulent velocity in the room, and the faster the indoor air quality changes.
We compare the results of cases 1–4 and case 5, with the corridor (cases 1–4, with corridors) results with relatively higher temperatures in the classroom and larger CO2 concentrations compared to that obtained in case 5 (without corridors), as shown in Figure 8. It can be concluded that having a corridor will significantly improve the indoor thermal insulation effect of the classroom, and will weaken the indoor air quality change. Since the summer in this area is shorter and the winter is long, the thermal insulation effect is an important factor that needs to be considered in the building. It can be noted that the air quality change for the case with the one-sided corridor was weaker than that of no corridor, and the existence of the corridor increased the room temperature at the entrance. In practice, considering the heat dissipation of the wall, the double-sided corridors will significantly improve the thermal insulation effect of the classroom. Although the corridors will weaken the air quality change of a natural wind in the room, the air quality can be improved by opening one window when the inlet wind speed is above 0.5 m/s or by opening more windows with relatively small inlet velocities. Given the actual situation in the northern Shaanxi region, the double-sided corridor is a relatively economic way to improve the thermal environment in a classroom.

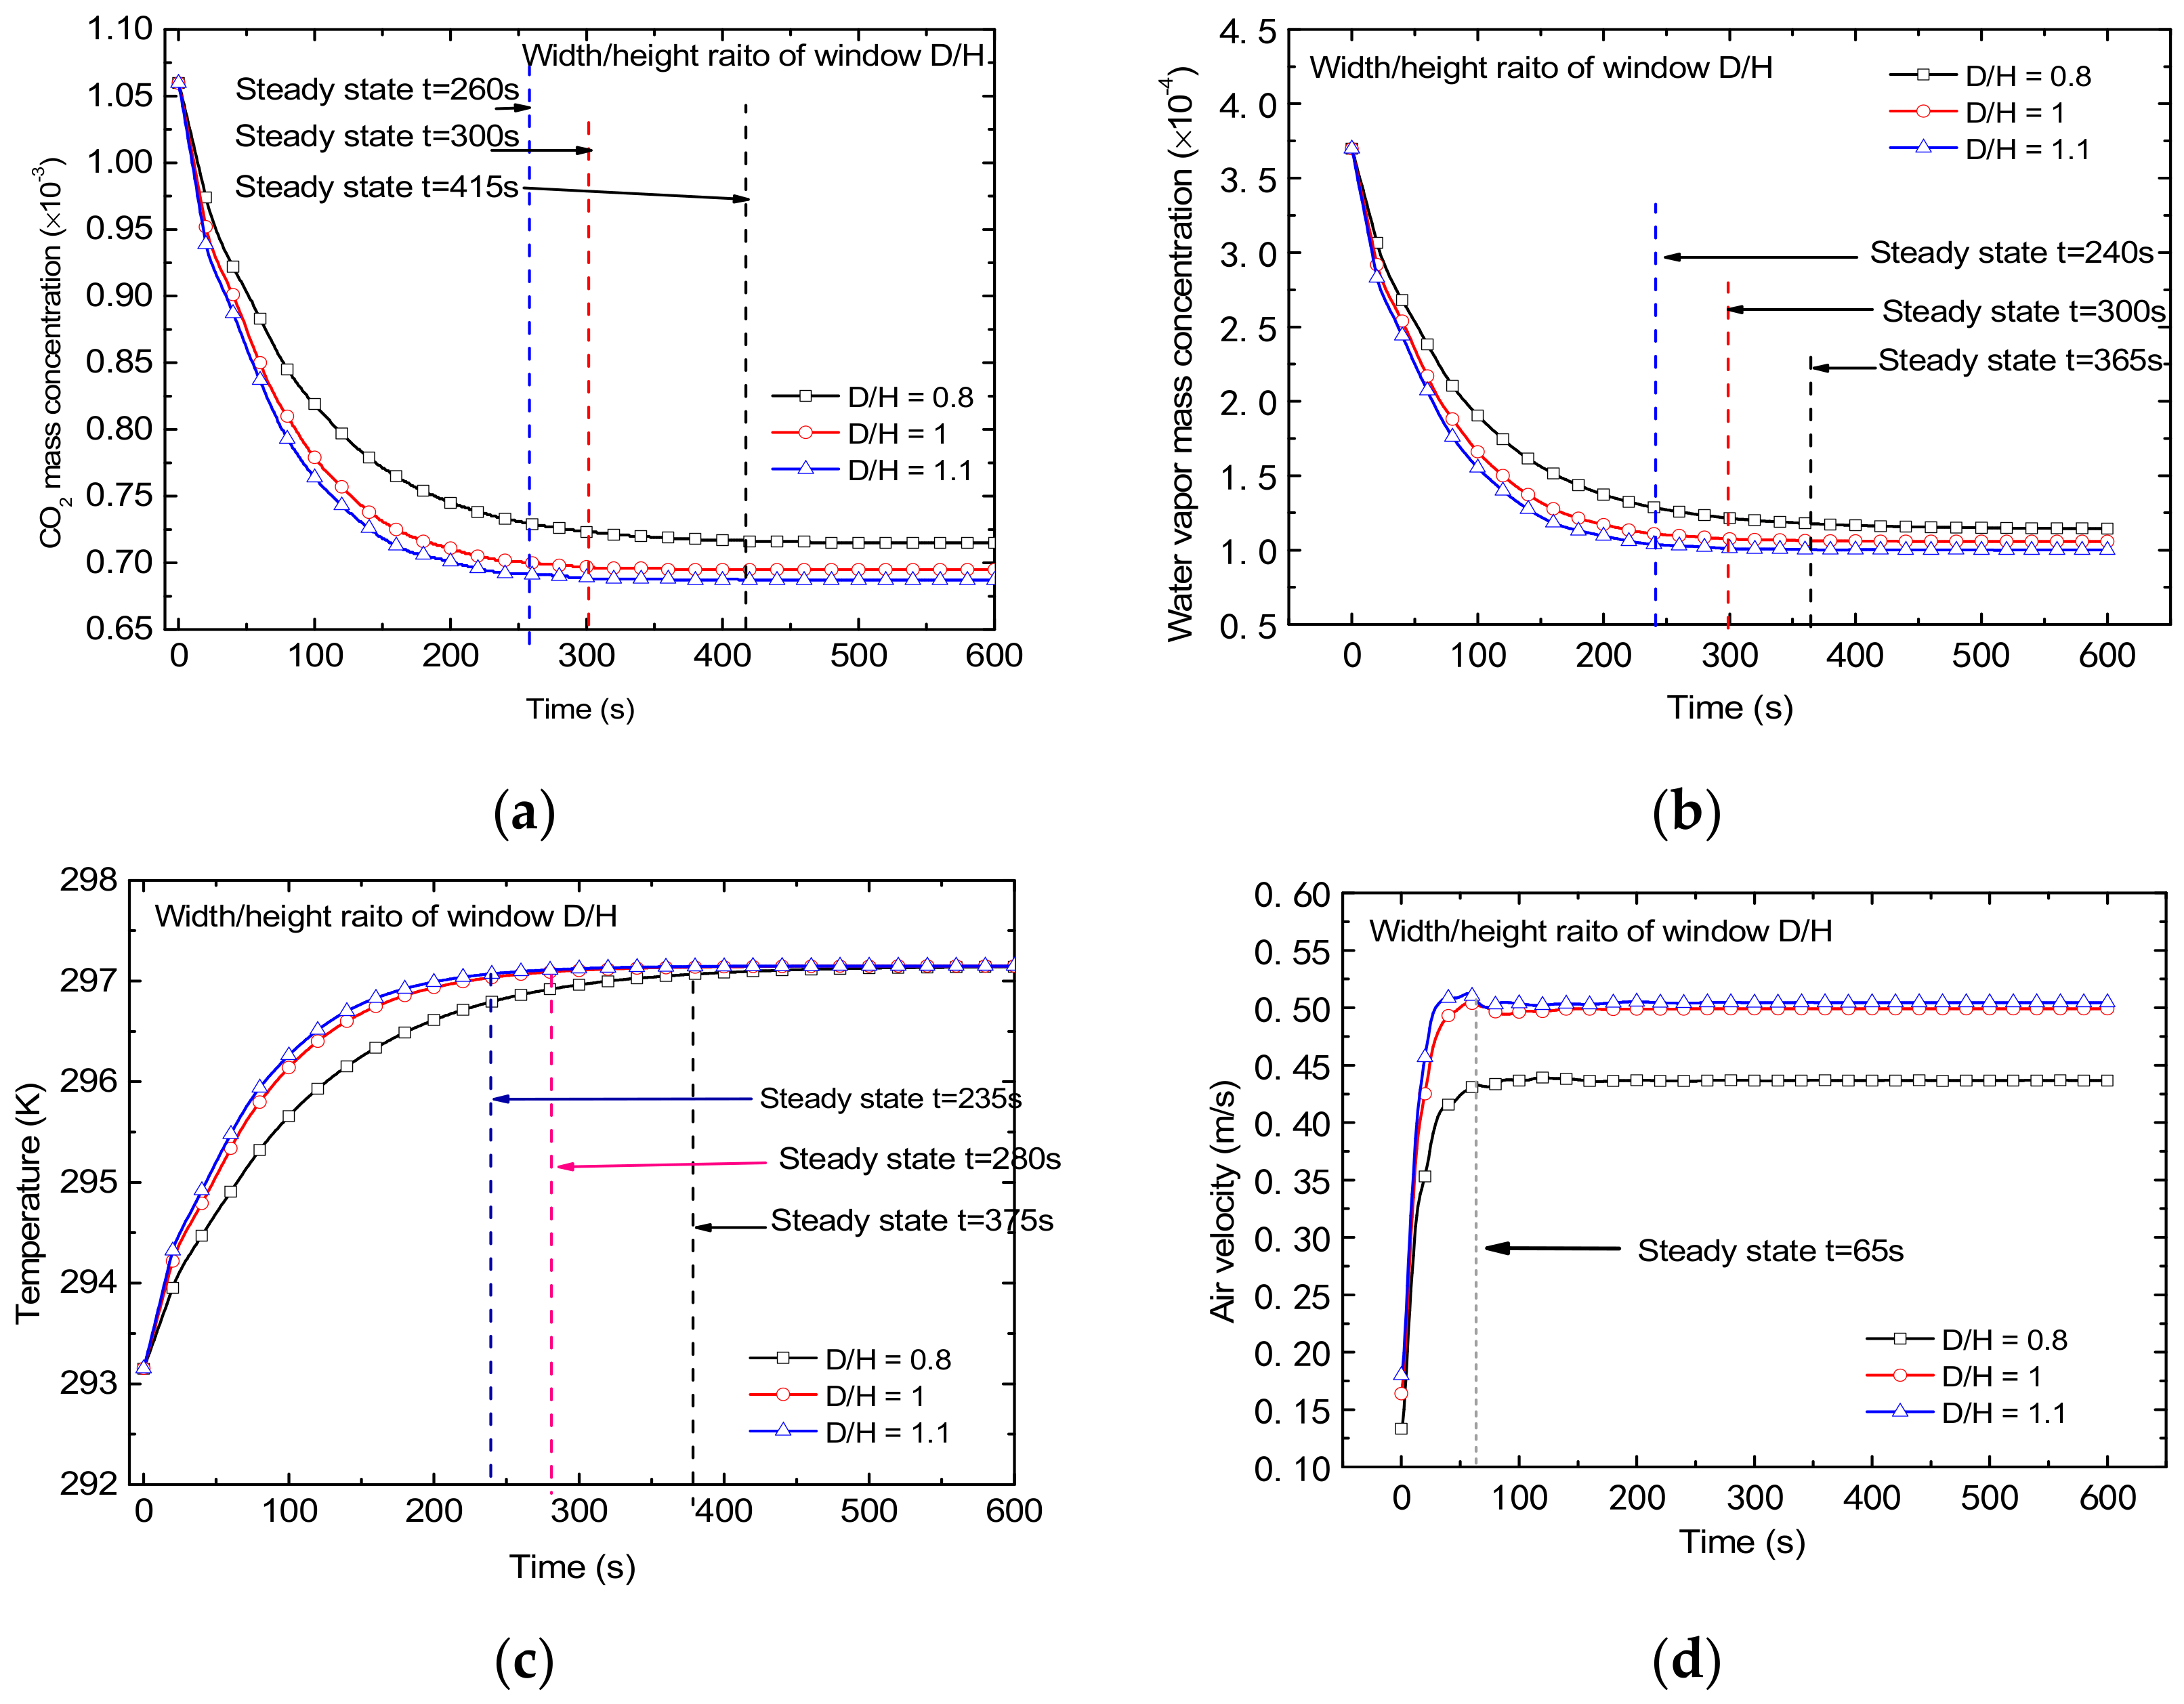
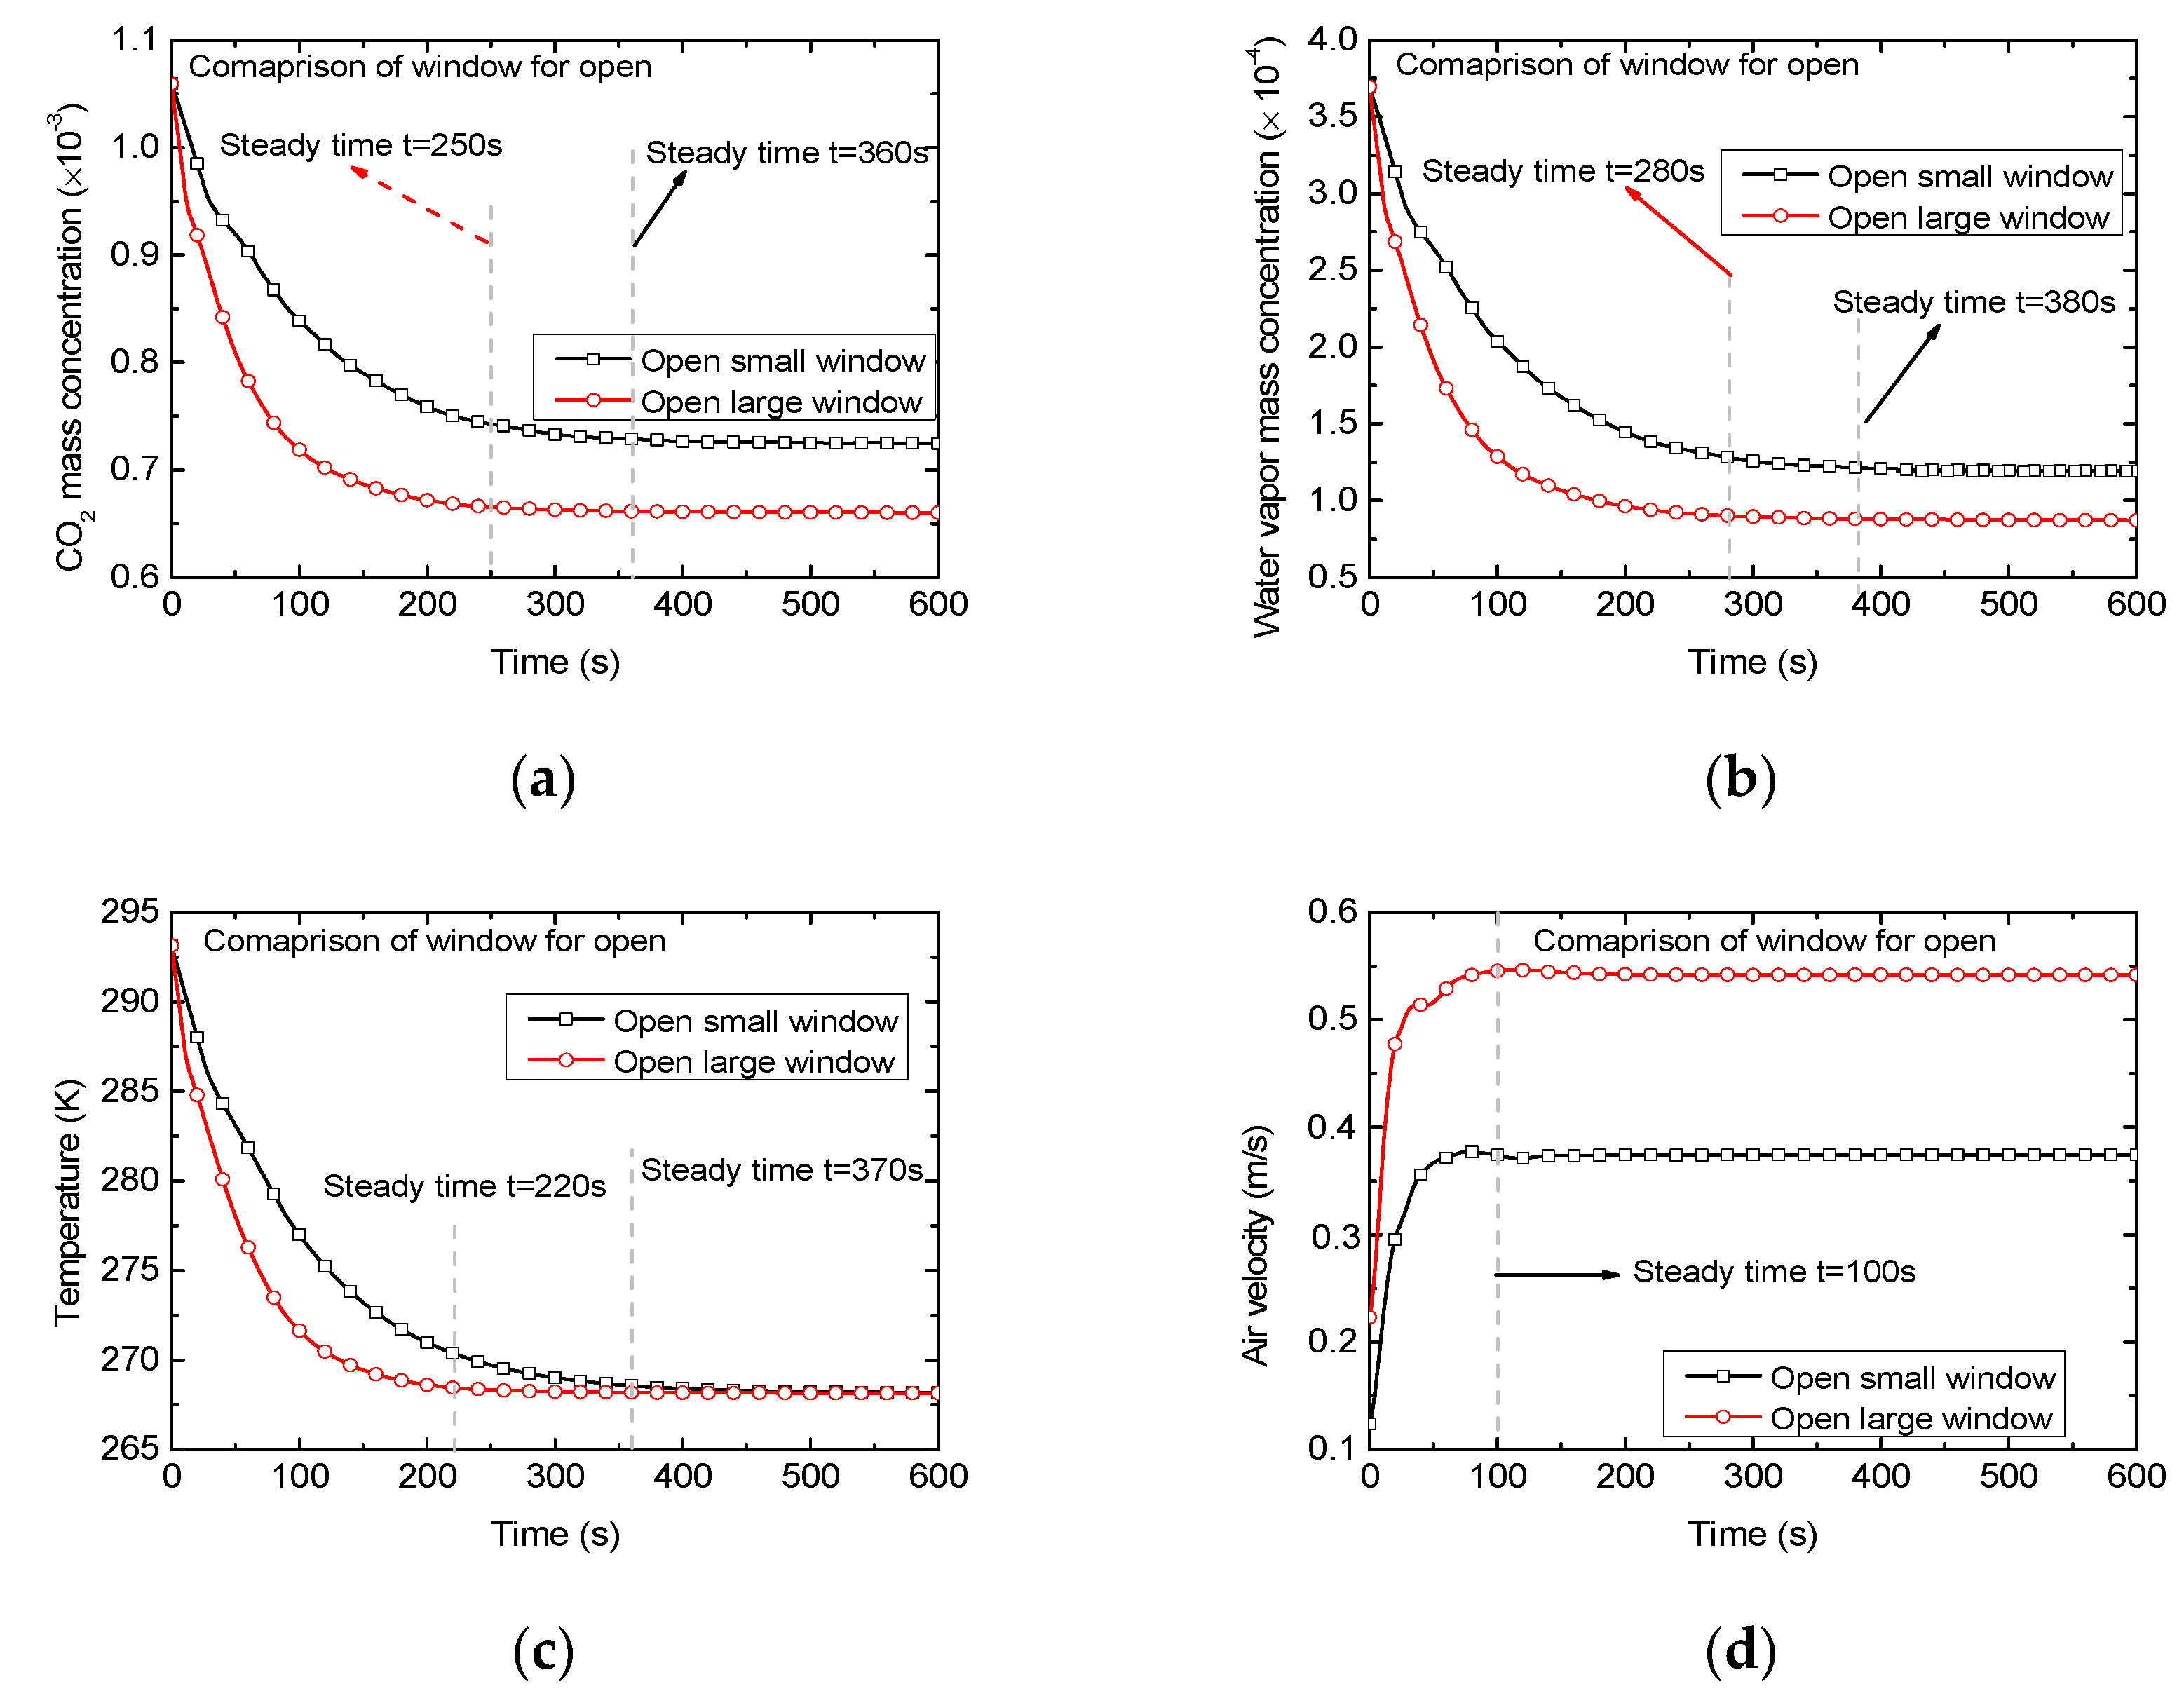
3.3.2. Effects of Windows

In this study, the width/height ratios of the window were selected as 0.8, 1, and 1.1, respectively, according to the design standard. To investigate the influence of windows, one window and one door were opened in the classroom for comparison during the simulation, and the airflow rate at the inlet was 2 m/s. The temperature at the inlet was assumed as 24 °C during the summer. The CO2 concentration and water vapor concentration were 400 and 100 ppm, respectively.
Figure 9 presents the variations in the average mass concentrations of CO2 and water vapor, temperature, and airflow velocity within the classroom with time. The mass fraction of carbon dioxide became gradually stable after 260, 300, and 415 s, respectively, for the case with width/height ratios of windows equaling 1.1, 1.0, and 0.8, respectively. The improvement of the air quality was most effective when the ratio was 1.1. The improvement of indoor air quality was slower as the ratio decreased. Similarly, as the width/height ratio of indoor windows decreased, the indoor temperature change became much smaller, and the temperature reached a stable level at 235, 280, and 375 s, respectively, for the cases with ratios of 1.1, 1.0, and 0.8. When the indoor air quality is poor and students feel uncomfortable, opening the window for about 5 min will significantly improve the indoor air quality. However, in practice, increasing the width/height ratio of the window (or increasing the window area) will significantly weaken the indoor thermal insulation effect. Although the larger width/height ratio of the window quickly improves the air quality, the air quality can also be improved within a short period of time by opening the window with a small width/height. To summarize, when the width/height ratio of the designed window is 1, the efficiency of the air quality improvement and thermal insulation effect can be achieved.
In this case, there were four large windows and two small windows in the classroom, and the selection of a large or small window to improve the air quality in the classroom is worthy of discussion. Figure 10 presents the variations of CO2 mass concentration, water vapor mass concentration, temperature, and airflow velocity within the classroom with time for the two cases. Obviously, opening a large window will speed up the improvement of indoor air quality. Due to the larger area at the indoor entrance, the indoor carbon dioxide and water vapor will reduce faster. When the large window is opened, the indoor temperature will stabilize at 220 s; when the small window is opened, the indoor temperature will stabilize at 370 s. The openings of windows have little effect on the average turbulent velocity in the room. The average turbulent velocity in the room with large windows will be slightly higher than that of small windows. This is mainly because the convection velocity of the large window is higher, resulting in the indoor turbulent velocity being bigger.

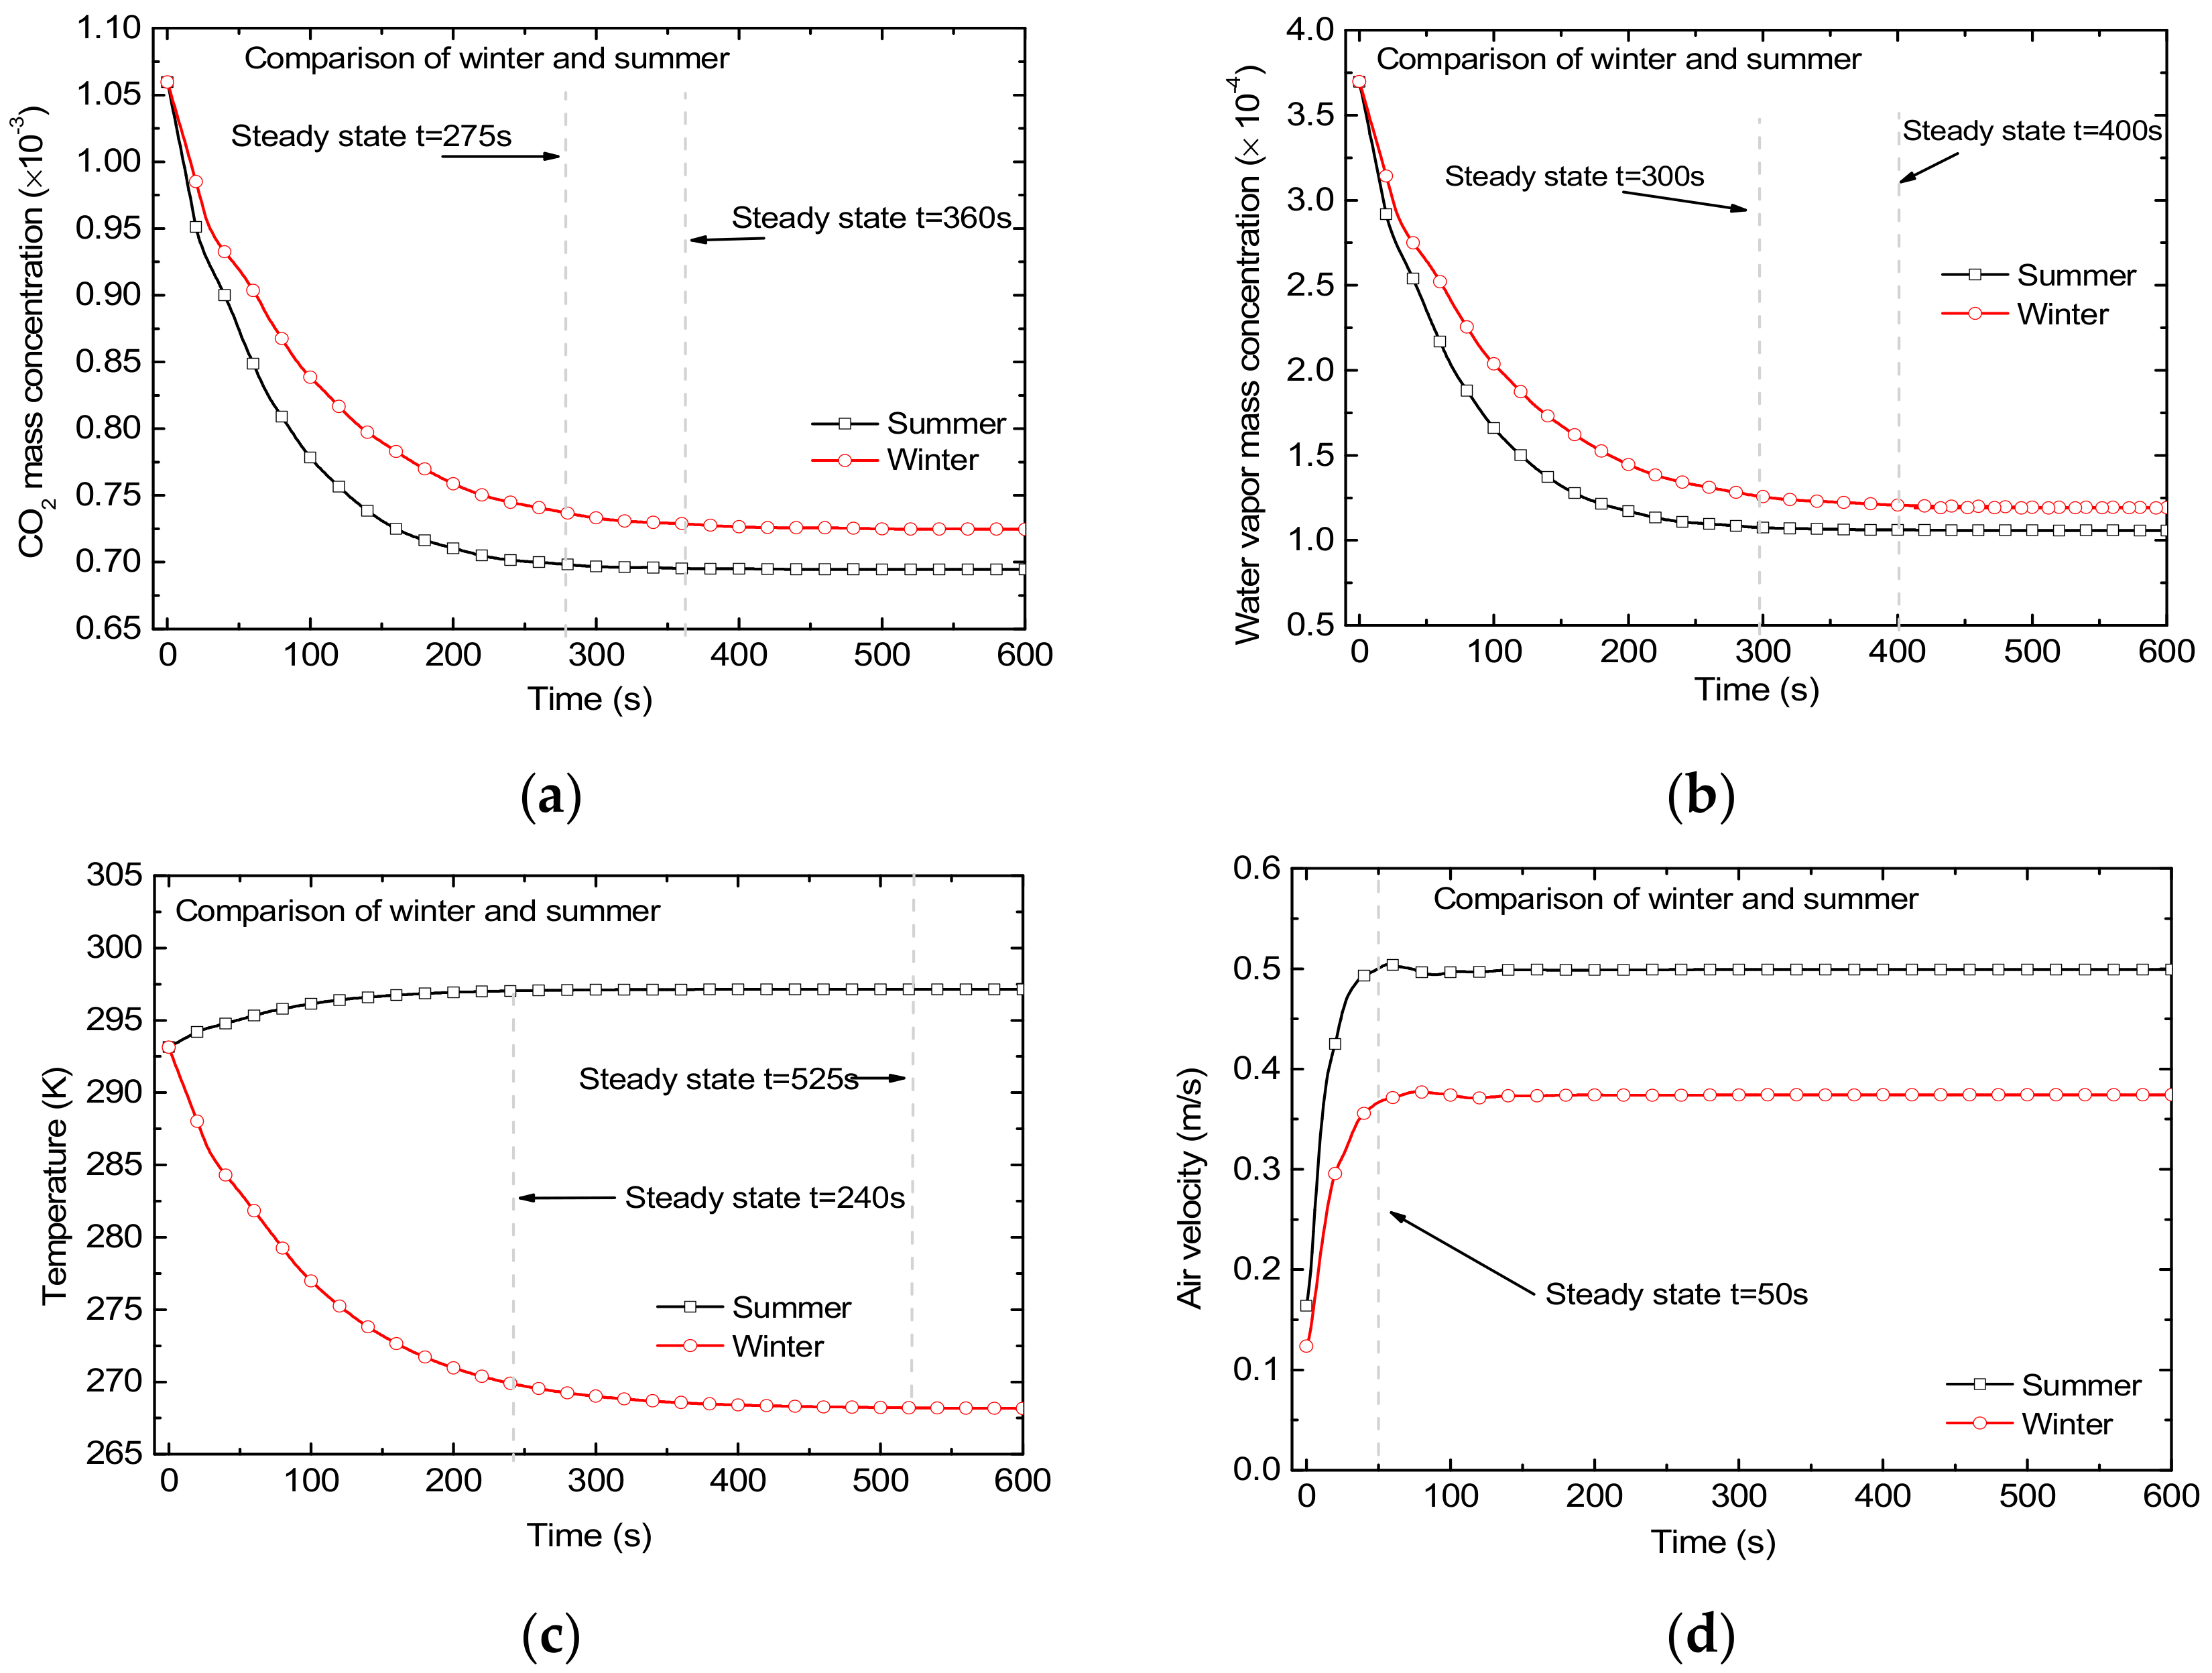
3.3.3. Effects of Seasonal Conditions

The classroom in northern Shaanxi experiences different climate conditions, and the thermal environment and air quality in the classroom in the summer and winter are very different [31]. For the simulation, there was a significant difference between the inlet velocity and the temperature at the entrance in the winter and summer. To explore the difference between the outdoor climate conditions in the winter and summer on indoor air quality, the corridors were ignored in cases 6 and 7. The inlet temperature was 24 °C and −5 °C in the summer and winter, respectively, according to the measured values in this case. The inlet velocities were 2 m/s and 1.5 m/s in the summer and winter, respectively, which are in line with local climatic conditions.
Figure 11 shows the comparison of CO2 mass concentration, water vapor mass concentration, temperature, and velocity in the summer and winter. The average turbulent velocity in the summer in the room was larger than that in the winter, and the turbulent velocity was basically at a steady state at 50 s. Based on the temperature results, opening windows in the summer will cause the indoor temperature to rise, while opening windows in the winter will reduce the indoor temperature. In the summer, the concentration of carbon dioxide and water vapor in the room decreases faster, and they will reach a steady state more quickly in the summer. The mass fraction of water vapor and carbon dioxide will basically not change when the window is opened for 300 and 275 s, respectively, in the summer. While the times for the mass fraction of water vapor and carbon dioxide to reach a steady value are 400 and 360 s, respectively in the winter. Overall, opening windows in the winter and summer can both significantly improve indoor air quality. Opening windows in the summer will slightly increase the indoor temperature and opening windows in the winter will rapidly decrease the indoor temperature. In the winter, the frequency of openings and closings of windows can be increased to reduce the indoor temperature at a low temperature for a long time. In the summer, the windows can be kept open, and the wind from the window cannot only reduce the human body temperature but also maintain indoor carbon dioxide and water vapor at a lower level.

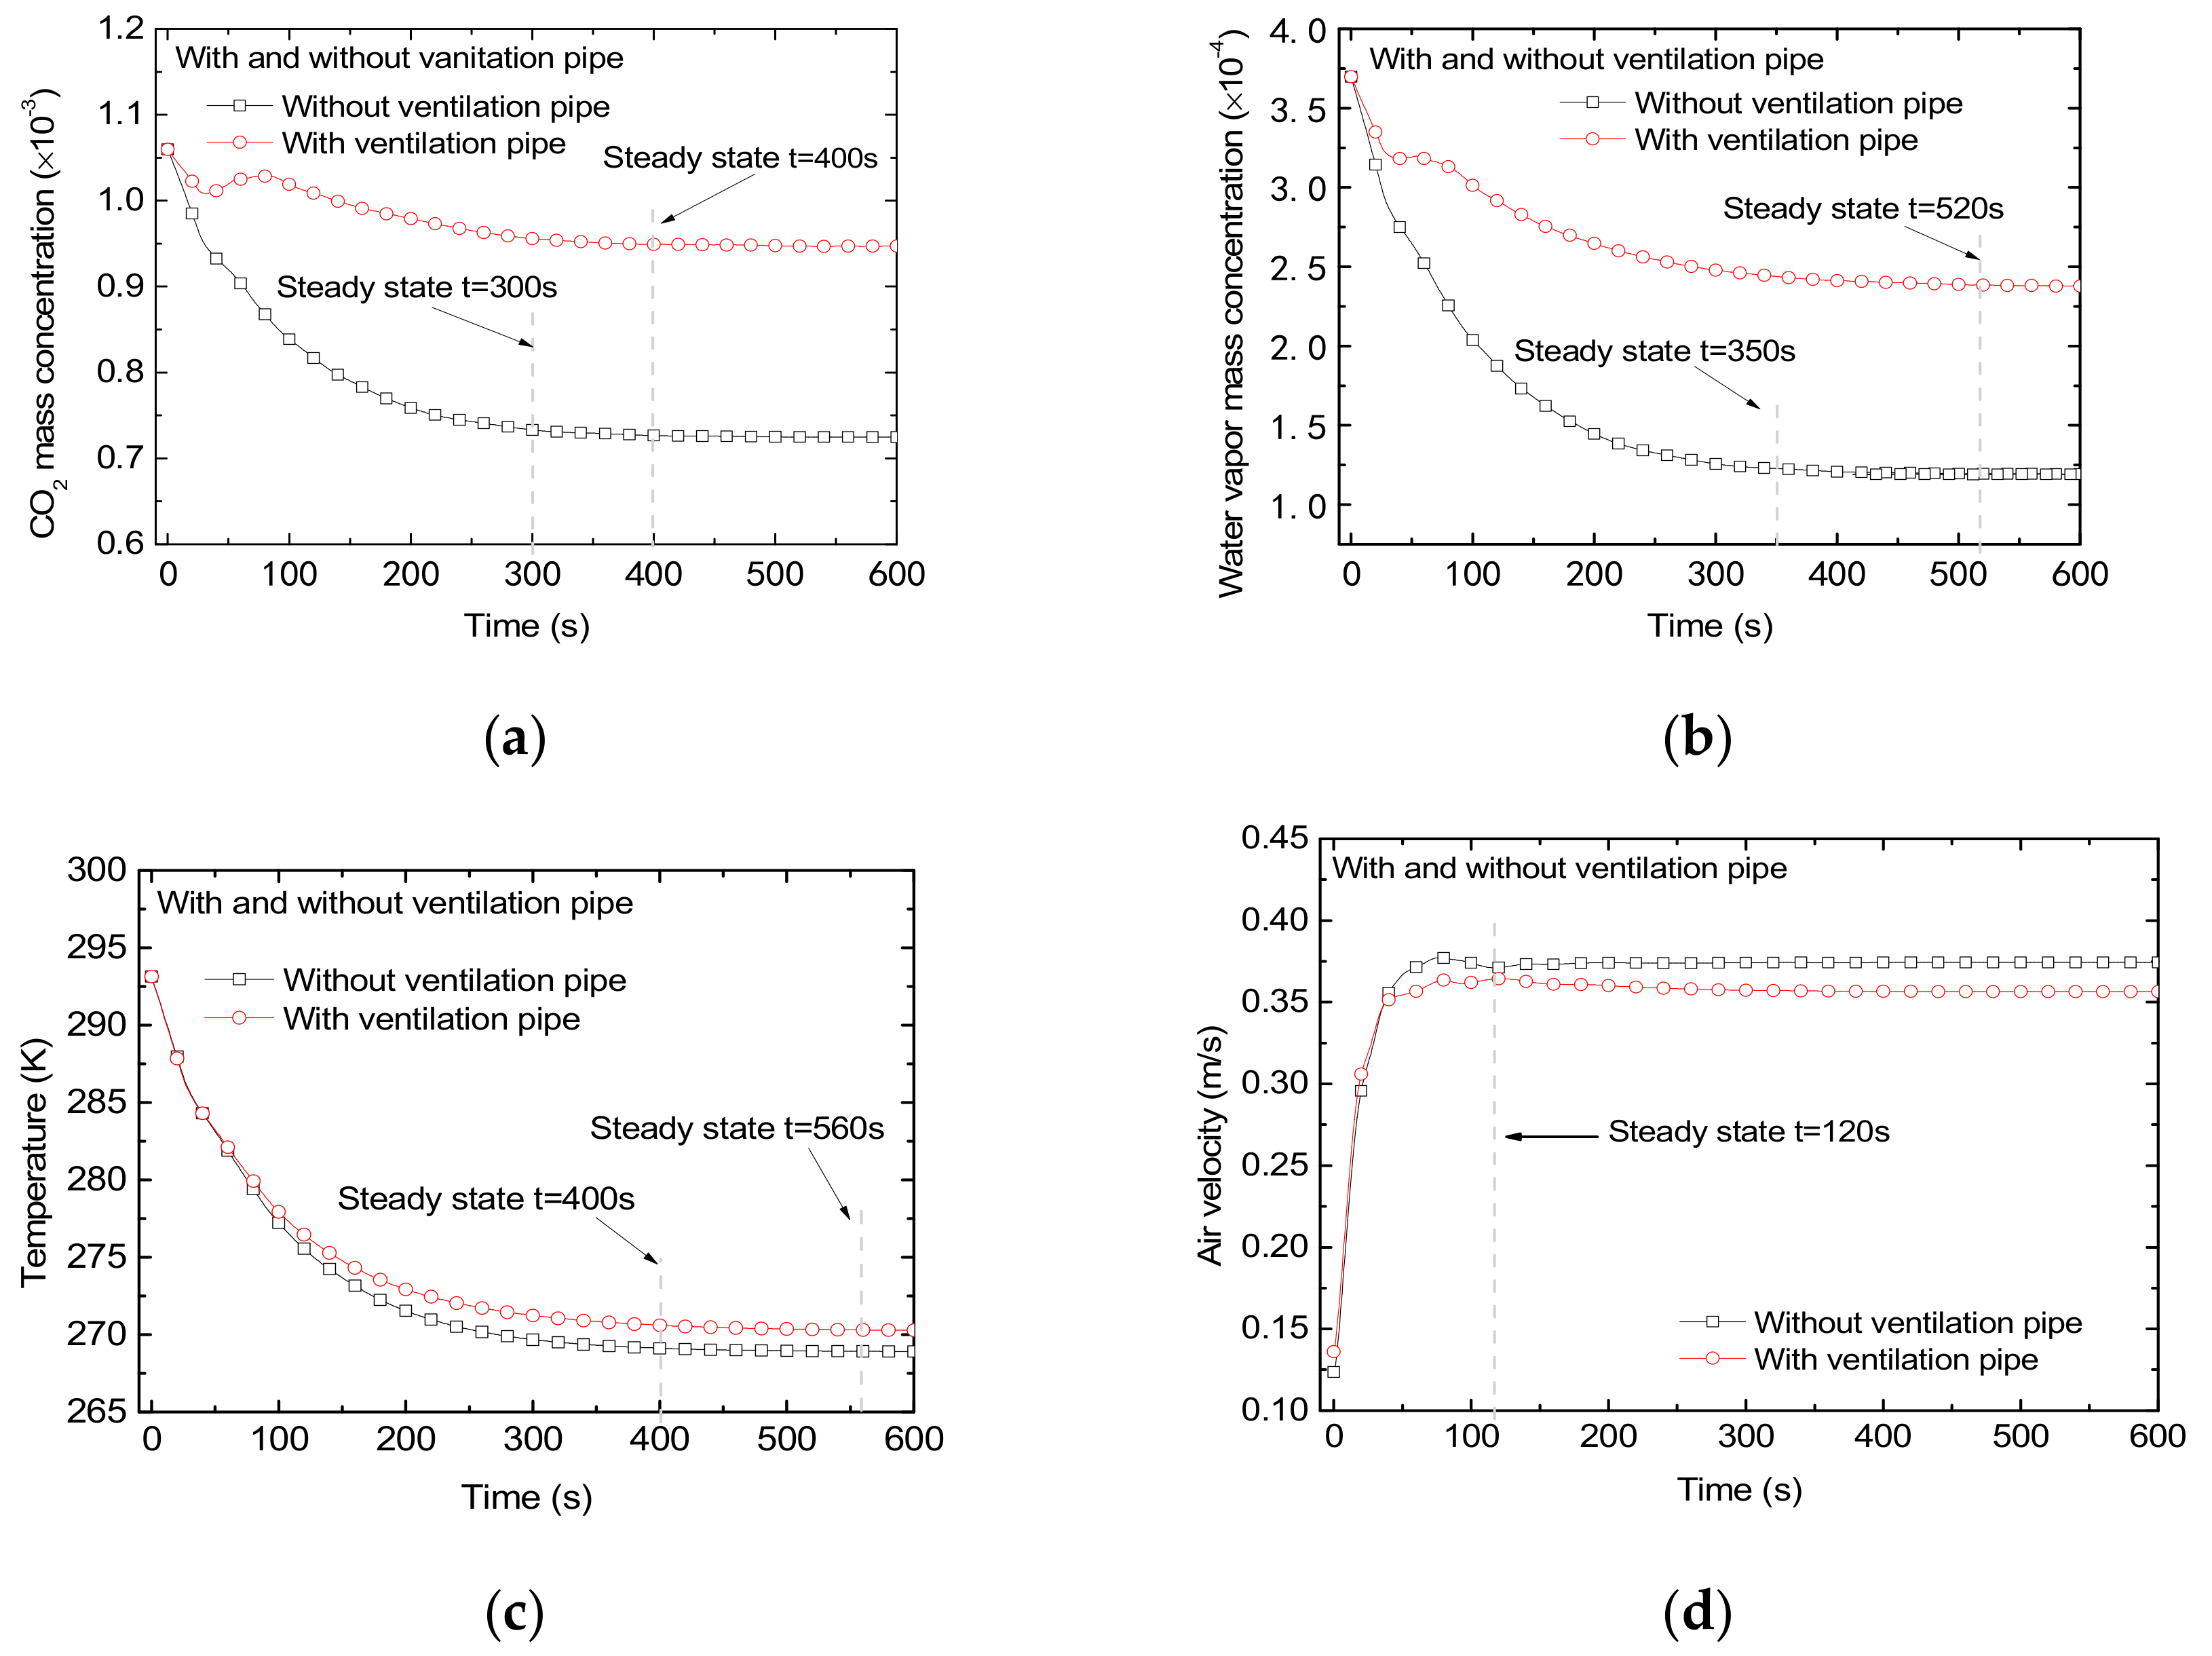
3.3.4. Effects of Ventilation Pipe for Underground Air

The existence of an underground ventilation pipe will improve the thermal environment in the classroom [32]. In the winter, the underground temperature is higher than the outdoor temperature, and the fresh air entering the classroom from the ventilation pipe can be warm, compared to that of the outdoor. The comparison for the cases with and without underground ventilation pipe is presented in Figure 12. For the two cases, the indoor temperature also dropped rapidly when the window was opened, but compared with the case without the ventilation pipe, the temperature dropped more slowly when there was a ventilation pipe. Once the steady state was reached, the indoor temperature of the classroom was evidently higher. When there were ventilation pipes, the improvement of indoor air quality by opening windows weakened. The main ventilation pipes are connected to the underground, and the initial mass fraction of carbon dioxide and water vapor may be relatively large compared to the natural air, so it leads to larger carbon dioxide and water vapor concentrations. In addition, the ventilation pipe has little effect on the average turbulent velocity in the room. The average turbulent velocity in the room with a ventilation pipe will be slightly higher than that without ventilation ducts. This is mainly possible due to the difference between the initial temperature of the ventilation pipes and the indoor temperature, which will speed up indoor air convection [33]. In general, the installation of underground ventilation pipes can increase the indoor temperature to a certain extent when the outdoor temperature is much lower than the indoor temperature. For the case without a ventilation pipe, when the window was opened in the winter, the indoor temperature dropped rapidly; but for the case with an underground ventilation pipe, it improved and slowed down the drop of the indoor temperature. To summarize, setting underground ventilation pipes is an energy-efficient and healthy building method that can increase indoor temperatures in the winter.

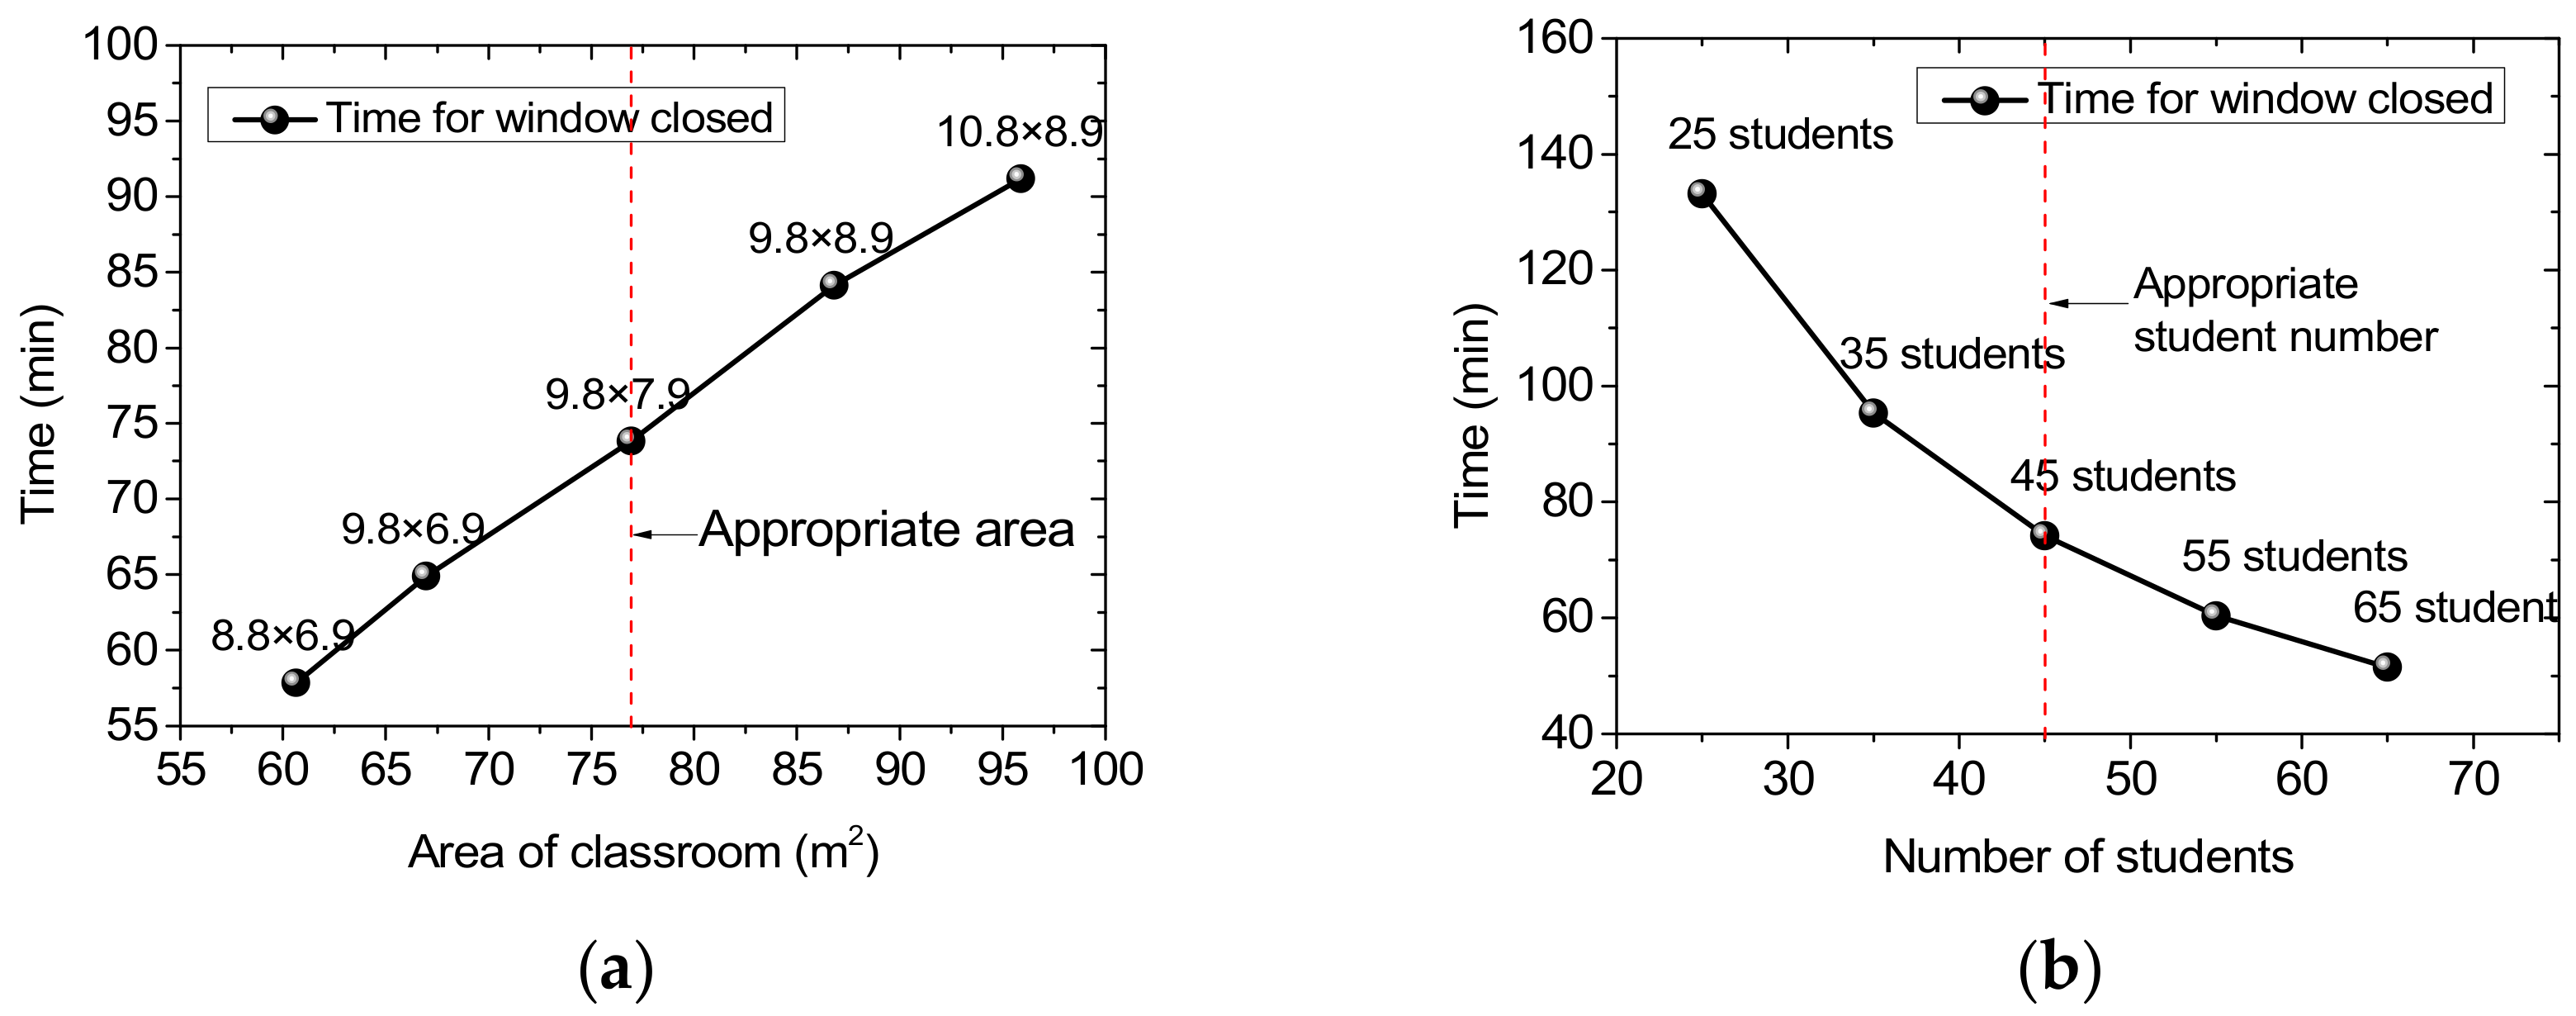
3.3.5. Effects of Area of the Classroom

During the winter, classrooms may be left open for long periods. When the indoor carbon dioxide concentration reaches 700 ppm, students will obviously feel tired and lethargic [34]. At this time, the windows in the classroom need to be opened for ventilation. Under the condition that the windows are not opened for a certain period, the carbon dioxide concentration in the classroom is closely related to the number of students and the size of the classroom. The following analysis assumes that the initial carbon dioxide concentration in the classroom is 400 ppm, and there are 45 students in the classroom. In addition, the height of the classroom is 3.9 m. Figure 13a shows the relationship between the classroom area and the time for the window to closed, under the condition that the indoor carbon dioxide concentration is lower than 700 ppm. It can be found that with the increase of the building area, the time for windows to closed will increase. However, with the increase in the building area, the construction cost will greatly increase. According to the previous results, after 5 min of ventilation by the opening of the windows, the carbon dioxide concentration in the classroom will be significantly improved, so there is no need to increase the building area a lot. In summary, the existing building area of 77.42 m2 (9.8 m long, 7.9 m wide) is a relatively suitable building area, which can save construction costs and keep windows open for up to 74 min.
Figure 13b shows the relationship between the number of students in the classroom and the time for the window closed, also under a condition of indoor carbon dioxide concentration smaller than 700 ppm. It can be found that with the reduction of the number of students, the indoor time for windows closed will increase, but the reduction of the number of students will greatly increase the teaching costs. The above analysis results show that the carbon dioxide concentration in the classroom will be significantly improved for 5 min of ventilation by open windows or doors at class intervals, so there is no need to significantly reduce the number of students in the classroom. Therefore, the existing number of students (45) is also a relatively suitable number, which cannot only save construction costs but also meet relevant teaching regulations.

4. Discussion

Based on local meteorological data, the average temperature in the Yulin area can only meet the thermal environment requirements in July and August, while the temperature from October to March of the next year will be below 10 °C (and the temperature remains low for a long time). By setting up double-sided corridors, the effect of heat preservation can be obviously achieved, and the inlet temperature can be increased. Although the double-sided corridors may reduce the indoor inlet velocity to a certain extent, indoor air quality can be still improved in a short period. Hence, the existing double-sided corridor building structure is a more energy-efficient structural design than no corridor and single-sided corridor. The underground ventilation pipe can increase the indoor temperature when the indoors is in a low state, which is an energy-saving design method that can effectively improve indoor comfort. The with/height ratio of the window has a great influence on the indoor temperature and air quality. As the width/height ratio of the window increases, the window area for ventilation will increase, which will speed up the improvement of the indoor air quality. However, if the window area is too large, the indoor thermal insulation effect will be weakened.
In summary, the existing double-sided corridors and the installation of ventilation pipes are relatively reasonable, and can effectively improve the classroom form of student comfort and energy saving in the northern Shaanxi regions of China.

5. Conclusions

The indoor air quality and thermal environment of a typical primary school classroom in Yulin city of Shaanxi Province were numerically investigated in this study. The influence of natural underground ventilation pipes and classroom building structures on air quality and the thermal environment in the classroom were discussed. The main conclusions are as follows:
(1)
The faster the entrance air flow rate in the classroom, the faster the indoor air quality is improved in the case of natural ventilation, and the greater the indoor turbulent velocity. The indoor air quality in the summer will improve faster, thus leading to a larger airflow in the room due to the greater inlet velocity and temperature in the summer.
(2)
The underground ventilation pipe will significantly increase the average indoor temperature when the window is opened. The presence of the ventilation pipe will weaken the air quality improvement of the window opening in the room. The larger the width/height ratio, the faster the indoor air quality of the classroom will improve when the window is opened.
(3)
When students feel uncomfortable and the indoor air quality is poor, open the window for about 5 min, and the indoor air quality will be significantly improved. When the indoor windows are all closed and there are 45 students in the classroom, the indoor CO2 concentration reaches about 700 ppm in about 74 min. The size design of 9.8 m in length and 7.9 m in width can meet the needs of classroom air quality (for a case with 45 students in the classroom).
(4)
For the building structure in Yulin, northern Shaanxi, setting double-sided corridors, underground ventilation corridors, and windows with heights/widths equaling 1 can provide energy-efficient and livable building structures. For cities with similar climate conditions to Yulin, the used sustainable structure and related design in this study could be a practical reference for the construction of classrooms in local primary schools.

Author Contributions

Data curation, K.L.; formal analysis, K.L.; funding acquisition, K.L. and Y.C.; supervision, Y.C.; visualization, K.L.; writing—original draft, K.L.; writing—review and editing, K.L. and Y.C. All authors have read and agreed to the published version of the manuscript.

Funding

The research was supported by the Shaanxi Province 2021 Innovation Capability Support Plan (grant number 2021KRM 100), the Special Scientific Research Plan Project of Shaanxi Provincial Department of Education (grant number 21JK0288), and the Key Science and Technology Innovation Team of Shaanxi Province (grant number 2022TD-34). Grateful appreciation is expressed for the support.

Institutional Review Board Statement

Not applicable.

Informed Consent Statement

Not applicable.

Data Availability Statement

The monitoring data in this study have been provided in the text. Other data presented in this study are available on request from the corresponding author.

Acknowledgments

The authors sincerely acknowledge the former researchers for their excellent work, which greatly assisted our academic study.

Conflicts of Interest

The authors declare no conflict of interest.

References

  1. Pirouz, B.; Palermo, S.; Naghib, S.; Mazzeo, D.; Turco, M.; Piro, P. The Role of HVAC Design and Windows on the Indoor Airflow Pattern and ACH. Sustainability 2021, 13, 7931. [Google Scholar] [CrossRef]
  2. Kapoor, N.R.; Kumar, A.; Alam, T.; Kumar, A.; Kulkarni, K.S.; Blecich, P. A Review on Indoor Environment Quality of Indian School Classrooms. Sustainability 2021, 13, 11855. [Google Scholar] [CrossRef]
  3. Wargocki, P.; Porras-Salazar, J.A.; Contreras-Espinoza, S.; Bahnfleth, W. The relationships between classroom air quality and children’s performance in school. Build. Environ. 2020, 173, 106749. [Google Scholar] [CrossRef]
  4. Calama-González, C.M.; León-Rodríguez, Á.L.; Suárez, R. Indoor Air Quality Assessment: Comparison of Ventilation Scenarios for Retrofitting Classrooms in a Hot Climate. Energies 2019, 12, 4607. [Google Scholar] [CrossRef]
  5. Saif, J.; Wright, A.; Khattak, S.; Elfadli, K. Keeping Cool in the Desert: Using Wind Catchers for Improved Thermal Comfort and Indoor Air Quality at Half the Energy. Buildings 2021, 11, 100. [Google Scholar] [CrossRef]
  6. Chatzidiakou, L.; Mumovic, D.; Summerfield, A.J. What do we know about indoor air quality in school classrooms? A critical review of the literature. Intell. Build. Int. 2012, 4, 228–259. [Google Scholar] [CrossRef]
  7. Wargocki, P.; Wyon, D.P. Ten questions concerning thermal and indoor air quality effects on the performance of office work and schoolwork. Build. Environ. 2017, 112, 359–366. [Google Scholar] [CrossRef]
  8. Kaewrat, J.; Janta, R.; Sichum, S.; Kanabkaew, T. Indoor Air Quality and Human Health Risk Assessment in the Open-Air Classroom. Sustainability 2021, 13, 8302. [Google Scholar] [CrossRef]
  9. Sadrizadeh, S.; Yao, R.; Yuan, F.; Awbi, H.; Bahnfleth, W.; Bi, Y.; Cao, G.; Croitoru, C.; de Dear, R.; Haghighat, F.; et al. Indoor air quality and health in schools: A critical review for developing the roadmap for the future school environment. J. Build. Eng. 2022, 57, 104908. [Google Scholar] [CrossRef]
  10. Son, S.; Jang, C.-M. Air Ventilation Performance of School Classrooms with Respect to the Installation Positions of Return Duct. Sustainability 2021, 13, 6188. [Google Scholar] [CrossRef]
  11. Stabile, L.; Massimo, A.; Canale, L.; Russi, A.; Andrade, A.; Dell’Isola, M. The Effect of Ventilation Strategies on Indoor Air Quality and Energy Consumptions in Classrooms. Buildings 2019, 9, 110. [Google Scholar] [CrossRef]
  12. Chatzidiakou, L.; Mumovic, D.; Summerfield, A.J.; Hong, S.M.; Altamirano-Medina, H. A Victorian school and a low carbon designed school: Comparison of indoor air quality, energy performance, and student health. Indoor Built Environ. 2014, 23, 417–432. [Google Scholar] [CrossRef]
  13. Stazi, F.; Naspi, F.; D’Orazio, M. Modelling window status in school classrooms. Results from a case study in Italy. Build. Environ. 2017, 111, 24–32. [Google Scholar] [CrossRef]
  14. Karimipanah, T.; Awbi, H.B.; Sandberg, M.; Blomqvist, C. Investigation of air quality, comfort parameters and effectiveness for two floor-level air supply systems in classrooms. Build. Environ. 2007, 42, 647–655. [Google Scholar] [CrossRef]
  15. Liu, J.; Yang, X.; Jiang, Q.; Qiu, J.; Liu, Y. Occupants’ thermal comfort and perceived air quality in natural ventilated classrooms during cold days. Build. Environ. 2019, 158, 73–82. [Google Scholar] [CrossRef]
  16. Ghaffarianhoseini, A.; Berardi, U.; Ghaffarianhoseini, A. Thermal performance characteristics of unshaded courtyards in hot and humid climates. Build. Environ. 2015, 87, 154–168. [Google Scholar] [CrossRef]
  17. Calautit, J.K.; Tien, P.W.; Wei, S.; Calautit, K.; Hughes, B. Numerical and experimental investigation of the indoor air quality and thermal comfort performance of a low energy cooling windcatcher with heat pipes and extended surfaces. Renew. Energy 2020, 145, 744–756. [Google Scholar] [CrossRef]
  18. Ahmed, T.; Kumar, P.; Mottet, L. Natural ventilation in warm climates: The challenges of thermal comfort, heatwave resilience and indoor air quality. Renew. Sustain. Energy Rev. 2021, 138, 110669. [Google Scholar] [CrossRef]
  19. Li, Y.; Xie, Z.X.; Qin, Y.C.; Xia, H.M.; Zheng, Z.C.; Zhang, L.J.; Pan, Z.W.; Liu, Z.Z. Drought Under Global Warming and Climate Change: An Empirical Study of the Loess Plateau. Sustainability 2019, 11, 1281. [Google Scholar] [CrossRef]
  20. Dong, J.; Chen, Z.; Zhang, L.; Cheng, Y.; Sun, S.; Jie, J. Experimental investigation on the heating performance of a novel designed trombe wall. Energy 2018, 168, 728–736. [Google Scholar] [CrossRef]
  21. Bakó-Biró, Z.; Clements-Croome, D.J.; Kochhar, N.; Awbi, H.B.; Williams, M.J. Ventilation rates in schools and pupils’ performance. Build. Environ. 2012, 48, 215–223. [Google Scholar] [CrossRef]
  22. Kabanshi, A.; Wigö, H.; Sandberg, M. Experimental evaluation of an intermittent air supply system—Part 1: Thermal comfort and ventilation efficiency measurements. Build. Environ. 2016, 95, 240–250. [Google Scholar] [CrossRef]
  23. Center, N.M.I. China Meterorological Data Service Center. 2020. Available online: http://data.cma.cn/en (accessed on 10 June 2020).
  24. Wilcox, D.C. Turbulence Modeling for CFD, 3rd ed.; Dcw Industries, Incorporated: La Cañada Flintridge, CA, USA, 2006. [Google Scholar]
  25. Zhang, T.T.; Lee, K.; Chen, Q.Y. A simplified approach to describe complex diffusers in displacement ventilation for CFD simulations. Indoor Air 2009, 19, 255–267. [Google Scholar] [CrossRef] [PubMed]
  26. Lin, Z.; Chow, T.T.; Wang, Q.; Fong, K.F.; Chan, L.S. Validation of CFD Model for Research into Displacement Ventilation. Arch. Sci. Rev. 2005, 48, 305–316. [Google Scholar] [CrossRef]
  27. Hussain, S.; Oosthuizen, P.; Kalendar, A. Evaluation of various turbulence models for the prediction of the airflow and temperature distributions in atria. Energy Build. 2012, 48, 18–28. [Google Scholar] [CrossRef]
  28. Putra, J.C.P. A Study of Thermal Comfort and Occupant Satisfaction in Office Room. Procedia Eng. 2017, 170, 240–247. [Google Scholar] [CrossRef]
  29. Asmi, A.; Putra, J.C.P.; Rahman, I.A. Simulation of Room Airflow Using Comsol Multiphysics Software. Appl. Mech. Mater. 2013, 465–466, 571–577. [Google Scholar] [CrossRef]
  30. Wang, X. Experimental Study of Human Carbon Dioxide Generation Rate at Different Activity Levels. Master’s Thesis, Xi’an University of Architecture and Technology, Xi’an, China, 2021. [Google Scholar]
  31. Li, C.; Wu, P.T.; Li, X.L.; Zhou, T.W.; Sun, S.K.; Wang, Y.B.; Luan, X.B.; Yu, X. Spatial and temporal evolution of climatic factors and its impacts on potential evapotranspiration in Loess Plateau of Northern Shaanxi, China. Sci. Total Environ. 2017, 589, 165–172. [Google Scholar] [CrossRef]
  32. Chenari, B.; Dias Carrilho, J.; Gameiro da Silva, M. Towards sustainable, energy-efficient and healthy ventilation strategies in buildings: A review. Renew. Sustain. Energy Rev. 2016, 59, 1426–1447. [Google Scholar] [CrossRef]
  33. Posner, J.; Buchanan, C.; Dunn-Rankin, D. Measurement and prediction of indoor air flow in a model room. Energy Build. 2002, 35, 515–526. [Google Scholar] [CrossRef]
  34. Zhu, C.; Li, N. Study on indoor air quality evaluation index based on comfort evaluation experiment. Procedia Eng. 2017, 205, 2246–2253. [Google Scholar] [CrossRef]
Figure 1. The location and area of the primary school.
Sustainability 14 12039 g001
Figure 2. Plane view of a typical primary school classroom in northern Shaanxi.
Sustainability 14 12039 g002
Figure 3. The distributions of the test points in a classroom.
Sustainability 14 12039 g003
Figure 4. Mesh distributions of the numerical model.
Sustainability 14 12039 g004
Figure 5. Monitoring results of the thermal environment and air quality of the classroom: (a) temperature; (b) humidity; and (c) CO2 concentration contour at 10:00 AM.
Sustainability 14 12039 g005
Figure 6. Contours for the case with an inlet velocity of 0.3 m/s.
Sustainability 14 12039 g006
Figure 7. Simulation results of CO2 concentration for case 1: (a) mass fraction distributions at 1000 s; (b) Comparison with monitoring results.
Sustainability 14 12039 g007aSustainability 14 12039 g007b
Figure 8. The simulation results for the analysis of the effect of corridors: (a) CO2 mass concentration; (b) water vapor mass concentration; (c) indoor temperature; (d) air flow velocity within the classroom.
Sustainability 14 12039 g008
Figure 9. The simulation results for the analysis of effect of width/height ratio of window: (a) CO2 mass concentration; (b) water vapor mass concentration; (c) indoor temperature; (d) air flow velocity within the classroom.
Sustainability 14 12039 g009
Figure 10. The simulation results for the analysis of effect of window open mode: (a) CO2 mass concentration; (b) water vapor mass concentration; (c) indoor temperature; (d) air flow velocity within the classroom.
Sustainability 14 12039 g010
Figure 11. The simulation results for the analysis of effect of seasonal conditions: (a) CO2 mass concentration; (b) water vapor mass concentration; (c) indoor temperature; (d) air flow velocity within the classroom.
Sustainability 14 12039 g011
Figure 12. The simulation results for the analysis of effect of ventilation pipe: (a) CO2 mass concentration; (b) water vapor mass concentration; (c) indoor temperature; (d) air flow velocity within the classroom.
Sustainability 14 12039 g012
Figure 13. Relationships between classroom area, student number, and time for window closed under a condition of CO2 concentration smaller than 700 ppm: (a) classroom area; (b) student number.
Sustainability 14 12039 g013
Table 1. Model parameters for the numerical model for a typical classroom.
ItemNumberSize (m)
Small window20.9 × 2.1 m
Large window42.1 × 2.1 m
Door21 × 2.5 m
Classroom19.8 × 7.9 × 3.9 m
Ventilation pipe20.45 × 0.56 m
Note: The distance of the windows from the ground is 0.4 m.
Table 2. Boundary conditions for the numerical model.
BoundaryPhysical VariablesValueUnit
InletVelocityFixed valuem/s
TemperatureFixed value°C
CO2 concentration400ppm
Water vapor concentration200ppm
OutletPressure0Pa
BottomCO2 source32 g/h/studentg
Water vapor source16.7 g/h/studentg
Top and sidesPressureNo slip/
TemperatureZero flux/
Table 3. Details for the 10 simulation scenarios.
CaseVentilation PipeCorridorsIntelInitial ConditionWidth/Height of Window
CO2 Concentration (ppm)Temperature (°C)Velocity (m/s)CO2 Concentration (ppm)Temperature (°C)
1NoYes40000.3750201:1
2NoYes40000.4750201:1
3NoYes40000.5750201:1
4NoNo40001750201:1
5NoNo400−51.5750201:1
6NoNo400242750201.1:1
7NoNo400242750200.8
8NoNo400242750201
9YesNo400−51.5750201
10NoNo400−5 (large window)1.5750201
Table 4. Test results of CO2 concentration in a typical classroom.
TimeCO2 Concentration (ppm)
A1A2A3B1B2B3B4B5C1C2C3
8:00331332311334326337346313323327299
10:00443435478554632532556435521535478
11:30553577525576585575536556521556498
15:00568524537563623632676436457665522
17:00523415535526675662553532523611567
Publisher’s Note: MDPI stays neutral with regard to jurisdictional claims in published maps and institutional affiliations.

