
Visual Management Requirements to Support Design Planning and Control within Digital Contexts

 , , ,
, , ,
Abstract
:1. Introduction
2. Design Planning and Control
3. Visual Management
4. VM Requirements Identified in the Literature Review
5. Research Method
5.1. Research Approach
5.2. Research Design
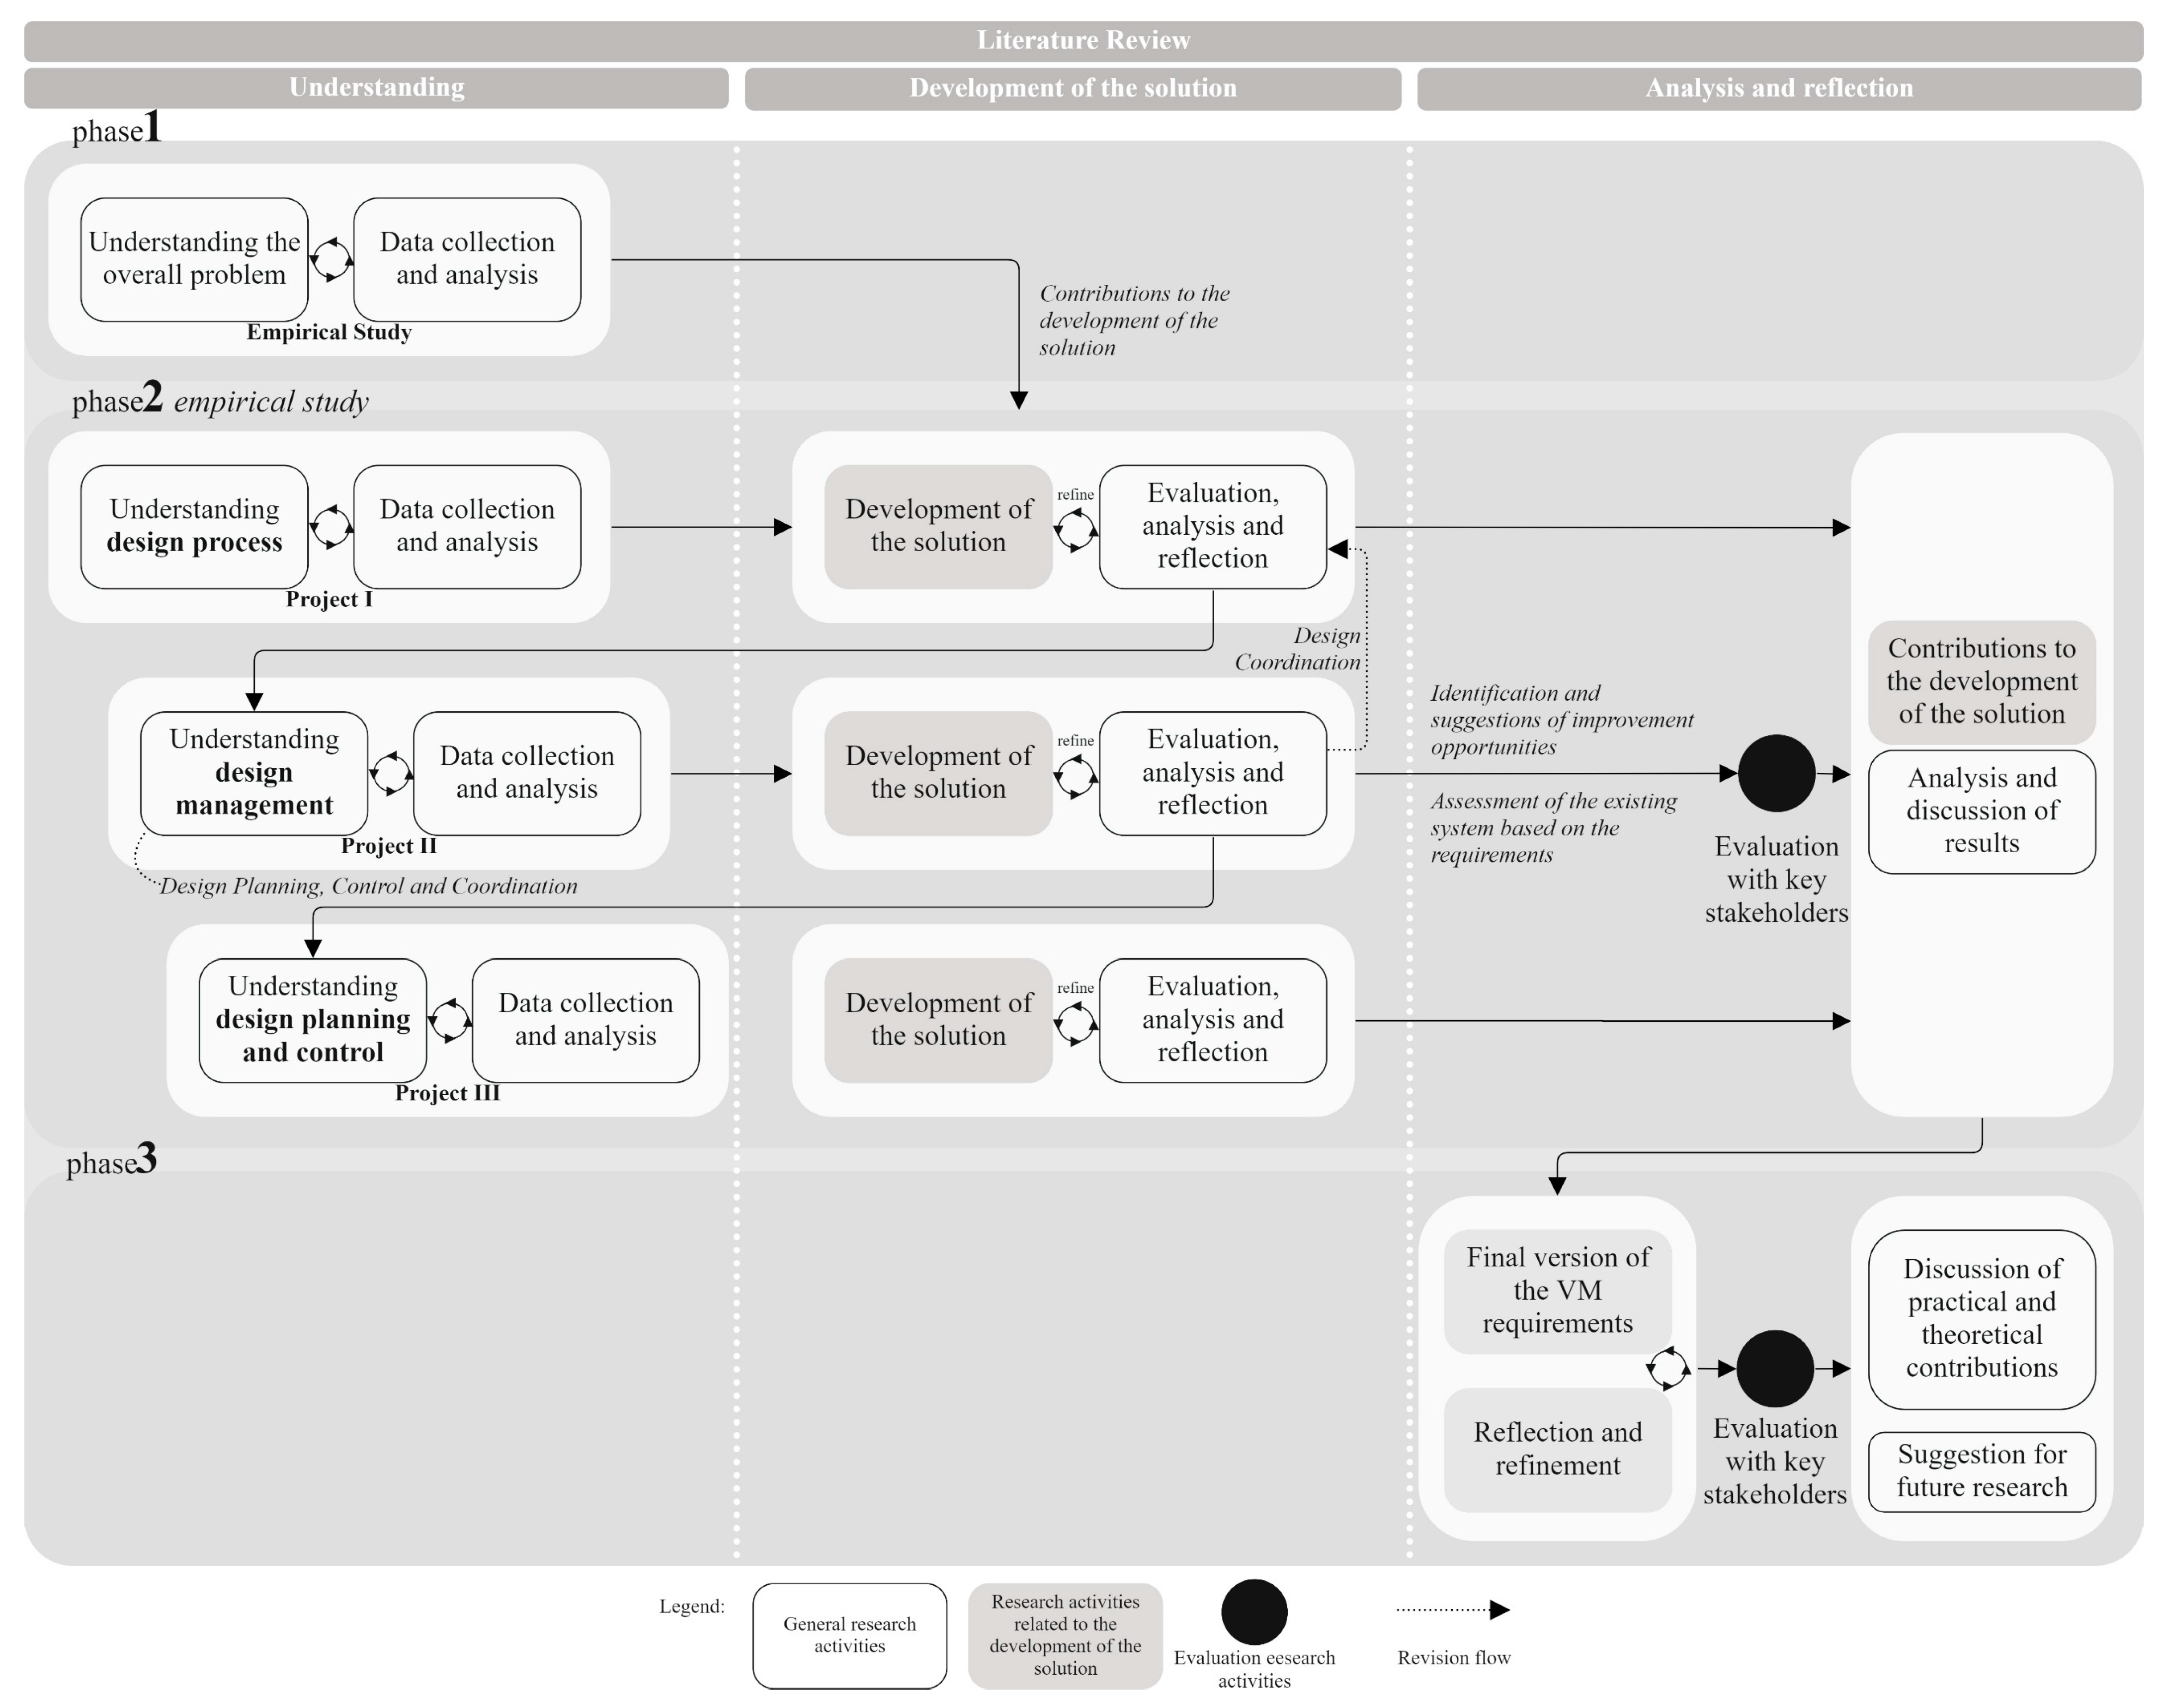
- (i)
- Phase 1—consisted of an overall assessment of the problems faced by the company within design planning and control. Moreover, a literature review was carried out to identify a knowledge gap. An initial set of VM requirements were identified from the literature, considering different contexts, e.g., design, construction, and manufacturing. At the end of this stage, the initial scope of the investigation was defined;
- (ii)
- Phase 2—consisted of the development of the empirical study, in which the existing design planning and control system was assessed, as well as visual management practices from each project investigated, based on the set of requirements that were identified in the literature. Improvement opportunities for the company were also identified. The scope of the investigation was refined in Phase 2. Project I data supported the analysis of the context through a broad perspective of the design process. Project II was focused on the design management, i.e., design planning, control, and coordination. Project III also focused on design planning and control, but provided an opportunity for an in-depth understanding on the topic, based on discussions related to the implementation of new digital VM practices to support planning and control;
- (iii)
- Phase 3—consisted of the assessment and refinement of the set of requirements, and a reflection on the practical and theoretical implications of this investigation.
5.3. Detail Description of Research Activities
5.4. Analysis, Reflection, and Evaluation of the Solution
6. Results
Existing Design Planning and Control System
7. Refinement and Assessment of Requirements
7.1. Refinement of the Requirements
7.2. Assessment of the VM Practices
8. Discussion and Evaluation of the Requirements
9. Conclusions and Suggestions for Further Work
Author Contributions
Funding
Institutional Review Board Statement
Informed Consent Statement
Data Availability Statement
Acknowledgments
Conflicts of Interest
References
- Laufer, A.; Hoffman, E.J.; Russell, J.S.; Cameron, W.S. What successful project managers do. MIT Sloan Manag. Rev. 2015, 56, 43–51. [Google Scholar] [CrossRef]
- Li, Y.; Taylor, T.R.B. Modeling the impact of design rework on transportation infrastructure construction project performance. J. Constr. Eng. Manag. 2014, 140, 1–8. [Google Scholar] [CrossRef]
- Maguire, L.M.D. Managing the hidden costs of coordination. Queue 2019, 7, 71–93. [Google Scholar] [CrossRef]
- Atkinson, R.; Crawford, L.; Ward, S. Fundamental uncertainties in projects and the scope of project management. Int. J. Proj. Manag. 2006, 24, 687–698. [Google Scholar] [CrossRef]
- Tribelsky, E.; Sacks, R. An empirical study of information flows in multidisciplinary civil engineering design teams using lean measures. Arch. Eng. Des. Manag. 2011, 7, 85–101. [Google Scholar] [CrossRef]
- Wesz, J.G.B.; Formoso, C.T.; Tzortzopoulos, P. Planning and controlling design in engineered-to-order prefabricated building systems. Eng. Constr. Arch. Manag. 2018, 25, 134–152. [Google Scholar] [CrossRef]
- Hooper, M.; Ekholm, A. A pilot study: Towards BIM integration—An analysis of design information exchange & coordination. In Proceedings of the CIB W78 2010: 27th International Conference, Cairo, Egypt, 16–18 November 2010; pp. 16–18. [Google Scholar]
- Kleinsmann, M.; Valkenburg, R. Barriers and enablers for creating shared understanding in co-design projects. Des. Stud. 2008, 29, 369–386. [Google Scholar] [CrossRef]
- Saurin, T.A.; Gonzalez, S.S. Assessing the compatibility of the management of standardized procedures with the complexity of a sociotechnical system: Case study of a control room in an oil refinery. Appl. Ergon. 2013, 44, 811–823. [Google Scholar] [CrossRef]
- Dallasega, P.; Rauch, E.; Linder, C. Industry 4.0 as an enabler of proximity for construction supply chains: A systematic literature review. Comput. Ind. 2018, 99, 205–225. [Google Scholar] [CrossRef]
- Oesterreich, T.D.; Teuteberg, F. Understanding the implications of digitisation and automation in the context of Industry 4.0: A triangulation approach and elements of a research agenda for the construction industry. Comput. Ind. 2016, 83, 121–139. [Google Scholar] [CrossRef]
- Greif, M. The Visual Factory: Building Participation through Shared Information; CRC Press: Portland, OR, USA, 1991. [Google Scholar]
- Koskela, L. An Exploration towards a Production Theory and Its Application to Construction; Helsinki University of Technology: Espoo, Finland, 2000. [Google Scholar]
- Lindlöf, L. Visual Management—On Communication in Product Development Organizations; Chalmers University of Technology: Gothenburg, Sweden, 2014. [Google Scholar]
- SDGs. The Sustainable Development Goals Report 2019; United Nations: New York, NY, USA, 2019; ISBN 978-92-1-101403-7. [Google Scholar]
- Koskela, L. Application of the New Production Philosophy to Construction; Stanford University: Stanford, CA, USA, 1992. [Google Scholar]
- Tjell, J.; Bosch-Sijtsema, P.M. Visual Management in Mid-sized Construction Design Projects. Procedia Econ. Financ. 2015, 21, 193–200. [Google Scholar] [CrossRef]
- Tezel, B.A. Visual Management: An Exploration of the Concept and Its Implementation in Construction. Ph.D. Thesis, University Salford, Manchester, UK, 2011. [Google Scholar]
- Brady, D.A.; Tzortzopoulos, P.; Rooke, J.; Formoso, C.T.; Tezel, A. Improving transparency in construction management: A visual planning and control model. Eng. Constr. Arch. Manag. 2018, 25, 1277–1297. [Google Scholar] [CrossRef]
- Beynon-Davies, P.; Lederman, R. Making sense of visual management through affordance theory. Prod. Plan. Control 2017, 28, 142–157. [Google Scholar] [CrossRef]
- Brandalise, F.M.P.; Formoso, C.T.; Viana, D.D. Development of a Typology for Understanding Visual Management Concepts and Their Relationships. J. Constr. Eng. Manag. 2022, 148, 04022041. [Google Scholar] [CrossRef]
- Killen, C.P.; Kjaer, C. Understanding project interdependencies: The role of visual representation, culture and process. Int. J. Proj. Manag. 2012, 30, 554–566. [Google Scholar] [CrossRef]
- Tezel, A.; Aziz, Z. From conventional to it based visual management: A conceptual discussion for lean construction. J. Inf. Technol. Constr. 2017, 22, 220–246. [Google Scholar]
- Ewenstein, B.; Whyte, J. Knowledge Practices in Design: The Role of Visual Representations as ‘Epistemic Objects’. Organ. Stud. 2009, 30, 07–30. [Google Scholar] [CrossRef]
- Mäki, T.; Kerosuo, H. Design-related questions in the construction phase: The effect of using the Last Planner System in design management. Can. J. Civ. Eng. 2019, 47, 132–139. [Google Scholar] [CrossRef]
- Cross, N. Engineering Design Methods: Strategies for Product Design; John Wiley & Sons Ltd.: Chichester, UK, 1995; Volume 16. [Google Scholar]
- Hamzeh, F.R.; Ballard, G.; Tommelein, I.D. Is the Last Planner System applicable to design? A case study. Proceedings of IGLC17: 17th Annual Conference of the International Group for Lean Construction, Taipei, Taiwan, 15–17 July 2009; pp. 165–176. [Google Scholar]
- Pikas, E.; Koskela, L.; Seppänen, O. Improving Building Design Processes and Design Management Practices: A Case Study. Sustainability 2020, 12, 911. [Google Scholar] [CrossRef]
- Ballard, G.; Howell, G. Shielding Production: Essential Step in Production Control. J. Constr. Eng. Manag. 1998, 124, 11–17. [Google Scholar] [CrossRef]
- Saad, M.; Maher, M. Lou Shared understanding in computer-supported collaborative design. CAD Comput. Aided Des. 1996, 28, 183–192. [Google Scholar] [CrossRef]
- Wood, D.J.; Gray, B. Toward a Comprehensive Theory of Collaboration. J. Appl. Behav. Sci. 1991, 27, 139–162. [Google Scholar] [CrossRef]
- Emmitt, S.; Sander, D.; Chritoffersen, A.K. Implementing of Value Through Lean Design Management. In Proceedings of the IGLC12: 12th Annual Conference of the International Group for Lean Construction, Helsingør, Denmark; 2004; pp. 361–374. [Google Scholar]
- Baldauf, J.P.; Formoso, C.T.; Tzortzopoulos, P.; Miron, L.I.G.; Soliman, J. Usi6ng building information modelling to manage client requirements in social housing projects. Sustainability 2020, 12, 2804. [Google Scholar] [CrossRef]
- Liao, L.; Teo, E.A.L.; Chang, R.; Zhao, X. Diffusion of building information modeling in building projects and firms in Singapore. Sustainability 2020, 12, 7762. [Google Scholar] [CrossRef]
- Mesa, H.A.; Molenaar, K.R.; Alarcón, L.F. Modeling supply chain integration in an integrated project delivery system. Sustainability 2020, 12, 5092. [Google Scholar] [CrossRef]
- Ugwu, O.O.; Anumba, C.J.; Newnham, L.; Thorpe, A. Agent-based collaborative design of constructed facilities, in ‘Artificial Intelligence in Structural Engineering-Information Technology for Design, Manufacturing, Maintenance, and Monitoring’. In Proceedings of the 6th EG-SEA-AI Workshop, Wierzba, Poland, 18–22 September 1999; pp. 199–208. [Google Scholar]
- Anumba, C.J.; Ugwu, O.O.; Newnham, L.; Thorpe, A. Collaborative design of structures using intelligent agents. Autom. Constr. 2002, 11, 89–103. [Google Scholar] [CrossRef]
- Molina, A.I.; Gallardo, J.; Redondo, M.A.; Ortega, M.; Giraldo, W.J. Metamodel-driven definition of a visual modeling language for specifying interactive groupware applications: An empirical study. J. Syst. Softw. 2013, 86, 1772–1789. [Google Scholar] [CrossRef]
- Woods, D.D.; Allspaw, J. Revealing the Critical Role of Human Performance in Software: It’s time to revise our appreciation of the human side of Internet-facing software systems. Queue 2019, 17, 1–13. [Google Scholar] [CrossRef]
- Tezel, A.; Koskela, L.; Tzortzopoulos, P. Visual management in production management: A literature synthesis. J. Manuf. Technol. Manag. 2016, 27, 766–799. [Google Scholar] [CrossRef]
- Galsworth, G.D. Visual Systems: Harnessing the Power of the Visual Workplace; American Management Association: New York, NY, USA, 1997. [Google Scholar]
- Nicolini, D. 2007 Studying visual practices in construction. Build. Res. Inf. 2007, 35, 576–580. [Google Scholar] [CrossRef]
- Valente, C.P.; Brandalise, F.M.P.; Formoso, C.T. Model for Devising Visual Management Systems on Construction Sites. J. Constr. Eng. Manag. 2019, 145, 4018138. [Google Scholar] [CrossRef]
- Tezel, B.A.; Koskela, L.J.; Tzortzopoulos, P. The functions of visual management. In International Research Symposium; University of Salford: Manchester, UK, 2009; pp. 201–219. [Google Scholar]
- Saurin, T.A.; Formoso, C.T.; Cambraia, F.B. Towards a Common Language Between Lean Production and Safety Management. In Proceedings of the 14th Annual Conference of the International Group for Lean Construction, Santiago, Chile; 2006; pp. 483–495. [Google Scholar]
- Viana, D.; Formoso, C.T.; Wesz, J.; Tzortzopoulos, P. The Role of Visual Management in Collaborative Integrated Planning and Control for Engineer-to-Order Building Systems. In Proceedings of the 22nd Annual Conference of the International Group for Lean Construction, Oslo, Norway, 25–27 June 2014; pp. 775–786. [Google Scholar]
- Murata, K. A Study on Digital Visual Management for Providing Right Transparency against Emergencies. In Proceedings of the 22nd Cambridge International Manufacturing Symposium, Cambridge, UK, 27–28 September 2018. [Google Scholar]
- Murata, K. Internal mechanisms framework of lean implementation using the visual management systems. Int. J. Ind. Manag. 2021, 9, 1–14. [Google Scholar]
- Ortiz, C.A.; Park, M. Visual Controls: Applying Visual Management to the Factory; CRC press: Boca Raton, FL, USA, 2011. [Google Scholar]
- Laine, E.; Alhava, O.; Kiviniemi, A. Improving Built-in Quality By Bim. Proceeding IGLC-22 2014, 22, 945–956. [Google Scholar]
- Eppler, M.J.; Bresciani, S. Visualization in Management: From Communication to Collaboration. A Response to Zhang. J. Vis. Lang. Comput. 2013, 24, 146–149. [Google Scholar] [CrossRef]
- Barth, K.B.; Formoso, C.T. Requirements in performance measurement systems of construction projects from the lean production perspective. Front. Eng. Manag. 2021, 8, 442–455. [Google Scholar] [CrossRef]
- Eppler, M.J.; Mengis, J.; Bresciani, S. Seven Types of Visual Ambiguity: On the Merits and Risks of Multiple Interpretations of Collaborative Visualizations. In Proceedings of the 2008 12th International Conference Information Visualisation, Washington, DC, USA, 9–11 July 2008; IEEE: Piscataway, NJ, USA, 2008; pp. 391–396. [Google Scholar]
- Den Otter ad F and Prins M Architectural design management within the digital design team. Eng. Constr. Arch. Manag. 2002, 9, 162–173. [CrossRef]
- Knop, K. Importance of visual management in metal and automotive branch and its influence in building a competitive advantage. Polish J. Manag. Stud. 2020, 22, 263–278. [Google Scholar]
- Lomba, M.; dos Santos, A. A. A protocol to assess transparency towards sustainability on digital services. In Experience Design Korea & Latin America Research Exchange; Human and Design Press: Seoul, Korea, 2021; p. 283. [Google Scholar]
- Galsworth, G.D. Visual Workplace Visual Thinking: Creating Enterprise Excellence Through the Technologies of the Visual Workplace, 2nd ed.; CRC Press: Boca Raton, FL, USA, 2017. [Google Scholar]
- Formoso, C.T.; dos Santos, A.; Powell, J.A. An exploratory study on the applicability of process transparency in construction sites. J. Constr. Res. 2002, 3, 35–54. [Google Scholar] [CrossRef]
- March, S.T.; Smith, G.F. Design and natural science research on information technology. Decis. Support Syst. 1995, 15, 251–266. [Google Scholar] [CrossRef]
- Lukka, K. The constructive research approach. Case study Res. Logist. Publ. Turku Sch. Econ. Bus. Adm. Ser. B 2003, 1, 83–101. [Google Scholar]
- Van Aken, J.E. Management Research Based on the Paradigm of the Design Sciences: The Quest for Field-Tested and Grounded Technological Rules. J. Manag. Stud. 2004, 41, 219–246. [Google Scholar] [CrossRef]
- Holmström, J.; Ketokivi, M.; Hameri, A.P. Bridging practice and theory: A design science approach. Decis. Sci. 2009, 40, 65–87. [Google Scholar] [CrossRef]
- Mathison, S. Why Triangulate? Educ. Res. 1998, 17, 13–17. [Google Scholar] [CrossRef]
- Yin, R.K. Case Study Research—Design and Methods; Sage Publications, Inc.: Thousand Oaks, CA, USA, 2003. [Google Scholar]
- Hopp, W.J.; Spearman, M.L. To Pull or Not to Pull: What Is the Question? Manuf. Serv. Oper. Manag. 2004, 6, 133–148. [Google Scholar] [CrossRef]
- Frank, A.G.; Dalenogare, L.S.; Ayala, N.F. Industry 4.0 technologies: Implementation patterns in manufacturing companies. Int. J. Prod. Econ. 2019, 210, 15–26. [Google Scholar] [CrossRef]
- Tezel, A.; Koskela, L.; Tzortzopoulos, P.; Formoso, C.T.; Alves, T. Visual Management in Brazilian Construction Companies: Taxonomy and Guidelines for Implementation. J. Manag. Eng. 2015, 31, 05015001. [Google Scholar] [CrossRef]
- Whyte, J.; Tryggestad, K.; Comi, A. Visualizing practices in project-based design: Tracing connections through cascades of visual representations. Eng. Proj. Organ. J. 2016, 6, 115–128. [Google Scholar] [CrossRef] [Green Version]


| Requirements | Brief Description |
|---|---|
| Simplicity | Simplicity is related to the use and functioning of a VM device [45]. It is associated with an easy and rapid understanding of information [43]. It is an essential requirement for VM [48,55], allowing effective interpretation and understanding of the information provided [56]. |
| Standardisation | Information standardisation can reduce time spent searching and processing data [50], providing, consistently, the information that is required. According to Murata [48], visual devices must have a structure in order to clearly monitor the conditions of the system, so that special situations can be identified as they arise [55]. |
| Availability | VM must provide information that is as close as possible to the workplace or process [44]. Information should be visible at the right place to all stakeholders that are involved in the process [49]. Relevant and accurate information must be made available for specific purposes [44,57]. The information delivery duration must be the speed at which the information is required by an action [46,48]. Availability is particularly important for mandatory information [56]. |
| Flexibility | Flexibility is concerned with making changes in the devices as they are needed [52]. VM devices must be modified in response to the dynamics of the interactions [51]; digital scenarios can make VM even more dynamic [23]. VM is related to mobility, dynamic information display within complex information flows, and shorter information feedback [23]. Digital solutions can support more flexible and less time-consuming measurement techniques [58]. |
| ID | Source of Evidence | Number | Duration | Participants | Description |
|---|---|---|---|---|---|
| 1 | Workshops | 2 | 90–180 min | Professor with experience in Lean Construction, Professors, and researchers with experience in VM and in digital technologies for design, Master and Ph.D. students | General discussion of VM requirements with academic experts (Evaluation activity) |
| 2 | 120–240 min | Associate Technical Directors and Senior Technical Director | Discussion about the design management process and general visual management practices with the company | ||
| 2 | Open interviews | 3 | 15–60 min | Associate Technical Directors, Highways Sector BIM Manager, and Business Director | Presentation of Research Plan, general understanding about the company context and evaluation of requirements (Evaluation activity) |
| 5 | 25–60 min | Project Manager, Senior Consultant, Sector BIM Manager, team member, and Associate Technical Director | Identification and evaluation of design management processes, Lean strategies, VM practices, and BIM processes | ||
| 3 | Semi-structured interviews | 2 | 25–60 min | Associate Technical Director and Senior consultant (GIS specialist) | Identification of Lean practices, and discussion about Type B VM practices |
| 4 | Participant observation | 1 | 120 min | Company A team, External Company team, and Client Lean team | Benchmarking of good practices with another company from the civil engineering sector |
| ID | Source of Evidence | Number | Duration | Participants | Description |
|---|---|---|---|---|---|
| 1 | Participant observation | 1 | 390 min | Project Manager, Subcontracted Company leaders (drainage, embankment, landscape), Contractors, Client, Advisor, BIM Manager, Team Leaders, and Members | Planning and control meeting: Collaborative planning session (Face-to-face meeting) |
| 2 | 180 min | Team Leaders, Project Manager, and Directors | Design coordination meeting (Face-to-face and virtual meetings) | ||
| 2 | Open Interview | 1 | 60 min | Project Information Manager | Understanding the BIM process |
| 3 | Document analysis | Design planning, control, and coordination VM practices analysis (Collaborative Board 1, Whiteboard 1, Navisworks model visualisation), planning and control documentation (Long-term plan, project summary report) | |||
| ID | Source of Evidence | Number | Duration | Participants | Description |
|---|---|---|---|---|---|
| 1 | Participant observation | 1 | 360 min | Project team | Planning and control meeting: Collaborative planning meeting (Face-to-face meeting) |
| 2 | 30–45 min | Project Manager, Practitioner of Risk Manager, Technical Director/Senior Project Manager, and Team Lead | Planning and control meeting: Monthly risk review meeting (Project management and traffic) (Virtual meeting) | ||
| 1 | 45 min | Project Manager, Technical Director, Team Leaders | Planning and control meeting: Stand-up weekly progress meeting (Face-to-face and virtual meeting) | ||
| 1 | 60 min | Project Manager, Client Representative, Technical Directors, Project Director, Risk Manager, and Team Leaders | Planning and control meeting: Monthly progress meeting (Face-to-face and virtual meeting) | ||
| 2 | Direct observation | 1 | 30 min | Digital Devices Developer, Performance Manager, and Associate Director | Continuous improvement meeting: Development of devices and continuous improvement meeting (Virtual meeting) |
| 8 | 30–60 min | Project Manager, Technical Director, and Team Leaders | Planning and control meeting: Weekly progress meeting (Virtual meetings) | ||
| 3 | Open Interview | 3 | 45–60 min | Senior Consultant, Technical Director/Principal design manager, Associates Technical Directors, and Project Manager | Understanding of the project, design management process, design coordination devices, and partial evaluation of the requirements (Evaluation activity) |
| 1 | 90 min | Associates Technical Directors | Partial evaluation of results (Evaluation activity) | ||
| 4 | Semi-structured interview | 4 | 30–45 min | Deputy Customer Manager, Technical Consultant, Technical Director, and Risk Manager | Understanding of design management activities and its interface with stakeholders’ team, discussion and evaluation about the design process, design management activities and VM practices for design coordination, and planning and control |
| 5 | Workshop | 1 | 60 min | Associate Technical Director and Professor with experience in Lean Construction | Presentation of a Technical Report and partial evaluation of results with the company (Evaluation activity) |
| 6 | Document analysis | Design planning, control, and coordination VM devices analysis (Collaborative Board 2, Whiteboard 2, Performance Dashboard 1, Activity Tracker 1, GIS model visualisation, Risk dashboard) planning and control documents (Long-term plan, project summary report) |
| ID | Source of Evidence | Number | Duration | Participants | Description |
|---|---|---|---|---|---|
| 1 | Direct observation | 1 | 45 min | Project Manager, Lean Manager, Team Leaders, and Members | Planning and control meeting: Weekly progress meeting (Virtual meeting) |
| 1 | 45 min | Project Managers, Risk Manager, Lean Manager (Facilitator), Team Leaders, and Members | Planning and control meeting: Management performance review meeting (Virtual meeting) | ||
| 2 | Open interviews | 5 | 15–90 min | Business Director, Associate Technical Directors, and Lean Managers | General understanding of the project, VM practices and design management processes, Discussion and evaluation of Visual Management, considering manual and digital devices |
| 3 | Document analysis | Design planning, control and coordination VM devices analysis (Performance Dashboard 2, Activity Tracker 2), planning and control documentation (project summary and existing system), photographic records of manual VM devices (Planning and Control VM room) |
| ID | Source of Evidence | Number | Duration | Participants | Description |
|---|---|---|---|---|---|
| 1 | Workshops | 2 | 30–60 min | International professors and Ph.D. students from the United Kingdom, United States of America, Brazil, New Zealand, and Israel | Presentation and discussion about the requirements and its connections with experts in the topics |
| 5 | 60–120 min | Director, Associate Technical Directors, and Senior Engineer | Report the diagnosis and improvement opportunities proposed, evaluation of VM, and design management practices in the company, development of new digital VM devices and discussion about the requirements | ||
| 2 | Open interview | 1 | 60 min | Associate Technical Director | Report the diagnosis and improvement opportunities proposed, general discussion, and evaluation of the requirements |
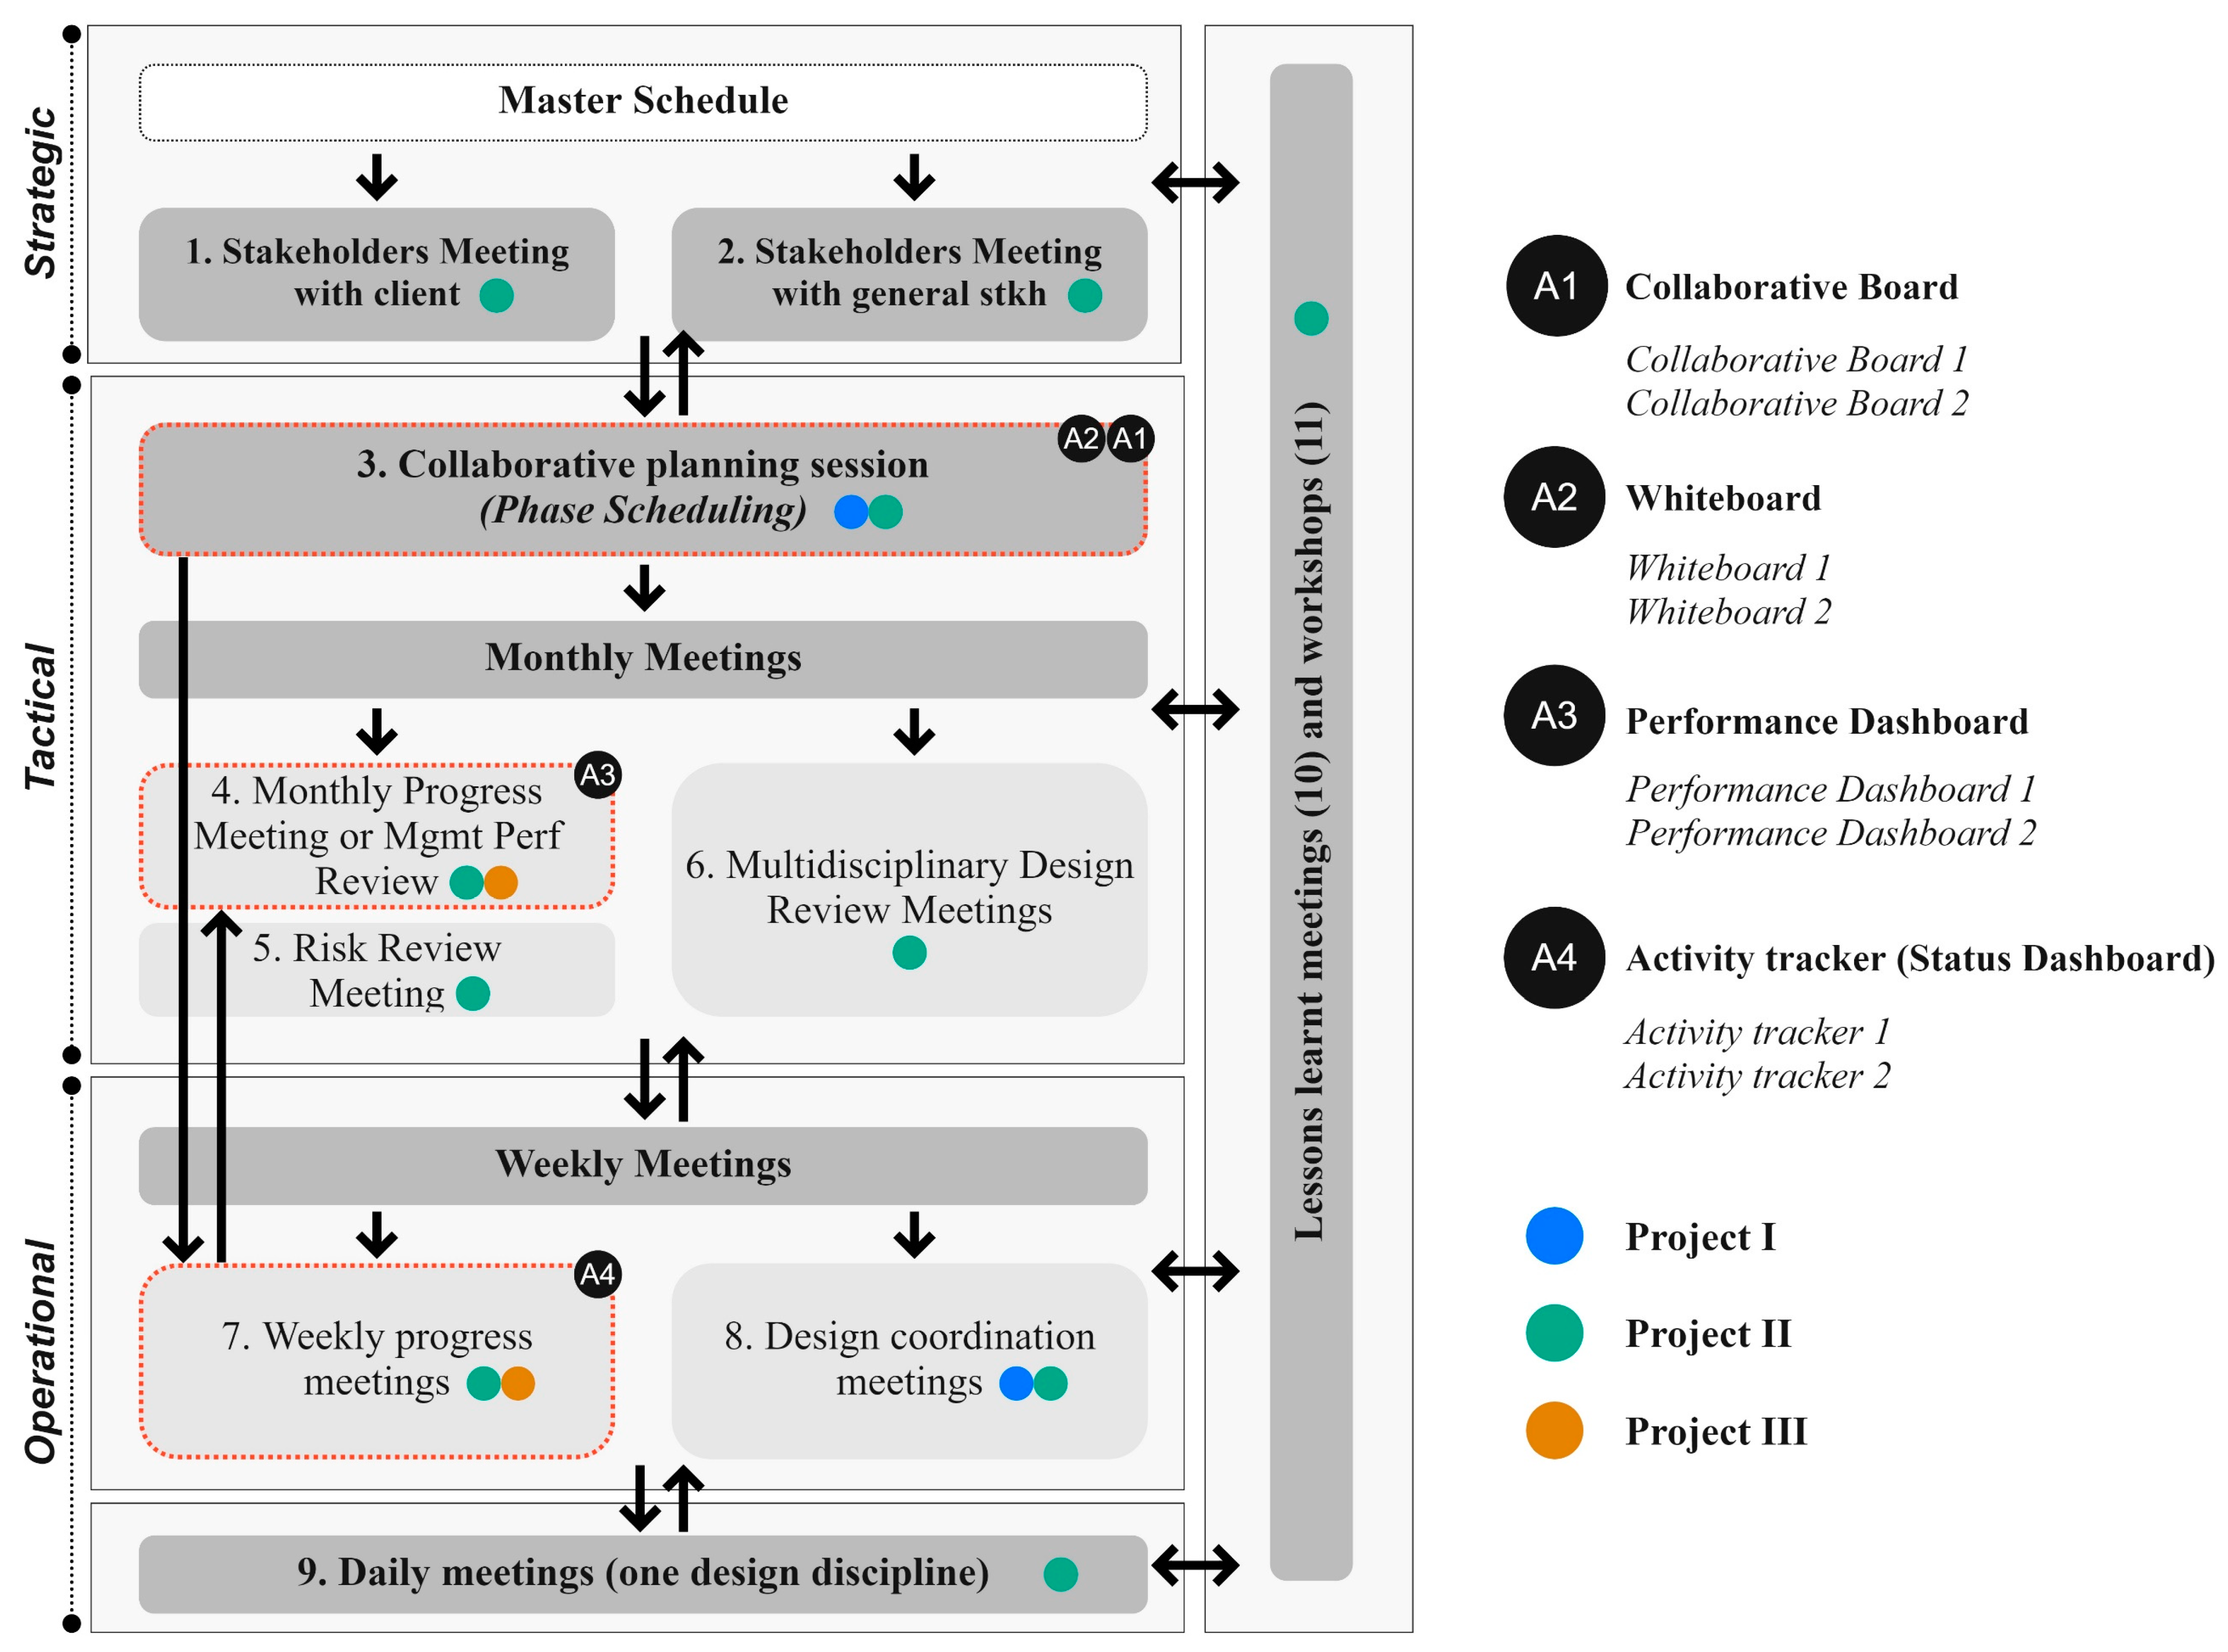
| Strategic Level | Tactical Level | Operational Level (Within and between Disciplines) | |
|---|---|---|---|
| Stakeholders involved | Project Manager; Technical and Project Directors; Client representative | Team Leaders; Project Manager; Client representative | Team Members; Team Leaders; Project Manager; BIM manager, GIS Manager |
| Reach of decisions | Between relevant stakeholders | Between relevant stakeholders of each discipline | Each discipline or between disciplines |
| Level of planning | Long-term | Medium-term | Short-term |
| Meetings | 1. Stakeholders meeting with client (weekly) (Project II) 2. Stakeholders meeting with general stakeholders, i.e., end users (quarterly) (Project II) | 3. Collaborative planning session (Project I and II) * 4. Monthly progress meeting or Management performance review (Project II and III) * 5. Risk review meeting (Project II) 6. Multidisciplinary Design Review Meetings (Project II) | 7. Weekly progress meetings (with diverse design disciplines) (Project II and III) * 8. Design coordination meetings (with diverse design disciplines) (Project I and II) * 9. Daily meetings (one design discipline) (Project II) |
| Classification Criteria | Description |
|---|---|
| Type of VM devices | Type A (design planning and control), Type B (design coordination), Type C (continuous improvement). |
| Digitalisation Level | Digital (D) or Manual (M) VM devices. |
| Managerial Levels | Strategic (S), Tactical (T), Operational (O). |
| Communication and collaboration approaches [36,37] | Face-to-face Collaboration (FFC), Asynchronous Collaboration (AC), Synchronous Distributed Collaboration (SDC), Asynchronous Distributed Collaboration (ADC), Synchronous, Distributed, and Face-to-face Collaboration (SDFFC). |
| Categories of communication and integration [21] | One to one, one to many, many to one, and many to many interactions. |
| ID | VM Practices Name | Description | Project | VM Type | Digitalisation Level |
|---|---|---|---|---|---|
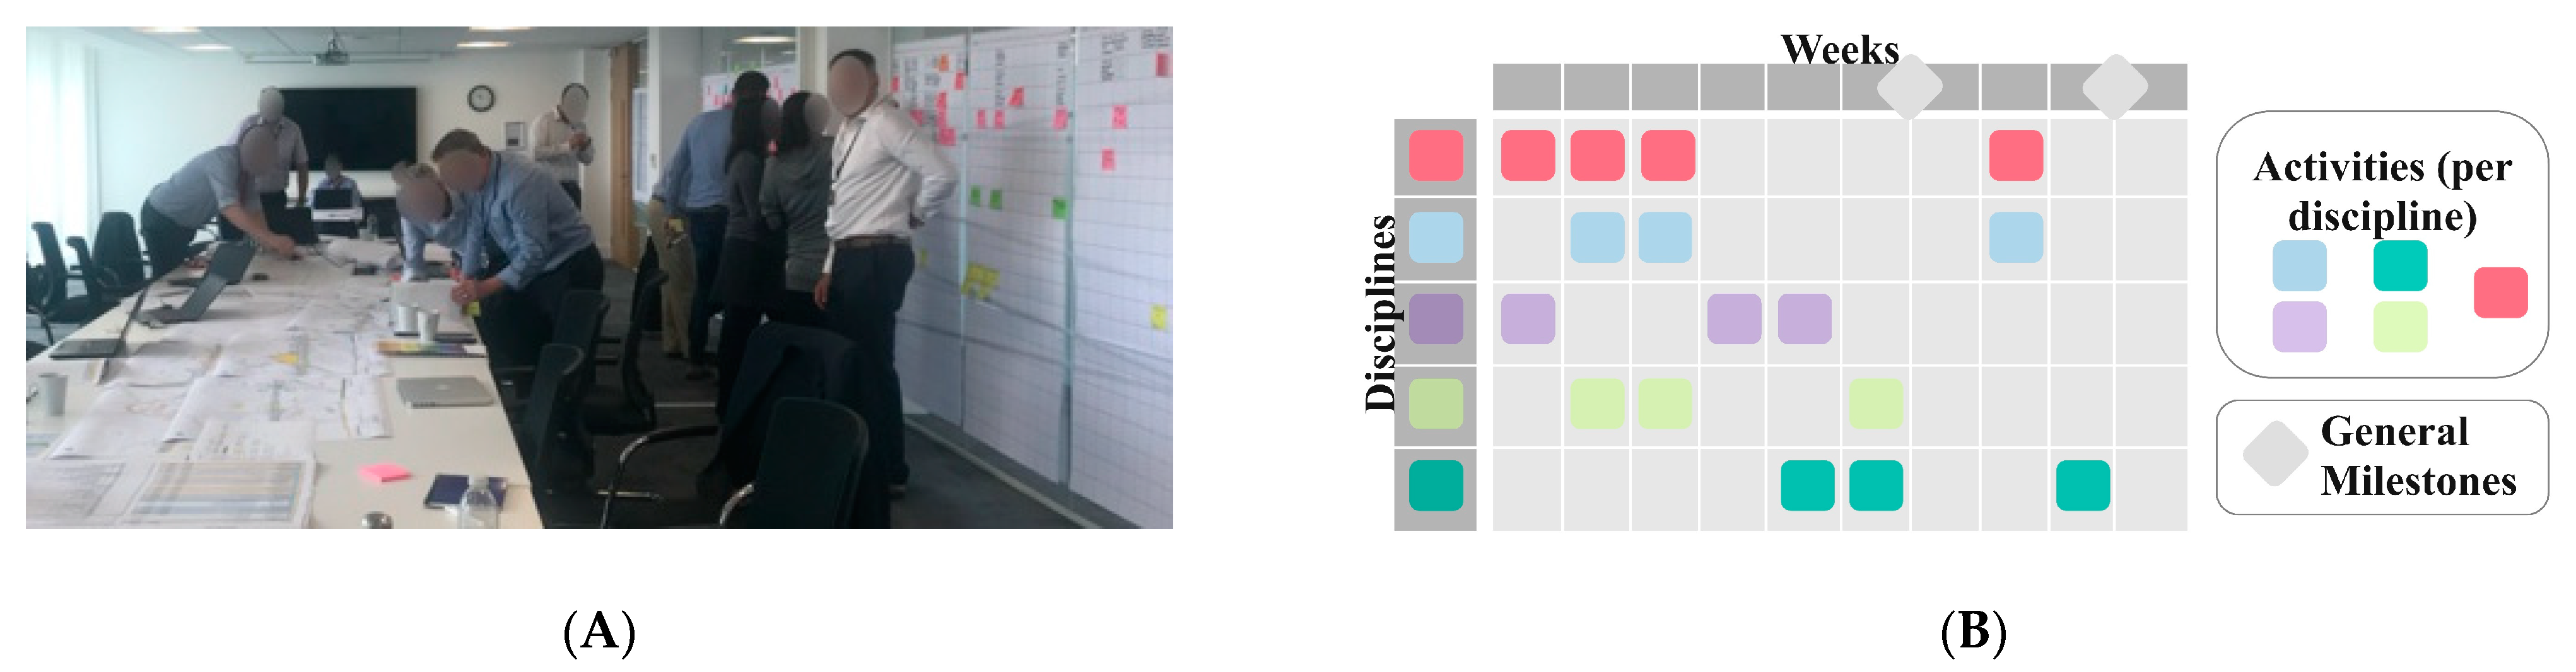
| 1 * | Collaborative Board 1 | Collaborative planning board with milestones and deliverables. The board was updated in real time during the face-to-face meetings, which were held every three or four months. This information was updated into the master schedule after the meeting. | I | A | M |
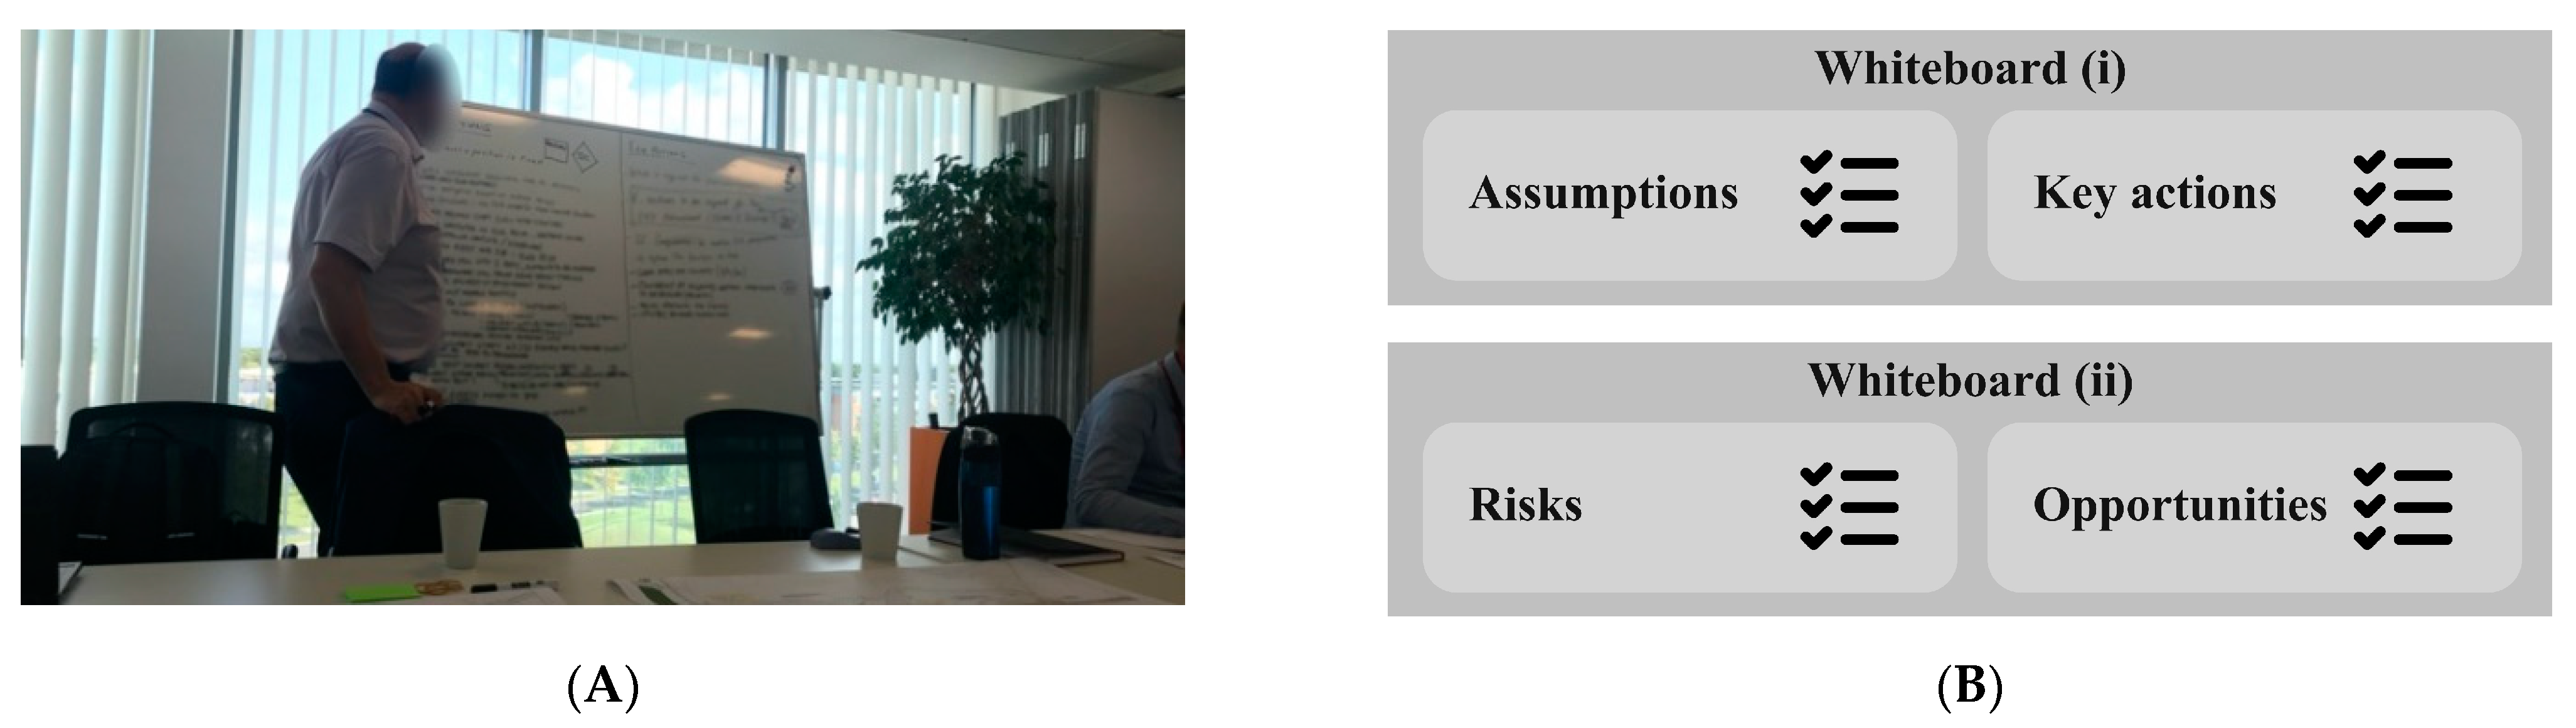
| 2 * | Whiteboard 1 | Assumptions, key actions, risks, and opportunities were identified, understood, and logged during the meeting for continuous review and management. The meetings were held every three or four months. The information was shared with the teams and used to support the weekly discussions. | I | A | M |
| 3 | Model Visualisation | Model visualisation was used for clash detection, quality control, and control of changes. This was used to review the status of the federated model and design progress, and also to identify issues during virtual and face-to-face weekly or fortnightly meetings. | I | B | D |
| 4 * | Collaborative Board 2 | Collaborative planning board with milestones and deliverables, in which the master schedule (a very detailed plan) was displayed to support meetings. Sticky notes were also used to highlight key milestones and deliverables. | II | A | M |
| 5 * | Whiteboard 2 | Whiteboard with objectives, assumptions, key actions, deliverables (surveys), and other topics (e.g., overview of the project), was used in meetings and shared with the teams afterwards. | II | A | M |
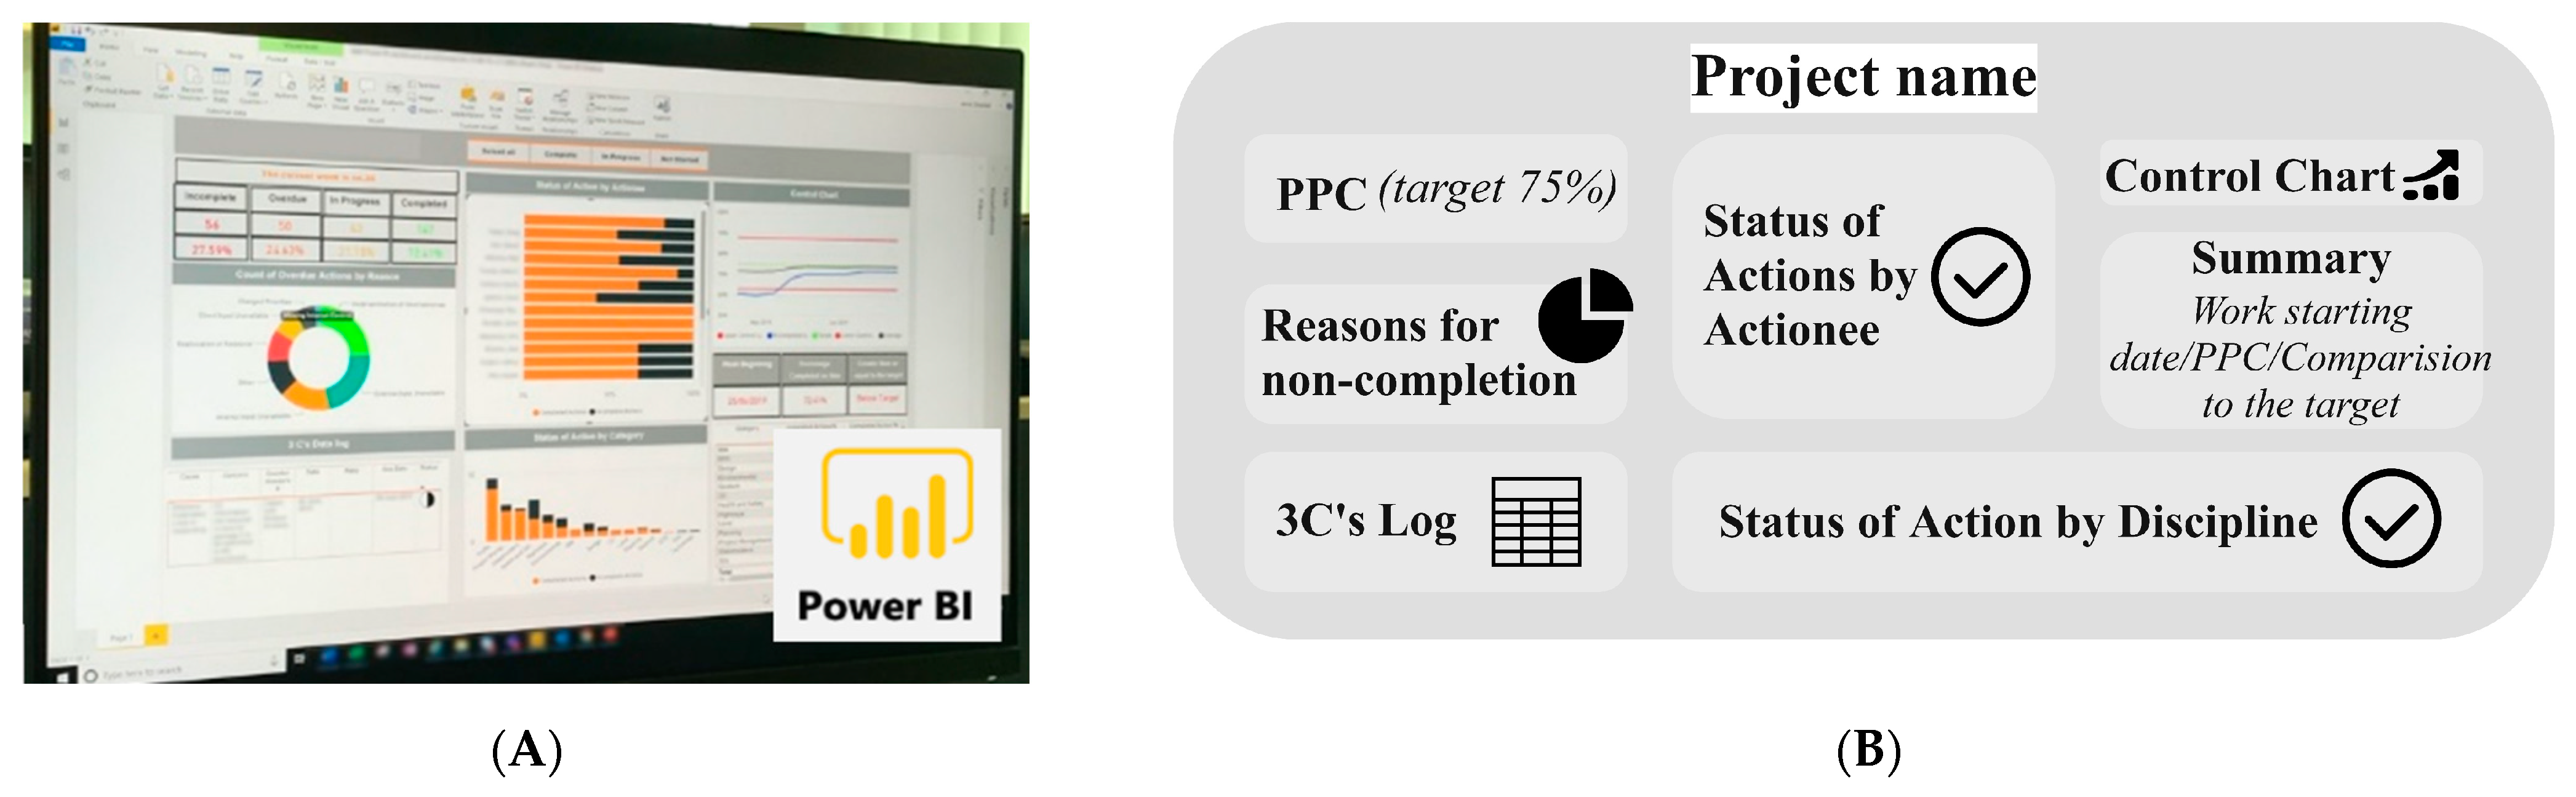
| 6 * | Performance Dashboard 1 | Dashboard with key performance metrics, such as reasons for the non-completion of work packages, Percent Plan Complete (PPC), and the 3C’s (3C’s is a problem-solving methodology, which is used to document concern, cause, and countermeasure, encouraging employees to discuss problems and actions). It was used to support decision-making within the monthly progress meeting, and it was based on the data collected through the Activity Tracker 1. | II | A | D |
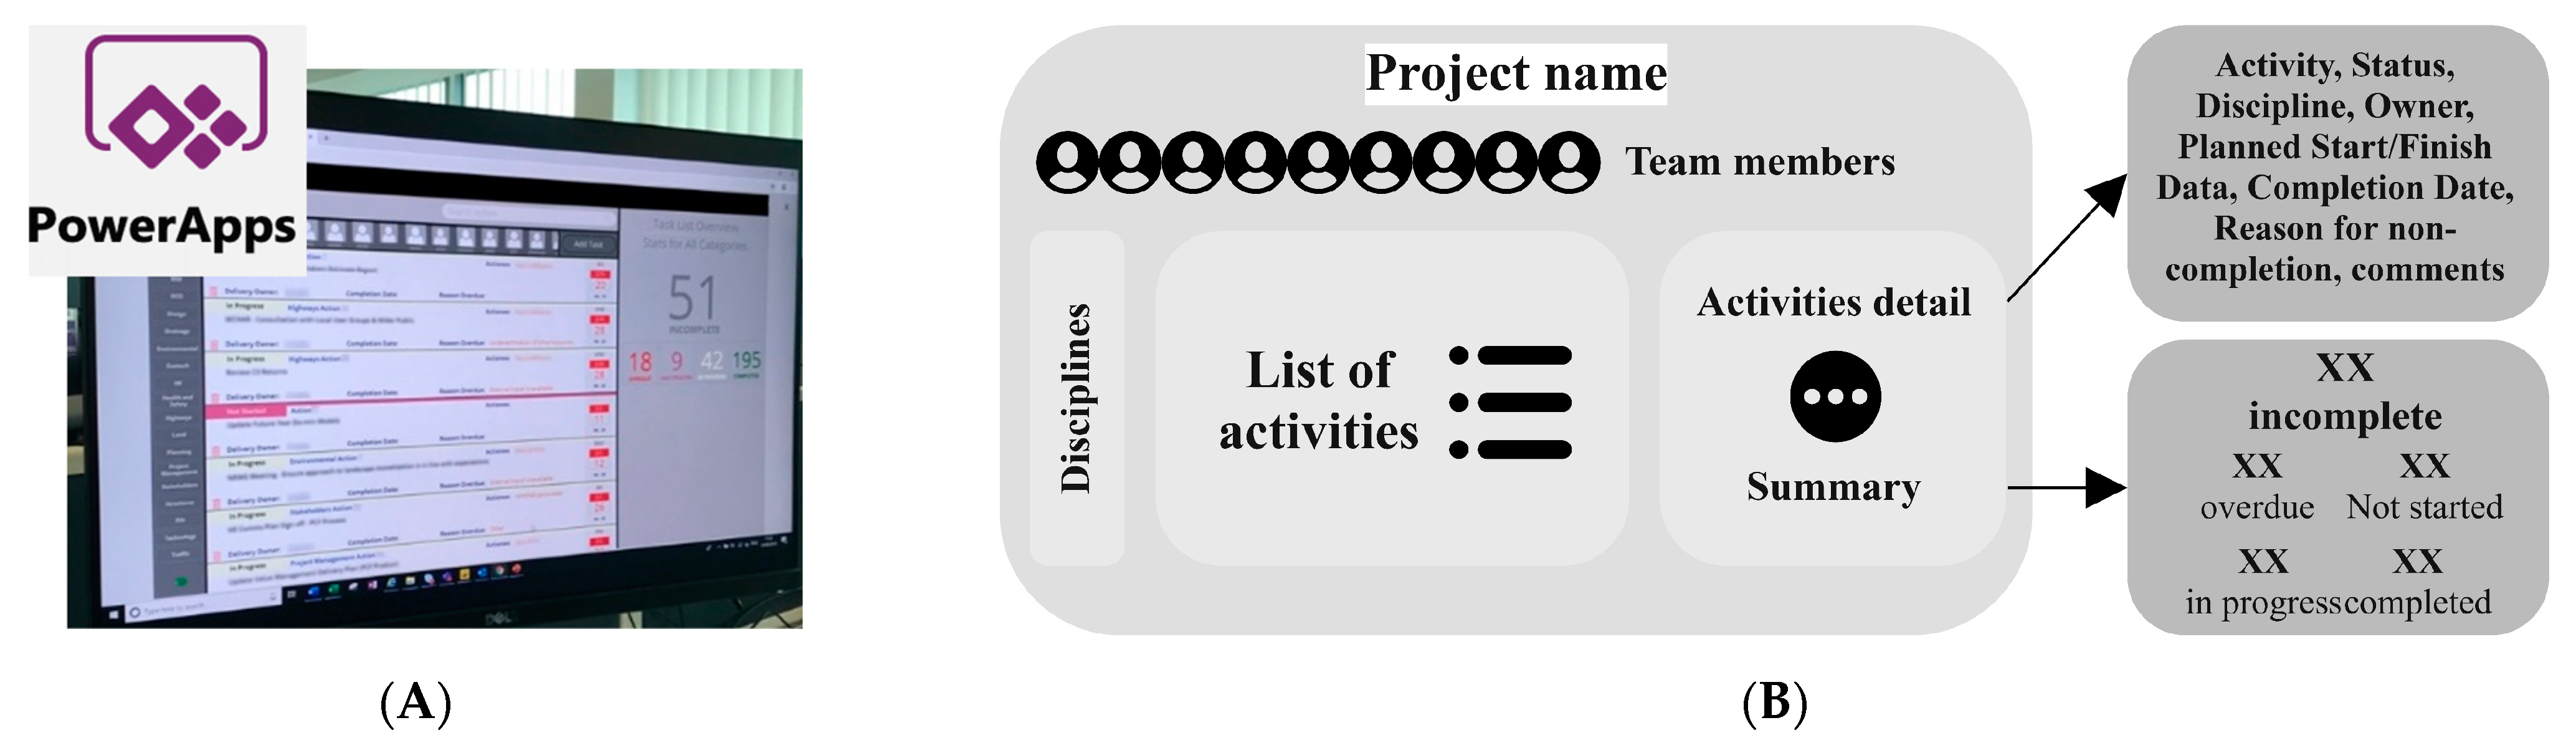
| 7 * | Activity Tracker 1 | Activity Tracker 1 was used to monitor activities by design discipline, and update tasks by displaying the status, supporting weekly progress meetings. It had two main interfaces: activity details and summary of status. | II | A | D |
| 8 | GIS Model Visualisation | GIS model visualisation for health and safety coordination. It helped in gathering and analysing data, mainly related to the pre-construction information, focusing on health and safety aspects. It started to be implemented recently at the company as a coordination device. | II | B | D |
| 9 | Risk Dashboard | Risk dashboard, also named balance scorecards. It aimed to support the monthly risk discussions within the project. It was under development during this investigation. | II | A | D |
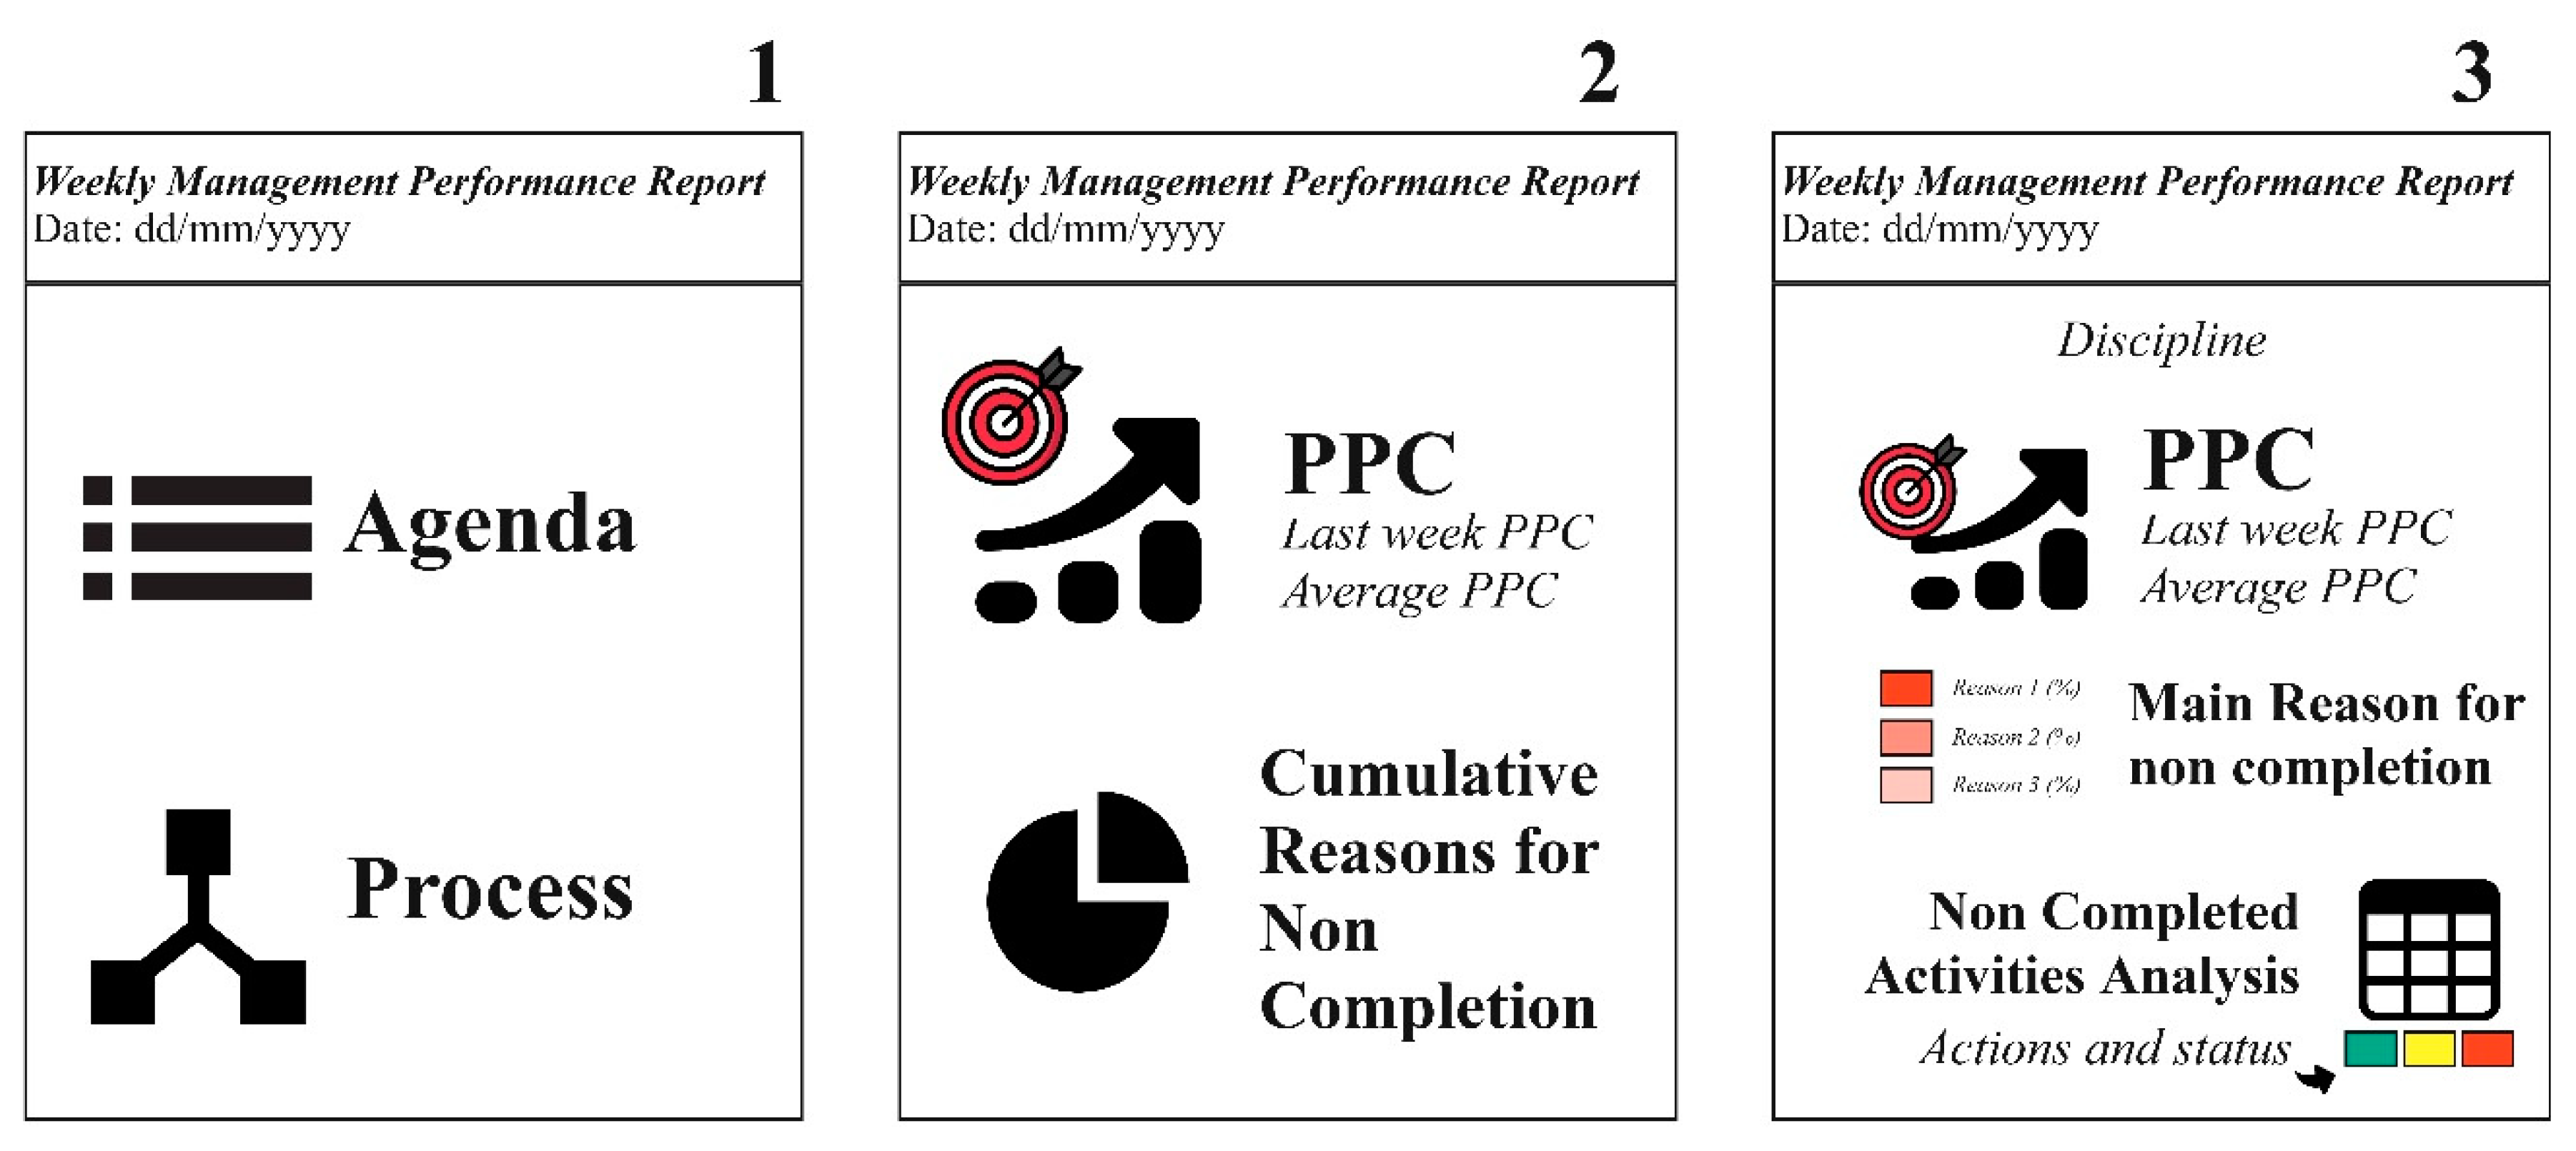
| 10 * | Performance Dashboard 2 | Dashboards had three different interfaces, containing (i) the agenda and the meetings’ structure; (ii) PPC and reasons for the non-completion of activities; (iii) analysis of the planning failures for each discipline. It was based on the data collected through the Activity Tracker 2. | III | A | D |
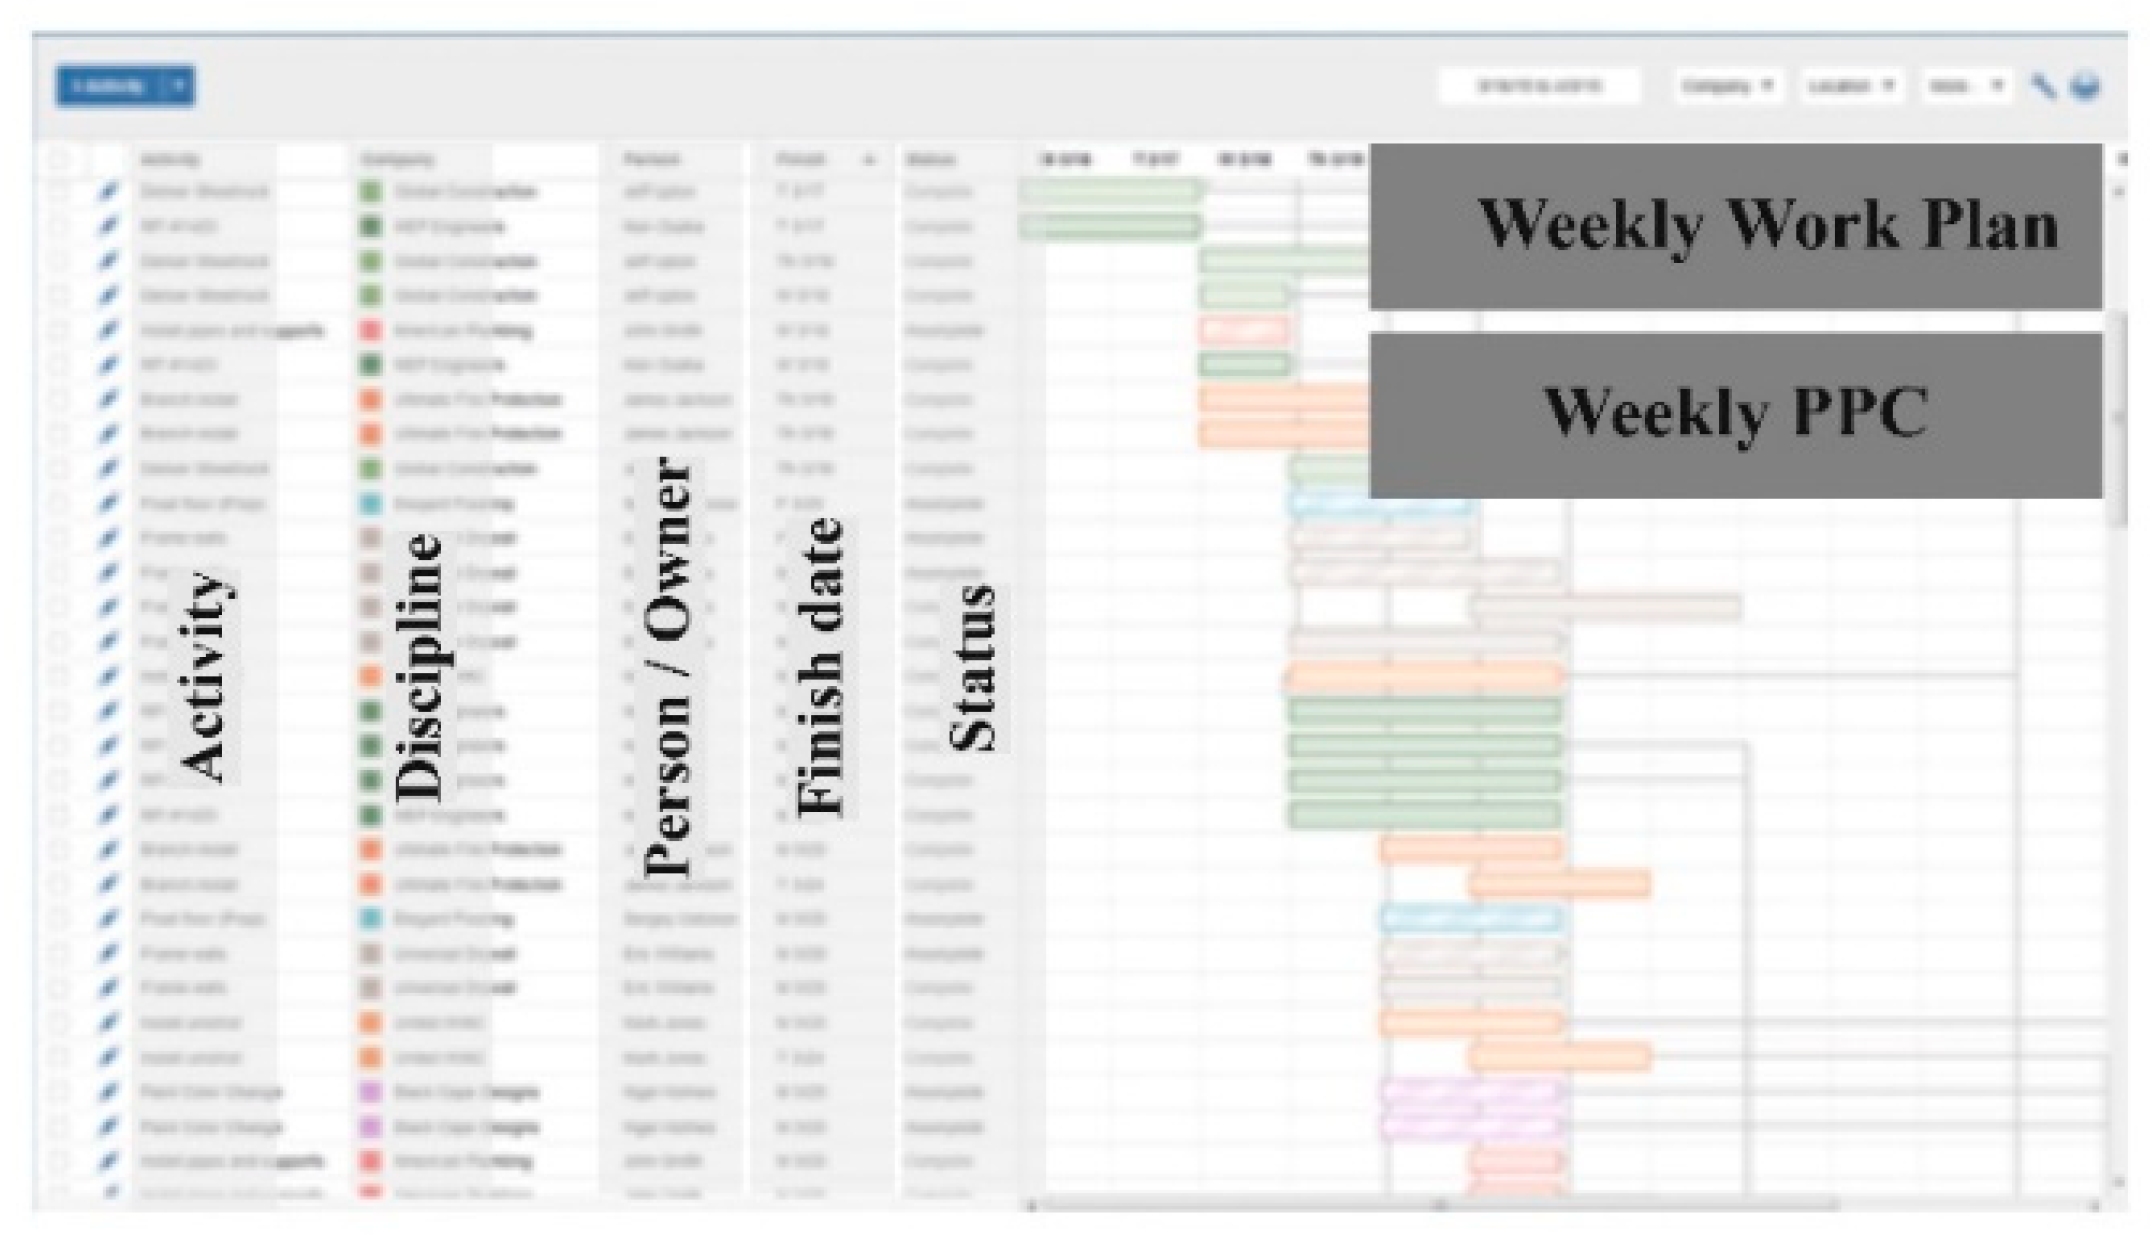
| 11 * | Activity Tracker 2 | Activity Tracker 2 contained the weekly lookahead plan, including activities, disciplines, activity owner, finishing date, status, weekly work plan, and PPC. It was adopted in the weekly meetings and updated in real-time. It was also available both before and after meetings. | III | A | D |
| 12 | Project Milestones board | Milestones Heatmap containing deliverables by discipline and month, as well as the delivery date. It was displayed in the Planning and Control VM room. | III | A | M |
| 13 | Lookahead board | It showed a 4-week lookahead plan, being displayed in the Planning and Control VM room. | III | A | M |
| 14 | Activity Tracker 3 | It contained activities completed, showing the activities per team/discipline, being available in the Planning and Control VM room. | III | A | M |
| 15 | Reasons for Non-Completion Board | It showed the reasons for non-completion and key disciplines involved. It was displayed in the Planning and Control VM room. | III | A | M |
| 16 | Performance board 3 | Overall performance, PPC, key reasons for non-completion. It was displayed in the Planning and Control VM room. | III | A | M |
| 17 | Action board | The 3C’s (Concern, Cause, Countermeasure) and Risk management boards, in which the concerns and risks were captured and analysed. It was displayed in the Planning and Control VM room. | III | A | M |
| 18 | Overview board | Project overview board, including the master plan, key design processes, and deliverables. It was displayed in the Planning and Control VM room. | III | C | M |
| 19 | People’s board | People’s board contained information related to the team, the successes and news. It was displayed in the Planning and Control VM room. | III | C | M |
| 20 | Improvement Board | Improvement ideas and lessons learnt were captured and analysed in this board. It was displayed in the Planning and Control VM room. | III | C | M |
| VM Requirements (Table 1) | VM Requirements for Design Planning and Control | Source of the Requirement | New Definition |
|---|---|---|---|
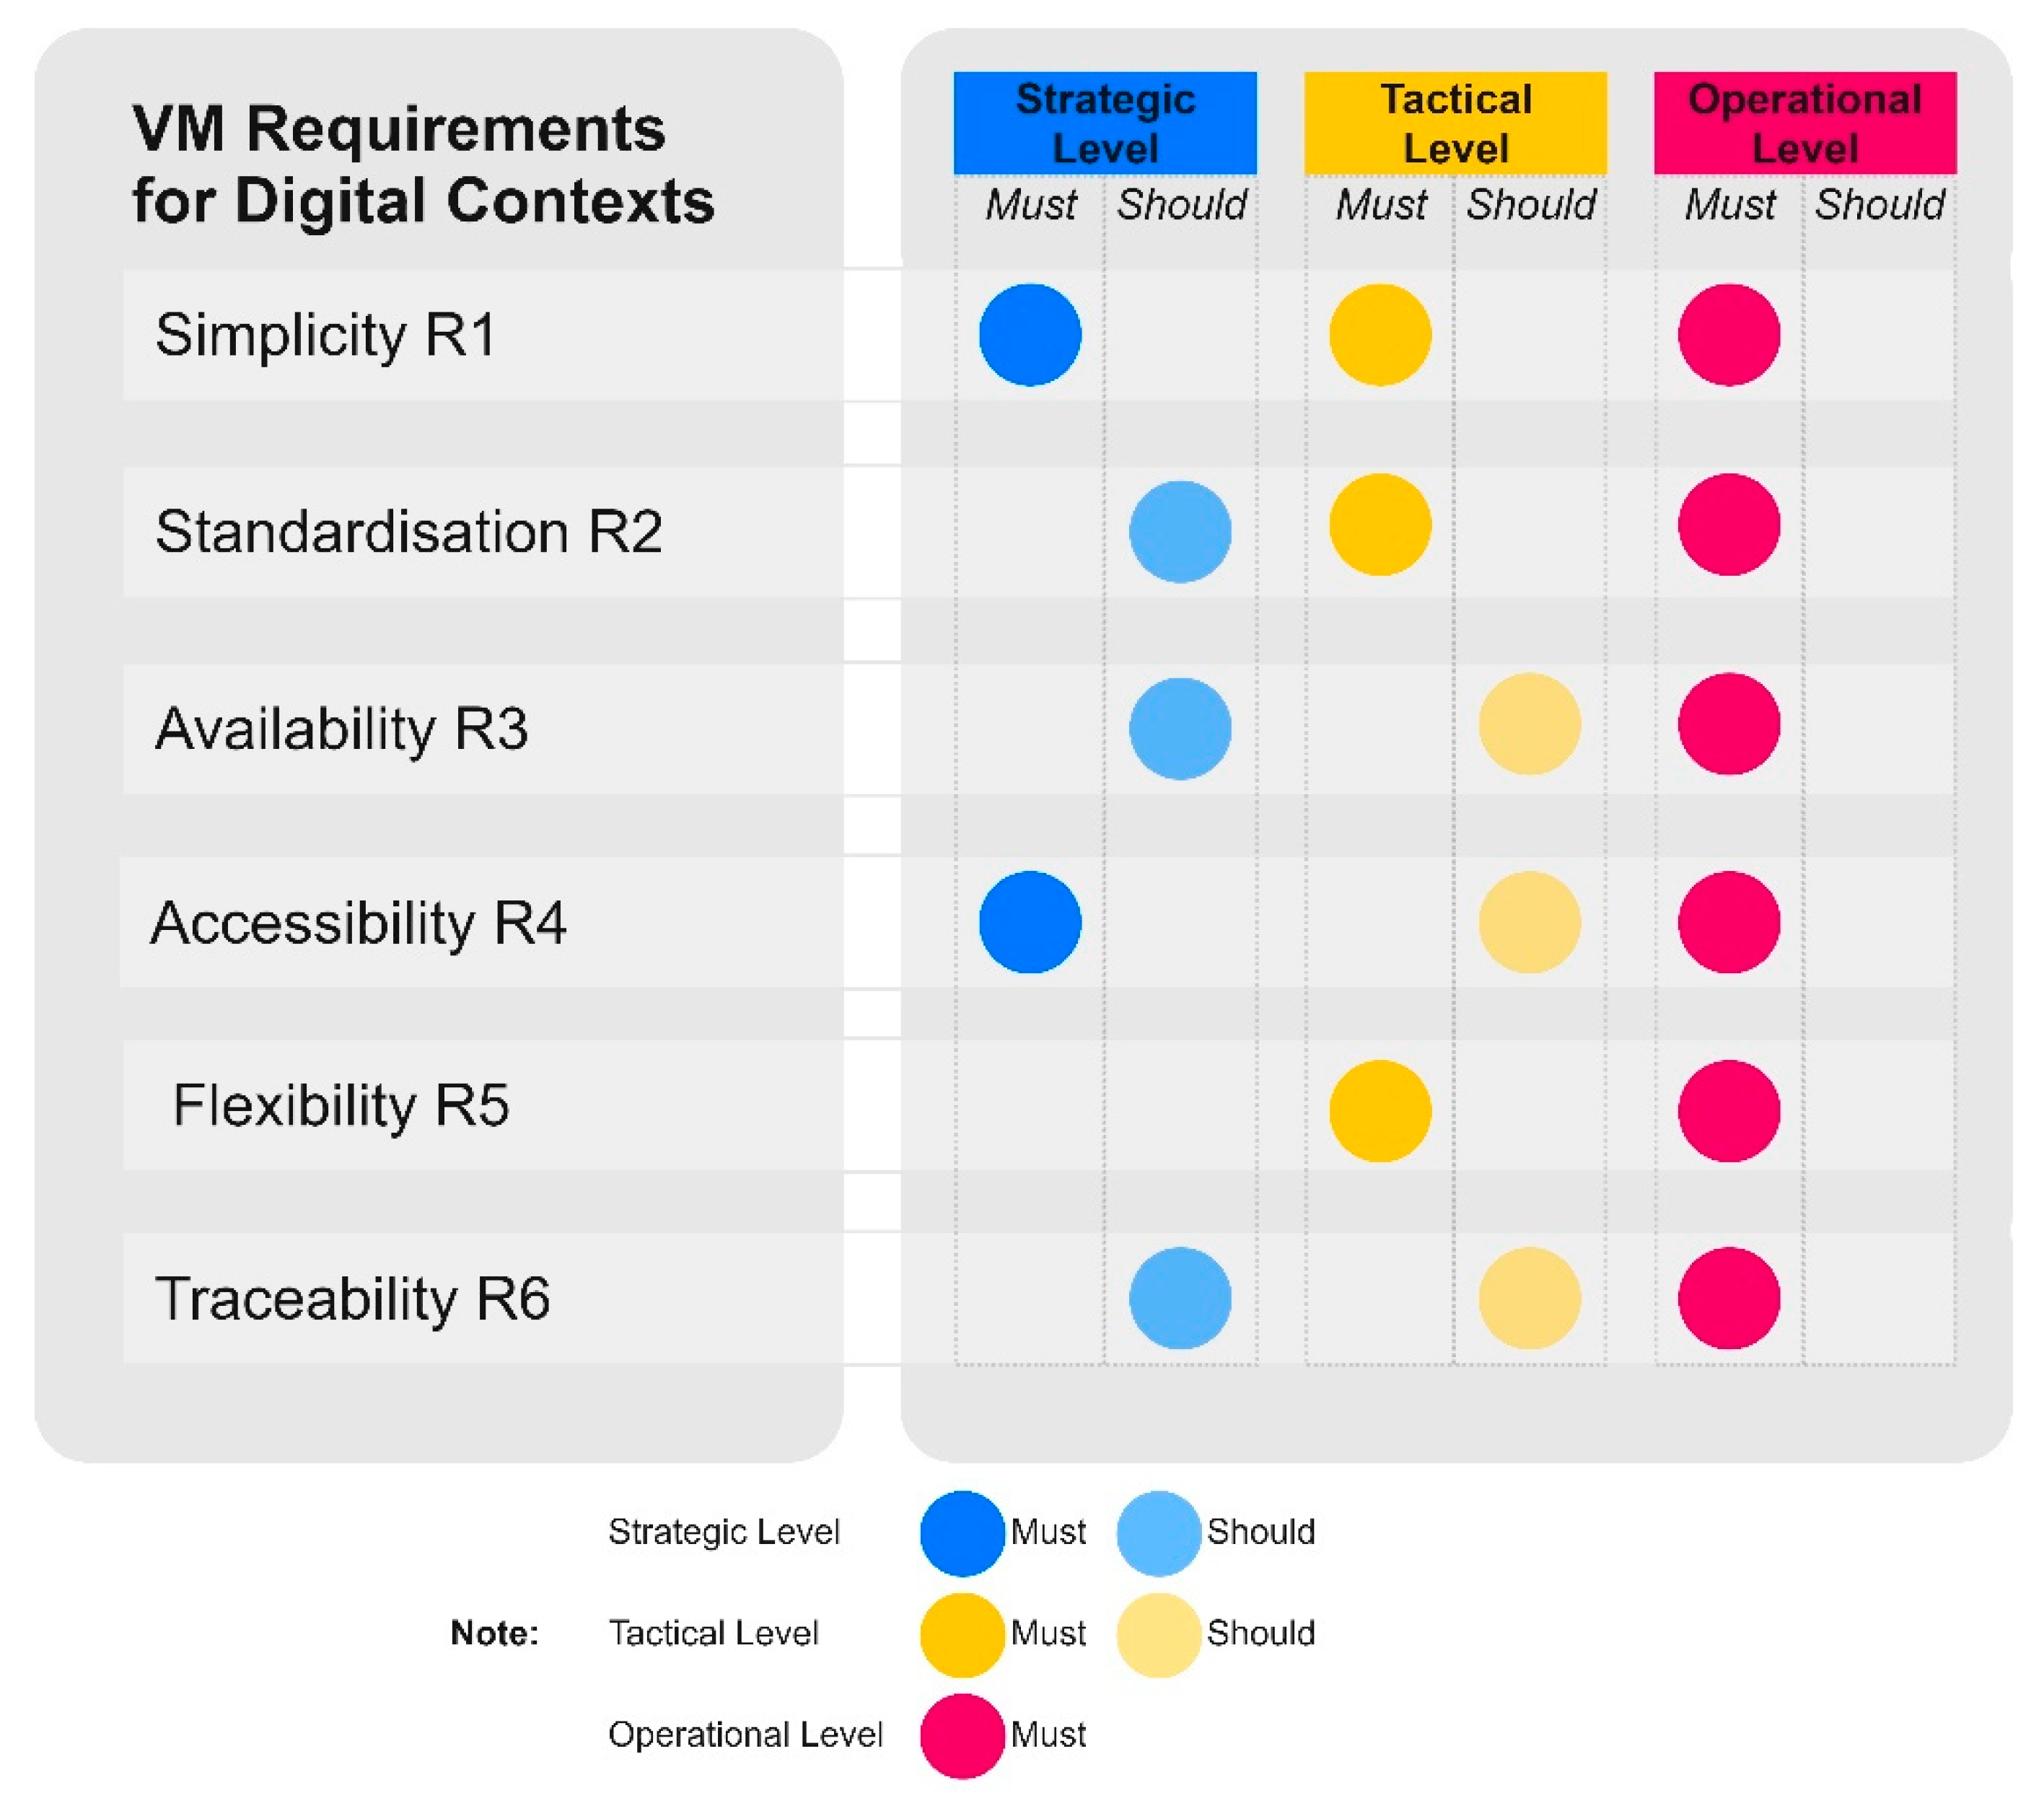
| Simplicity | Simplicity (R1) | Literature review | It is concerned with how easy it is to use a VM practice, based on a clear understanding of its objective or function |
| Standardisation | Standardisation (R2) | Literature review | It is related to whether there is repetition in the use of devices, i.e., regularity of information units, which can support accurate information delivery |
| Availability | Availability (R3) | Literature review | It is related to making updated information available at the right time and in the right amount, making easy to prioritise information |
| Accessibility (R4) | Empirical study | It considers how easy it is to access the information, i.e., if the information is located in the right place | |
| Flexibility | Flexibility (R5) | Literature review | It is related to: (i) how easy it is to make changes, i.e., possibility of adapting devices and practices according to the users’ needs over time; (ii) how easy is to update the information, i.e., changes can be quickly displayed in the device |
| Traceability (R6) | Empirical study | It is associated with easy storage of information and easy tracking of the origin of the information |
| VM Requirements | Type A | |||||||
|---|---|---|---|---|---|---|---|---|
| Digital | Manual | |||||||
| Activity Tracker 1 | Activity Tracker 2 | Performance Dashboard 1 | Performance Dashboard 2 | Collaborative Board 1 | Collaborative Board 2 | Whiteboard 1 | Whiteboard 2 | |
| R1 | A | A | A | A | A | PA | A | A |
| R2 | PA | A | PA | A | A | PA | NA | NA |
| R3 | A | A | PA | PA | PA | NA | PA | PA |
| R4 | A | A | PA | PA | NA | NA | NA | NA |
| R5 | A | A | A | A | PA | PA | PA | PA |
| R6 | A | A | A | A | NA | NA | NA | NA |
| Same Time | Different Times | |
|---|---|---|
| Same place | Face-to-face Collaboration (FFC): Collaborative Boards 1 and 2, and Whiteboards 1 and 2 | Asynchronous Collaboration (AC) |
| Different places | Synchronous Distributed Collaboration (SDC): Activity Tracker 1 Activities Tracker 2, and Performance Dashboard 2 | Asynchronous Distributed Collaboration (ADC): Performance Dashboard 1 and 2, Activity Tracker 1 Document, and information management systems (e.g., SharePoint, ProjectWise, and Microsoft Teams) ** |
| Both same place and different places | Synchronous Distributed and Face-to-face Collaboration (SDFFC) *: Performance Dashboard 1 |
| VM Requirements for Digital Context | Characteristics of Design Planning and Control with the Support of Digital Tools |
|---|---|
| Simplicity (R1) | There are many iterations in the design process, and a high degree of uncertainty. Considering the complexity of infrastructure projects, designers need to deal with a large amount of information that needs to be updated often. In this context, simplicity of visual devices is even more relevant. |
| Standardisation (R2) | Design has several planning and control cycles (strategic, tactical, and operational) that should be supported by VM practices. ‘Standardisation’ contributes to delivering accurate information in every planning and control meeting. |
| Availability (R3) | ‘Availability’ is also very relevant in design planning and control, due to the large amount of information that needs to be managed. Availability was defined as the right amount of time taken for delivery and the right amount of information, while ‘Accessibility’ was concerned with whether information was in the right place. |
| Accessibility (R4) | |
| Flexibility (R5) | Flexibility is an essential requirement as it is necessary for the users to easily navigate across different devices, as well as access and update the information needed for the different planning levels, considering the need for continuous improvement. |
| Traceability (R6) | Traceability has become more important due to the adoption of digital technologies [66]. The new definition extends the definition from the literature: it includes information storage and tracking. |
Publisher’s Note: MDPI stays neutral with regard to jurisdictional claims in published maps and institutional affiliations. |
© 2022 by the authors. Licensee MDPI, Basel, Switzerland. This article is an open access article distributed under the terms and conditions of the Creative Commons Attribution (CC BY) license (https://creativecommons.org/licenses/by/4.0/).
Share and Cite
Pedó, B.; Formoso, C.T.; Viana, D.D.; Tzortzopoulos, P.; Brandalise, F.M.P.; Whitelock-Wainwright, A. Visual Management Requirements to Support Design Planning and Control within Digital Contexts. Sustainability 2022, 14, 10989. https://doi.org/10.3390/su141710989
Pedó B, Formoso CT, Viana DD, Tzortzopoulos P, Brandalise FMP, Whitelock-Wainwright A. Visual Management Requirements to Support Design Planning and Control within Digital Contexts. Sustainability. 2022; 14(17):10989. https://doi.org/10.3390/su141710989
Chicago/Turabian StylePedó, Bárbara, Carlos T. Formoso, Daniela D. Viana, Patricia Tzortzopoulos, Fernanda M. P. Brandalise, and Andrew Whitelock-Wainwright. 2022. "Visual Management Requirements to Support Design Planning and Control within Digital Contexts" Sustainability 14, no. 17: 10989. https://doi.org/10.3390/su141710989
APA StylePedó, B., Formoso, C. T., Viana, D. D., Tzortzopoulos, P., Brandalise, F. M. P., & Whitelock-Wainwright, A. (2022). Visual Management Requirements to Support Design Planning and Control within Digital Contexts. Sustainability, 14(17), 10989. https://doi.org/10.3390/su141710989