Article

Open Data as a Condition for Smart Application Development: Assessing Access to Hospitals in Croatian Cities

1
Information and Communication Sciences, Faculty of Humanities and Social Sciences, University of Zagreb, 10000 Zagreb, Croatia
2
Faculty of Geodesy, University of Zagreb, 10105 Zagreb, Croatia
3
Engineering, Research and Development in Traffic, PROMETIS Ltd., 10000 Zagreb, Croatia
4
Agency for Science and Higher Education, 10000 Zagreb, Croatia
5
Faculty of Architecture and the Built Environment, Delft University of Technology, 2628 BL Delft, The Netherlands
6
Department of Information and Communication Systems Engineering, University of the Aegean, 831 00 Samos, Greece
*
Author to whom correspondence should be addressed.
Sustainability 2022, 14(19), 12014; https://doi.org/10.3390/su141912014
Submission received: 26 July 2022 / Revised: 31 August 2022 / Accepted: 14 September 2022 / Published: 22 September 2022
(This article belongs to the Section Health, Well-Being and Sustainability)

Abstract

:
This research aims to assess available spatial open data related to access to hospitals in the three largest Croatian cities (Zagreb, Split, Rijeka), with a future aim to create digital services as an ecosystem that will be used in everyday situations, as part of the concept of “digital society”. Data analysis is performed for the following datasets: hospitals, hospital specialization, public transport (tram, bus), bike routes, car routes, parking and parking for people with disabilities. The future aim is to create a new mobile, multilingual and voice-based application that would enable quick access to information on hospital access, relying on the principles of the open data ecosystem, which would improve over time. There are four specific aims: (1) to identify and analyze portals and open datasets of the selected categories for the three largest Croatian cities; (2) to analyze existing open data assessment frameworks and detect gaps; (3) to create a conceptual open data assessment framework as an open data ecosystem that integrates new end-user perspectives; and (4) to analyze existing open datasets for the three largest cities in Croatia, based on supply and demand by researcher/developer categories, using the newly developed framework. The results show that existing open datasets related to hospital access in the three largest Croatian cities are scattered across different portals. Analyzed frameworks existing on the supply side of open data are more focused on the status of the components, lacking evaluation scales and not including end-user-driven aspects, which would be crucial for the open data ecosystem. As a result, the new “Hospital Access Framework” is created as a conceptual ecosystem, including five categories: supply, demand by researcher/developer, demand by end-user, legal aspect and impact. Analysis of existing open data for the three Croatian cities is performed for two categories (supply and demand by researcher/developer), for which KPIs, indicators and evaluation scales are developed. The other three categories are not analyzed, since the application cannot be developed from existing data, which are insufficient for the creation of a smart application. Results show that existing open data related to hospital access are incomplete or do not exist at all (hospital specialization, parking for people with disabilities, data on multilingualism and voice enabling). Average scores of the supply category are higher than those for demand by researcher/developer, although they are below the average grade, showing a lack of available data that could be used for further development. The new conceptual “Hospital Access Framework” open data ecosystem would benefit from end-user interaction, therefore, improving over time with end-users through interaction.

1. Introduction

Spatial data infrastructures (SDIs) are fundamental for resolving a vast number of societal issues [1,2]. Increasingly, SDIs build on open data [3]. Open data represent a major resource for the creation of digital services. Open data represent sources that can be integrated into innovative digital solutions [4] and provided at a national level, satisfying principles of maturity [5,6]. The identification and assessment of open data is the first step in data acquisition, followed by processing and assessment, in order to prepare data for future use.
The main aim of this paper is to assess the open data related to hospital access in the three largest Croatian cities (Zagreb, Split, Rijeka), which are the main hospital centers in the country and where information is needed by domestic and tourist populations. Data analysis is performed for the following datasets: hospitals, hospital specialization, public transport (tram, bus), bike routes, car routes, parking and parking for people with disabilities.
The future aim is to create a new mobile, multilingual and voice-based application that would enable quick access to information on the selected type of hospital access (hospital address and hospital specialization), type of public transport (tram, bus, bike routes, car routes) and available parking (regular parking and parking for people with disabilities). The application would be created to be multilingual and voice-enabled, in order to be used by domestic populations and by tourists, as well as by persons who need voice guidance. The application would improve over time, through interaction with end-users, by adding new data and by the verification of existing data. This application, based on existing open datasets, would be designed as an open data ecosystem, which would improve through feedback interaction with end-users.
The paper offers a larger perspective related to the assessment methods of open data through different types and aspects of data assessment. In addition to the supply side, the development side is differentiated into two categories, demand by researcher/developer and demand by end-user, which are considered relevant in data assessment. In the new proposed framework, the concept of the end-user is introduced, relevant for the assessment of data, which would, in a cyclic manner, improve over time.
This research aims to assess the available open data related to access to hospitals in the three largest Croatian cities, which are most importantly hospital centers, with a future aim to create digital services as an ecosystem that will be used in everyday situations as part of the concept of “digital society”.
There are four specific aims:
(1) To identify and analyze portals and open datasets of selected categories for the three largest Croatian cities;
(2) To analyze existing open data assessment frameworks and detect gaps;
(3) To create a conceptual open data assessment framework as an open data ecosystem that integrates the new end-user perspective;
(4) To analyze existing open datasets for the three largest cities in Croatia, based on the supply and demand by researcher/developer categories, using the newly developed framework.
Digital services, being part of the digital transformation process, aim to improve the user experience, make communication easier, reduce costs, improve efficiency, augment transparency or reduce time to market. Digital services are increasingly used today by a broad population and represent a means for the electronic delivery of information. Such services use data and content across web or mobile platforms, enabling 24/7 information delivery or interactive communication, depending on the level of integration. The EU encourages the development of online platforms, which are drivers of innovation, treat users fairly and enable equal access and consumer choice, among other benefits. In this context, the European Commission proposed the Digital Services Package [7], aiming to protect users through innovative actions within the digital economy and to regulate the digital space, including online platforms, such as social media platforms, online marketplaces, search engines, app stores and payment systems. Information in digital services needs to be presented in an clear and user-friendly way, in order to make interaction simple. Information services are used to enhance services, communication and administration; to improve communication with citizens and among interest groups or businesses; and to reduce the digital divide [8]. In particular, demand-driven applications designed to provide answers to societal issues are an essential part of the move towards smart cities and a smart society.
Due to pandemics and health issues, digital transformation and the development of services for health purposes have gained significant interest. This process requires the involvement of all relevant stakeholders (governments, policymakers, ICT sector, citizens, data providers, business sector, education sector, etc.). Digital services, developed as part of an open data ecosystem with feedback from end-users, would improve over time and enable the creation of new added value.
The selection of portals and open data is performed on spatial data related to hospital location and specialization, public transport (bus, tram), bike routes, car routes and parking (regular and for people with disabilities), for the three largest cities in Croatia (Zagreb, Split, Rijeka), which are also the largest hospital centers in the country. To our knowledge, existing research includes information searches on Croatian hospital websites [9,10,11], but there is no research related to the assessment of datasets providing insights into the accessibility of public hospitals. To our knowledge, there are no specific applications providing the entirety of the envisioned functionalities (e.g., including parking, parking for people with disabilities, bike routes and hospital location and specialization).
The assessment of the performance of open data ecosystems has gained significant interest among researchers worldwide [6,12,13,14,15,16]. These existing assessment methods focus on the status of the components of an ecosystem (‘is there an open data policy?’, ‘do the data comply with open standards?’, ‘are they available free of charge?’, etc.). In this way, the different frameworks provide insights into the openness of certain datasets, and/or the governance of the open data system, often using indicators to rank the supply of open data of individual countries or organizations. Analyzed frameworks that exist on the supply side of open data are more focused on the status of the components, lacking evaluation scales and not including end-user-driven aspects, which would be crucial for the open data ecosystem. As a result, the new “Hospital Access Framework” is created as a conceptual ecosystem, including five categories, among which is the category demand by the end-user. By applying an end-user-driven approach, this article fills this gap in the assessment of the cyclic ecosystem, taking into account the end-user for application evaluation.
In the research, we used the basic indicators for assessing the performance of an open data ecosystem and complemented them with the result of the assessment of hospital accessibility. The results will provide insights into how the open data ecosystem can answer a simple question related to hospital specialization and hospital access information. However, in order to create a digital service, e.g., a smart application developed as an ecosystem, existing open data are to be identified, analyzed and evaluated, in order to estimate their quality for future smart application development.
The organization of the paper consists of the following. Section 2 presents related work assessing open data ecosystems. Section 3 gives the research methodology for the development of the new framework. Section 4 gives the results of the framework implementation. The conceptual “Hospital Access Framework” consists of five categories: supply, demand by researcher/developer, demand by end-user, legal aspect and impact. For each category, several KPIs are developed using SMART criteria, together with evaluation scales. The first two categories (supply, demand by researcher/developer) are used for the evaluation of open datasets for the three largest Croatian cities, while the other three categories are conceptually developed for the evaluation of the future smart application. This framework includes the category demand by end-user in order to enable the evaluation of the ecosystem, which would improve through interaction and over time. In Section 5, results are discussed, and in Section 6, conclusions are provided and recommendations for further research given.

2. Related Work: Assessing Open Data Ecosystems

This section explains the open data ecosystem approach in Section 2.1 and summarizes several of the main frameworks on open data assessment in Section 2.2.

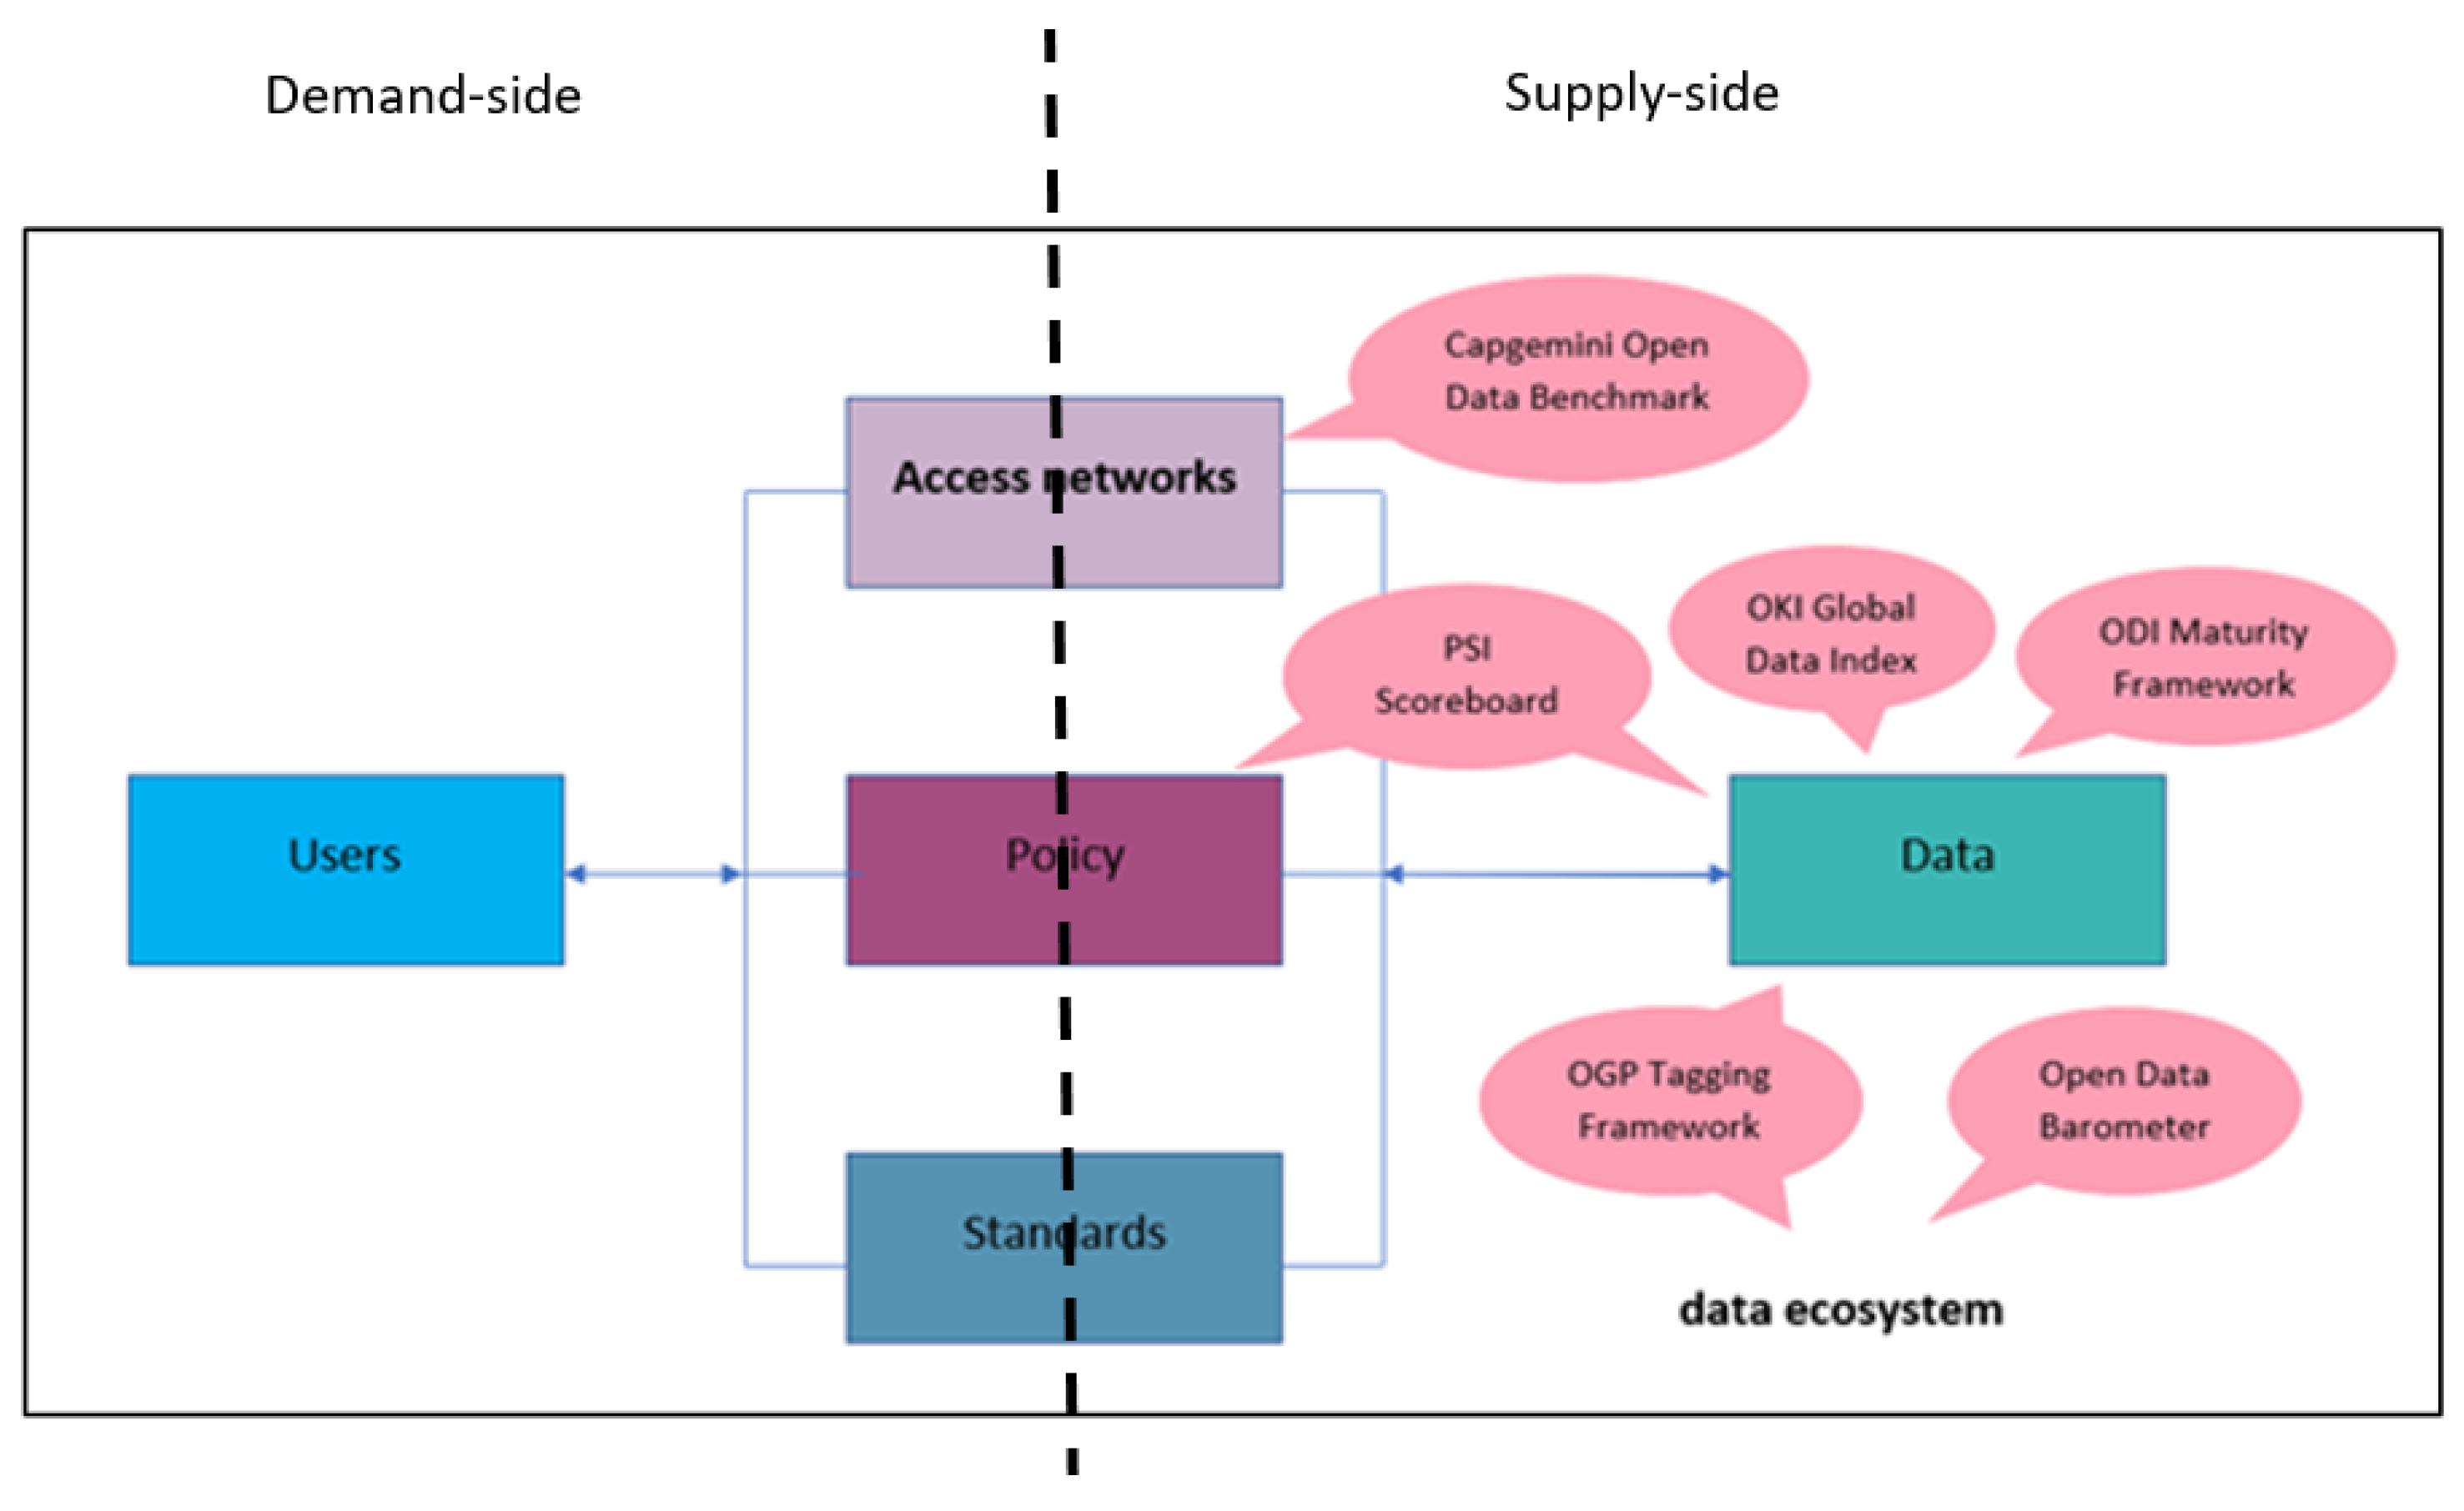
2.1. Ecosystem Approach to Open Data

The open data ecosystem is a metaphor used for the interdependencies of entities in an open data environment [17], denoting the environment’s continuous development as a result of user adoption, feedback loops and interactions [18]. Although an open data ecosystem emphasizes open participation, its development is currently more influenced by the changes coming from the supply side (e.g., personal data regulation), in contrast to the actual (re)users (e.g., citizens), who are mostly adapting to these changes. An ecosystem, being a sociotechnical upgrade to (open) spatial data infrastructures (SDI) with the main objective of ensuring effective data sharing among interested stakeholders and supporting data reuse, comprises the same components as an SDI (Figure 1): users, data, material infrastructure and institutions [19]. Users in the SDI can be anyone, from governments to private companies, citizens and developers. Depending on who they are, they use open data for different purposes. When looking at questions, such as “Where is the nearest hospital?”, “What is the hospital’s specialization?”, “How can I get there?” or “Is there parking for people with disabilities persons?”, developers tend to be relevant user groups as they have the knowledge and skills to extract and process information from open data and to provide answers. However, to do so, relevant data must be available. Users, on one side, and open data, on the other side, are fundamental in this environment but cannot compose an ecosystem alone. Since the idea of an (open) SDI is to facilitate and coordinate the exchange and sharing of (open) spatial data in data communities [20], data flow among stakeholders, mostly classified as users and providers, highlights the necessity for defining rules for data sharing. These rules support data reuse and can be categorized as access networks, policies and standards, and they affect both nontechnical (e.g., data licenses) and technical aspects of the ecosystem (e.g., formats). Access networks understand data access mechanisms, such as portals, through which data are made available for use. Usually, portals are places where users meet providers utilizing provided data, and for, e.g., developers, they present valuable data sources. Policies and policymakers define the principles under which data are made available to anyone interested. In addition, policies ensure the long-term transparency of government data [21], and thereby public access to open data [18]. Standards, on the other hand, ensure interoperability by providing a common understanding of what should be described and how [22]. The dynamic nature of all these aspects, due to constant technological developments, reflects the entire ecosystem, making it a cyclical, sustainable and demand-driven environment in creating added value from open data [23]. For instance, rapid technological developments need to be followed by policy improvements, which again affects data, data providers and finally end-users. Therefore, the open data ecosystem should be seen as a living and constantly changing network of interaction between data, users and technology [24].

2.2. Available Open Data Assessment Frameworks
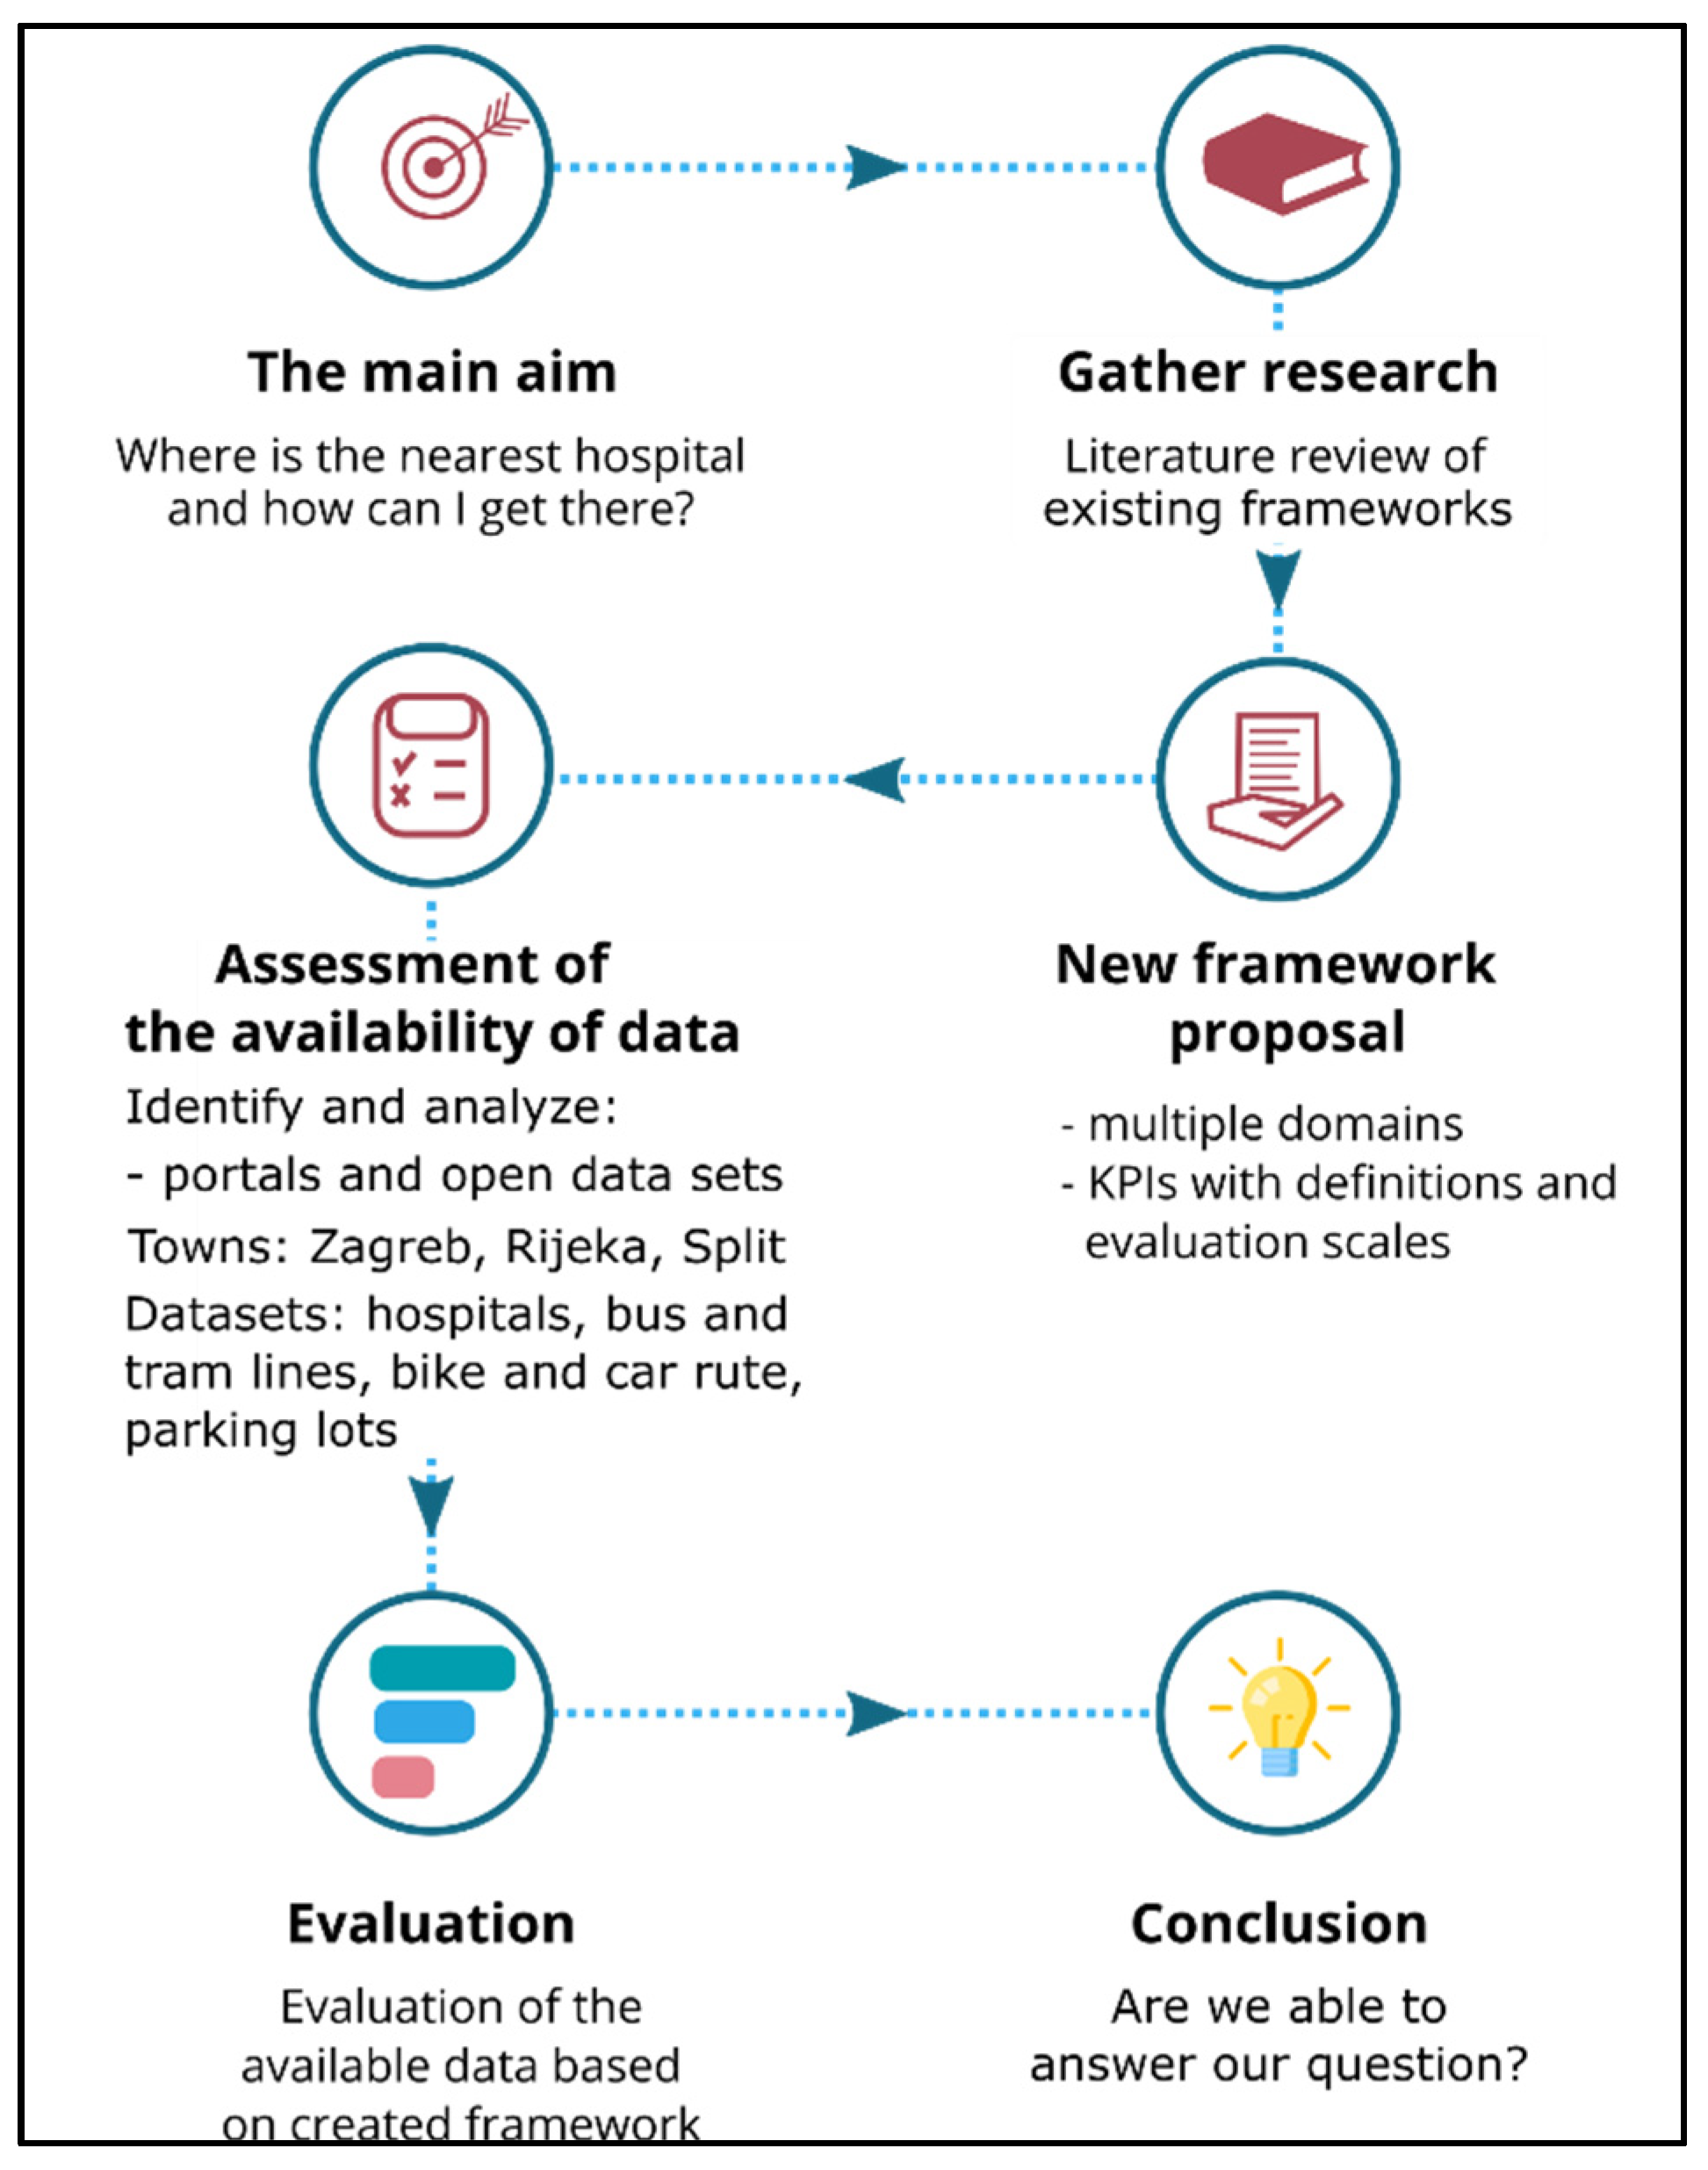
An open data (OD) ecosystem is a broad concept consisting of many interrelated perspectives with closely connected interdependencies and reflecting on different aspects of open data [18]. Open data ecosystems may be analyzed at different scales (from local to national) and from different perspectives [25]. In recent years, the concept of open data ecosystems has gained momentum due to its potential to move beyond merely open data supply, and it has been realized by governments around the world [26]. To support this uptake of OD initiatives and ensure the successful embedding of open data in society, their maturity level should somehow be assessed. In this context, assessments have proven to be a useful tool for gaining insights and the evaluation of OD ecosystems [27,28,29]. The synergy of technical, legal and organizational policies is crucial for a well-functioning OD ecosystem, as well as collaboration among actors in order to create win-win situations of the business ecosystem [28]. Usually, strategies for the implementation of OD initiatives cover all the mentioned aspects and, therefore, different assessments can be performed. Several assessment frameworks have already been developed to assess different aspects of openness. All these frameworks have the perspective of a data provider (supply-driven approach) in common, which means that the quality of the ecosystem is evaluated exclusively by internal properties (see Figure 1) with added categories of supply side and demand side.
For example, the Global Open Data Index framework, developed by Open Knowledge International (OKI), tracks the publishing of open government data [16], while in [30] Global Open Data Index is used to assess how open can mobilize different types of users to use and publish open data. The Public Sector Information (PSI) Scoreboard measures the level of openness and reuse of open data in the context of the EU Directive 2003/98/EC on the reuse of Public Sector Information [31]. The PSI Scoreboard is a conceptual framework aiming to benchmark the innovation performance in the EU of the public sector, with Sweden as the leader. On average, innovation performance has risen by 12.5% since 2014. The measurement framework includes four main types of activities—framework conditions, investments, innovation activities and impacts—and has 12 innovation dimensions for a total of 32 indicators. Framework conditions include human resources, attractive research systems and digitalization. Investments include finance and support, firm investments and use of information technologies. Innovation activities include innovators, linkages and intellectual assets. Impacts include employment impact, sales impact and environmental sustainability.
On the other side, the Open Data Institute’s (ODI) Maturity Framework is an organization-oriented assessment helping organizations to measure how well they publish and use open data [13]. This model is based around five topics (data management, knowledge and skills, customer support and engagement, investment and financial performance, strategic oversight) and five progress levels (1—initial, 2—repeatable, 3—defined, 4—managed, 5—optimizing).
The Tagging Framework, developed for the Open Government Partnership (OGP), aims to measure the levels of action plans covering both supply and demand for open data [14]. OGP is based on the idea that an open data government can improve peoples’ lives by creating action plans related to information access, civic participation, public authority, technology and innovation for transparency and accountability, etc.
The Open Data Barometer framework [15] assesses open data using a methodology of open data readiness (including legal, economic, political, social, organizational and technical foundations that enable the supply and use of open data), implementation (open data practice measured through 15 categories) and impact (through media and academic mentioning of data use and data impact).
The Capgemini Open Data Maturity methodology [6] enables countries to better understand the level of maturity of open data, to identify areas of improvement and to enable benchmarking with other countries. In this framework, open data maturity is based on the following dimensions: open data policy and strategies, open data impact (political, social, environmental and economic), open data portals (accessibility of data, machine readability, spread of data across domains) and quality (mechanisms to ensure quality of metadata). According to [6], the average open data maturity for the 27 European countries increased to 81%, across the four dimensions: policy (87%), impact (78%), portal (83%), quality (77%). According to [6], among the four categories of clustering results for EU27 countries (trend-setters, fast-trackers, followers and beginners), Croatia belongs to the category of followers.
When counting number of visitors to portals, the highest is France, with around 1 million visitors, while Croatia is ranked in sixth place. The most popular categories of datasets are Health and the Environment, followed by Population and Society, and Government and Public Sector.
Although these frameworks provide valuable insights into the status of open data, they are missing the end-user’s perspective. One of the purposes of open data is to solve societal problems, which means that citizens should be able to use the data for different everyday life purposes [32]. Sometimes, even if data score high on openness according to some assessment frameworks, they may not necessarily be usable for specific purposes. In addition, existing frameworks are used to evaluate static published data and do not include an end-user interaction component. In this case, the end-user of the future smart application could assess whether it is developed on various smart devices, usage costs, usefulness, multilingualism, voice guidance, feedback and communication. By introducing this dynamic end-user perspective, the smart application would improve over time, through evaluation or by adding new data.
A user-driven approach, therefore, proves current assessment frameworks insufficient as it shows the limitations of, among others, data access and availability. These limitations, in the absence of a user perspective, may not even be noticed. A user-driven approach turns the assessment upside down by stating a problem and assessing how well existing open data can provide an answer. In this way, by introducing demand-driven assessment criteria for the evaluation of the dataset, we may provide valuable information relevant for developer stakeholder groups. In addition, problem-driven assessment reflects on data characteristics that, in other cases, perhaps would not be considered (e.g., are the data relevant?) but are important in data reuse. Even if the approach of a user-driven framework is different, some assessment principles remain the same. For example, user perspective assessment also reflects on data quality (e.g., completeness) and other characteristics that are and should form part of the open data perspective.

3. Methodology

In this section, the methodological approach for the conceptual design of the User-Driven Assessment Framework is described. The user-driven approach proposed in this research is, to our knowledge, a novel approach that includes user aspects into the evaluation. Compared to other frameworks that are more data-driven—see, e.g., [33]—our framework is user-oriented and provides a clear score of the evaluated data, with clarification of the specific usability of the evaluated data. This methodological approach provides a user-driven assessment approach, which is missing in other related studies that mainly focus on the status of individual ecosystem components. The analysis of existing frameworks and detection of gaps in related studies resulted in the conceptual creation of an end-user open data ecosystem that integrates end-user and innovation perspectives shown in this research.

3.1. Methodological Approach for the Design of a User-Driven Assessment Framework

This study applies a mixed methodological approach of theoretical research and practical research on open data evaluation. For the theoretical research, we carried out a literature review of existing frameworks for open data assessment and a detailed analysis of existing frameworks. For the practical research, we identified open data portals and performed open data retrieval and data acquisition. Figure 2 presents the research flow chart. The methodological approach is designed to capture deeper insights into domain-specific open government data, which are used to offer a newly designed service. The final outcome is the conceptual ecosystem model and new proposed framework, which are ideally aligned through practical implementation by the assessment of data, the components of the conceptually created ecosystem and the ecosystem in implementation.

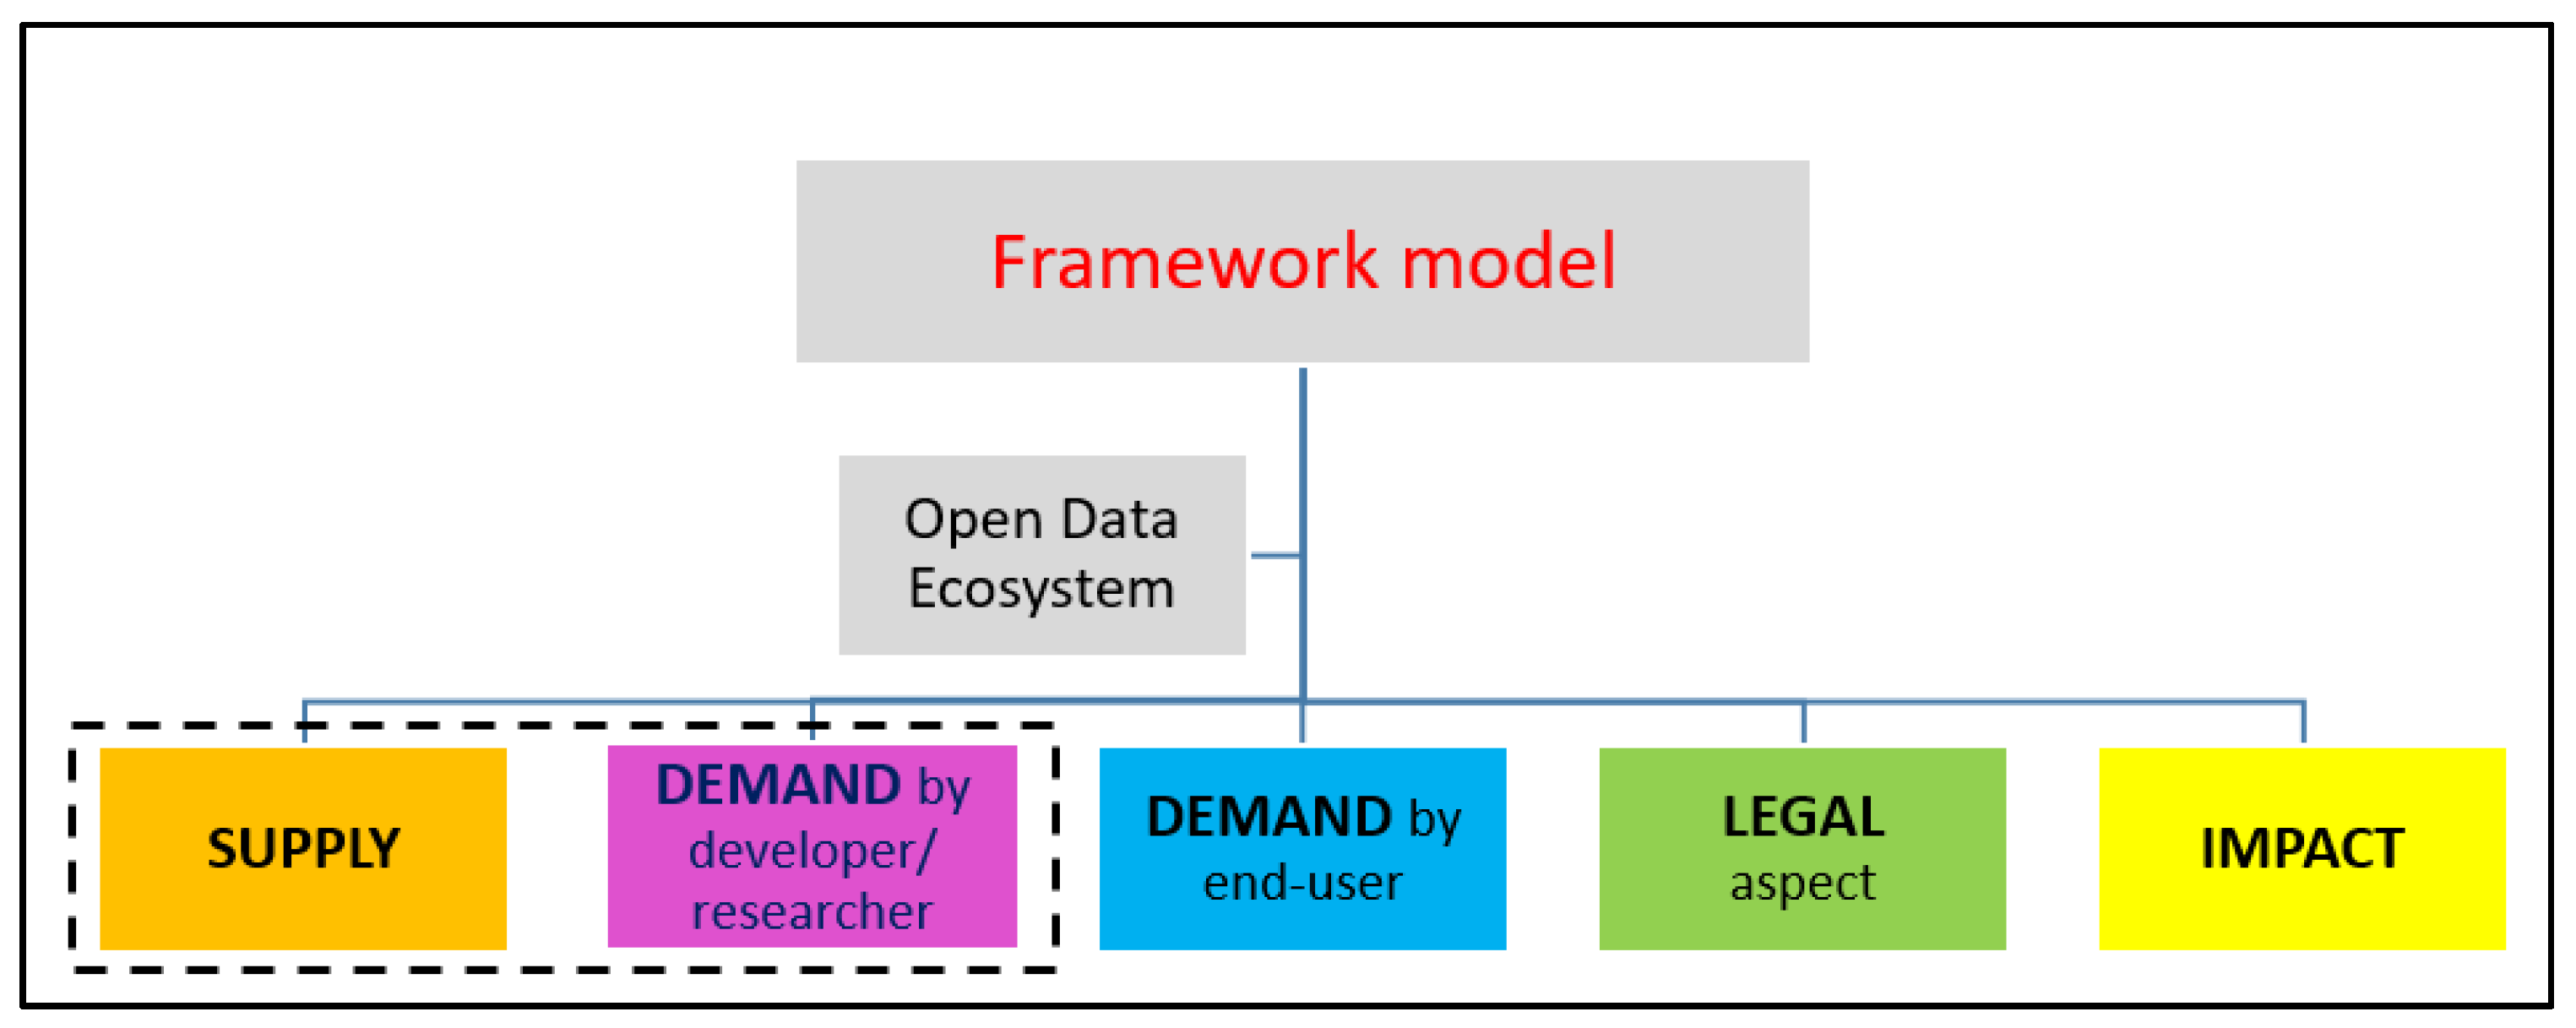
3.2. A New User-Driven Assessment Framework for Open Data

The result of the analysis of existing frameworks and detection of gaps was the conceptual creation of an end-user open data ecosystem that integrates end-user and innovation perspectives. The newly created ecosystem identifies five categories:
  • Supply side (supply of open data on web portals);
  • Demand side by researcher/developer—through the perspective of open data user skills working with data (e.g., data analyst, data scientist);
  • Demand side by end-user—through end-user capabilities (end-user of the application, e.g., citizen);
  • Legal and privacy aspects;
  • Impact side—through innovation perspective (e.g., company/innovator creating the innovative application).
This ecosystem would improve over time, based on feedback mechanisms realized through the interaction with users, which would result in improved datasets in terms of quality and quantity.
The framework that we developed, presented in Figure 3, uses the basic indicators for assessing the performance of an open data ecosystem, provided from various open data frameworks, and is complemented with new categories resulting from our research.
The first two categories (supply and demand by researcher/developer) are used for the assessment of existing open datasets for the three largest cities in Croatia, for the following types of datasets: hospitals, hospital specialization, public transport (tram, bus), bike routes, car routes, parking, parking for people with disabilities.
The other three categories (demand by end-user, legal aspect and impact) are conceptually developed and intended for the assessment of the future smart application. In this framework, two types of demand aspects are differentiated: demand by researcher/developer (i.e., data scientist, working with data) and demand by end-user (necessary for improvement of the ecosystem through interaction). The new category, demand by end-user, represents the innovative aspect, necessary for the integration of the feedback component of the ecosystem. Through the end-user interaction, the application would improve over time by adding new data or correcting existing data.
For suggested categories, key performance indicators (KPIs) are developed, using the specific measurable achievable relevant time-bound (SMART) criteria, as follows:
  • Supply side—completeness, timeliness, ease of physical and electronic access, machine processability, non-discrimination, use of commonly owned or open standards, licensing, permanence;
  • Demand by researcher/developer (open data user skills)—timeliness from user side, format from user side, licensing from user side and feedback.
For each KPI, a description is provided in order to facilitate the assessment. We used a 5-point Likert scale that provides a numerical value for answering the questions (see scale column in Table 1).
Three other categories of the new framework will be evaluated with the development of the future application and include the following criteria:
  • Demand by end-user—development as web and mobile application, stated pricing policy, multilingualism, voice-enabled options, usefulness, user engagement, i.e., interaction with app developer, possibility to add data, possibility to confirm data;
  • Legal aspect—practice and reuse of data, license for distribution, funding by government, promotion of digital service in society;
  • Impact side—employment of data scientists, user engagement, relevance of app for the specific sector, number of downloads, partnership (private–government, private–academic, private–city government), membership of company in professional organizations, positive balance sheet of the company, company website, multilingualism of website.

4. Application of the New Assessment Framework

In this section, we provide the results of the assessment of the open data ecosystem for the largest Croatian cities, Zagreb, Rijeka and Split, which are the main hospital centers. In Section 4.1, we justify the selections made, and in Section 4.2, we describe our findings for each of the cities. In Section 4.3, we evaluate our findings. Each category in our assessment framework is assessed by the openness of available open data deemed necessary to answer our main research question. These are open data on (1) hospitals, (2) hospital specialization, (3) public transport, (4) bike routes, (5) car routes, (6) parking and (7) parking for people with disabilities.

4.1. A New User-Driven Assessment Framework for Open Data

The focus of the research is to detect publicly available datasets in order to assess the access to hospitals in the three largest Croatian cities (Zagreb, Rijeka, Split). The research is based on existing open data, found on web portals, containing information on hospitals, hospital specialization and hospital parking for people with disabilities, on public transport and stations (bus lines, tramways, bicycle routes), roads and car parking. The first set of data, ‘hospitals’, belongs to the set of data that also includes the final destination of the user, i.e., the location of the hospital where the requested service will be provided. The other datasets describe how the user should reach a particular hospital while providing an alternative mode of travel depending on the desired mode of traffic from the origin to the final destination. Table 2 provides an overview of the available infrastructure to answer the research question, which is related to the KPIs presented in Table 1.

4.2. Data Portals

In Zagreb’s Open Data Portal, data on bicycle paths can be downloaded in XLSX or CSV format. The dataset contains information about the length of the path for each street in Zagreb, with the coordinates of the midpoint of the line that they show. There is no information on the coordinate system in which data are provided. The portal also has CSV and XLS files that contain the address data of hospitals, with the longitude and latitude of facilities in the WGS84 coordinate system, as well as the basic contact information and web addresses of hospitals. However, there is no specific information on hospital specialization or parking for people with disabilities. Within the ZG Geoportal, data on public garages, railways, bus and tram stations, bicycle paths, taxi stands, bicycle garages, gas stations and electric charging stations can be viewed, but not downloaded. The data on bicycle paths on this and the previously described portal do not match. ZG Geoportal provides information on a greater number of paths and covers a larger area of the city. ZG Geoportal also provides access to the following health datasets: Croatian Health Insurance Fund, Health Centres, Emergency, Pharmacies, Duty Pharmacies and Hospitals. In addition to viewing, data can be downloaded as georeferenced map images (in any standard image format, such as PNG, GIF, JPEG) via the WMS service. The WMS layer of interest is the General Urban Plan for Sesvete and Zagreb, and it allows the viewing of road networks. Although data on hospitals and transportation networks exist, most of these data can only be viewed (not downloaded). Information on hospitals can be found and downloaded but is not up to date. For example, information on hospitals showing the list of facilities with addresses and coordinates was last updated in May 2016. The Public City Transport ZET site in the City of Zagreb was also used, where it is possible to download the network of public city lines in PDF format. OpenStreetMap (OSM) was also used for the analysis; we downloaded data on city roads in a vector format. A general disadvantage of existing portals is the lack of metadata, which, in many cases, do not exist or are described in such a way that does not meet the needs of users. In Appendix A, all findings of open data related to the city of Zagreb are shown in Table A1.
In the Split Spatial Data Portal, we found the geographical position of all health institutions in the city of Split, varying from public hospitals and health centers to private clinics and surgeries, also without specific information on hospital specialization and parking for people with disabilities. The information refers to the address, type and contact. Analysis was performed for 25 hospitals. The data can be viewed on the portal but not downloaded. We also found data on the geographical positions of the garages and parking lots in Split. We also found a public bicycle dataset that contains existing and planned public bike stations for electric and classic bicycles (displaying the location on the map). Similar to Zagreb, it is not possible to find information on city roads or bicycle paths. For this type of data, we used OpenStreetMap. Information on city traffic is taken from the website site of Split transport company Promet Split. The City Traffic Network contains all bus lines in Split, with bus stations, and can be viewed and downloaded in PDF format. The findings of the data available in Split are shown in Table A2 in Appendix A.
The City of Rijeka distributes its data through a GIS browser, but no data relevant to this research were found. For this reason, the National Open Data Portal [44] was used to find hospitals in the city of Rijeka, which was without specific information on hospital specialization or parking for people with disabilities. A list of all hospitals in the Republic of Croatia is available in XLS/CSV format. The webpage Rijeka Promet d.d. contains data on free parking spaces (garages and parking lots) in the city. Data related to bus lines and stations are in CSV format, and other available data can be viewed through a web browser and cannot be downloaded. Data related to the city roads are not available and can only be downloaded via OpenStreetMap. Data on bicycle paths can be found on the BikeRijeka Portal. A mobile app is also available that enables users to search approximately 40 paths displayed on Google Maps and provides instructions on how to reach them. The main findings for the city of Rijeka are available in Table A3 in Appendix A. Table 3 provides an overview of the availability of datasets for the three cities.
In the next section of this paper, the analysis of selected datasets based on the assessment framework established for this research is given.

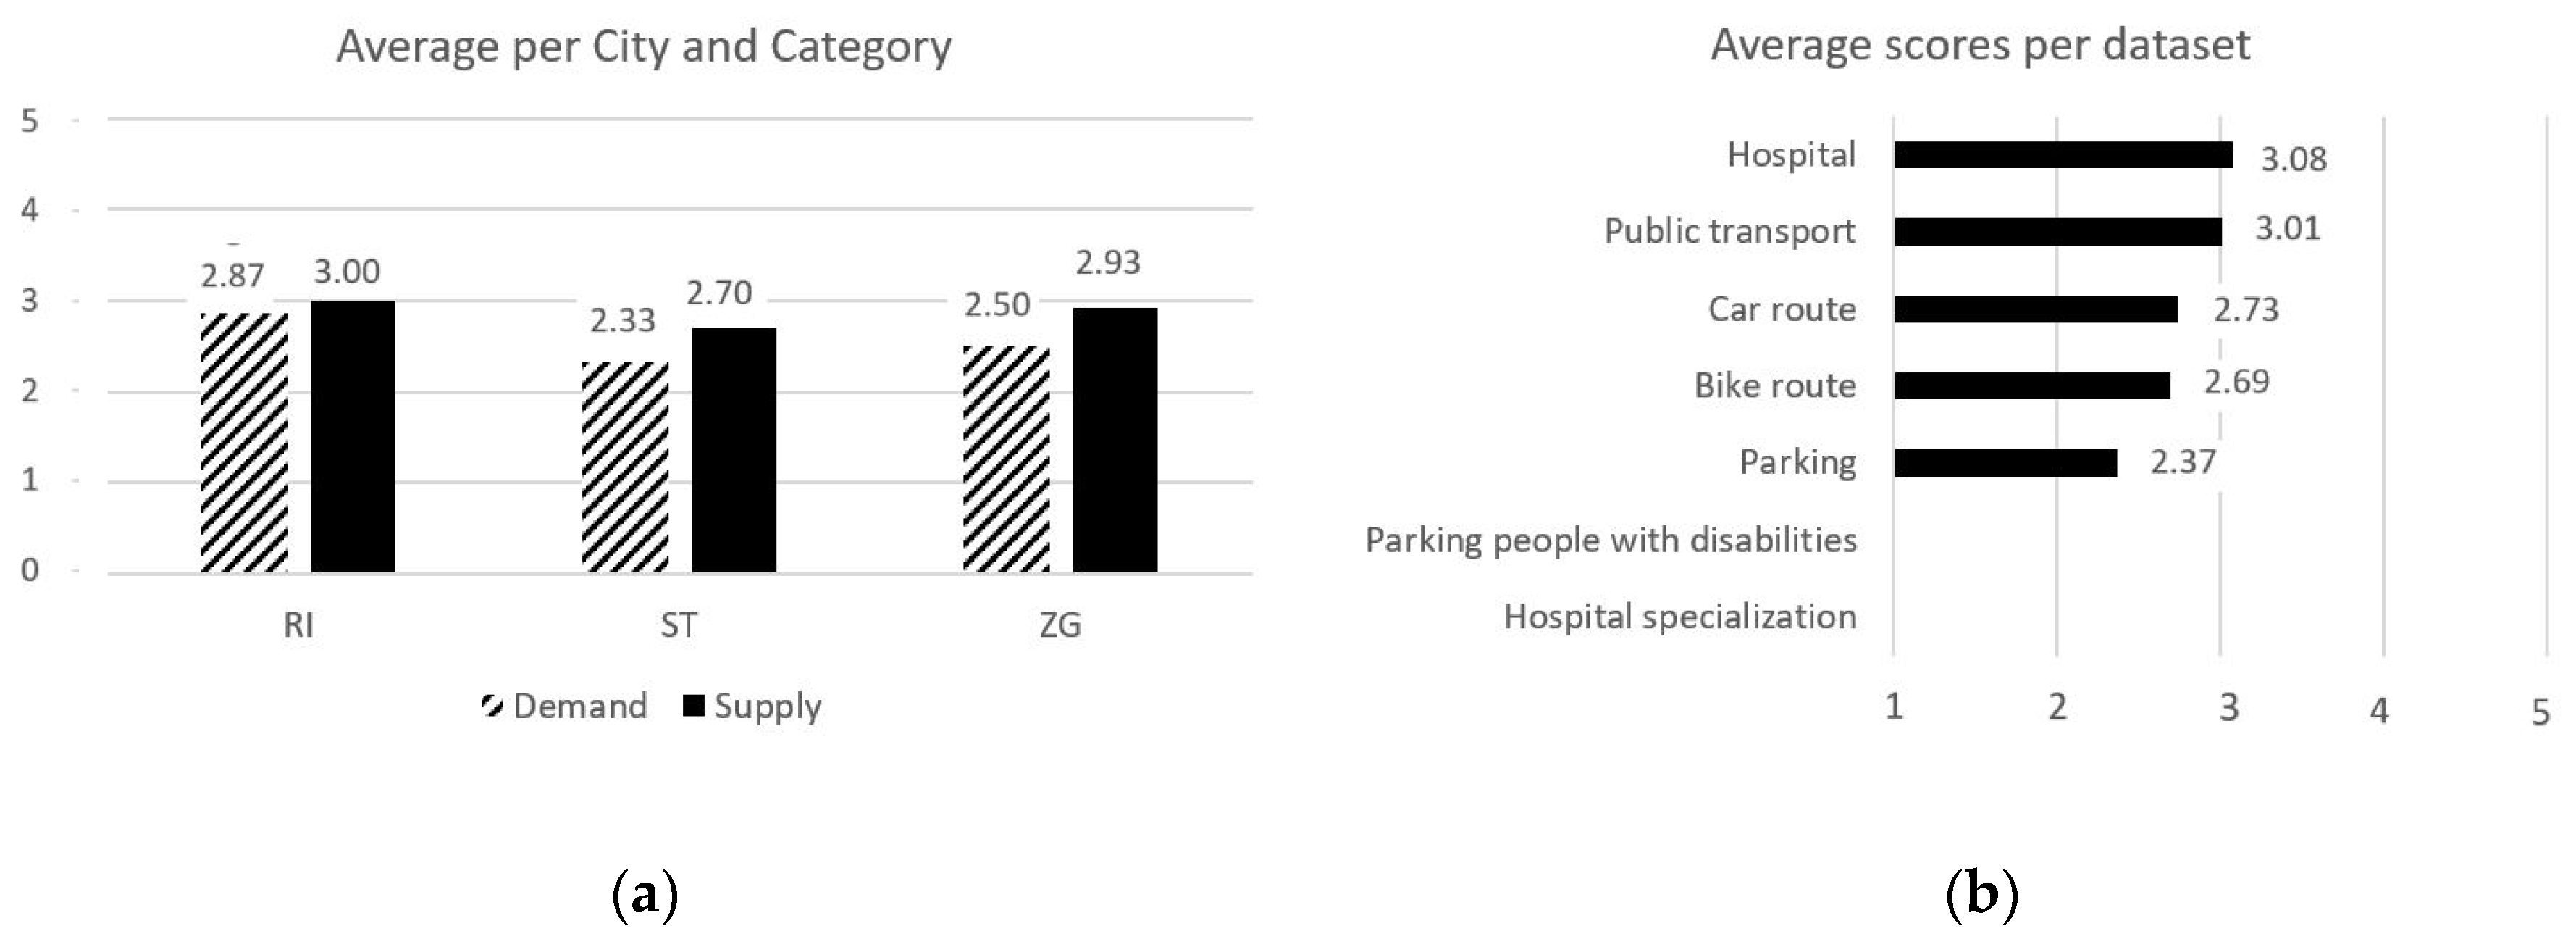
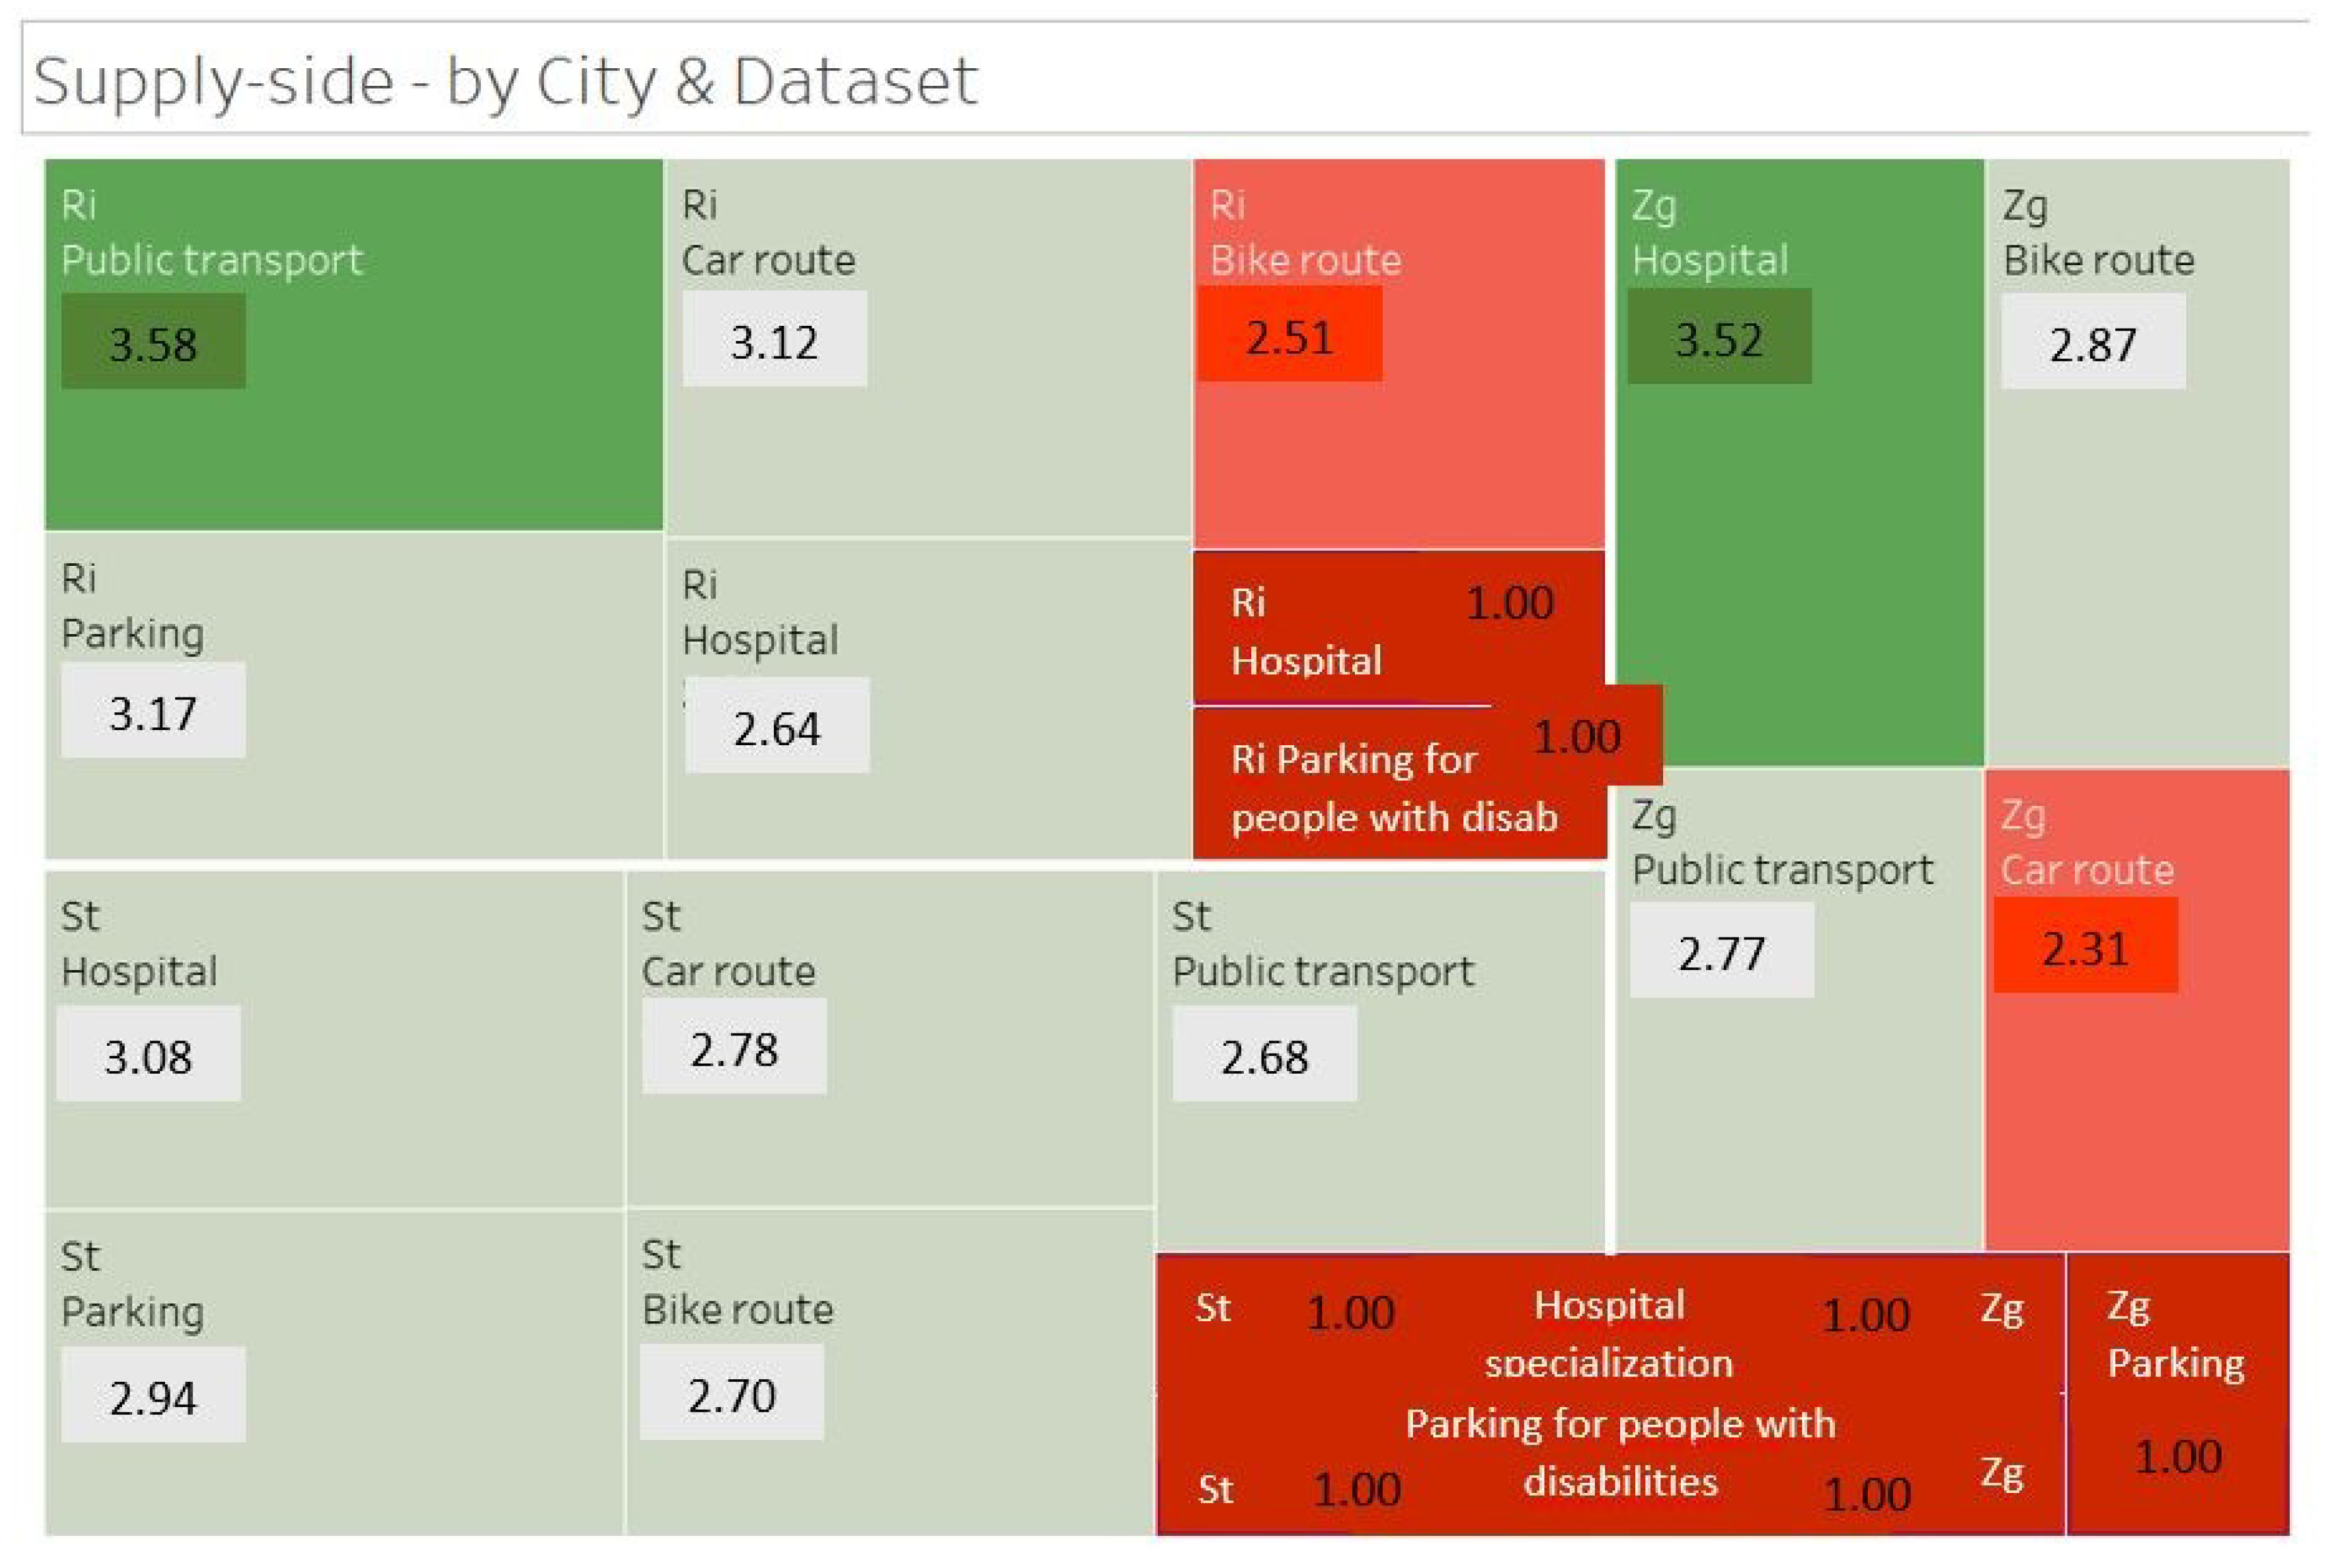
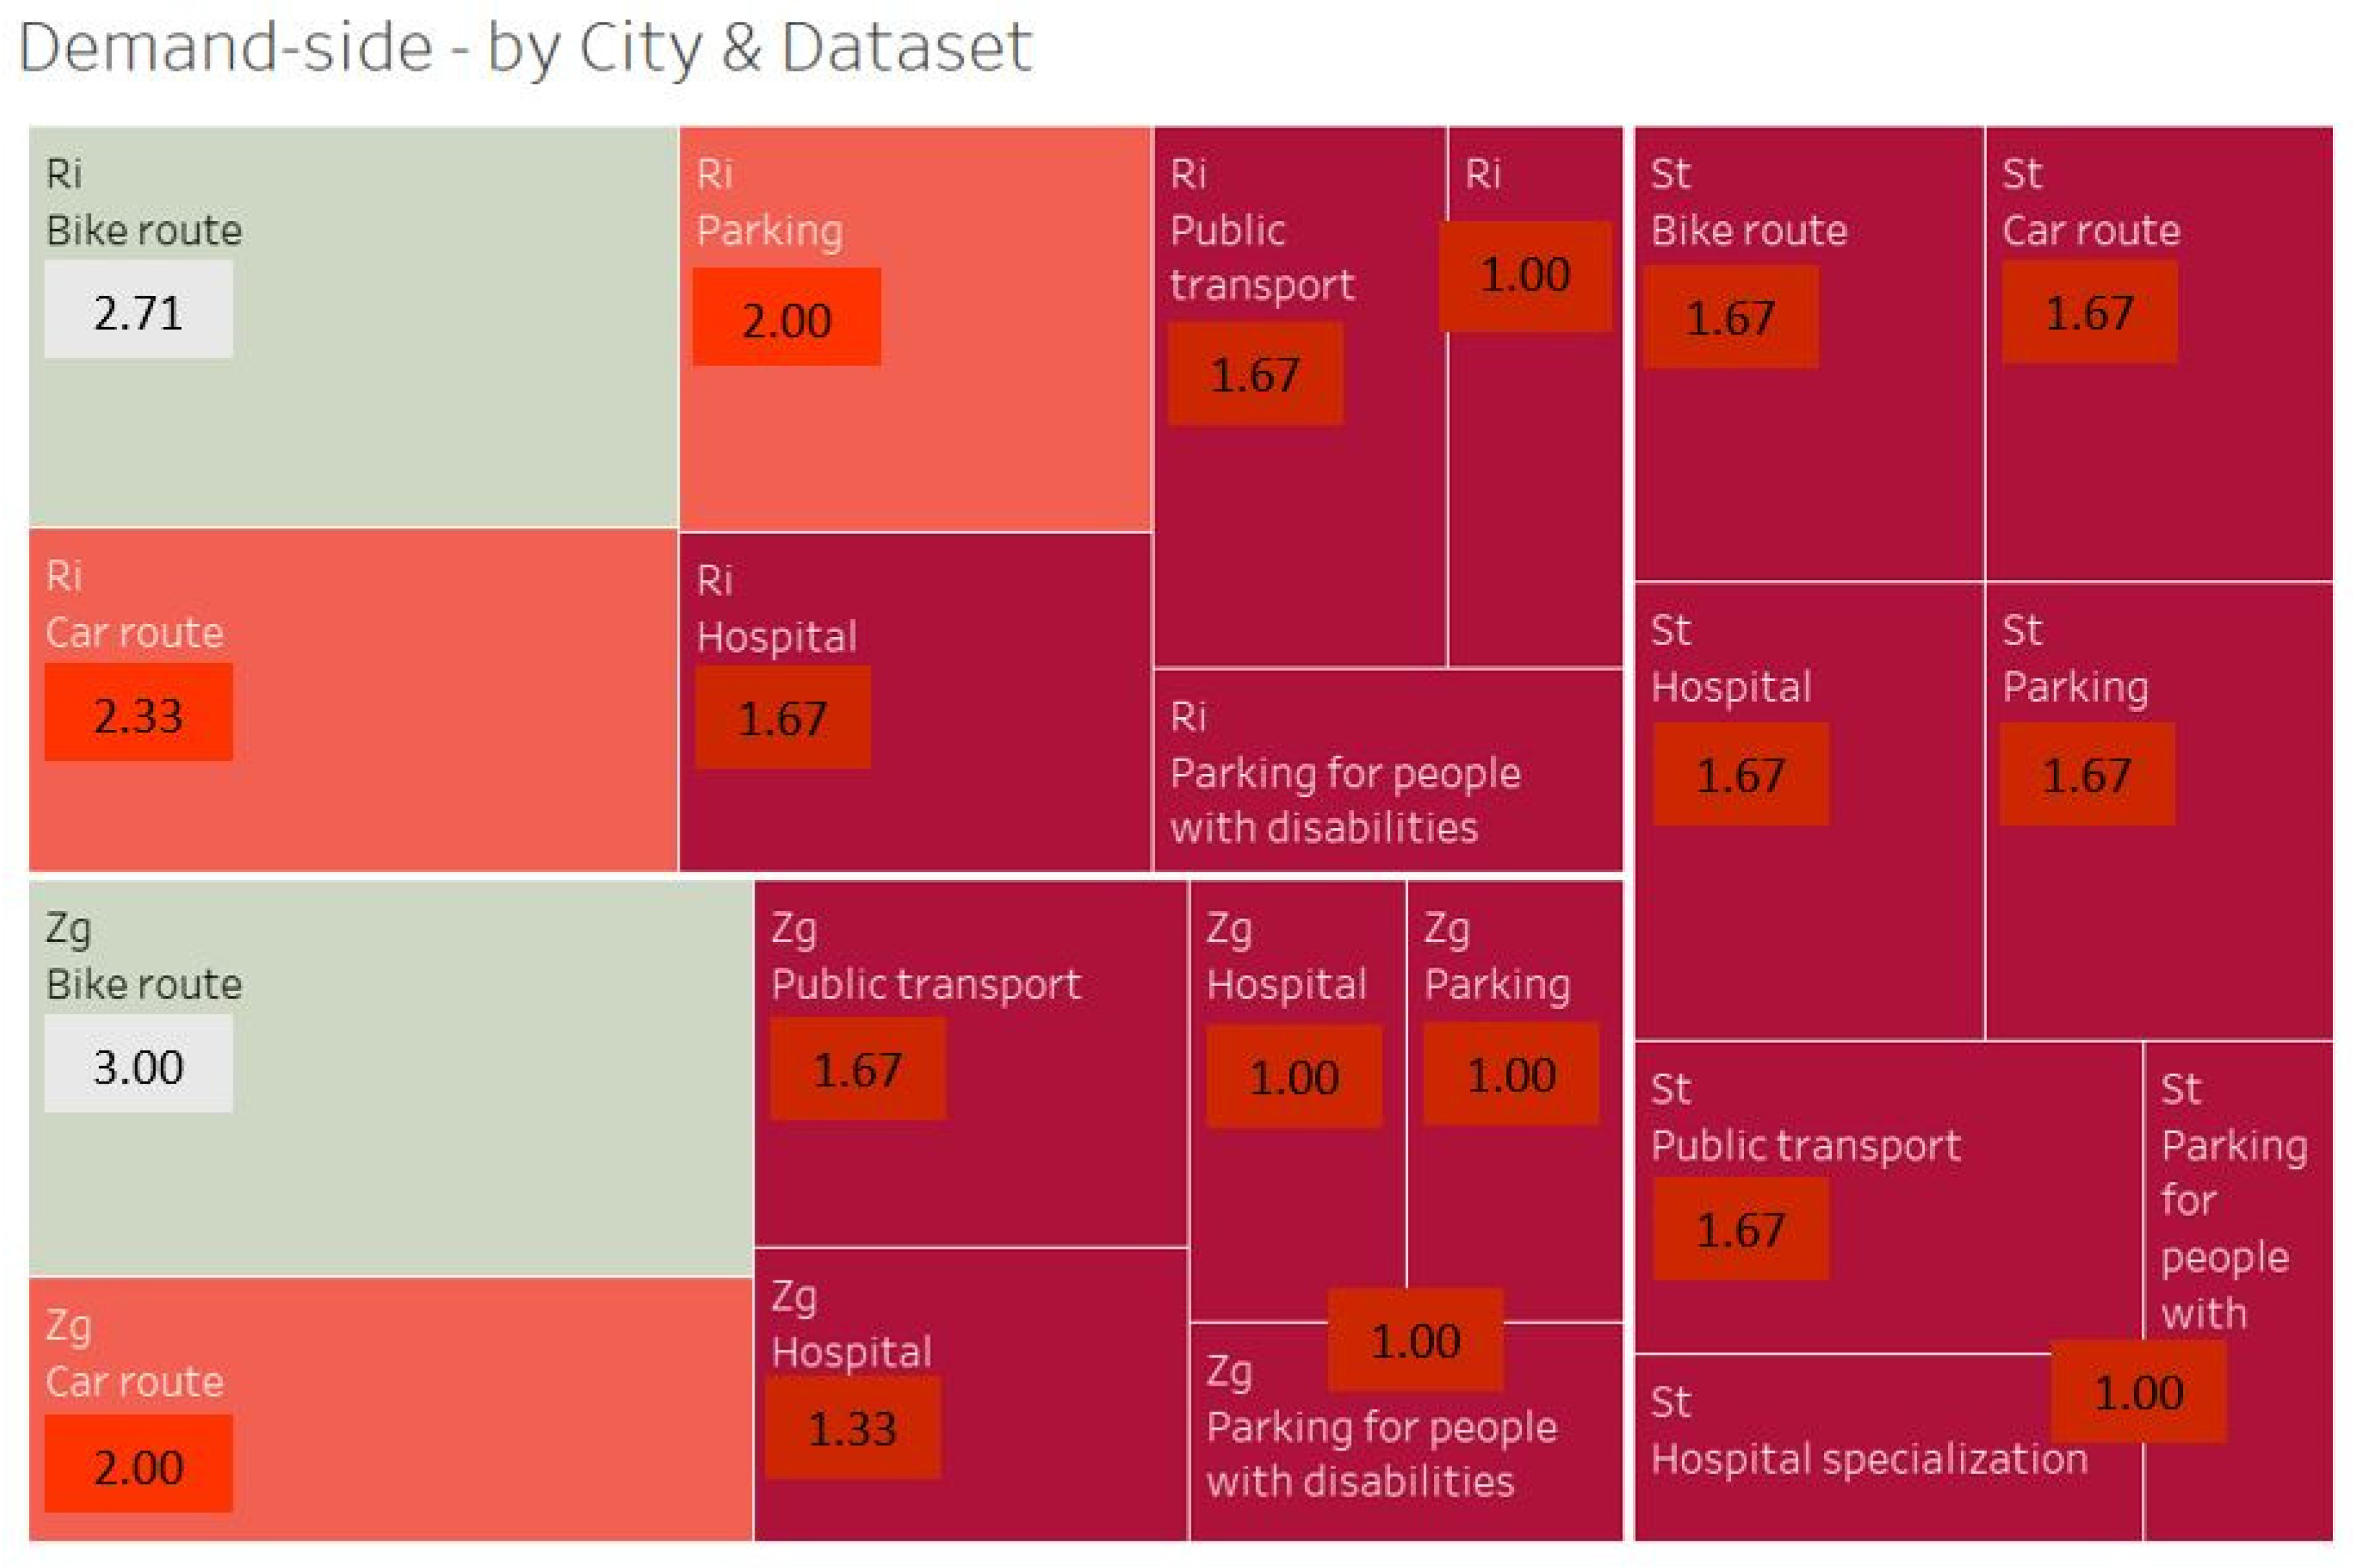
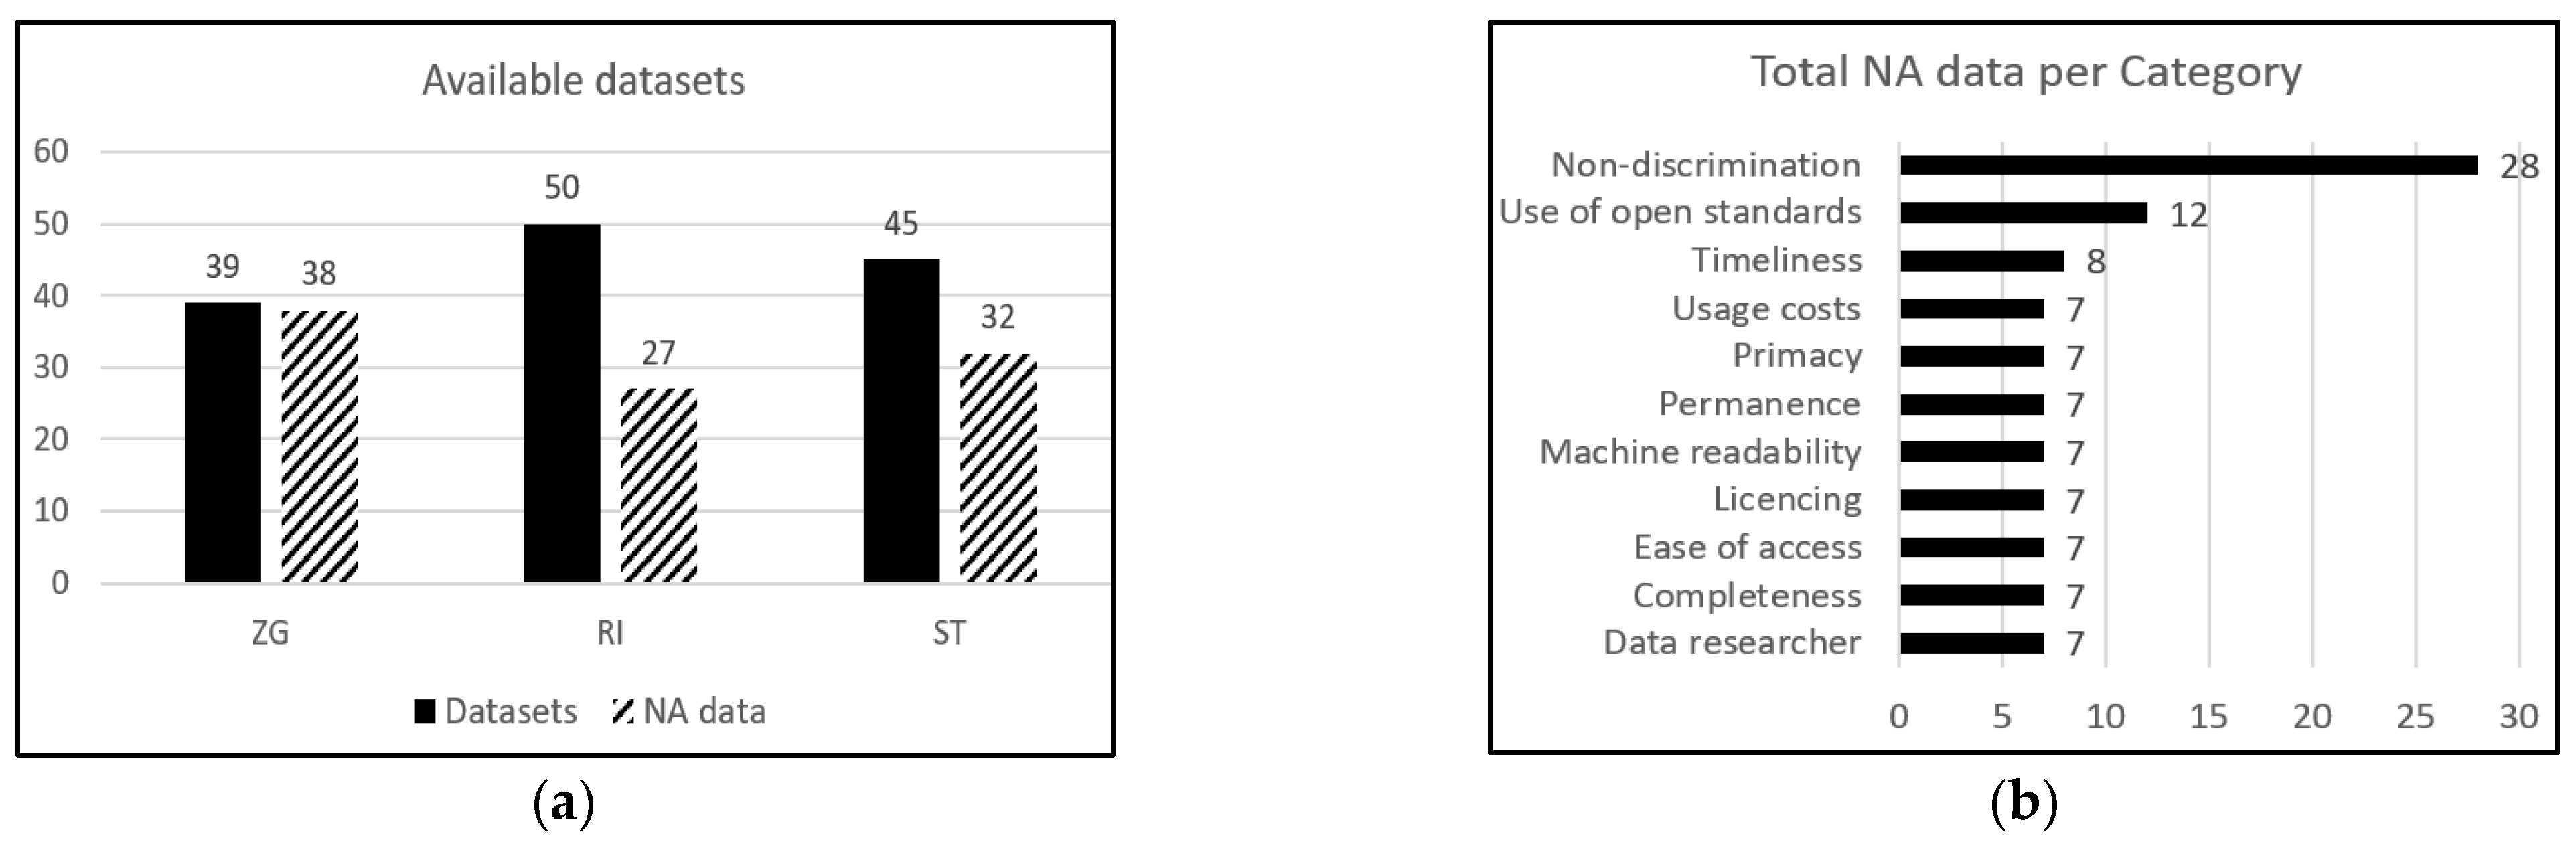
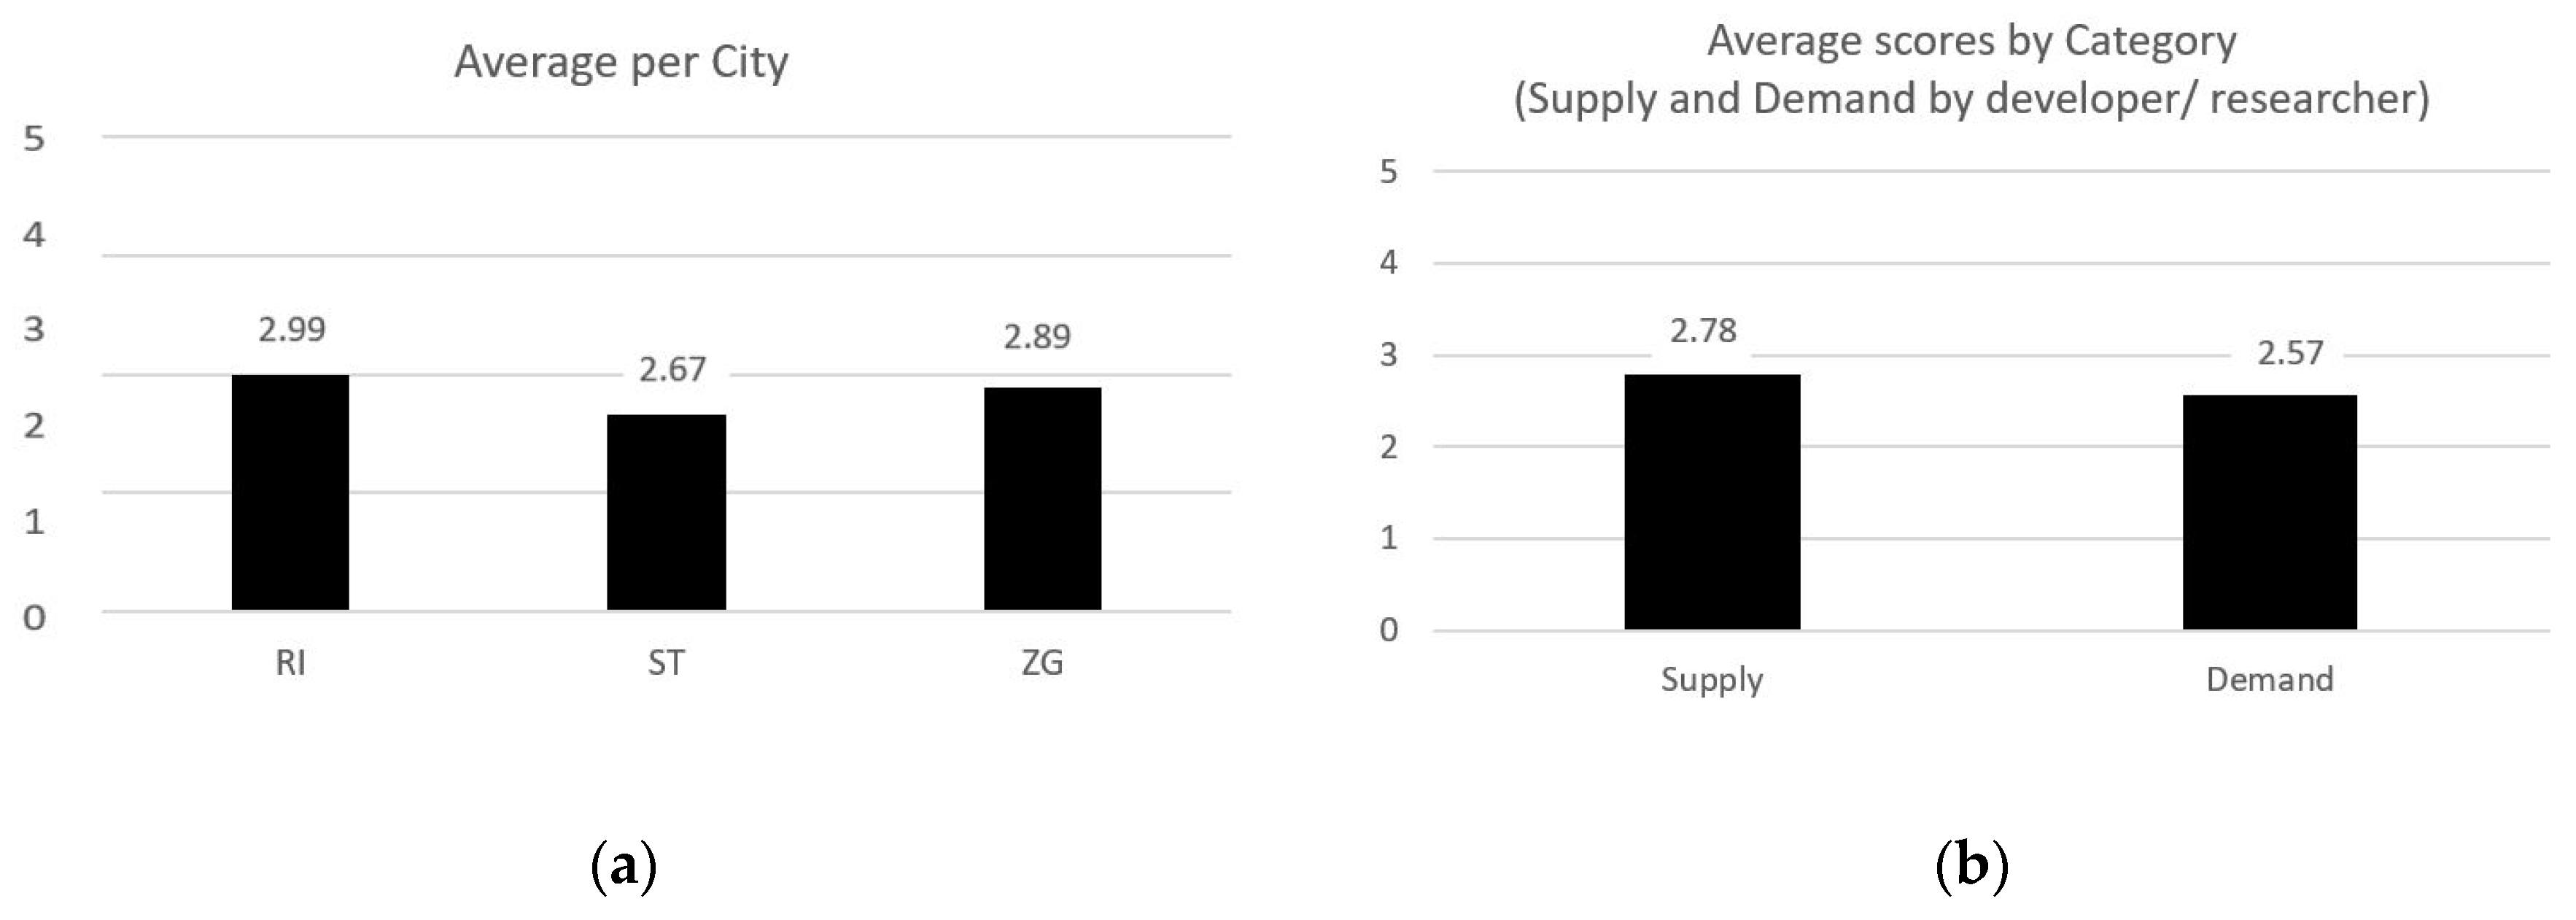
4.3. Assessment of Open Data

After the identification of portals and the required types of data, the evaluation was performed on the available datasets. Figure 4a presents the statistics of available and non-available (NA) datasets, showing a high number of NA open datasets, needed for further development of the smart application. Figure 4b presents types of NA data, especially high in the category of non-discrimination. Neither of the cities has multilingual open data, open data related to voice guidance or available parking for people with disabilities.
Figure 5a presents the average scores related to existing open data for the three largest cities, acting as hospital centers. The highest scores are obtained for Rijeka, followed by Zagreb and then by Split. However, all scores are below the average grade of 3.0. Figure 5b presents the average scores for the categories of supply and demand by researcher/developer, showing higher average scores for the category of supply (2.78). Average scores for both categories are below the average score of 3.0.
Figure 6a presents the categories of supply and demand by researcher/developer across the three largest cities. When comparing categories, a higher score is always given to the category of supply for all three cities. Figure 6b presents average scores for the available datasets for all three cities. The highest scores are obtained for hospital (3.08). The next best scores are obtained for the data on public transport (3.01), which can be bus or tramways, followed by car routes (2.73) and bike routes (2.69). The lowest grade is obtained for parking (2.37). For all of the cities, there are no open data on the hospital specialization or parking for people with disabilities, which are the types of data that could distinguish the future smart application.
Figure 7a presents key performance indicator (KPI) scores for the category of supply across all three cities. The highest score is given for the KPI of usage costs, showing that the available open data are free to use. However, other scores point to problems related to data quality and quantity. There are five KPIs above the average score of 3.0, which point to flaws in open data. Timeliness (3.71) is related to the regular updating of open data and yearly updating. Completeness (3.43) is related to the existence of data in data portals and to the fact that a machine-readable dataset is available as a whole. Licensing (3.27) is related to the question of whether it is permitted to reproduce and distribute the material in whole or in part without the prior written permission of the author. Primacy (3.14) is related to the existence of metadata in line with open standards, explanations of how derived data were calculated, information on the source and whether the dataset is provided from the original source, whether information is collected by the government or city government and details on how the data were collected.
Five KPIs are scored below the average. Non-discrimination has an average score of 2.53 for existing datasets, although there are no data on multilingual open data or on voice guidance in hospitals, for any of the cities. Non-discrimination is related to questions regarding enabling equal access to various users, such as “Is registration or membership required for accessing the data?”, “Can any person access the data at any time without having to identify themselves or to provide any justification for doing so?”, “Can data be accessed through open-source software?”, “Are data multilingual?”, “Are there data on voice guidance on hospital sites?”
Use of open standards (2.13) is related to the question “Are the data available in an open format that supports visualization in open-source software?” Permanence (2.09) is related to the existence of data on government or other portals, the possibility to track changes over time, the existence of metadata for previous versions of datasets or whether previous and current versions of open data are stored in the same way, using open standards.
The lowest scores are given for machine readability (1.60) and ease of access (1.85). Machine readability is related to the question of whether data are provided in machine-readable format(s). Ease of access is related to questions, such as “Is it possible to access the data in physical form (e.g., on CD)?”, “Is it possible to access the data in electronic form (e.g., on the web)?”, “Can data be filtered and downloaded trough Application Programming Interfaces (APIs)?”, “Are there accessible and open official tools available to help users locate and explore individual records?”. Data are mainly not available for download through APIs; they are sometimes provided in cumulative form, not in open data format, and, often, there is no record of versions that are not stored in the same standard.
Figure 7b presents KPI scores for the category demand by developer/researcher, showing a lower general score of 2.57. The highest score and the only score that gained a value above the average grade of 3.0 is given for the category of licensing (4.73). The lowest score is given to timeliness (1.27), showing that data are not up to date; specifically, they are at least 3–4 years old. A low score is also given to the feedback indicator (1.53), showing there is very little contact information, with no mail, forums or interactive communication. Ease of access (2.57) gained a higher score than on the supply side, showing better skills among developers/researchers working with data. It relates to the following questions: “Can data be filtered and downloaded through APIs?”, “Can data be fully downloaded through APIs?”. While API functionalities in the supply category are assessed through the aspect of availability, in the category of demand by developer/researcher, it is assessed through functionalities. Machine processability (2.77) also gained a score below the average, indicating that data are provided in a machine-processable format fit for our purpose (e.g., data needed for development, but those which do not exist, such as multilingual data or voice-based data).
Based on our research in each city, we evaluated each dataset for our KPIs. After completing this assessment of the datasets, we calculated the average values of all studied datasets (hospitals, hospital specialization, public transport—bus and tramways, bike routes, car routes, parking lots and parking for people with disabilities). Using the calculated average values for each category, a spider chart was created using MS Excel to evaluate the datasets. Each axis of the chart represents a dataset with a scale from 1 (lowest score) to 5 (highest score). The results are shown in Figure 8a,b.
The methodological approach that we followed is based on the evaluation of the selected datasets by the expert opinion of members of the research team, engaged in data analysis and data science. Three members of the research team individually evaluated each dataset.
As a measure of inter-rater agreement among evaluators, Fleiss’ kappa metric was used. Fleiss’ kappa for the supply side among the three evaluators was 0.73 and that for demand by researcher/developer was 0.61. Both scores showed moderate agreement. The evaluators experienced the most problems in differentiating the evaluation of existing data, when the given data were not complete or not available.
Figure 9 and Figure 10 present the final outcomes of our research: analysis per category (supply and demand by developer/researcher) per city, dataset and average value.
Analysis of results was obtained using Tableau—a BI software program for data visualization. Figure 9 and Figure 10 are tree maps, obtained as average results for the categories of supply and demand by researcher/developer, for the three largest Croatian cities (Zagreb, Split, Rijeka). The scale used for evaluation is 1–5, with a middle score of 3. Colors are presented in five steps, indicating the average values, ranging from the lowest grade for NA data—dark red (1), light red (2), grey (3), and light green (4)—up to the highest grade, dark green (5).
Scores for the existing open datasets for the supply side are higher than for the demand by researcher/developer side, for each city. Only two datasets are above the average values: Zagreb—hospitals (3.51) and Rijeka—public transport (3.58). Two datasets scored below the average: Zagreb—car routes and Rijeka—bike routes. Moreover, datasets related to hospital specialization and parking for people with disabilities do not exist.
Figure 10 presents scores for the existing datasets for demand by researcher/developer. Results show the only scores of average values for Zagreb and Rijeka—bike routes, followed by car routes for Zagreb and Rijeka. All other datasets are not available for use by developers/researchers through suitable functionalities and standards.

5. Discussion

In this research, we created a new framework wherein categories and indicators from existing frameworks are complemented by new ones. We identified five categories in the assessment framework: supply side, demand by researcher/developer, demand side by end-user, legal aspects and impact side. The evaluation of publicly available datasets was performed for the categories of supply side and demand side by developer/researcher, which are related to existing open data. The other three categories (demand side by end-user, legal aspects and impact side) are related to the use of future online applications, which would be developed as an ecosystem. However, the development of such an application would require the addition of new data and improvement of existing data with regard to quality and quantity. In this framework, we identified two categories of demand, demand by researcher/developer and demand by end-user, which are to be developed with future applications. The aspect of the end-user represents the innovative element, which will enable the assessment of future applications through interaction with users, and thus enable constant improvement.
Average scores for all three cities are lower than average (3.0), showing that data are incomplete or partially available. For all three cities, there are no open data on the hospital specialization or parking for people with disabilities, which are types of data that could distinguish the future smart application. There are only a few datasets obtaining scores above the average grade; however, this does not mean that they are complete. Most of the datasets score around or below the average value of 3.0, especially in the category of demand by researcher/developer, showing that data are not available in the conditions necessary for the further development of the application. KPI scores show that that existing open datasets are not available in machine-readable formats and do not permit easy access. Many data do not exist in government portals and are not available in open standards. The non-discrimination aspect also scored lower than average, showing that there is no multilingual information or information on voice guidance; therefore, data are not available to all users under the same conditions.
In many cases, metadata do not exist or are described in such a way that does not meet the user’s needs, without information on the source, or how data were collected. Metadata are, in most cases, either inaccessible or insufficiently described for the user to be able to fully understand or use the selected datasets. Additionally, most of the datasets that have metadata show that they are not up to date. Therefore, although the datasets related to this research exist, the lack of completeness and the data updates represent the main problems. The only type of data that obtained the highest score was the usage cost, showing that the available data are free of charge.
Fleiss’ kappa showed low inter-rater agreement, with lower agreement for the demand side due to the low quantity and quality of existing data.
Although data were evaluated by only two categories (supply and demand by researcher/developer), all five categories of our proposed assessment framework are to be conceptually implemented in the ecosystem. This ecosystem is designed to improve over time through the feedback of users, which was the reason that we distinguished the categories of demand by researcher/developer and demand by-user. However, existing open datasets were not of sufficient quantity or quality to develop the smart application and to implement the “Hospital Access Framework” to its full potential.
Our research provides an insight into the accessibility of datasets deemed relevant for answering a single, very important, yet very specific societal questions related to hospital access. For other societal questions, the outcome of the assessment may be very different, since different datasets may be needed to answer such questions. However, we do believe that our inability to answer a very simple but highly relevant societal question is a clear indication of the supplier-driven data presence and the immature status of the Croatian open data ecosystem.
We focused on the existence of open data as a starting point to develop the data layer as part of the design of the application. The rest of the layers could be added in a future phase when the actual application begins to be developed.
Although the evaluation was performed on the specific datasets, the methodological framework proposed in this research might be applied for other cities and public institutions, aiming to evaluate the availability, quality, quantity and relevance of data. However, the evaluation of specific datasets may depend on expert evaluation or awareness of data relevance.

6. Conclusions

The central aim of this research was to assess available open data related to access to hospitals in the three largest Croatian cities (Zagreb, Split, Rijeka), which are the largest hospital centers in the country. The future aim is to create a new mobile, multilingual and voice-based application that would enable quick access to information on hospital access, relying on the principles of the open data ecosystem, that would improve over time. This digital service would be an ecosystem that can be used in everyday situations, complying with the principles of digital inclusion and a digital society. We achieve this by posing simple questions: “Where is the nearest specialized hospital of the specific type?”, “How can I get there?”, “Is parking available?”, “Is there parking for people with disabilities?”. To address these questions, we evaluated open data as the potential source for the development of a digital service that would provide answers to such questions in the three largest Croatian cities (Zagreb, Split and Rijeka), which are the largest hospital centers for domestic populations and tourists. Data analysis was performed for the following datasets: hospitals, hospital specialization, public transport (tram, bus), bike routes, car routes, parking, parking for people with disabilities.
The future aim is to create a new mobile, multilingual application that would enable quick access to information on hospital access and hospital specialization, relying on the principles of the open data ecosystem that would improve over time. In order to evaluate the new ecosystem, we proposed the new conceptual “Hospital Access Framework”, where basic indicators are complemented by end-user-driven indicators, which would be beneficial for decision makers to set priorities for releasing data as open data. In this way, the end-user aspect is included into the assessment.
The first specific aim was to identify and analyze portals and open datasets of selected categories for the three largest Croatian cities. The results show that existing open datasets related to hospital access in the three largest Croatian cities are scattered across different portals and not only on portals provided by the government, which is directly reflected in the categories of permanence and primacy. Permanence has a score of 2.09, related to the possibility to track changes over time, to metadata for previous versions of open data. Primacy has a score of 3.14, which is related to the existence of metadata in line with open standards, explanations of how derived data were calculated, information on the source and whether the dataset is provided from the original source, whether information is collected by the government or city government and details on how the data are collected.
The publicly available open data relevant to our question are incomplete, missing, not available in open data formats, not available for download and generally not of sufficient quality and quantity. Data are currently mainly available for download through APIs, sometimes given in cumulative form and not in open data format, and, often, there is no record of versions that are not stored in the same standard.
The second specific aim was to analyze existing frameworks and detect gaps in order to create a new open data ecosystem framework integrating the end-user perspective. Research shows that existing frameworks on open data are based on the supply side, more focused on the status of the components, lacking evaluation scales and not including an end-user-driven aspect, which would be crucial for the open data ecosystem. The ecosystem needs to include an interaction component, which we offer through the end-user aspect.
The third specific aim was to create a new framework, where existing criteria are complemented by new ones, resulting from our research. As a result, the new “Hospital Access Framework” is created as a conceptual ecosystem, including five categories: supply, demand by researcher/developer, demand by end-user, legal aspect and impact. In this framework, there are two types of demand categories: demand by researcher/developer, which uses open data for further research and development; and demand by end-user, which interacts with future innovations, developed on the bases of open data, e.g., smart mobile applications. In the framework, key performance indicators (KPIs) are developed using SMART criteria, together with evaluation scales.
To our knowledge, there is no framework integrating the end-user perspective while the impact category is not elaborated through an innovative perspective using SMART criteria. The new suggested framework, developed for the assessment of the open data ecosystem, includes five categories that integrate the end-user perspective with the feedback component, enabled through end-user interaction.
The fourth specific aim was to perform an analysis of selected open datasets for the three largest Croatian cities, acting as hospital centers, based on the created framework.
Analysis of selected open data was performed for the three Croatian cities, for the two categories of supply and demand by researcher/developer. The other three categories (demand by end-user, legal aspect and impact) will be used for the evaluation of the future smart application. Analysis of open data was performed for the following datasets: hospitals, hospital specialization, public transport (tram, bus), bike routes, car routes, parking, parking for people with disabilities.
Analysis shows that some open datasets are not available at all (hospital specialization, parking for people with disabilities) or not published in open formats (Zagreb—parking), as well as data related to non-discrimination (e.g., multilingual open data, voice guidance).
Scores for the existing open datasets for the supply side are higher than for the demand side, for each city; however, both are below average: supply (2.78) and demand by researcher/developer (2.57). Supply-side analysis shows that there are only two datasets having scores higher than average: Zagreb—hospitals (3.51) and Rijeka—public transport (3.58). There are two datasets that scored below the average: Zagreb—car routes (2.31) and Rijeka—bike routes (2.51). All other categories obtained scores around the average of 3.0. Datasets for hospital specialization and parking for people with disabilities are not available for any of the cities, and, therefore, not evaluated.
The category of demand by researcher/developer obtained a lower average score than the supply side. The results do not show datasets above the average score, and only two datasets are around the average score: Zagreb—bike routes (3.0) and Rijeka—bike routes (2.74). Meanwhile, all other categories are scored below average, around grade 2.0.
The results show that existing open data are missing, incomplete, non-existent (hospital specialization, parking for people with disabilities), not available in a suitable format for download, not of sufficient quality and quantity or insufficient for smart application development.
KPIs from the demand side include researchers/developers looking for data appropriate for further development. Some categories overlap with the supply side (checking existence), and some are considered in different ways (check of appropriateness). When the demand for the end-user is included, the whole demand side will be more complete.
The results of the process of data identification, acquisition and preparation show data resources as fragmented and heterogeneous, not available in open data formats or through APIs. They differ considerably by quality, completeness, quantity and, therefore, in the current state, are not sufficient for the development of new digital services or to enable digital inclusion on a non-discrimination basis.
Spatial open datasets differ in quality and quantity and are used for various types of scientific and practical research in order to be exploited for various purposes, such as, for example, online applications [45], 3D city modelling [46], for collaborative geological mapping [47], for investigating historical settlements and landscape analysis [48], to study the geographic educational paths of individuals or social groups [49], for building citizen science [50], analysis of air pollution [51], vehicular traffic [52], public green spaces [53], etc. Special attention is given to the comparative analysis of open data among cities in compliance with indicator standards in order to set up a common set of indicators [54], such as economy, education, energy, environment and climate change, finance, governance, health, housing, population and social conditions, recreation, safety, solid waste, sport and culture, telecommunications, transportation, urban/local agriculture and food security, urban planning, wastewater and water. The research [55] presents an evaluation model through citizens’ sustainable use of open data, with 12 indicators in four dimensions: data, platform, outcome and citizen. Although there has been a significant increase in interest in open data, there is still the problem of benchmarking the open data ecosystem. The authors of [12] propose a framework that assesses, through a holistic approach, the following components: open data supply, open data governance and open data user characteristics. This holistic framework estimates the maturity of the open data ecosystem, aiming to be a useful tool to indicate which aspects of the open data ecosystem are successful and which aspects require attention. The initial research shows that geographical data are higher than health data.
In this research, we have used a mixed methodological approach by combining theoretical and practical research. The theoretical research consisted of a review of existing frameworks for open data assessment, detailed analysis and the detection of gaps. The practical research included the identification of open data portals and existing datasets. The final outcome is the conceptual ecosystem model and new proposed framework, which are ideally aligned through practical implementation by data assessment, components of the conceptually created ecosystem and the ecosystem in future implementation, as a new digital service.
The development of digital services for the digital inclusion of citizens requires the involvement of all stakeholders (government, data providers, institutions, citizens, policymakers, etc.) for the creation of innovative solutions that will provide widespread benefits and follow moral and ethical principles. Digital transformation towards a digital society requires education on digital literacy, which includes the usage, retrieval and sharing of information and the use of digital services, education and proactive involvement of citizens, who represent the feedback component of the ecosystem, ensuring improvement in the circular cycle. The need for data harmonization and standardized data quality evaluation on web portals, benchmarking frameworks [56], design requirements of portals, datasets and usage statistics [57], can lead to data improvement, and thus unlock the potential for new solutions from entrepreneurs [58] but also from universities [59]. As stated in [45], the EU supports the integration of data and knowledge to create online services and resources relevant for businesses and end-users using open data. The standardization and harmonization of criteria will enable international comparative assessments through research and innovation up to entrepreneurial activities [28] in the current digital transition of societies.
The future challenge is to develop a multilingual and multimodal digital service based on improved and added data related to specific types of hospital access. Through the cooperation of public and private stakeholders, the development of the new open data ecosystem will be achieved in the form of a sustainable mobile application that will include end-user-driven interaction and will be used in everyday situations as part of the concept of the “digital society”.

Author Contributions

Conceptualization, S.S., B.v.L., F.W.D. and C.A.; methodology, S.S., M.V., Z.N., L.D., M.G. and I.C.; formal analysis, M.V.; project administration, S.S.; investigation, S.S., M.V., Z.N., L.D., M.G. and I.C.; writing—original draft preparation, S.S., Z.N., L.D., M.G., I.C., K.K., B.v.L. and F.W.D.; writing—review and editing, S.S., M.V., Z.N., L.D., M.G., I.C., B.v.L. and F.W.D.; visualization, Z.N. and I.C.; supervision, B.v.L., F.W.D. and C.A. All authors have read and agreed to the published version of the manuscript.

Funding

This research and the APC was funded by the Twinning Open Data Operational project that has received funding from the European Union’s Horizon 2020 research and innovation program under grant agreement no. 857592. The APC was partly funded by the institutional project of the Faculty of Humanities and Social Sciences Zagreb, grant by the University of Zagreb no. 11-931-1072.

Institutional Review Board Statement

Not applicable.

Informed Consent Statement

Not applicable.

Data Availability Statement

Not applicable.

Acknowledgments

This research is part of the Twinning Open Data Operational project that has received funding from the European Union’s Horizon 2020 research and innovation program under grant agreement no. 857592. This research is part of the institutional project of the Faculty of Humanities and Social Sciences Zagreb, grant by the University of Zagreb, no. 11-931-1072.

Conflicts of Interest

The authors declare no conflict of interest.

Appendix A

Table A1. Summary of Zagreb findings.
Open Data Portal of ZagrebZG GeoportalPublic City Transport—ZET
HOSPITALSHospital layer:
addresses, longitude and latitude (WGS84), contacts
Download available in XLS
CSV
Health layer: Croatian Health Insurance Fund, Health Centers, Emergency, Pharmacies, Duty Pharmacies and Health InstitutionsView only + WMS service--
PUBLIC
TRANSPORT
--Transport layer: tram stations, bus stations, railway stationsView only + WMS serviceNetwork of bus and tram lines,
map of bus and tram stations
Download available in PDF format
BICYCLE
PATH
Infrastructure layer: bicycle paths—length, coordinates of path midpointDownload available in XLS
CSV
Transport layer: bicycle paths and bicycle garagesView only + WMS service--
TRAFFIC
ROADS
--Transport layer: roadsView only + WMS service--
OTHER RELEVANT DATASETS--Public garages, pedestrian zones, taxi stands, gas stationsView only + WMS service--
Table A2. Summary of Split findings.
Grad Split HubPromet Split
HOSPITALSHealthcare facilities: geolocation, address, type of facility, contactView only on a map--
PUBLIC
TRANSPORT
--Bus linesDownload available in PDF
BICYCLE
PATH
Bicycle station: geolocation, type, number of lots, purposeView only on a map--
TRAFFIC
ROADS
----
OTHER RELEVANT DATASETSGarages and parking lots: geolocation, type, number of lots, purposeView only on a map--
Table A3. Summary of Rijeka findings.
GIS Browser City of RijekaNational Open Data PortalRijeka Promet d.d.BikeRijeka
HOSPITALS-Health Insurance Institute—list of institutionsDownload available in XLS and CSV----
PUBLIC
TRANSPORT
---Bus lines and stationsBus lines and stations--
BICYCLE
PATH
-----Paths on mapView on a downloadable mobile app
TRAFFIC
ROADS
-------
OTHER RELEVANT DATASETS---Parking lots, garagesParking lots, garages--

References

  1. Rajabifard, A.; Feeney, M.-E.F.; Williamson, I.P.; Masser, I. National SDI Initiatives. In Developing Spatial Data Infrastructures: From Concept to Reality, 1st ed.; Williamson, I., Rajabifard, A., Feemey, M.-E.F., Eds.; CRC Press: London, UK, 2003; pp. 95–110. [Google Scholar]
  2. Masser, I. All shapes and sizes: The first generation of national spatial data infrastructure. Int. J. Geogr. Sci. 1999, 3, 67–84. [Google Scholar] [CrossRef]
  3. Vancauwenberghe, G.; Valeckaite, K.; van Loenen, B.; Welle Donker, F. Assessing the Openness of Spatial Data Infrastructures (SDI): Towards a Map of Open SDI. Int. J. Spat. Data Infrastruct. Res. 2018, 13, 88–100. [Google Scholar]
  4. Mensah, E.; Goderre, J.L. Data Sources and Data Tools: Preparing for the Open Data Ecosystem. In Public Health Informatics and Information Systems, 1st ed.; Magnuson, J.A., Dixon, B.E., Eds.; Springer: Cham, Switzerland, 2020; Volume 3, pp. 105–127. [Google Scholar]
  5. Van Knippenberg, L. Open Data Maturity. Report 2020; Publications Office of the European Union: Luxembourg, 2020; pp. 11–85. [Google Scholar]
  6. Capgemini Consulting, Data.europa.eu. Open Data Maturity in Europe 2021. Available online: https://www.capgemini.com/insights/research-library/open-data-maturity-report-2021/ (accessed on 17 August 2022).
  7. European Council. Digital Services Package. Available online: https://www.consilium.europa.eu/en/policies/digital-services-package/ (accessed on 3 March 2022).
  8. Seljan, S.; Miloloža, I.; Pejic Bach, M. e-Government in European Countries: Gender and Ageing Digital Divide. In Proceedings of the Interdisciplinary Management Research Conference XVI, Opatija, Croatia, 7–9 May 2020. [Google Scholar]
  9. Pejić Bach, M.; Seljan, S.; Zoroja, J.; Buljan, A.; Cafuta, B. Hospital websites as a road to transparency: Case study of transition countries. In Proceedings of the International Conference Knowledge and Business Challenge of Globalization in 2017, Celje, Slovenia, 17 November 2017. [Google Scholar]
  10. Pejić Bach, M.; Seljan, S.; Jaković, B.; Buljan, A.; Zoroja, J. Hospital Websites: From the Information Repository to Interactive Channel. Procedia Comput. Sci. 2019, 164, 64–71. [Google Scholar] [CrossRef]
  11. Seljan, S.; Baretić, M.; Seljan, M.; Pejić Bach, M. Information assessment of hospital websites in Croatia: How to develop accountability standards? Int. J. Health Plan. Manag. 2020, 35, 970–971. [Google Scholar] [CrossRef]
  12. Welle Donker, F.; van Loenen, B. How to assess the success of the open data ecosystem? Int. J. Digit. Earth New J. New Vis. 2017, 10, 284–306. [Google Scholar] [CrossRef]
  13. Dodds, L.; Newman, A. A Guide to the Open Data Maturity Model. Assessing Your Open Data Publishing and Use. Open Data Institute. Available online: https://theodi.org/article/open-data-maturity-model-2/ (accessed on 3 March 2022).
  14. IRM (Independent Reporting Mechanism). Aligning Supply and Demand for Better Governance: Open Data in the Open Government Partnership. Available online: https://www.opengovpartnership.org/stories/aligning-supply-and-demand-for-better-governance-open-data-in-the-open-government-partnership/ (accessed on 9 March 2022).
  15. World Wide Web Foundation. Open Data Barometer Global Report. 2nd Ed. Available online: https://opendatabarometer.org/2ndEdition/ (accessed on 9 March 2022).
  16. Open Knowledge International. “Global Open Data Index”. Available online: https://index.okfn.org/ (accessed on 9 March 2022).
  17. Harrison, T.M.; Pardo, T.A.; Cook, M. Creating Open Government Ecosystems: A Research and Development Agenda. Future Internet 2012, 4, 900–928. [Google Scholar] [CrossRef]
  18. Zuiderwijk, A.; Janssen, M.; Davis, C. Innovation with open data: Essential elements of open data ecosystems. Inf. Polity 2014, 19, 17–33. [Google Scholar] [CrossRef]
  19. Davies, T. Open Data: Infrastructures and ecosystems. Open Data Res. 2001, 1–6. [Google Scholar]
  20. Rajabifard, A.; Mansourian, A.; Williamson, I.P.; Valadan Zoej, M.J. Developing Spatial Data Infrastructure to Facilitate Disaster Management. In Proceedings of the Geomatics’83 Conference, Teheran, Iran, 9–12 May 2004. [Google Scholar]
  21. Jaeger, P.; Bertot, J. Transparency and Technological Change: Ensuring Equal and Sustained Public Access to Government Information. Gov. Inf. Q. 2010, 27, 371–376. [Google Scholar] [CrossRef]
  22. Lee, D.; Derilinx. Discovering Open Data Standards. Available online: https://www.w3.org/2016/11/sdsvoc/SDSVoc16_paper_29 (accessed on 9 March 2022).
  23. Van Loenen, B.; Vancauwenberghe, G.; Crompvoets, J.; Dalla Corte, L. Open Data Exposed. In Information Technology and Law Series; Van Loenen, B., Vancauwenberghe, G., Crompvoets, J., Eds.; Springer: Berlin/Heidelberg, Germany, 2018; Volume 30, pp. 1–30. [Google Scholar]
  24. Poikola, A.; Kola, P.; Hintikka, K.A. Public Data an Introduction to Opening Information Resources. Handbook by Ministry of Transport and Communications, Helsinki. 2010. Available online: https://julkaisut.valtioneuvosto.fi/bitstream/handle/10024/78201/Public_data_-_an_introduction_to_opening_information_resources.pdf?sequence=1 (accessed on 9 March 2022).
  25. Martin, S.; Turki, S.; Renault, S. Open Data Ecosystems. In Electronic Government and the Information Systems Perspective; Kő, A., Francesconi, E., Eds.; Springer: Cham, Switzerland, 2015; Volume 10441, pp. 49–63. [Google Scholar]
  26. Frontier Economics. Increasing Access to Data across the Economy. A Report Prepared for the Department for Digital, Culture, Media and Sport. Available online: https://assets.publishing.service.gov.uk/government/uploads/system/uploads/attachment_data/file/974532/Frontier-access_to_data_report-26-03-2021.pdf (accessed on 9 March 2022).
  27. Zheng, L.; Kwok, W.M.; Aquaro, V.; Qi, X.; Lyu, W. Evaluating global open government data: Methods and status. In Proceedings of the 13th International Conference on Theory and Practice of Electronic Governance, Tokyo, Japan, 23–25 September 2020. [Google Scholar]
  28. Kamariotou, M.; Kitsios, F. Bringing Digital Innovation Strategies and Entrepreneurship: The Business Model Canvas in Open Data Ecosystem and Startups. Future Internet 2022, 14, 127. [Google Scholar] [CrossRef]
  29. Alexopoulos, C.; Loukis, E.; Mouzakitis, S.; Petychakis, M.; Charalabidis, Y. Analysing the Characteristics of Open Government Data Sources in Greece. J. Knowl. Econ. 2018, 9, 721–753. [Google Scholar] [CrossRef]
  30. Žuffova, M. Governing by Rankings: How the Global Open Data Index Helps Advance the Open Data Agenda. Available online: https://papers.ssrn.com/sol3/papers.cfm?abstract_id=3081521 (accessed on 3 March 2022).
  31. Hollanders, H.; Es-Sadki, N. European Innovation Scoreboard 2021; Publications Office of the European Union: Luxembourg, 2021. [Google Scholar]
  32. Attard, J.; Orlandi, F.; Scerri, S.; Auer, S. A systematic review of open government data initiatives. Gov. Inf. Q. 2015, 32, 399–418. [Google Scholar] [CrossRef]
  33. Van Ooijen, C.; da Silva Carvalho, N.; Iordache, A.; Osimo, D. Measuring Data Demand within the Public Sector; The Lisbon Council as Part of Data.europe.eu; Publications Office of the European Union: Luxembourg, 2022; Available online: https://data.europa.eu/sites/default/files/report/Discussion_Paper_Measuring_Data_Demand_Within_the_Public_Sector.pdf (accessed on 3 May 2022).
  34. Zagreb Open Data Portal. Available online: http://data.zagreb.hr/ (accessed on 6 March 2022).
  35. Geoportal of Zagreb (Zagreb Spatial Data Infrastructure). Available online: https://geoportal.zagreb.hr/ (accessed on 6 March 2022).
  36. Zagreb Electric Tram. Public Transport of City of Zagreb. Available online: https://www.zet.hr/en (accessed on 6 March 2022).
  37. Grad Split Hub. Available online: https://hub-gradsplit.hub.arcgis.com/ (accessed on 6 March 2022).
  38. Promet Split. Public Transport of City of Split. Available online: https://www.promet-split.hr/ (accessed on 6 March 2022).
  39. Open Data Portal of City Rijeka. Available online: http://data.rijeka.hr/ (accessed on 6 March 2022).
  40. Rijeka Promet. Public Transport of City of Rijeka. Available online: https://www.autotrolej.hr/en/ (accessed on 6 March 2022).
  41. BikeRijeka. Bike Paths of Rijeka and Surrounding. Available online: https://bikerijeka.com/ (accessed on 6 March 2022).
  42. Central Bureau of Statistics of the Republic of Croatia 2021 Census. Available online: https://popis2021.hr/ (accessed on 6 March 2022).
  43. Croatian Health Insurance Fund. Available online: https://hzzo.hr/en (accessed on 6 March 2022).
  44. Open Data Portal of Republic of Croatia. Available online: https://data.gov.hr/ckan/organization/hrvatski-zavod-za-zdravstveno-osiguranje (accessed on 6 March 2022).
  45. Apicella, L.; De Martino, M.; Quarati, A. Copernicus User Uptake: From Data to Applications. ISPRS Int. J. Geo-Inf. 2022, 11, 121. [Google Scholar] [CrossRef]
  46. Shirinyan, E.; Petrova-Antonova, D. Modeling Buildings in CityGML LOD1: Building Parts, Terrain Intersection Curve, and Address Features. ISPRS Int. J. Geo-Inf. 2022, 11, 166. [Google Scholar] [CrossRef]
  47. Gencarelli, C.N.; Voltolina, D.; Hammouti, M.; Zazzeri, M.; Sterlacchini, S. Geospatial Information Technologies for Mobile Collaborative Geological Mapping: The Italian CARG Project Case Study. ISPRS Int. J. Geo-Inf. 2022, 11, 192. [Google Scholar] [CrossRef]
  48. Herold, H.; Behnisch, M.; Hecht, R.; Leyk, S. Geospatial Modeling Approaches to Historical Settlement and Landscape Analysis. ISPRS Int. J. Geo-Inf. 2022, 11, 75. [Google Scholar] [CrossRef]
  49. Jażdżewska, I.A.; Lechowski, Ł.; Babuca, D. GIS-Based Approach for the Analysis of Geographical Education Paths. ISPRS Int. J. Geo-Inf. 2022, 11, 41. [Google Scholar] [CrossRef]
  50. Kocaman, S.; Saran, S.; Durmaz, M.; Kumar, S. Editorial on the Citizen Science and Geospatial Capacity Building. ISPRS Int. J. Geo-Inf. 2021, 10, 741. [Google Scholar] [CrossRef]
  51. Ibrahim, S.; Landa, M.; Pešek, O.; Brodský, L.; Halounová, L. Machine Learning-Based Approach Using Open Data to Estimate PM2.5 over Europe. Remote Sens. 2022, 14, 3392. [Google Scholar] [CrossRef]
  52. Reche, C.; Tobias, A.; Viana, M. Vehicular Traffic in Urban Areas: Health Burden and Influence of Sustainable Urban Planning and Mobility. Atmosphere 2022, 13, 598. [Google Scholar] [CrossRef]
  53. Hsu, Y.-Y.; Hawken, S.; Sepasgozar, S.; Lin, Z.-H. Beyond the Backyard: GIS Analysis of Public Green Space Accessibility in Australian Metropolitan Areas. Sustainability 2022, 14, 4694. [Google Scholar] [CrossRef]
  54. Takiya, H.; Negreiros, I.; Yamamura, C.L.K.; Quintanilha, J.A.; Machado, C.A.S.; Abiko, A.; Campos, C.I.d.; Pessoa, M.S.d.P.; Berssaneti, F.T. Application of Open Government Data to Sustainable City Indicators: A Megacity Case Study. Sustainability 2022, 14, 8802. [Google Scholar] [CrossRef]
  55. Zhang, W.; Jiang, H.; Shao, Q.; Shao, T. Construction of the Evaluation Model of Open Government Data Platform: From the Perspective of Citizens’ Sustainable Use. Sustainability 2022, 14, 1415. [Google Scholar] [CrossRef]
  56. Máchová, R.; Lněnička, M. Evaluating the Quality of Open Data Portals on the National Level. J. Theor. Appl. Electron. Commer. Res. 2017, 12, 21–41. [Google Scholar] [CrossRef]
  57. Rodosthenous, C.; Michail, D. Enabling Publishing and Reuse of Government Data Through the Republic of Cyprus Open Data Portal. In MTSR 2021: Metadata and Semantic Research; Communications in Computer and Information Science; Garoufallou, E., Ovalle-Perandones, M.A., Vlachidis, A., Eds.; Springer: Cham, Switzerland, 2022; Volume 1537. [Google Scholar] [CrossRef]
  58. Grzenda, M.; Legierski, J. Towards Increased Understanding of Open Data Use for Software Development. Inf. Syst. Front. 2021, 23, 495–513. [Google Scholar] [CrossRef]
  59. Tzitzikas, Y.; Pitikakis, M.; Giakoumis, G.; Varouha, K.; Karkanaki, E. How Can a University Take Its First Steps in Open Data? In MTSR 2020: Metadata and Semantic Research; Communications in Computer and Information Science; Garoufallou, E., Ovalle-Perandones, M.A., Eds.; Springer: Cham, Switzerland, 2021; Volume 1355. [Google Scholar] [CrossRef]
Figure 1. Open data assessment frameworks mapped on the components of an open data ecosystem [12].
Sustainability 14 12014 g001
Figure 2. Research flow chart.
Sustainability 14 12014 g002
Figure 3. Evaluation model based on the ecosystem approach.
Sustainability 14 12014 g003
Figure 4. (a) Available datasets. (b) Types of NA datasets.
Sustainability 14 12014 g004
Figure 5. (a) Average scores per city. (b) Average scores per category.
Sustainability 14 12014 g005
Figure 6. (a) Average scores per city and category. (b) Average scores per type of dataset.
Sustainability 14 12014 g006
Figure 7. (a) KPIs for category of supply. (b) KPIs for demand by developer/researcher.
Sustainability 14 12014 g007
Figure 8. (a,b) Spider diagram of the supply side (a) and demand by researcher/developer (b) assessment of the open data ecosystems of Zagreb, Rijeka and Split.
Sustainability 14 12014 g008
Figure 9. Average scores for supply assessment for city (ZG = Zagreb, ST = Split, RI = Rijeka), category supply for datasets (hospitals, hospital specialization, public transport, bike route, car route, parking, parking for people with disabilities) on the scale of 1–5.
Sustainability 14 12014 g009
Figure 10. Averge scores for demand-by-researcher/developer for city (ZG = Zagreb, ST = Split, RI = Rijeka), for category for datasets (hospitals, hospital specialization, public transport, bike route, car route, parking, parking for people with disabilities) on the scale of 1–5.
Sustainability 14 12014 g010
Table 1. Developed assessment framework to assess the accessibility of hospitals in Croatia.
DomainsKey Performance
Indicators (KPIs)
DescriptionScale
Supply side of evaluation
Open data cross-domain quality
CompletenessCan the data be found?1—No, 5—Yes
Are these data available online in a data portal?1—No, 5—Yes
Are these data complete for our purpose?1—No, 3—Partially, 5—Yes
Do datasets have metadata in line with the commonly accepted standards? (OGC, DCAT, etc.)1—No, 3—Partially, 5—Yes
Are the metadata complete (at least mandatory fields are provided)?1—No, 3—Partially, 5—Yes
Identifiable details on how the data were collected?1—No, 3—Unknown, 5—Yes
TimelinessAre the data up to date?1—No, 3—Partially (dynamic data are lagging), 5—Yes
Ease of Physical and Electronic AccessIs it possible to access the data in electronic form (e.g., on the web)?1—No, 5—Yes
Can data be filtered and downloaded through API—application programming interface?1—No, 3—Partially, 5—Yes.Answer yes if it is possible to access individual records; answer partially if it is possible to export only extracts of the particular data; answer no if there are only bulk downloads or APIs providing access to the whole dataset
Can data be fully downloaded through API?1—No, 3—Partially, 5—Yes.Answer no if it is only possible to access individual records; answer partially if it is possible to export extracts of the data; answer yes if there are bulk downloads or APIs providing access to the whole dataset
There are accessible and open official tools available to help users locate and explore individual records.1—No, 3—Partially, 5—Yes.Answer ‘partially’ if tools make it possible to access extracts of data without having to download a full dataset. Answer ‘yes’ if there is an interactive tool that displays user-filtered extracts of the data to answer simple questions without downloading data at all.
Machine processabilityData are provided in open machine-processable format(s).1—No, 3—Partially, 5—Yes.Type of machine-processable format(s): XML, RSS feed, CSV, RDF, JSON, TXT, XLS(S), KML
Non-discriminationIs registration or membership required for accessing the data?1—Yes (a registration is required only for member users), 2—Yes (no memberships are required), 3—Yes (one can register with any credentials), 5—No
Is the dataset available free of charge?1—No, 5—Yes
Are data multilingual?1—No (only native), 3—Native and 1 more lang. 5—3 or more languages
Is there an option for voice guidance?1—No, 5—Yes
Are data provided in multiple appropriate formats?1—No, 5—Yes
Use of Commonly Owned or Open StandardsAre the data available in a format that supports visualization?1—No, 5—Yes
LicensingIs the dataset licensed with an open license?1—No, 5—Yes
PermanenceAre data available online via the national open data catalogue service open.data.gov?1—No, 5—Yes
Are data available online in other data portals?1—No, 5—Yes
Demand side of evaluation
Developer/
researcher
TimelinessAre the data up to date according to our purpose?1—No, 3—Partially (update frequency does not fit our purpose), 5—Yes
Machine processabilityData provided in a machine-processable format(s) fit for our purpose.1—No, 3—Partially (yes, but not fitting our purpose), 5—Yes
LicensingDoes the license allow for usage fitting our purpose?1—No, there is no license available, 3—Some limitations, 5—Yes
FeedbackWhat are feedback options for developers to communicate with the provider?1— No opportunities, 2—Contact information exists (email, telephone number) exists 3—Yes, we receive a generic email, 4—Yes, asynchronous communication (forum exists), 5—Yes, synchronous interactive communication
Ease of Physical and Electronic AccessCan data be filtered and downloaded through API—application programming interface?1—No, 3—Partially, 5—Yes.Answer yes if it is possible to access individual records; answer partially if it is possible to export only extracts of the particular data; answer no if there are only bulk downloads or APIs providing access to the whole dataset
Can data be fully downloaded through API?1—No, 3—Partially, 5—Yes.Answer no if it is only possible to access individual records; answer partially if it is possible to export extracts of the data; answer yes if there are bulk downloads or APIs providing access to the whole dataset
Table 2. Overview of the available infrastructure to answer the research question.
CityZagrebSplitRijeka
Population 1
(City)
777,183151,790109,775
Urban 1
agglomeration
1,086,528325,407188,797
Hospitals 2Total: 217
Primary level: 190
Secondary level: 13
Tertiary level: 14
Total: 25
Primary level: 20
Secondary level: 3
Tertiary level: 2
Total: 7
Primary level: 3
Secondary level:3
Tertiary level: 1
Public
Transport
Railway: 29 lines
Tram: 17 lines for day and 4 lines for night
Bus: 177 day lines and 4 night bus lines
Railway: one line
Bus: 20 day and 3 night city lines, and 30 intercity bus lines
Bus: 19 city lines and 33 intercity bus lines
Data portalsZagreb Open Data Portal [34]
ZG Geoportal [35]
Zagrebački električni tramvaj [36]
Split Spatial Data Portal [37]
Promet d. o.o. Split [38]
Rijeka Open Data Portal [39]
Rijeka Promet d.d. [40]
BikeRijeka Portal [41]
1 Data on the population were taken from the Central Bureau of Statistics of the Republic of Croatia and refer to the census conducted in 2021 [42]. 2 Data on healthcare institutions were taken from the official website of the Croatian Health Insurance Institute [43].
Table 3. Overview of available datasets for the three selected cities.
Type of Data/CityHospitalsPublic TransportBicycle PathsRoads
Available for ReuseCommentAvailable for ReuseCommentAvailable for ReuseCommentAvailable for ReuseComment
ZAGREBYesXLS/CSVYesPDF formatYesXLS/CSVYesWMS
SPLITYesView only on the mapYesPDF formatNoOnly OSMNoOnly OSM
RIJEKANoOnly on National PortalYesPDF formatYesView only on the mapNoOnly OSM
Publisher’s Note: MDPI stays neutral with regard to jurisdictional claims in published maps and institutional affiliations.

