Article

Human Activities Aggravate VOC Pollution in the Huangshui River of the Tibetan Plateau

1
State Key Laboratory of Plateau Ecology and Agriculture, College of Eco-Environmental Engineering, Qinghai University, Xining 810016, China
2
Donghu Experimental Station of Lake Ecosystems, Institute of Hydrobiology, Chinese Academy of Sciences, Wuhan 430072, China
*
Author to whom correspondence should be addressed.
Sustainability 2022, 14(19), 11983; https://doi.org/10.3390/su141911983
Submission received: 15 July 2022 / Revised: 7 September 2022 / Accepted: 19 September 2022 / Published: 22 September 2022
(This article belongs to the Special Issue Wetlands: Conservation, Management, Restoration and Policy)

Abstract

:
Many xenobiotic compounds can threaten human health and natural ecosystems. The ability to predict the level of human activities and identify major impact factors is crucial for the design of pollutant risk-reduction plans. In this study, a total of 25 volatile organic compounds (VOCs) including eight alkenes, six alkanes, and eleven aromatics were identified at 11 monitoring locations along the Huangshui River of the Tibetan Plateau. GC-MS analysis was applied to detect the concentrations of the VOCs. The results showed that the alkene, alkane, and aromatic concentrations in the sediment were significantly higher than in the water in all seasons (p < 0.001). The VOC concentrations in summer were significantly higher than in spring and winter (p < 0.01). In addition, several VOCs were found to surpass the national standard, i.e., bromoform reached 312.43 μg/L in water during the summer (the national standard is 100 μg/L), carbon tetrachloride was 209.58 μg/L (the national standard is 2 μg/L), and vinyl chloride was 10.99 μg/L (the national standard is 5 μg/L), which were all related to human activities. Principal component analysis (PCA) was used to comprehensively evaluate the water quality and the VOCs. The total organic carbon (TOC) was found to be responsible for the presence of the VOCs in the river, accounting for 77.93%, 81.97%, and 82.13% of the total variance in the datasets in spring, summer, and winter, respectively.

1. Introduction

Many volatile organic compounds (VOCs) can cause an abnormal taste and odor of water and fish [1,2], which lead customers to complain about and question the safety of the water and fish [3]. Except for biogenic sources [4,5], many VOCs in water are emitted by human activities, such as chemical manufacturing, organochlorine pesticides, leakage of petroleum, domestic waste from daily life, etc. [4,5]. These artificial VOCs usually include non-methane hydrocarbons, chlorinated hydrocarbons, oxygenated volatile organic compounds, benzene, toluene, ethylbenzene, and the different xylene isomers [6,7]. Due to their low odorant olfactory thresholds, stable chemical structures, and potential ecological risks, these artificial VOCs have been the subject of intense research.
In the water system, VOCs migrate between the water body and the sediment and become a persistent source of pollution, which not only harms the water quality but also poses serious health risks to humans and aquatic organisms [8]. For example, VOC emissions are often found in eutrophic lakes and are an important contamination factor in water pollution [9]. In rivers, VOCs strongly affect humans and aquatic organisms, such as 1,2-dichloropropane, which is used as a soil fumigant and industrial solvent, the most frequently detected type [7]. Methylene chloride, another VOC, also contaminates drinking water systems by pyrolysis and smoke intrusion from depressurization, which may be generated from the dehalogenation of disinfection byproducts stagnating in galvanized iron pipes [10].
To summarize, these artificial VOCs, as industrial byproducts, have been detected in ponds, lakes, reservoirs, rivers, and oceans, which further harm drinking water, aquatic products, and ecosystems. Therefore, artificial VOC pollution in water is inseparable from the intensity of human activities. As human activities began to thrive on the Qinghai Tibetan Plateau, this VOC pollution should have attracted attention. However, the artificial VOC pollution on the Tibetan Plateau has rarely been studied, and the details of the artificial VOC concentrations and sources are scarce, even though such findings are critical for pollution control and legislation. As we know, the Tibetan Plateau has important water systems [11]. The Huangshui River is situated in the climatically vulnerable semiarid zone of the northeastern Tibetan Plateau in Xining city, the provincial capital of Qinghai. As a major tributary of the Yellow River’s upper reach, the Huangshui River flows through Xining city and has been severely polluted in the past due to rapid socioeconomic development and the discharge of domestic sewage. Thus, the Huangshui River is a typical river in which to study the artificial VOC pollution caused by human activities on the Tibetan Plateau. The goals of this study were to determine: (1) the main species of artificial VOCs in the river on the Tibetan Plateau, (2) the spatial and temporal fluctuations of the VOCs throughout the seasons, and (3) the major environmental factors affecting the artificial VOCs in the river on the Tibetan Plateau.

2. Materials and Methods
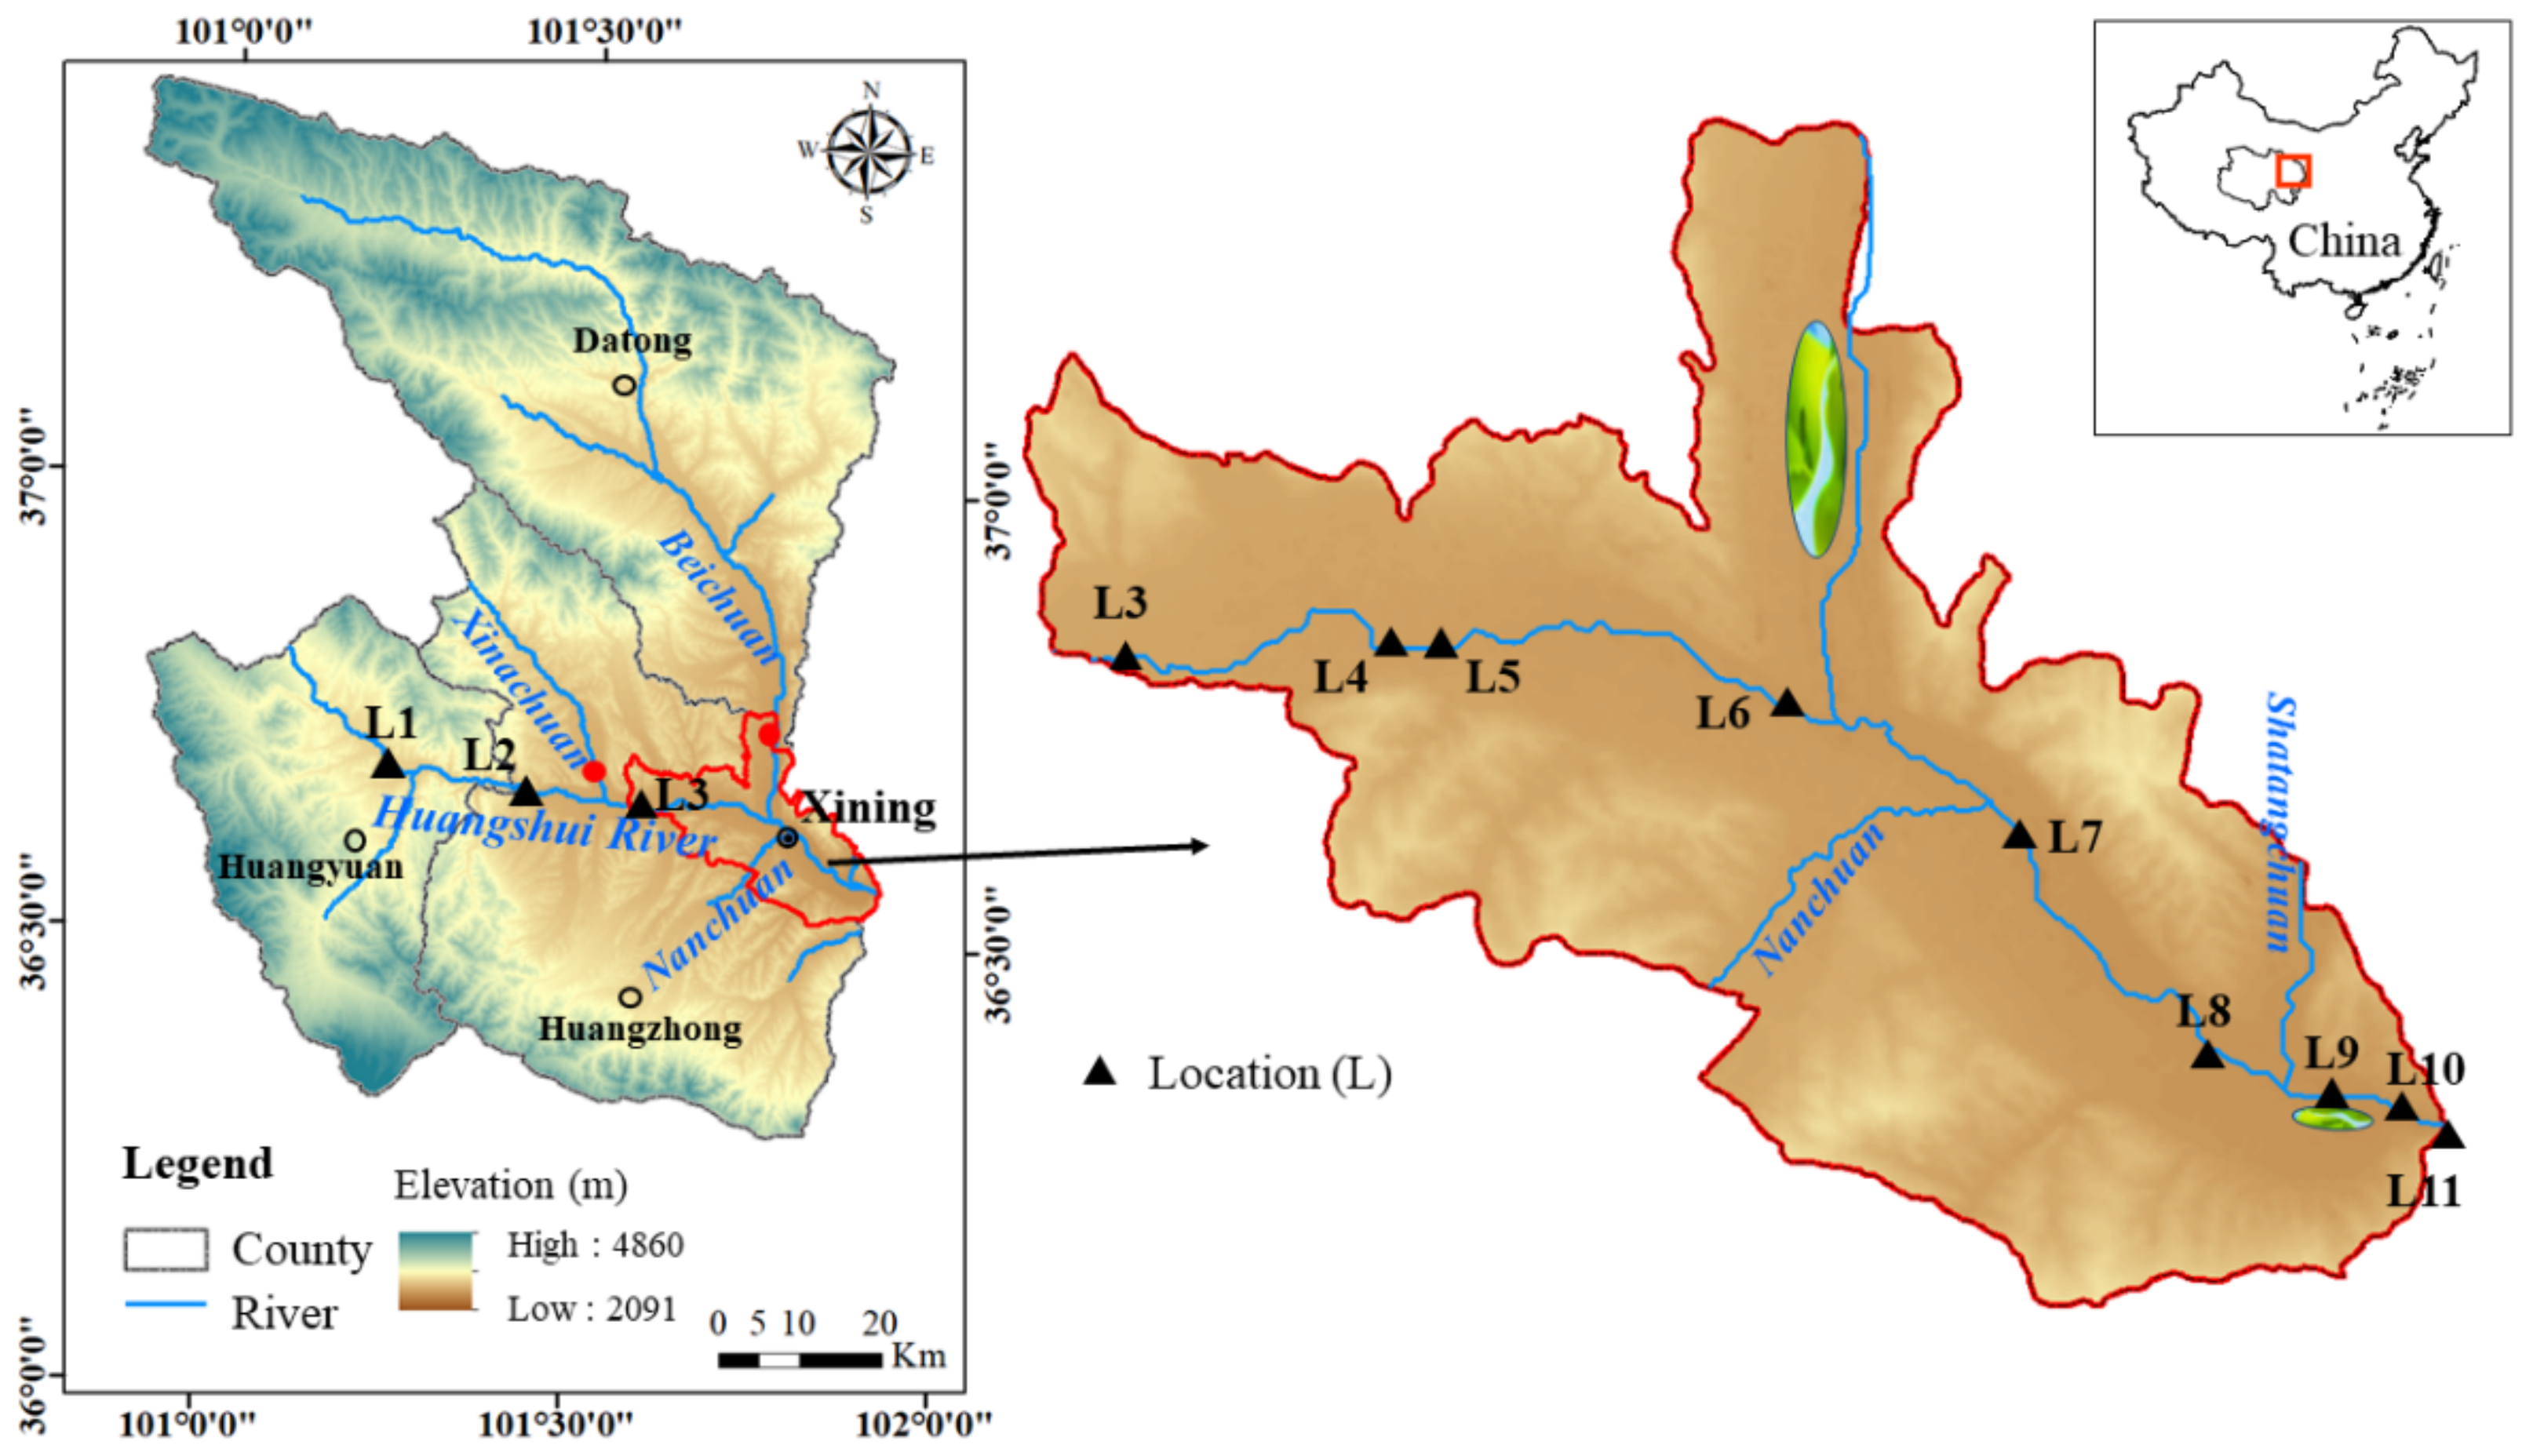
2.1. Sampling Sites

The Huangshui River flows through Xining city. Its source is the Baohutu Mountain in Haiyan County, Qinghai Province, and the entire basin spans an area of 17,733 km2 between the longitudes 100°42′ to 103°01′ and latitudes 36°02′ to 37°28′. From upstream to downstream along the river, paired water and sediment samples were collected during the spring (April), summer (August), and winter (November) of 2020 at 11 monitoring locations (L1 to L11, Figure 1), and the information about the sampling sites is provided in Table S1 (Supplementary Materials).

2.2. Sample Processing

The water samples were collected by hydrophore (1 L) from the middle of the river and slowly poured into brown 40-mL purge and trap bottles that were pre-treated with four drops of 6 mol/L hydrochloric acid. Sediment samples were obtained by a UWITEC sediment corer from the bottom of the river and accurately weighed to 10.00 milligrams using the same type of bottles. All samples were transferred from the purge and trap autosampler (CDS-7000E, CDS Analytical LLC, Oxford, PA, USA) to the instrument for GC-MS analysis (GC-MS-QP2020, Shimadzu, Japan). The purge and trap technique and GC-MS detected method were used following Cheng [12]. Twenty-five VOCs were separated on the column (60 m × 0.25 mm × 1 μm, InertCap AQUATIC, Japan) and detected using electron ionization and selected ion monitor modes (SIM). Standard and duplicate samples were used to check the accuracy of the analysis. The concentrations of total organic carbon (TOC), NH4+-N, NO3-N, NO2-N, and total phosphorus (TP) were common hydrochemical parameters [13], determined according to our previous studies [14].

2.3. Statistical Analysis

In order to evaluate the VOC levels in different sources and identify their distribution, the water quality datasets were further analyzed with different multivariate statistical techniques to explore their spatial trends and source apportionments. This study used one-way ANOVA for VOC analysis with SPSS version 25.0. The statistical significance level (alpha level) was set at 0.05. PCA (Principal Component Analysis) was carried out with CANOCO (version 5).

3. Results and Discussion

3.1. Comparisons of VOCs

The 25 volatile organic compounds (VOCs) were classified into three groups: eight alkenes, six alkanes, and eleven aromatics. The comparison of the VOC concentrations in the water and sediment samples is shown in Table 1. The average concentrations of alkenes in the sediment were 2.45, 648.50, and 23.96 μg/g in the spring, summer, and winter, respectively, which were all higher than the paired water samples (p < 0.001). The average concentrations of alkanes in the sediment were 31.23, 13,052.27, and 28.37 μg/g, which were all higher than the corresponding water samples (p < 0.001). The aromatic contents in the sediment were 7.54, 1372.73, and 60.47 μg/g, respectively, which were 5.8, 15.4, and 11.3 times higher than the corresponding water samples. Liu‘s research showed that higher concentrations of VOCs were detected in the surface water than in the sediment, because pollutants with relatively higher boiling points and lower solubilities have higher detection frequencies in sediment [15]. However, in our study, the ratio of the concentrations of the total VOCs (TVOCs) in the sediment and in the water was greater than 7.7, 50.7, 10.2 in spring, summer, and winter, respectively. Large amounts of VOCs were deposited in the sediment and continuously released into the water as the temperature rose. Asma suggested that the flux changes of VOCs under dynamic temperatures could be increased by the volatilization–dissolution interactions of VOCs with water and affect soil VOC emissions [16], which was coincident with our results. The Tibetan Plateau has the lowest summer temperature in China, a cooler summer ushers in a large increase in tourism and industrial production, leading to a significant increase in VOCs’ release. We hypothesize that human activities aggravate VOC pollution in the Huangshui River during the summer, and the VOCs could be deposited in the sediment and not easily volatilized because of the distinctive geography and lower temperatures of the Tibetan Plateau.
There is no national standard for VOC detection in sediment; the high concentration of VOCs in the sediment combined with our previous research on antibiotic contamination in the Huangshui River suggest that this area is a typical urban river on the Tibetan Plateau and requires long-term monitoring [14]. We worry that excessive levels of VOC deposition could threaten aquatic organisms and have lasting ecological implications due to the health risks of VOCs and other contaminants.

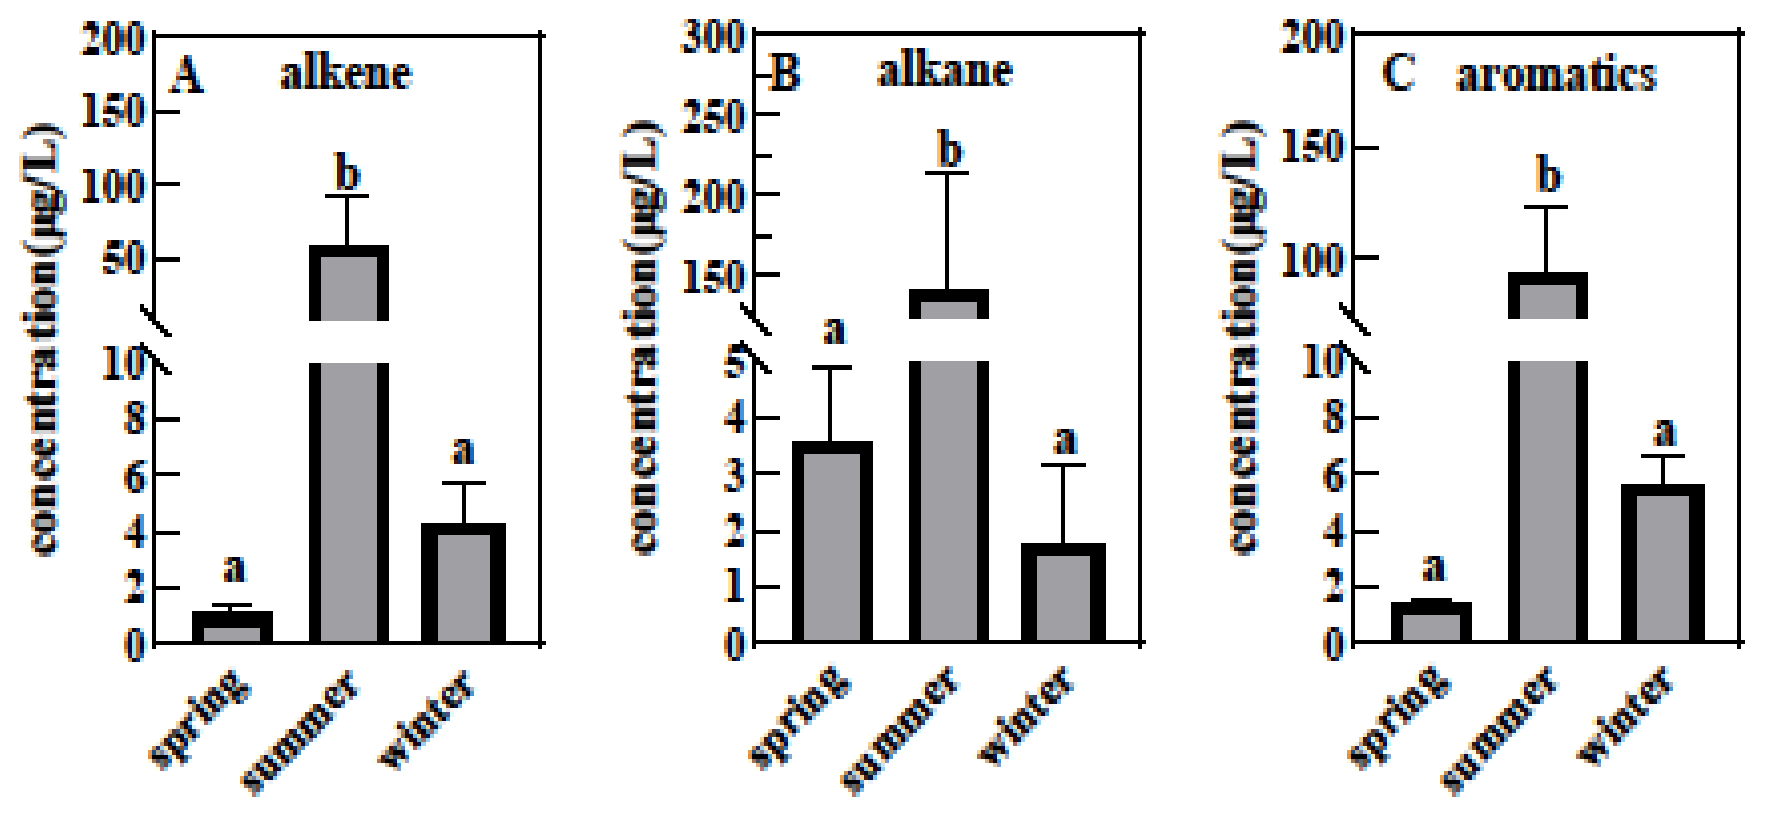
3.2. Influence of Seasons on the VOCs in Different Samples

In addition, comparisons of the VOC concentrations in different seasons are shown in Figure 2. In summer, the average alkene concentrations in water and sediment were 57.54 μg/L and 720.97 μg/g, respectively, which were higher than those in spring (1.038 μg/L, 2.87 μg/g) and winter (4.24 μg/L, 25.67 μg/g) (Figure 2A,D) (p < 0.01). The results of the alkanes were similar: the average concentration in the water samples was 141.58 μg/L in summer, which was much higher than in spring (3.56 μg/L) and winter (1.73 μg/L); the average sediment concentration was 13,588.21 μg/g (summer), which was higher than in spring (32.08 μg/g) and winter (35.77 μg/g) (Figure 2B,E) (p < 0.01). The average aromatic content in water samples was higher in summer (93.67 μg/L) than in spring (1.38 μg/L) and winter (5.63 μg/L); the average sediment concentration was similarly higher in the summer (1418.15 μg/g) than in spring (7.63 μg/g) and winter (62.53 μg/g) (Figure 2C,F) (p < 0.01). It is known that ambient temperature often influences VOCs, and the VOC chemical reactivity increases as the ambient temperature increases [17]. In our study, the average water temperature was 6.7, 10.7, and 4.61 °C in spring, summer and winter, respectively, which verified that the temperature obviously affected the VOCs. VOCs are a type of odor compound produced mostly by aquatic organisms such as algae and bacteria in water bodies [18]. Microorganisms excrete a versatile array of metabolites with different physico-chemical properties and biological activities during the stable period of growth [19]. The high temperature in summer can increase algal and microbial metabolism and affect the evaporation rate, resulting in the highest concentrations of VOCs. In order to illustrate the possible human factor in the largest concentrations of VOCs discovered during the summer, we identified that Xining, located on the edge of the Tibetan Plateau, is a popular destination for summer travel; the tourist numbers reach their peak in summer, which leads to a boom in many businesses [20]. For example, Xining had a population of 2.476 million in 2021 and received a total of 240.39 million tourists during the same year. The significant increase in human activities has introduced a tremendous burden to the ecological environment of the Huangshui River [21]. In 2022, agriculture and animal husbandry were also found to be contaminating the Huangshui River [22]. As a result, we consider that the long-term monitoring of VOCs in water bodies and sediments in the Xining sector of the Huangshui River is critical.

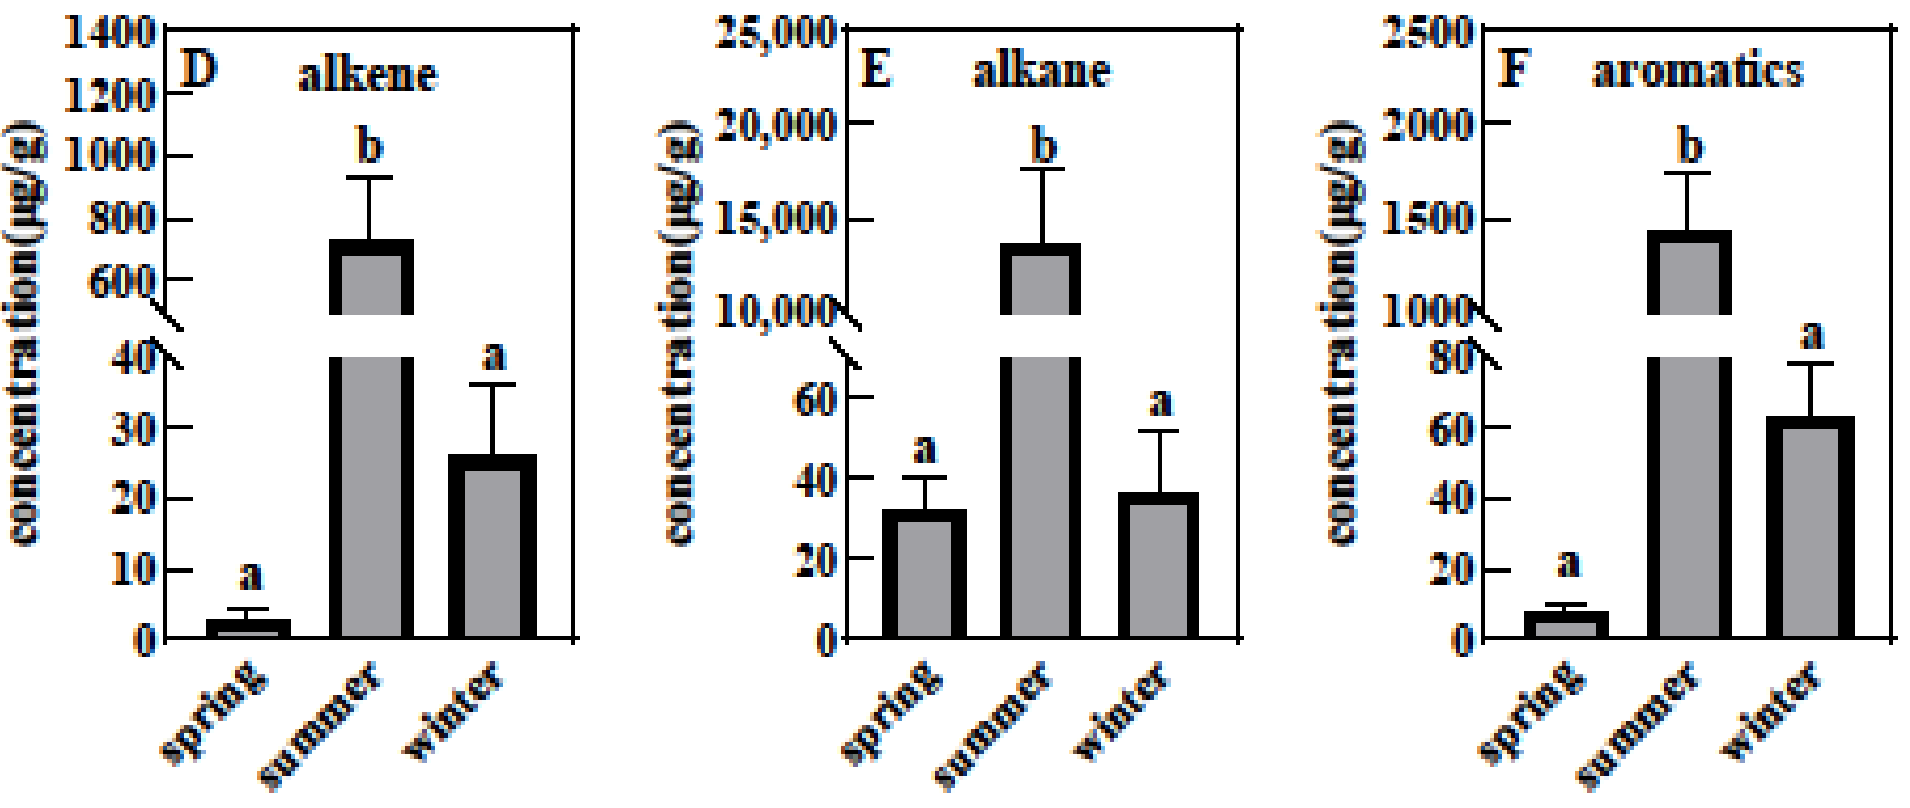
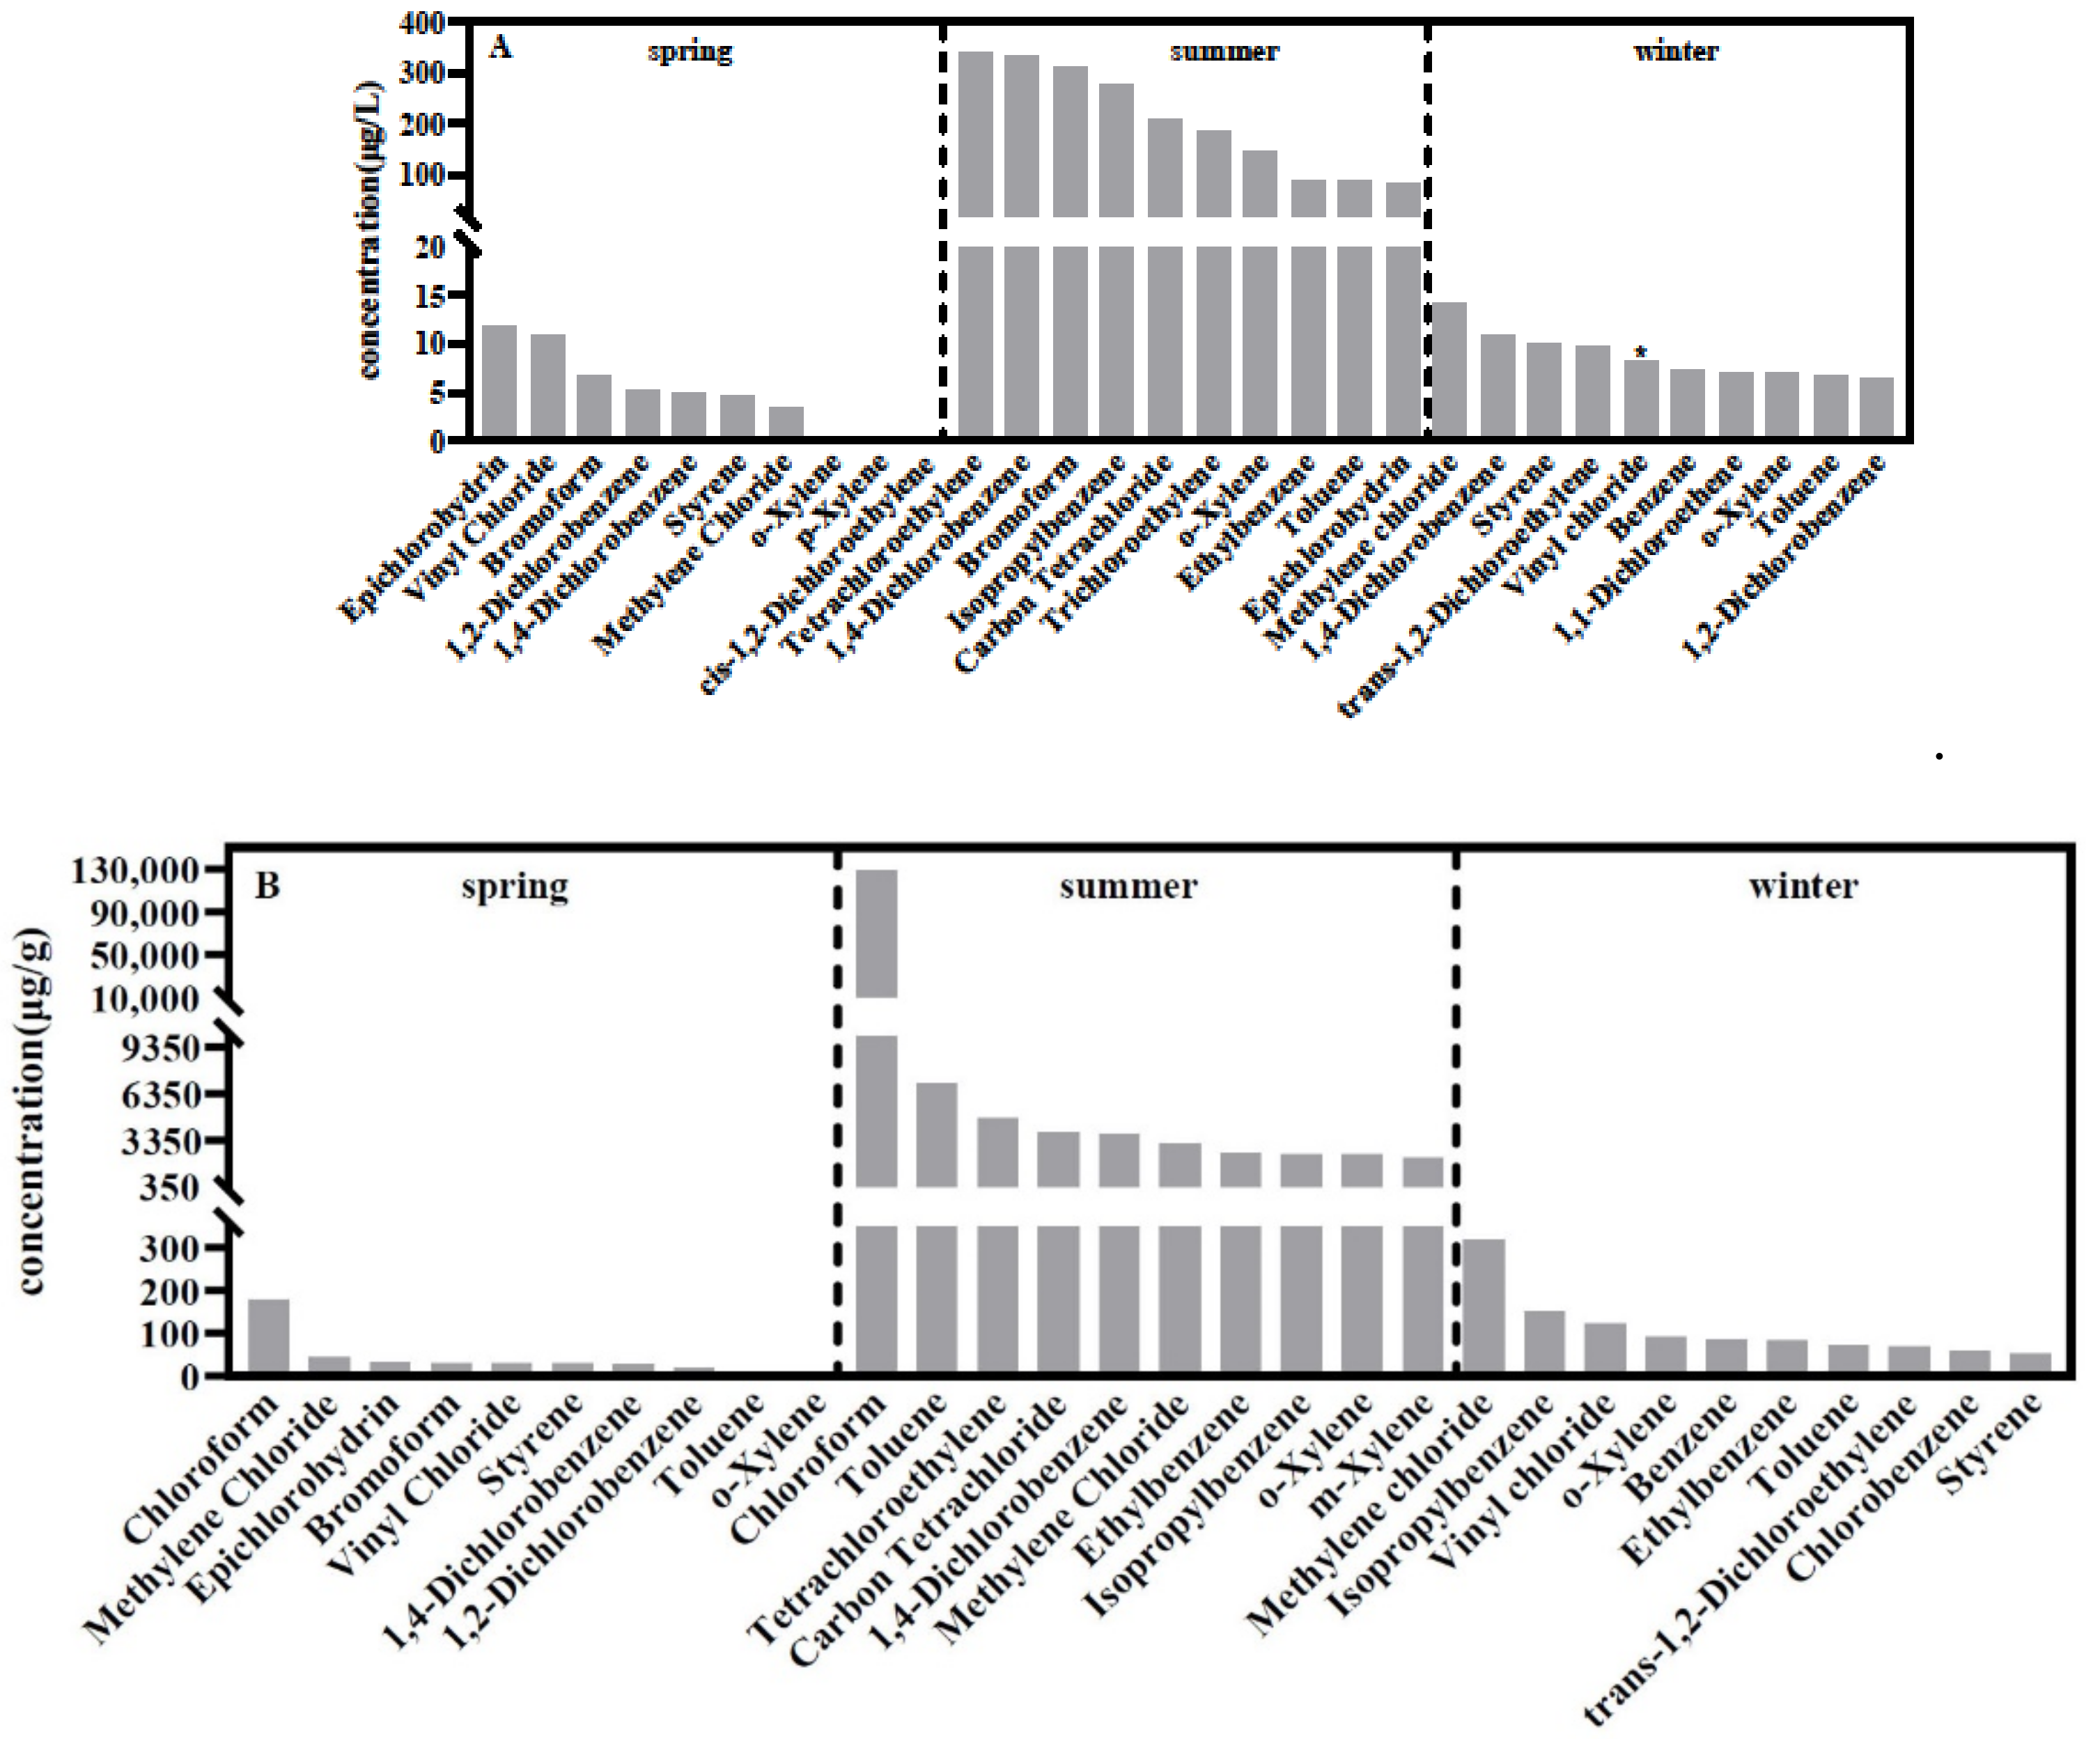
3.3. Analysis of the Main VOCs in Different Seasons

The results of the top 10 species of VOCs in different seasons are shown in Figure 3. We found that chloroform had the highest concentrations in sediment in spring (180.06 μg/g) and summer (128,311.97 μg/g), respectively (Figure 3B). Chloroform as a kind of organic chlorine is generally harmful to human health [23,24]; it is widely used in the manufacture of refrigerants, pharmaceuticals, and household cleaning products, and is also formed as a byproduct of chlorination disinfection in drinking water, wastewater, and swimming pools [25]. In our research, we found that the residential areas, factories, and recreational parks close to the sampling sites provided evidence that human activities aggravate chloroform accumulation, as shown in other papers [26,27,28].
Methylene chloride was another main VOC found in the water samples during the spring and winter with the highest concentration of 14.29 μg/L (near the national standard for 20 μg/L). It was also detected in all seasons’ sediment samples and had a maximum quantity of 318.27 μg/g (Figure 3). Methylene chloride was classified as a Group 2A carcinogen in a preliminary aggregated reference to the list of carcinogens [29] and is a major chemical solvent and raw material, likely to originate from industry emissions [30]. We also found that 1,4-dichlorobenzene (1,4-DCB) and o-Xylene were the two VOCs detected in all samples and seasons (Figure 3). The maximum concentration of 1,4-DCB in water reached 330.28 μg/L (the national standard was 300 μg/L), which is a common organic contaminant in water bodies that can bioaccumulate in aquatic species, polluting the environment and food [31,32]. Although the amounts of o-Xylene were all below the national standard (500 μg/L) with maximum average concentrations of 142.08 μg/L, we should still consider the sediment’s cumulative harmful effects because it has been related to dizziness, nausea, blurred vision, poor liver function, cellular DNA damage, and embryonic death [33,34]. Other VOCs species were also discovered, such as vinyl chloride (VC) and bromoform (Figure 3). VC was found as a major contaminant in some wells in Japan and can accumulate in the groundwater [35]. The highest concentration of VC in our analysis was 120.65 μg/L, which surpassed the national standard (50 μg/L). Because the carcinogenic potential and human carcinogenic effects of VC have already been proved (WHO, 2004) [36], its retention in the sediment should be monitored over time. Bromoform reached 312.43 μg/L in summer in our study, which surpassed the national standard (100 μg/L). Bromoform comes from the disinfection of water with chlorine, which produces large volumes of VOC byproducts. The widespread use and storage of these chemicals over the last several decades has led to the release of VOCs into the environment, including groundwater sources of drinking water, which are especially vulnerable to the impacts of soluble chemical contamination [37]. It is known that human activities emit the majority of chlorine-containing chemicals and benzenes [38], which tend to accumulate in the environment as shown in this paper. Tables S2–S4 detail the original data of the 25 VOCs in the water and sediment samples during the three seasons.

3.4. Impact of Environmental Factors on VOCs

Table S5 includes the original data of the water quality from the different sampling sites. PCA was used to comprehensively evaluate the environmental factors on the TVOCs. As shown in Figure 4A,C, the TVOCs were related to the TOC in spring and winter. The two axes explained 77.93% and 82.13%, respectively. In the summer, the TOC and NO2-N had positive correlations with the TVOCs (Figure 4B), and the two axes explained 81.97%. The TOC is a direct and reliable indicator that has been widely used to characterize organic pollution in water bodies and sediments [38] because of its potential hazards to humans [39], which means the VOCs are related to the river pollution in the Huangshui River. TOC can come from food waste [40] and released oils [41] and metals, such as Cu, Cr, Al, and Ni [42,43], which are related to pollution by humans. In addition, NO2-N is often produced by sewage discharge, including vast amounts of agriculture and the breeding of cattle and sheep [44]. We also found that NO2-N was detected in urban and industrial wastewater [44,45], providing further evidence of human activities. Nitrogen often promotes excessive growth of cyanobacteria [46,47], and several cyanobacteria species can produce VOCs, which have negative impacts on the atmosphere and human health [48,49]. For example, in Lake Taihu in 2019, bloom aggravated the secretion of VOCs and caused serious odors [50]. This was yet another piece of evidence that plankton in water bodies, such as algae, play a substantial role in the concentrations and species of VOCs, which indicates that nitrogen in the urban rivers on the Tibetan plateau is environmental pollution that should be taken seriously. The TN, TP, NO3-N, and NH4+-N in our study had no significant correlations with VOCs.

4. Conclusions

A total of 25 VOCs were collected from 11 monitoring locations and classified into three groups: eight alkenes, six alkanes, and eleven aromatics. The results showed that the concentrations of alkenes, alkanes, and aromatics in the sediment were significantly higher than in the water for all seasons (p < 0.001). Comparing the alkene, alkane, and aromatic concentrations in different seasons, it was shown that they were higher in summer than in spring and winter (p < 0.01). We presume that this was associated with the low temperature due to the high altitude of Tibetan plateau and the anthropogenic impact of the large numbers of visitors in summer. Chloroform, 1,4-DCB, o-Xylene, methylene chloride, vinyl chloride, and bromoform were the main VOCs found in our study, and several VOCs surpassed the national standard, which could lead to carcinogenic potential and human carcinogenic effects. Principal component analysis suggested that the TOC was responsible for the presence of the TVOCs in the river, accounting for 77.93%, 81.97%, and 82.13% of the total variance in the dataset in spring, summer, and winter, respectively. In addition, NO2-N was another important factor for the river’s pollution status, and TN, TP, NO3-N, and NH4+-N had no significant correlations with the VOCs.

Supplementary Materials

The following are available online at https://www.mdpi.com/article/10.3390/su141911983/s1, Table S1: Sampling sites information, Table S2: Statistical summary of the VOCs in the samples from spring, Table S3: Statistical summary of the VOCs in the samples from summer, Table S4: Statistical summary of the VOCs in the samples from winter, Table S5: Water quality in the different sampling sites of the Huangshui River.

Author Contributions

Conceptualization, X.Y. and Q.G.; methodology, Q.G. and X.D.; software, Q.G.; validation, G.L. and Y.L.; writing—original draft preparation, X.Y.; writing—review and editing, Q.G.; supervision, X.D.; project administration, X.Y.; funding acquisition, X.Y. All authors have read and agreed to the published version of the manuscript.

Funding

This research was funded by the National Natural Science Foundation of China, grant number 51879001, the Natural Science Foundation of Qinghai Province, grant number 2019-ZJ-933Q, and the Open Project of State Key Laboratory of Plateau Ecology and Agriculture, Qinghai University, grant number 2018-KF-04.

Institutional Review Board Statement

Not applicable.

Informed Consent Statement

Not applicable.

Data Availability Statement

Not applicable.

Conflicts of Interest

The authors declare no conflict of interest.

References

  1. Frank, D.; Poole, S.; Kirchhoff, S.; Forde, C. Investigation of Sensory and Volatile Characteristics of Farmed and Wild Barramundi (Lates calcarifer) using Gas Chromatography-Olfactometry Mass Spectrometry and Descriptive Sensory Analysis. J. Agric. Food Chem. 2009, 21, 10302–10312. [Google Scholar] [CrossRef] [PubMed]
  2. Olsen, B.K.; Chislock, M.F.; Wilson, A.E. Eutrophication mediates a common off-flavor compound, 2-methylisoborneol, in a drinking water reservoir. Water Res. 2016, 92, 228–234. [Google Scholar] [CrossRef] [PubMed]
  3. Webber, M.A.; Atherton, P.; Newcombe, G. Taste and odour and public perceptions: What do our customers really think about their drinking water? J. Water Supply Res. Technol.-Aqua 2015, 64, 802–811. [Google Scholar] [CrossRef]
  4. Rao, P.; Annable, M.D.; Kim, H. NAPL source zone characterization and remediation technology performance assessment: Recent developments and applications of tracer techniques. J. Contam. Hydrol. 2000, 45, 63–78. [Google Scholar] [CrossRef]
  5. Yamamoto, K. Occurrence, distribution, and trends of volatile organic compounds in urban rivers and their estuaries in Osaka, Japan, 1993–2006. Bull. Environ. Contam. Toxicol. 2014, 92, 472–477. [Google Scholar] [CrossRef] [PubMed]
  6. Li, C.; Li, Q.; Tong, D.; Wang, Q.; Wu, M.; Sun, B.; Su, G.; Tan, L. Environmental impact and health risk assessment of volatile organic compound emissions during different seasons in Beijing. J. Environ. Sci. 2019, 93, 1–12. [Google Scholar] [CrossRef]
  7. Deng, X.; Chen, J.; Hansson, L.A.; Zhao, X.; Xie, P. Eco-chemical mechanisms govern phytoplankton emissions of dimethylsulfide in global surface waters. Natl. Sci. Rev. 2021, 8, nwaa140. [Google Scholar] [CrossRef]
  8. Liu, C.; Xu, Z.; Du, Y.; Guo, H. Analyses of volatile organic compounds concentrations and variation trends in the air of Changchun, the northeast of China. Atmos. Environ. 2000, 34, 4459–4466. [Google Scholar] [CrossRef]
  9. Liu, M.; Wu, T.; Zhao, X.; Zan, F.; Yang, G.; Miao, Y. Cyanobacteria blooms potentially enhance volatile organic compound (VOC) emissions from a eutrophic lake: Field and experimental evidence. Environ. Res. 2021, 202, 111664. [Google Scholar] [CrossRef] [PubMed]
  10. Solomon, G.M.; Hurley, S.; Carpenter, C.; Young, T.M.; English, P.; Reynolds, P. Fire and Water: Assessing Drinking Water Contamination After a Major Wildfire. ACS EST Water 2021, 1, 1878–1886. [Google Scholar] [CrossRef] [PubMed]
  11. Yang, C.; Gao, P.; Hou, F.; Yan, T.; Chang, S.; Chen, X.; Wang, Z. Relationship between chemical composition of native forage and nutrient digestibility by Tibetan sheep on the Qinghai-Tibetan Plateau. J. Anim. Sci. 2018, 96, 1140–1149. [Google Scholar] [CrossRef] [PubMed]
  12. Cheng, Y.X.; Gao, Q.S.; Li, J.; Li, H.; Jiao, L.X. Characteristics of Volatile Organic Compounds Pollution and Risk Assessment of Nansi Lake in Huaihe River Basin. Huan Jing Ke Xue 2021, 42, 1820–1829. [Google Scholar] [PubMed]
  13. Zeng, S.; Liu, H.; Liu, Z.; Kaufmann, G.; Zeng, Q.; Chen, B. Seasonal and diurnal variations in DIC, NO3-and TOC concentrations in spring-pond ecosystems under different land-uses at the Shawan Karst Test Site, SW China: Carbon limitation of aquatic photosynthesis. J. Hydrol. 2019, 574, 811–821. [Google Scholar] [CrossRef]
  14. Kuang, Y.; Guo, X.; Hu, J.; Li, S.; Zhang, R.; Gao, Q.; Yang, X.; Chen, Q.; Sun, W. Occurrence and risks of antibiotics in an urban river in northeastern Tibetan Plateau. Sci. Rep. 2020, 10, 20054. [Google Scholar] [CrossRef] [PubMed]
  15. Liu, B.; Chen, L.; Huang, L.; Wang, Y.; Li, Y. Distribution of volatile organic compounds (VOCs) in surface water, soil, and groundwater within a chemical industry park in Eastern China. Water Sci. Technol. 2015, 71, 259–267. [Google Scholar] [CrossRef] [PubMed]
  16. Parlin, A.A.; Kondo, M.; Watanabe, N.; Nakamura, K.; Yamada, M.; Wang, J.; Komai, T. Water-Enhanced Flux Changes under Dynamic Temperatures in the Vertical Vapor-Phase Diffusive Transport of Volatile Organic Compounds in Near-Surface Soil Environments. Sustainability 2021, 13, 6570. [Google Scholar] [CrossRef]
  17. Niu, Z.; Kong, S.; Zheng, H.; Yang, Q.; Liu, J.; Feng, Y.; Wu, J.; Zheng, S.; Zeng, X.; Yao, L.; et al. Temperature dependence of source profiles for volatile organic compounds from typical volatile emission sources. Sci. Total Environ. 2021, 751, 141741. [Google Scholar] [CrossRef] [PubMed]
  18. Zuo, Z.; Yang, Y.; Xu, Q.; Yang, W.; Zhao, J.; Zhou, L. Effects of phosphorus sources on volatile organic compound emissions from Microcystis flos-aquae and their toxic effects on Chlamydomonas reinhardtii. Environ. Geochem. Health 2018, 40, 1283–1298. [Google Scholar] [CrossRef]
  19. Weisskopf, L.; Schulz, S.; Garbeva, P. Microbial volatile organic compounds in intra-kingdom and inter-kingdom interactions. Nat. Rev. Microbiol. 2021, 19, 391–404. [Google Scholar] [CrossRef]
  20. Li, S.; Shi, P. Tourism Distribution of Xining city Tourism Circle Evolution and spatial characteristics. In Proceedings of the 2017 6th International Conference on Energy and Environmental Protection (ICEEP 2017), Zhuhai, China, 29–30 June 2017; Volume 143, pp. 272–279. [Google Scholar]
  21. Chen, L.; Wei, Q.; Xu, G.; Wei, M.; Chen, H. Contamination and Ecological Risk Assessment of Heavy Metals in Surface Sediments of Huangshui River, Northwest China. J. Chem. 2022, 2022, 4282992. [Google Scholar] [CrossRef]
  22. Zhang, L.; Tan, X.; Chen, H.; Liu, Y.; Cui, Z. Effects of Agriculture and Animal Husbandry on Heavy Metal Contamination in the Aquatic Environment and Human Health in Huangshui River Basin. Water 2022, 14, 549. [Google Scholar] [CrossRef]
  23. Yang, J.; Wang, K.; Zhao, Q.; Huang, l.; Yuan, C.; Chen, W.; Yang, W. Underestimated public health risks caused by overestimated VOC removal in wastewater treatment processes. Environ. Sci. Process. Impacts 2014, 16, 271–279. [Google Scholar] [CrossRef] [PubMed]
  24. Liu, L.; Zhou, H. Investigation and assessment of volatile organic compounds in water sources in China. Environ. Monit. Assess. 2011, 173, 825–836. [Google Scholar] [CrossRef] [PubMed]
  25. Palanisamy, K.; Mezgebe, B.; Sorial, G.; Sahle-Demessie, E. Biofiltration of Chloroform in a Trickle Bed Air Biofilter Under Acidic Conditions. Water Air Soil Pollut. 2016, 227, 478. [Google Scholar] [CrossRef]
  26. Wei, H.; Lu, C.; Liu, Y. Farmland Changes and Their Ecological Impact in the Huangshui River Basin. Land 2021, 10, 1082. [Google Scholar] [CrossRef]
  27. Zhou, S.; Lin, G.; Lin, Q.; Su, S.; Cheng, M. Pollution of Microplastics in Coastal Plain of the Huangshui River Basin. In IOP Conference Series: Earth and Environmental Science; IOP Publishing: Bristol, UK, 2020; Volume 546, p. 032040. [Google Scholar]
  28. Xiang, Z. Analysis of Water Pollution and Calculation of Ecological Compensation Standards in Huangshui River Basin Based on Ecological Footprint. In Journal of Physics: Conference Series; IOP Publishing: Bristol, UK, 2020; Volume 1533, p. 022070. [Google Scholar]
  29. Dai, H.; Jing, S.; Wang, H.; Ma, Y.; Li, L.; Song, W.; Kan, H. VOC characteristics and inhalation health risks in newly renovated residences in Shanghai, China. Sci. Total Environ. 2016, 577, 73–83. [Google Scholar] [CrossRef]
  30. Tong, L.; Liao, X.; Chen, J.; Xiao, H.; Xu, L.; Zhang, F.; Niu, Z.; Yu, J. Pollution characteristics of ambient volatile organic compounds (VOCs) in the southeast coastal cities of China. Environ. Sci. Pollut. Res. 2013, 20, 2603–2615. [Google Scholar] [CrossRef]
  31. Jamali, M.R.; Firouzjah, A.; Rahnama, R. Solvent-assisted dispersive solid phase extraction. Talanta 2013, 116, 454–459. [Google Scholar] [CrossRef] [PubMed]
  32. Komilis, D.P.; Ham, R.K.; Park, J.K. Emission of volatile organic compounds during composting of municipal solid wastes. Water Res. 2004, 38, 1707–1714. [Google Scholar] [CrossRef] [PubMed]
  33. Mendes, M.; Cunha, D.; dos Santos, v.l.; Vianna, M.T.; Marques, M. Ecological risk assessment (ERA) based on contaminated groundwater to predict potential impacts to a wetland ecosystem. Environ. Sci. Pollut. Res. 2020, 27, 26332–26349. [Google Scholar] [CrossRef] [PubMed]
  34. Jin, S.; Fallgren, P.H.; Bilgin, A.A.; Morris, J.M.; Barnes, P.W. Bioremediation of benzene, ethylbenzene, and xylenes in groundwater under iron-amended, sulfate-reducing conditions. Environ. Toxicol. Chem. 2007, 26, 249–253. [Google Scholar] [CrossRef] [PubMed]
  35. Kawabe, Y.; Komai, T. A Case Study of Natural Attenuation of Chlorinated Solvents Under Unstable Groundwater Conditions in Takahata, Japan. Bull. Environ. Contam. Toxicol. 2019, 102, 280–286. [Google Scholar] [CrossRef] [PubMed]
  36. Kistemann, T.; Hundhausen, J.; Herbst, S.; Classen, T.; Farber, H. Assessment of a groundwater contamination with vinyl chloride (VC) and precursor volatile organic compounds (VOC) by use of a geographical information system (GIS). Int. J. Hyg. Environ. Health 2008, 211, 308–317. [Google Scholar] [CrossRef]
  37. Williams, P.; Benton, L.; Warmerdam, J.; Sheehan, P. Comparative Risk Analysis of Six Volatile Organic Compounds in California Drinking Water. Environ. Sci. Technol. 2002, 36, 4721–4728. [Google Scholar] [CrossRef] [PubMed]
  38. Lána, R.; Vavrova, M.; Navratil, S.; Brabencova, E.; Vecerk, V. Organochlorine Pollutants in Chub, Leuciscus cephalus, from the Svratka River, Czech Republic. Bull. Environ. Contam. Toxicol. 2010, 84, 726–730. [Google Scholar] [CrossRef]
  39. Yang, C.; Xiao, N.; Chang, Z.; Huang, J.; Zeng, W. Biodegradation of TOC by Nano-Fe2O3 Modified SMFC and Its Potential Environmental Effects. ChemistrySelect 2021, 6, 5597–5602. [Google Scholar] [CrossRef]
  40. Kamaruddin, M.A.; Hlid, N.; Yusoff, M.; Zainol, M.; Alrozi, R. TOC, TKN and C/N ratio fractionation of organic wastes under elevated temperature regime by using hydrothermal approach. In Proceedings of the 5th International Conference on Green Design and Manufacture (IConGDM 2019), Bandung, Indonesia, 29–30 April 2019; AIP Conference Proceedings: Melville, NY, USA, 2019. [Google Scholar]
  41. Forat Yasir, A. Removal of TOC from oily wastewater by electrocoagulation technology. In IOP Conference Series: Materials Science and Engineering; IOP Publishing: Bristol, UK, 2020; Volume 928, p. 022024. [Google Scholar]
  42. Gehan, M.; Mohamed, I.; Laila, A.; Mohamed, E. Critical geochemical insight into Alexandria coast with special reference to diagnostic ratios (TOC/TN & Sr/Ca and heavy metals ecotoxicological hazards. Egypt. J. Aquat. Res. 2020, 46, 27–33. [Google Scholar]
  43. Glauser, A.; Morf, L.S.; Weibel, G.; Eggenberger, U. Ten-years monitoring of MSWI bottom ashes with focus on TOC development and leaching behaviour. Waste Manag. 2020, 117, 104–113. [Google Scholar] [CrossRef]
  44. Hammouda, O.; Gaber, A.; Abdelraouf, N. Microalgae and wastewater treatment. Ecotox. Environ. Saf. 1995, 31, 205–210. [Google Scholar] [CrossRef]
  45. Johnson, H.M.; Stets, E.G. Nitrate in Streams during Winter Low-Flow Conditions as an Indicator of Legacy Nitrate. Water Resour. Res. 2020, 56, e2019WR026996. [Google Scholar] [CrossRef]
  46. Azevedo, S.M.; Carmichael, W.W.; Jochimsen, E.M.; Rinehart, K.L.; Lau, S.; Shaw, G.R.; Eaglesham, G.K. Human intoxication by microcystins during renal dialysis treatment in Caruaru-Brazil. Toxicology 2002, 181, 441–446. [Google Scholar] [CrossRef]
  47. Buzancic, M.; Gladan, Z.N.; Marasovic, I.; Kuspilic, G.; Grbec, B. Eutrophication influence on phytoplankton community composition in three bays on the eastern Adriatic coast. Oceanologia 2016, 58, 302–316. [Google Scholar] [CrossRef]
  48. Zuo, Z.; Yang, L.; Chen, S.; Ye, C.; Han, Y.; Wang, S.; Ma, Y. Effects of nitrogen nutrients on the volatile organic compound emissions from Microcystis aeruginosa. Ecotox. Environ. Saf. 2018, 216, 214–220. [Google Scholar] [CrossRef] [PubMed]
  49. Deng, X.; Ruan, L.; Ren, R.; Tao, M.; Zhang, J.; Wang, L.; Yan, Y.; Wen, X.; Yang, X.; Xie, P. Phosphorus accelerate the sulfur cycle by promoting the release of malodorous volatile organic sulfur compounds from Microcystis in freshwater lakes. Sci. Total Environ. 2022, 845, 157280. [Google Scholar] [CrossRef] [PubMed]
  50. Deng, X.; Qi, M.; Ren, R.; Liu, J.; Sun, X.; Xie, P.; Chen, J. The relationships between odors and environmental factors at bloom and non-bloom area in Lake Taihu, China. Chemosphere 2019, 218, 569–576. [Google Scholar]
Figure 1. Map of sampling locations.
Sustainability 14 11983 g001
Figure 2. The comparisons of the VOCs in the water samples (AC) and sediment samples (DF) in different seasons.
Sustainability 14 11983 g002aSustainability 14 11983 g002b
Figure 3. The top 10 species of VOCs in water samples (A) and sediment samples (B).
Sustainability 14 11983 g003
Figure 4. PCA biplot based on the TVOCs and environmental variables of spring (A), summer (B), and winter (C). L1–L11: 11 monitoring locations.
Sustainability 14 11983 g004
Table 1. Comparison of VOC concentrations (μg/L or μg/g) in the Huangshui River.
SeasonsSamplesAlkenesNonparametric TestsAlkanesNonparametric TestsAromaticsNonparametric Tests
springwater1.01 ± 0.11p < 0.0013.19 ± 0.24p < 0.0011.31 ± 0.02p < 0.001
sediment2.45 ± 0.15 31.23 ± 1.30 7.54 ± 0.31
summerwater62.66 ± 4.66p < 0.001145.57 ± 9.47p < 0.00189.22 ± 4.30p < 0.001
sediment648.50 ± 42.34 13,052.27 ± 66.69 1372.73 ± 52.24
winterwater3.67 ± 0.20p < 0.0012.05 ± 0.22p < 0.0015.36 ± 0.14p < 0.001
sediment23.96 ± 4.01 28.37 ± 2.78 60.46 ± 3.48
Publisher’s Note: MDPI stays neutral with regard to jurisdictional claims in published maps and institutional affiliations.

