Article

Investment Risk Analysis for Green and Sustainable Planning of Rural Family: A Case Study of Tibetan Region

1
College of Economics, Sichuan Agricultural University, Chengdu 611130, China
2
College of Architecture and Urban-Rural Planning, Sichuan Agriculture University, Dujiangyan 611830, China
*
Authors to whom correspondence should be addressed.
Sustainability 2022, 14(19), 11822; https://doi.org/10.3390/su141911822
Submission received: 20 July 2022 / Revised: 6 September 2022 / Accepted: 15 September 2022 / Published: 20 September 2022
(This article belongs to the Special Issue Green Development: Rural Communities, Resilience and Sustainability)

Abstract

:
In China, Tibetan areas have generally high altitudes and abnormal climates, and many areas have faced a variety of risks such as food security, land degradation disasters, and diseases. The Tibetan region’s economic development level is lower than that of the rest of China. Rural households and communities primarily rely on agricultural-related activities for a living, and their investment opportunities are limited due to unfavorable land and climate conditions. This study aims to investigate how to overcome such impacts by providing efficient strategies of green and sustainable planning through risk analysis and reasonable portfolio. By investigating the asset composition of 271 rural households in Tibetan area of Sichuan, the potential risks are analyzed by using the block diagram and investment portfolio to avoid risk is calculated and discussed by Markowitz model. The results show that the asset composition of rural households in ethnic area is unreasonable. Most of families highly prefer real assets, this may due to their risk attitudes and resistance capacities. From rural households’ perspective, in order to adapt to suboptimal environmental conditions, rural households should diversify their livelihood strategies and make appropriate investment portfolios. Moreover, the research findings also provide useful strategy suggestions for green and sustainable development of people’s livelihood planning in ethnic areas of China as the Tibetan region in Sichuan.

1. Introduction

Environment has a significant direct impact on the lives and productivity of farmers. Rural residents mainly rely on the land for their livelihoods [1] in Tibetan regions where the climate is harsh and the ecosystem is vulnerable. Hence, rural households are facing a number of challenges such as resource depletion and land degradation [2]. The region’s economy is less developed than the national average. Furthermore, rural households lack the capacity to deal with risks. As a result, overall development is lagging [3]. The income of rural households in ethnic areas has been steadily increasing as the gap between urban and rural areas has narrowed. In addition, the value of assets is also increasing. Jinchun and Cong [4] took 1146 rural families as a sample to measure the classified asset index of farmers and found that all rural families with productive assets would invest. In order to actively respond to the challenges of climate and geological conditions and better optimize livelihood strategies, asset investment has become an important choice for local rural families. Due to the particularity of rural, especially ethnic assets, rea-sonable investment requires targeted adjustments. In addition, Xia [5] research found that the number of financial institutions in rural areas is very small, the distribution is unbalanced, financial products and services are unitary, and investment is more difficult than in other areas. With the development of social economy, more and more urban households have begun to pay attention to the preservation and appreciation of assets, while rural households generally have difficulty participating in the financial market. At the same time, ethnic areas are generally faced with a lack of financial assets when they have more labor than other cities. The disparity of these factors will seriously affect the coordination and sustainability of the financial and economic structures, and exacerbate the differences in urban and rural development of China.
Numerous studies have investigated the investment behavior of rural households in China. In this domain, research has referred to theories, perspective, and status [6,7,8]. Several research topics such as risk analysis, investment portfolio, and preference of investment, as well as asset composition have often been study focused [9,10,11,12]. In addition, research on rural households focuses on the comparison with urban households, for example, except for natural assets, rural families have the lowest livelihood assets, while urban families have better livelihood assets [13]. However, few scholars’ work has been dedicated to the investment risk of rural households in ethnic area of China. To allocate assets more rational and improve the livelihood of rural residents, analyzing the current investment behavior of rural households in ethnic areas is very important. This will further ensure the development and stability of ethnic regions. Especially, there is urgent need to use this approach to promote sustainable planning and operations of financial institution and economic development in ethnic areas of China.
The change of study area has imposed a new challenge to analyze the investment risk of rural households. Consideration on the local reality in ethnic area has driven research to focus on the actual particularity for family asset, and conduct risk analysis and cause exploration in combination with the characteristics of their assets. This study investigates how to overcome these challenges to make a reasonable investment portfolio through empirical analysis based on the questionnaire survey data of rural families in ethnic areas. In the case of Tibetan region of western Sichuan in China, risk analysis from empirical data and further reasonable portfolio provide efficient strategies. Specifically, the asset characteristics of 271 rural families are described, and the comparison to the average data corresponding national status are drawn based on the data. By introducing the analysis of box figure, the potential risks of real and financial investment are shown through illustrations. With the income data of local respondents, this study employs the Markowitz model to calculate investment portfolio with corresponding discussion to avoid future risks.
The present study is motivated by improving the investment status of rural households in ethnic areas. The major contributions of the research are as follows:
  • To reveal the asset particularity of rural households in ethnic areas through statistical description and comparison;
  • To identify the potential risks of investment in the special study area by illustrating with box figures and data analysis;
  • To optimize the investment portfolio of rural households in ethnic regions utilizing the Markowitz model;
  • To provide research evidence to promote the development Tibetan region of Sichuan by conducting an empirical study.
The remainder of this paper is organized as follows. In Section 2, the related literature review and research framework of this work are presented. Section 3 introduces the study area and data sources. The methodology is described in detail in Section 4. The study results are shown with strategies in Section 5. Finally, Section 6 concludes the research and gives future study direction.

2. Literature Review and Research Framework

2.1. Literature Review

Analyzing the investment risk of rural family in ethnic area involves three aspects: (i) asset composition of household (ii) the influencing factors of family investment and risk avoidance and (iii) the status of family investment in rural ethnic areas.

2.1.1. Asset Composition of Household

Most existing studies focus on the discussion of residents’ asset selection. Referring to the Chinese family, Xie and Jin [14] analyzed the changes in the total amount and structure of financial assets in China. This study reveals a single structure of financial assets for residents that mainly consists of deposits. Later with the construction of the CHIP, CHFS, and other databases, studies on the characteristics and motivation of household assets have emerged [15]. In recent years, with the continuous enrichment of databases and the corresponding research, new study results have been concluded. They find that the household asset in China is dominated by real assets, among which the house is the most important [15,16]. However, financial products are getting more attention from families [17].

2.1.2. Family Investment and Risk Avoidance

The quality of family life is influenced in many ways by economic, social, and environmental standards [18]. To deal with abnormal weather and pursue a better life, investing is a way to maintain and increase the asset value of the family. There are many influencing factors of family investment. Firstly, personal and family attributes such as age, sex, marriage, education level, family structure [1,19], etc., all have a significant impact on family investment. Secondly, since land is the most common and important productive resource in rural areas, the income risk brought by land transfer [1] and the scale of rural families’ land management [20] will also have an impact on the choice of family assets. Additionally, the family’s social interaction, regional inequality of opportunity [21], risk preference [22], and other external factors, such as corporate credit risk [23,24], also affect the family’s investing behavior. That is to say, investment risk is the focus of family attention.
The risk research of family investment can be traced back to the discussion of portfolio selection theory by Markowitz [25] and other scholars. Lu et al. [26] focus on the analysis of the risks in China’s family financial portfolio and find that the risk distribution of China’s family financial portfolio was U-shaped;; that is, there are more conservative families and aggressive families. Li et al. [27] investigated the impact of financial literacy on the investment portfolio selection of Chinese families and financial market investment returns and found that financial literacy improves the investment returns of young and well-educated families while reducing the returns of older and less educated families. Based on the household panel data, Han and Si [28] discuss that the asset portfolio consisting of housing assets, financial assets, production assets, durable assets, and automobile assets significantly affected household consumption. Song et al. [22] used the panel data of the China household tracking survey (CFPS) in 2010, 2012, and 2014 and studied how the inequality of opportunities affects the investment decisions of family risk assets at the district and county level. The empirical results show that the increase in opportunity inequality will simultaneously improve the possibility and investment weight of households in risky assets investment. Choi and Min [29] conducted research on panel data from 2003 to 2014 and showed that a diversified investment portfolio can improve performance efficiency.

2.1.3. Family Investment in Rural Ethnic Areas

The research on family asset and investment in rural areas prefer to focus on the comparison to the urban family. Xie and Jin [14] found that the asset structure of urban families is divided into real estateestate, financial assets, and productive assets. However, this study reveals that the real estates represent the largest proportion, followed by productive assets and financial assets last. This means the investment willingness of rural households is lower than urban families.
Ethnic areas, such as the Tibetan area of Sichuan, China, are relatively less developed and restricted by their historical origin. Due to the vast area and sparse population in the local region, financial institutions are mainly concentrated in county towns with unbalanced distribution exist [30]. Therefore, rural households hold fewer financial assets with less income than the general. That is because the primary industry is the basic economic activity [31] with low income. The real assets and productive assets account for a large proportion owned by these families. Particularly, the productive assets of rural households in the area are the main source.
Consequently, the reasons lead to the above phenomenon might be the resistance capacity and preference of risk. Thus, it is necessary to analyse the investment risk and realize risk avoidance for rural households especially in ethnic area.

2.2. Research Framework

In general, the existing research lays a foundation of theory and empiricism for this study. They have presented the unsatisfactory status for the investment of rural family in ethnic region. Due to the special natural conditions and social environment, lifestyle, and asset composition in ethnic areas, it is necessary to explore risk circumstance of investment.
Accordingly, this study proposes a systematic research framework to conduct an empirical study based on survey data referred to the flow chart in Figure 1. It includes the following three main research phases as shown:
Phase I: Describe asset composition and the comparison to national status.
Phase II: Analyze the potential risks by illustrating with box figure.
Phase III: Optimize investment portfolio by employing Markowitz model with family income.

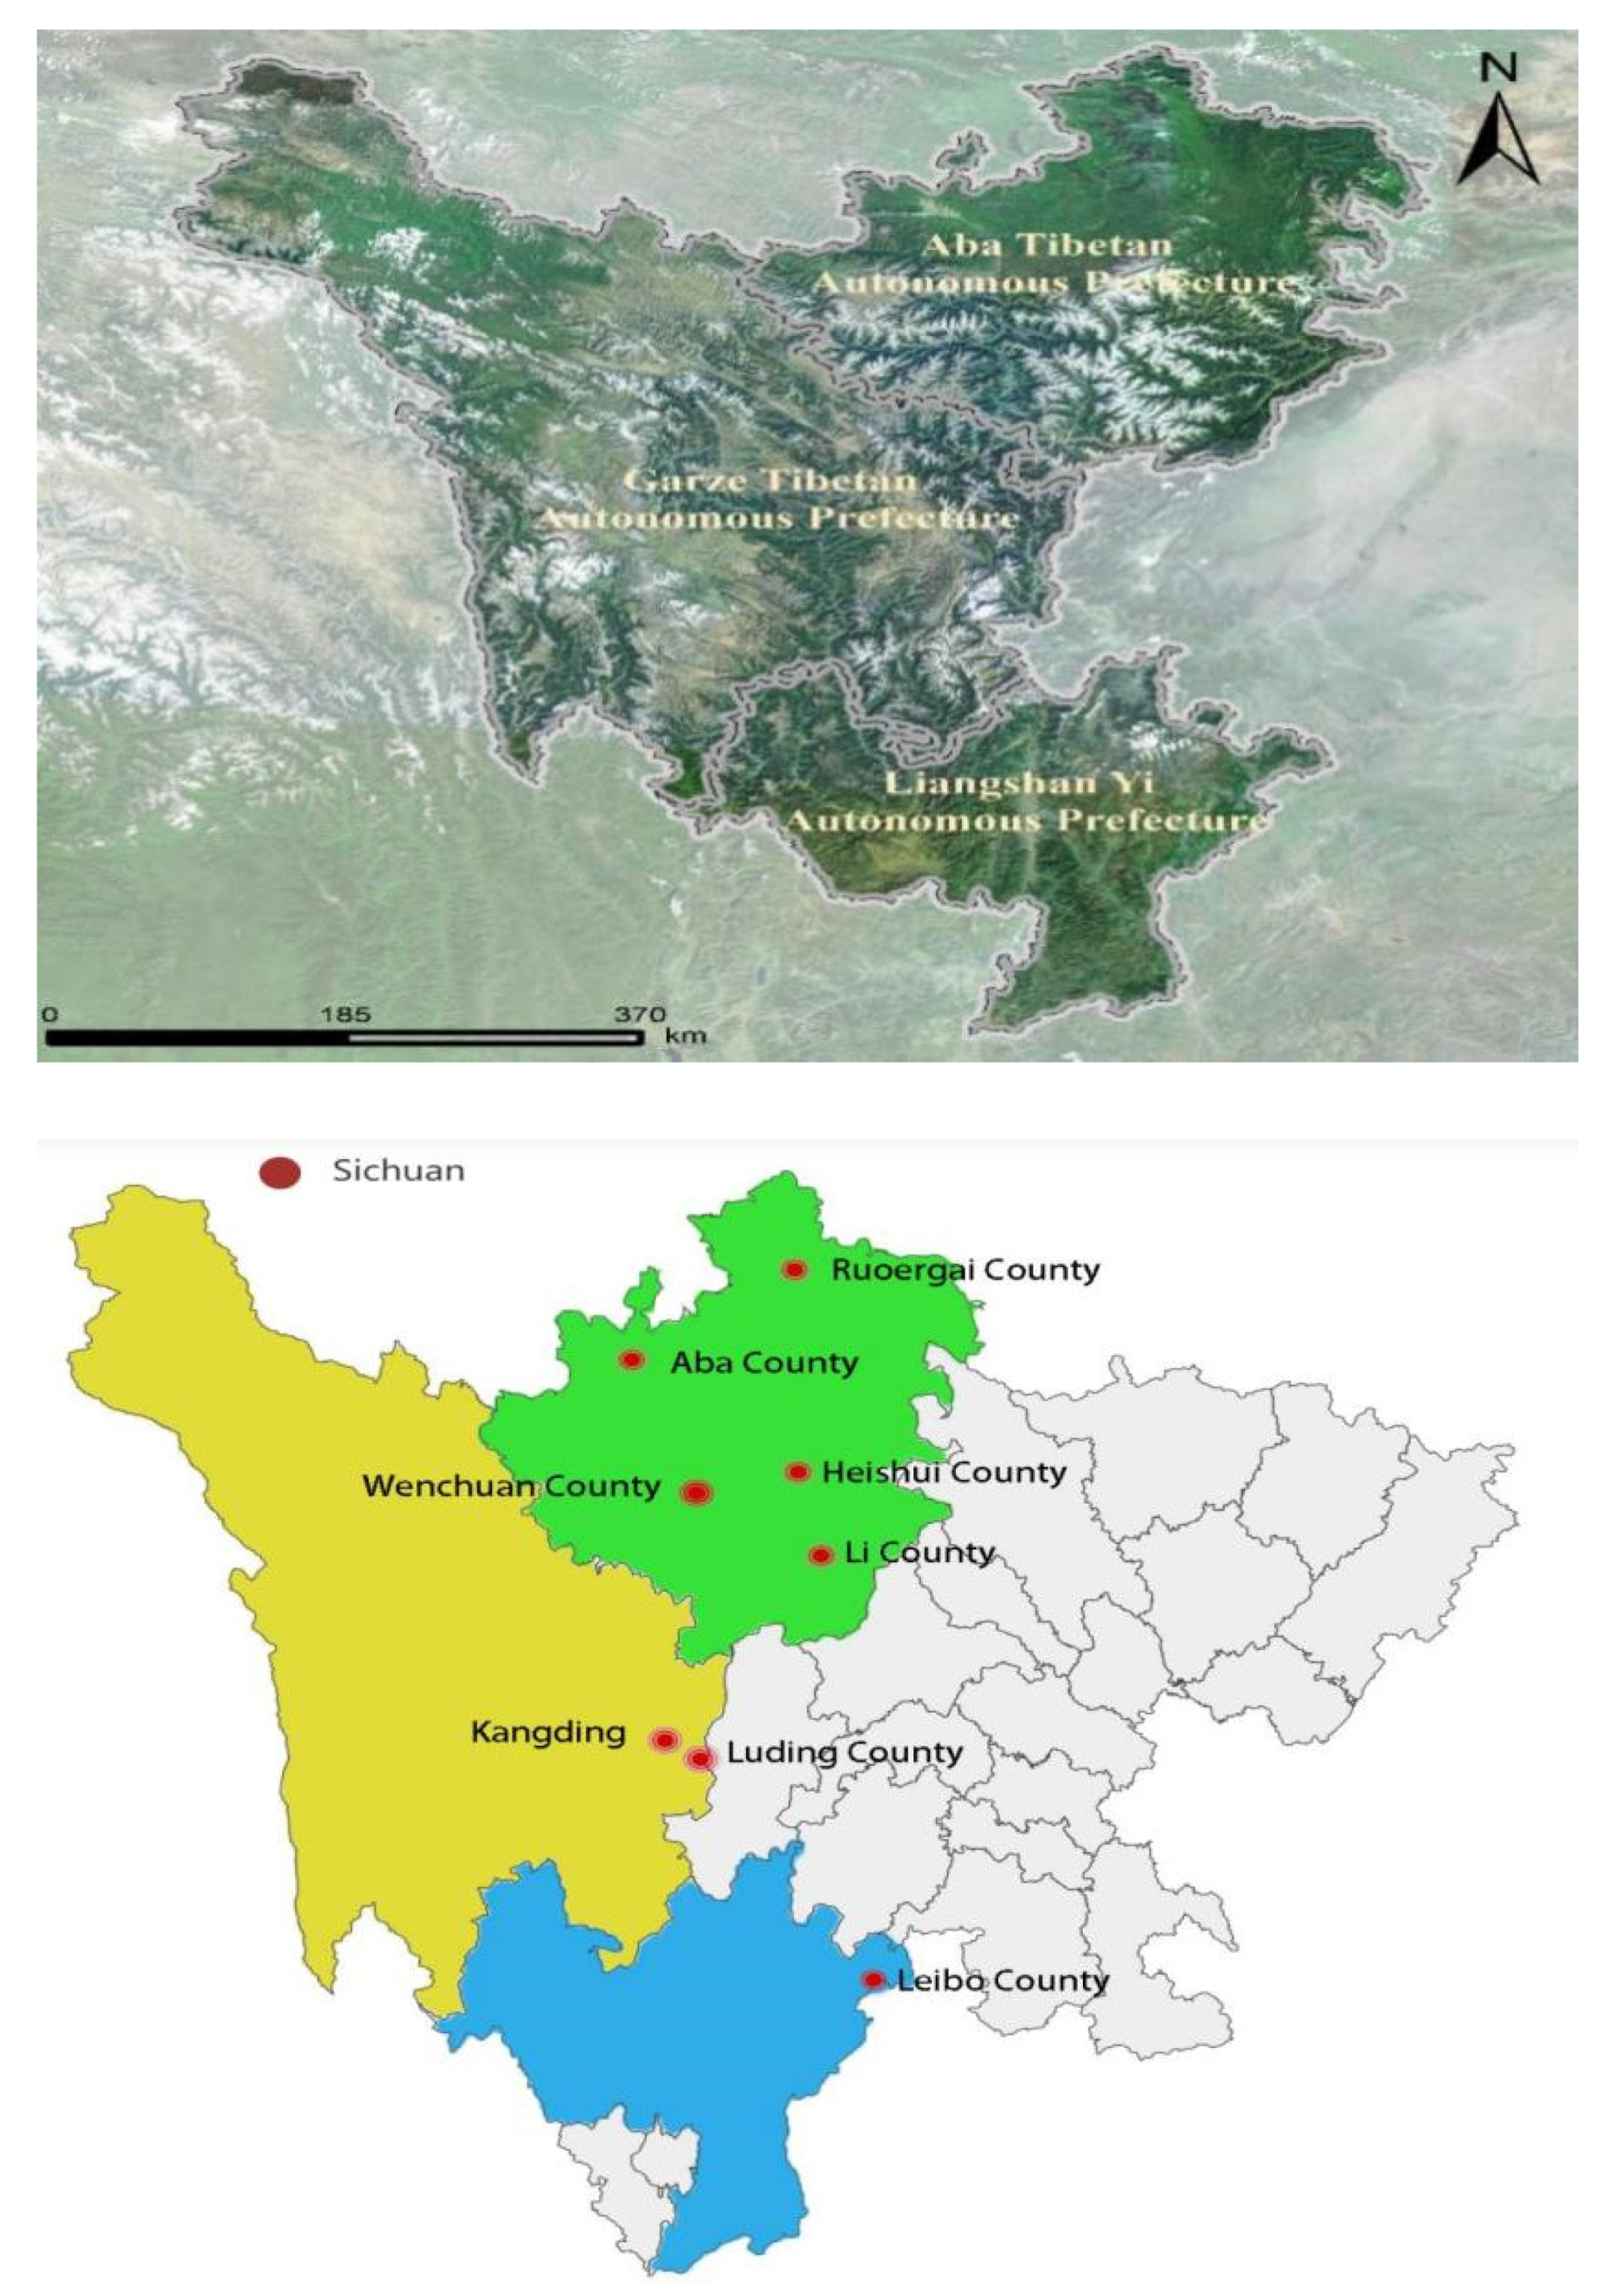
3. Study Area and Data

As shown in Figure 2, Huang Dongmei claims that Sichuan Tibetan areas including Ganzi and Aba Prefecture and part of Liangshan Prefecture cover 32 counties in Western China. It is the core area of Kangba culture and the second largest Tibetan area in China. It has a vast territory, low density, and unbalanced distribution of population.
As an ethnic area, the local economy development is relatively low. In 2017, the gross domestic product (GDP) of Tibetan region in Sichuan was ¥58.67 billion only 1.6% of the entire Sichuan province. The per capita disposable income of rural residents was ¥10,834, which is 11.4% lower than the average level of the province. As a typical poverty-stricken area inhabited by ethnic minorities in China, it is selected as a representative study area to illustrate the research significance and verify the methodology efficiency.
The data in this paper are obtained through field surveys and random sampling of rural households in Tibetan areas of Sichuan. The survey is conducted in the form of a questionnaire and expert interview in related research fields in local universities. As shown in Figure 2, this paper selects 8 Tibetan-inhabited counties in Sichuan Tibetan area as the sample area, and selects 16 local representative administrative villages as the survey area, so as to ensure that the research results are generally representative. Rural families are randomly selected from each sample village to complete the survey. A total of 300 questionnaires are issued and 271 valid questionnaires are recovered.
The Tibetan area of Sichuan is the second largest Tibetan-inhabited area in China and has long been one of the main battlefields in China’s poverty alleviation. The rural areas of Sichuan are vast, the family income is very low, and the rural family income in the minority areas is much lower than the average level of the whole province. Solving the poverty problem in Tibetan areas has a great driving effect on rural areas and is conducive to the balanced development among regions. Addressing sustainable livelihoods of rural Tibetan households through a more effective and scientific portfolio is both an economic and a political issue that needs to be addressed and can provide useful strategic suggestions for green and sustainable development of livelihood planning in ethnic minority areas of China.

4. Methodology

4.1. Asset Analysis

The assets of rural family in the Tibetan areas of Sichuan can be divided into real assets and financial assets.

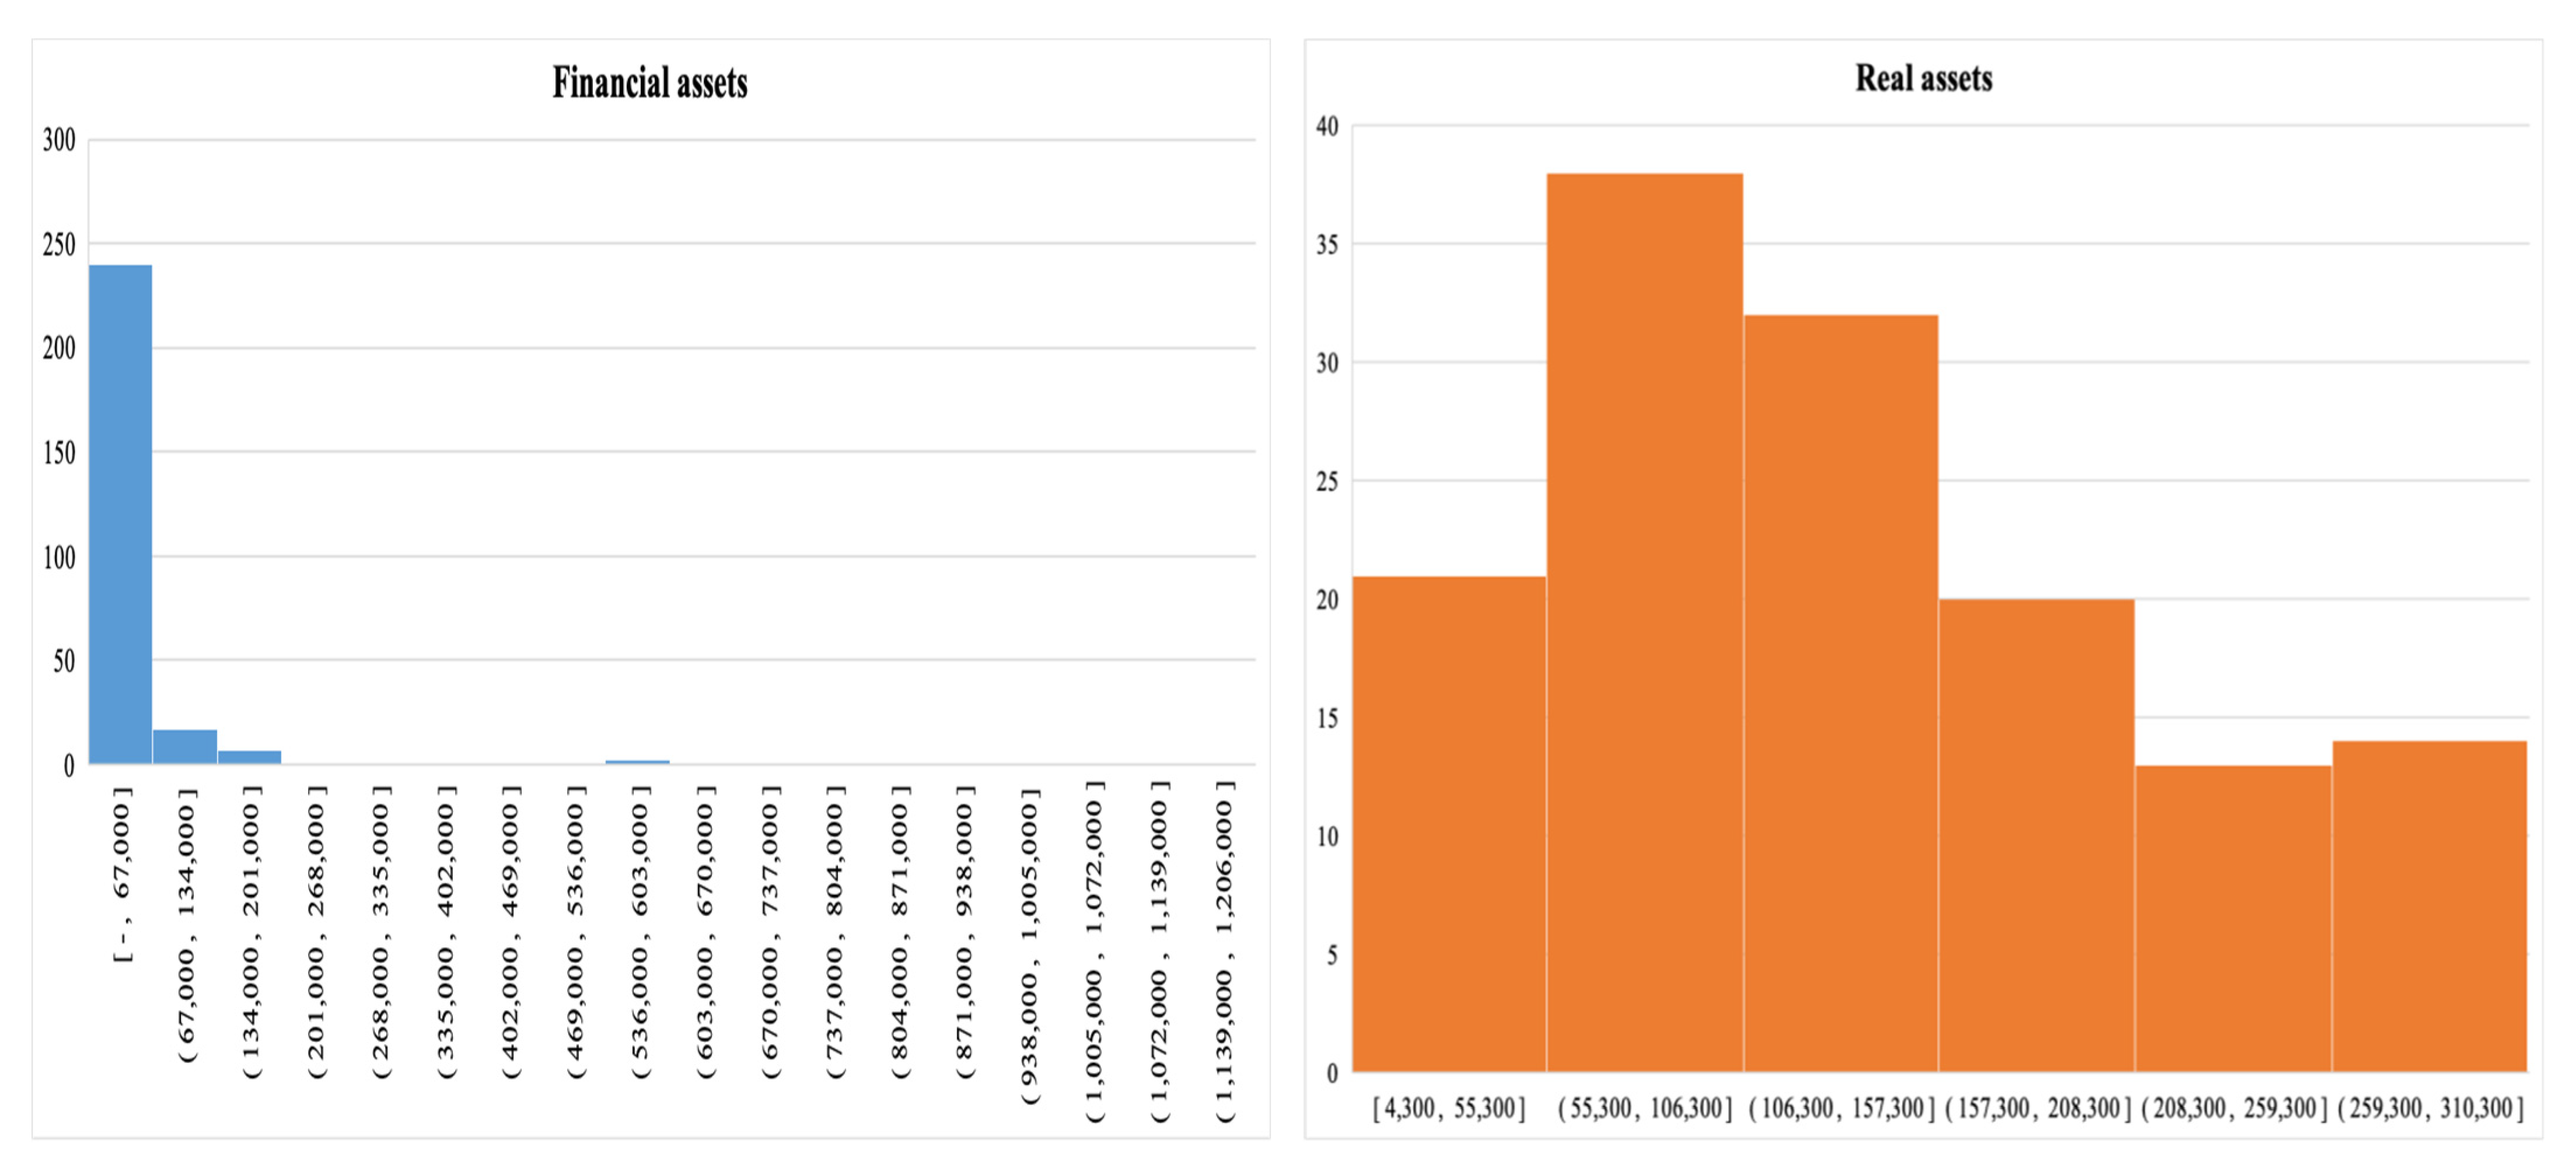
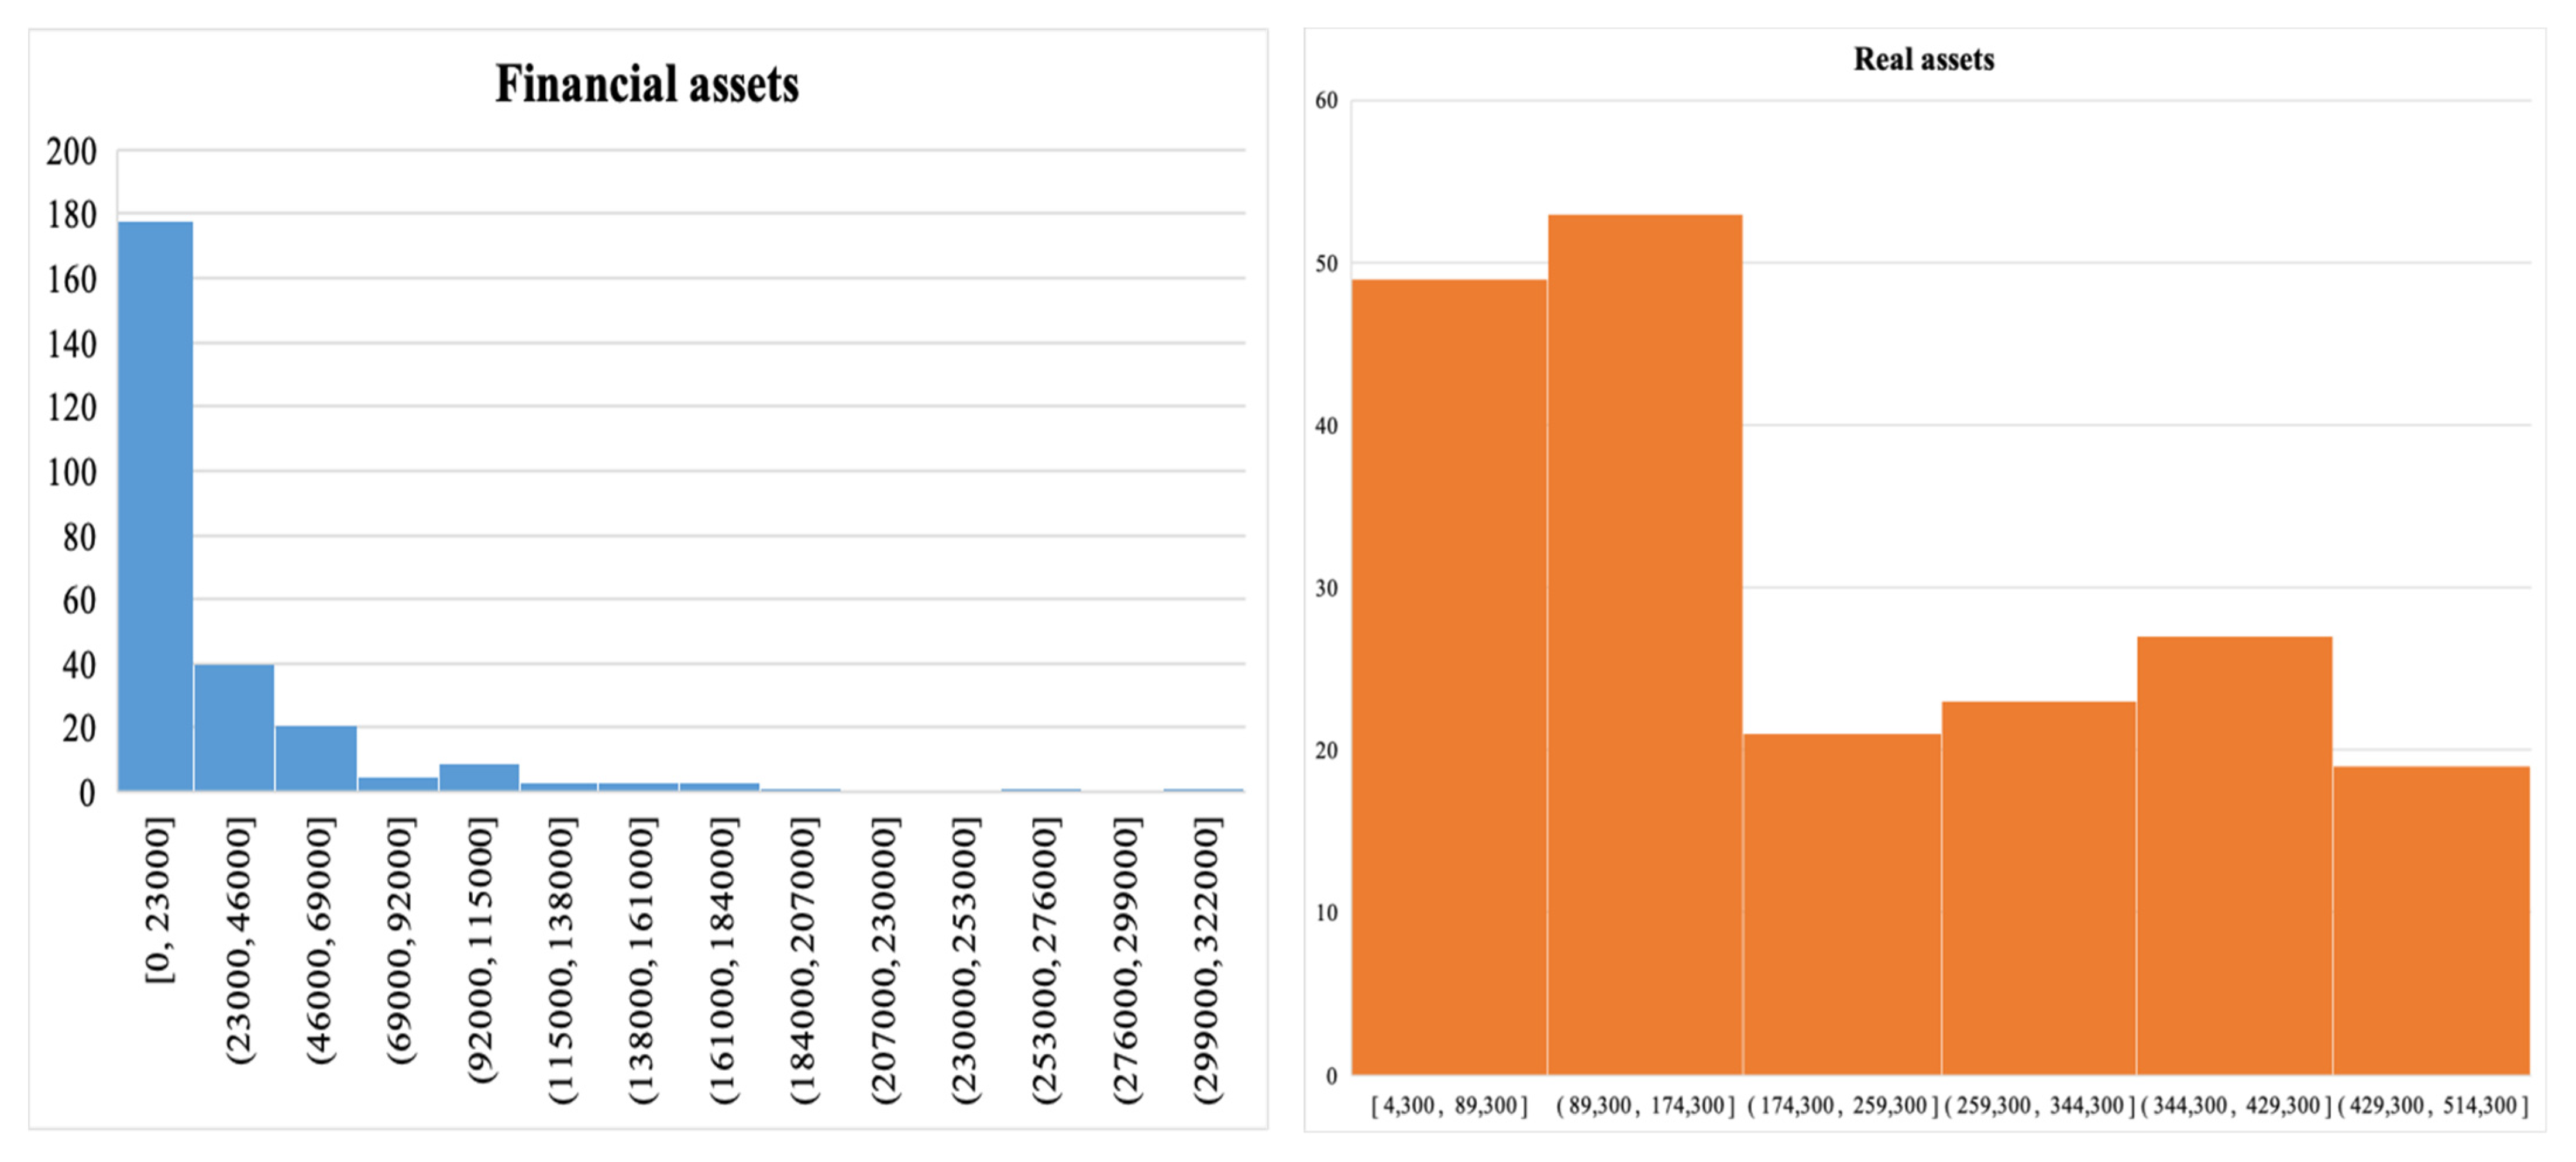
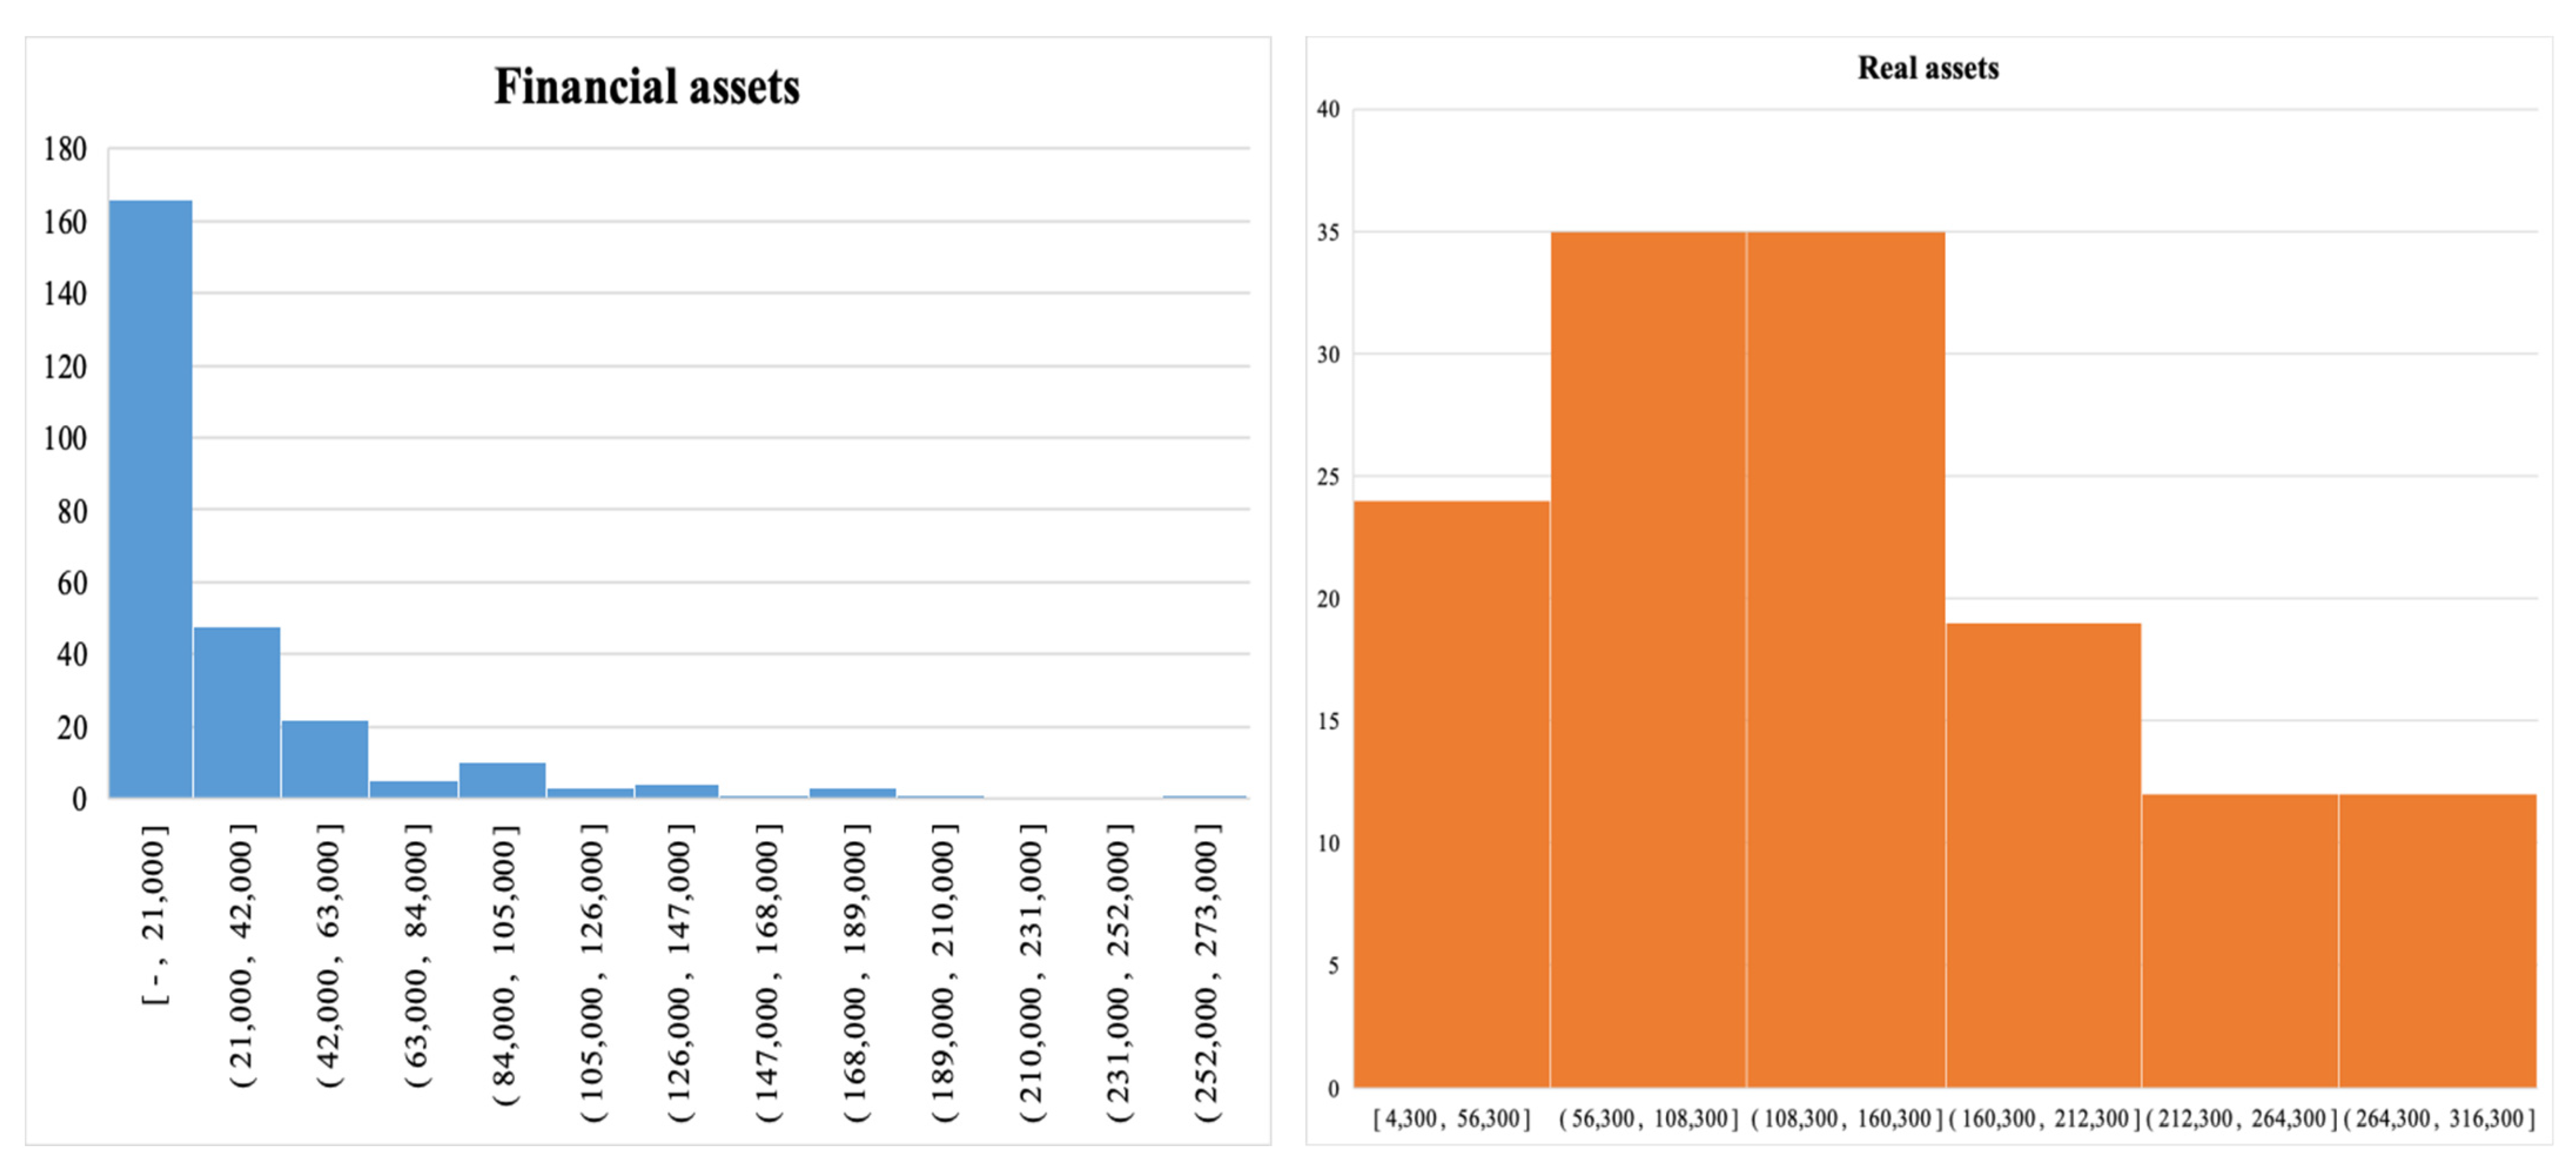
4.1.1. Statistical Description and Comparison

Table 1 provides statistics on the composition of rural household assets in the study area and across the country. From Table 1, the proportion of real and financial assets are 91.86% and 8.14%, respectively, which is in stark contrast. Compared with national conditions, local families pay more attention to actual assets, and the difference is obvious, shows that the investment willingness of the study area is extremely low as shown in Table 1 (and see Figure 3).
On one side, the real assets of rural households are reported in Table 2, indicating that real estates, durable goods, productive assets and Tibetan vessels accounted for 36.08%, 2.13%, 59.42%, and 2.38%, respectively, in the composition of real assets. The real assets held by rural families in Tibetan region are mainly real estates and productive assets. Figure 4 demonstrates the investment orientation of local residents.
On the other side, rural families in that region have an average of ¥42,449 in financial assets. The detailed composition of financial assets are cash, deposits, loans and others accounting for 10.23%, 81.84%, 7.62%, and 0.30%, respectively. Moreover, the financial assets held by these families are mainly cash and deposits. Table 3 provides the statistics for the financial assets.
It can be seen from Figure 4 and Table 3 that the investment intentions of rural households are mainly real assets, and the choice of financial assets is mainly cash and deposits. Especially inclined to bank deposits, the choice of risk assets is lower. Since cash and deposits as risk-free assets have low returns, their contribution to household property income is low. Compared with household income in other regions, there is a large gap. It will further expand the gap between urban and rural areas and is not conducive to the sustainable development especially in ethnic area.
In-depth analysis, it reveals that there are mainly the following reasons:
  • Rural households have limited idle funds
Rural households mainly rely on farming-related operations. Agricultural production has the characteristics of high inputs, high risks and low returns, which makes rural households income generally low. The limited income not only meets the family’s living and consumption needs, but also bears the education expenses of the children. It even needs to be used for increasing agricultural production and management needs, so less idle funds can be used for disposal.
The rural social security system is still not perfect, and rural households still need to set aside a portion of funds for preventive expenditures for pension and medical care. It will further squeeze the funds they can use for financial assets, especially risk asset investments, thereby restricting their financial asset investment.
2.
Rural residents have low financial literacy and lack relevant financial knowledge
Financial knowledge plays an important role in investment behavior. The increase in financial knowledge will push households into the field of risky investment and increase their allocation to risky assets [32]; On the contrary, the lack of financial knowledge will make residents misestimate their investment and financial management ability, and buy too much or not buy risky products. Some studies have shown that households with higher financial literacy had a better chance of receiving a positive investment return [33]. As farmers generally have low education level and uneven financial literacy [34,35,36], many farmers have insufficient understanding of financial assets, especially risk assets investment, and asset positioning, which often affects the accumulation of family wealth [26]. They do not have the knowledge and suitable skills to invest, and they cannot learn them. Due to the exclusion of unfamiliar things, these rural households are reluctant to invest in risky financial assets such as stocks and funds, but choose risk-free products, which leads to their inability to allocate assets reasonably and make optimal investment decisions. At the same time, financial institutions or securities companies rarely go to ethnic areas to open accounts or promote relevant knowledge.
3.
Rural residents have weak financial management awareness
Financial management is an economic activity to improve the efficiency of property. It can use financial knowledge and other financial skills to manage financial resources [37], which is very important for families to strengthen the ability to resist risks and improve the quality of life. Due to the influence of traditional concepts in rural areas especially in ethnic area and the lack of financial knowledge, rural residents have a relatively weak awareness of family wealth planning and management. It is precisely because of the lack of financial concept and awareness, many families choose to save the remaining assets in the bank to obtain a certain appreciation, but the reality is that the inflation and other uncertain factors make the funds can not preserve the value or even depreciate. Although some rural households have the concept of financial management, they can not reasonably allocate assets, do not know how to make assets to achieve higher returns, and also worry that their assets will encounter high risks due to their lack of professionalism [38].
4.
Narrow information channels in rural of ethnic areas
Due to the complexity and high risk of financial asset selection, households need to fully understand the relevant information when choosing financial assets. However, the vast rural areas of China are still in a state of information blockade and information lag. At the same time, due to the influence of economic conditions, concepts and other factors, traditional media have their own insurmountable defects in the dissemination of rural information [39], rural residents have relatively narrow access to information, and can obtain limited information, which is mainly related to agricultural production. In addition, after grasping the relevant information, it is necessary to conduct detailed analysis and processing of the information. The rural residents also have lack of sufficient information analysis capabilities, which inhibits the financial asset investment of rural households.
5.
The outlets and service coverage of financial institutions in ethnic areas is low
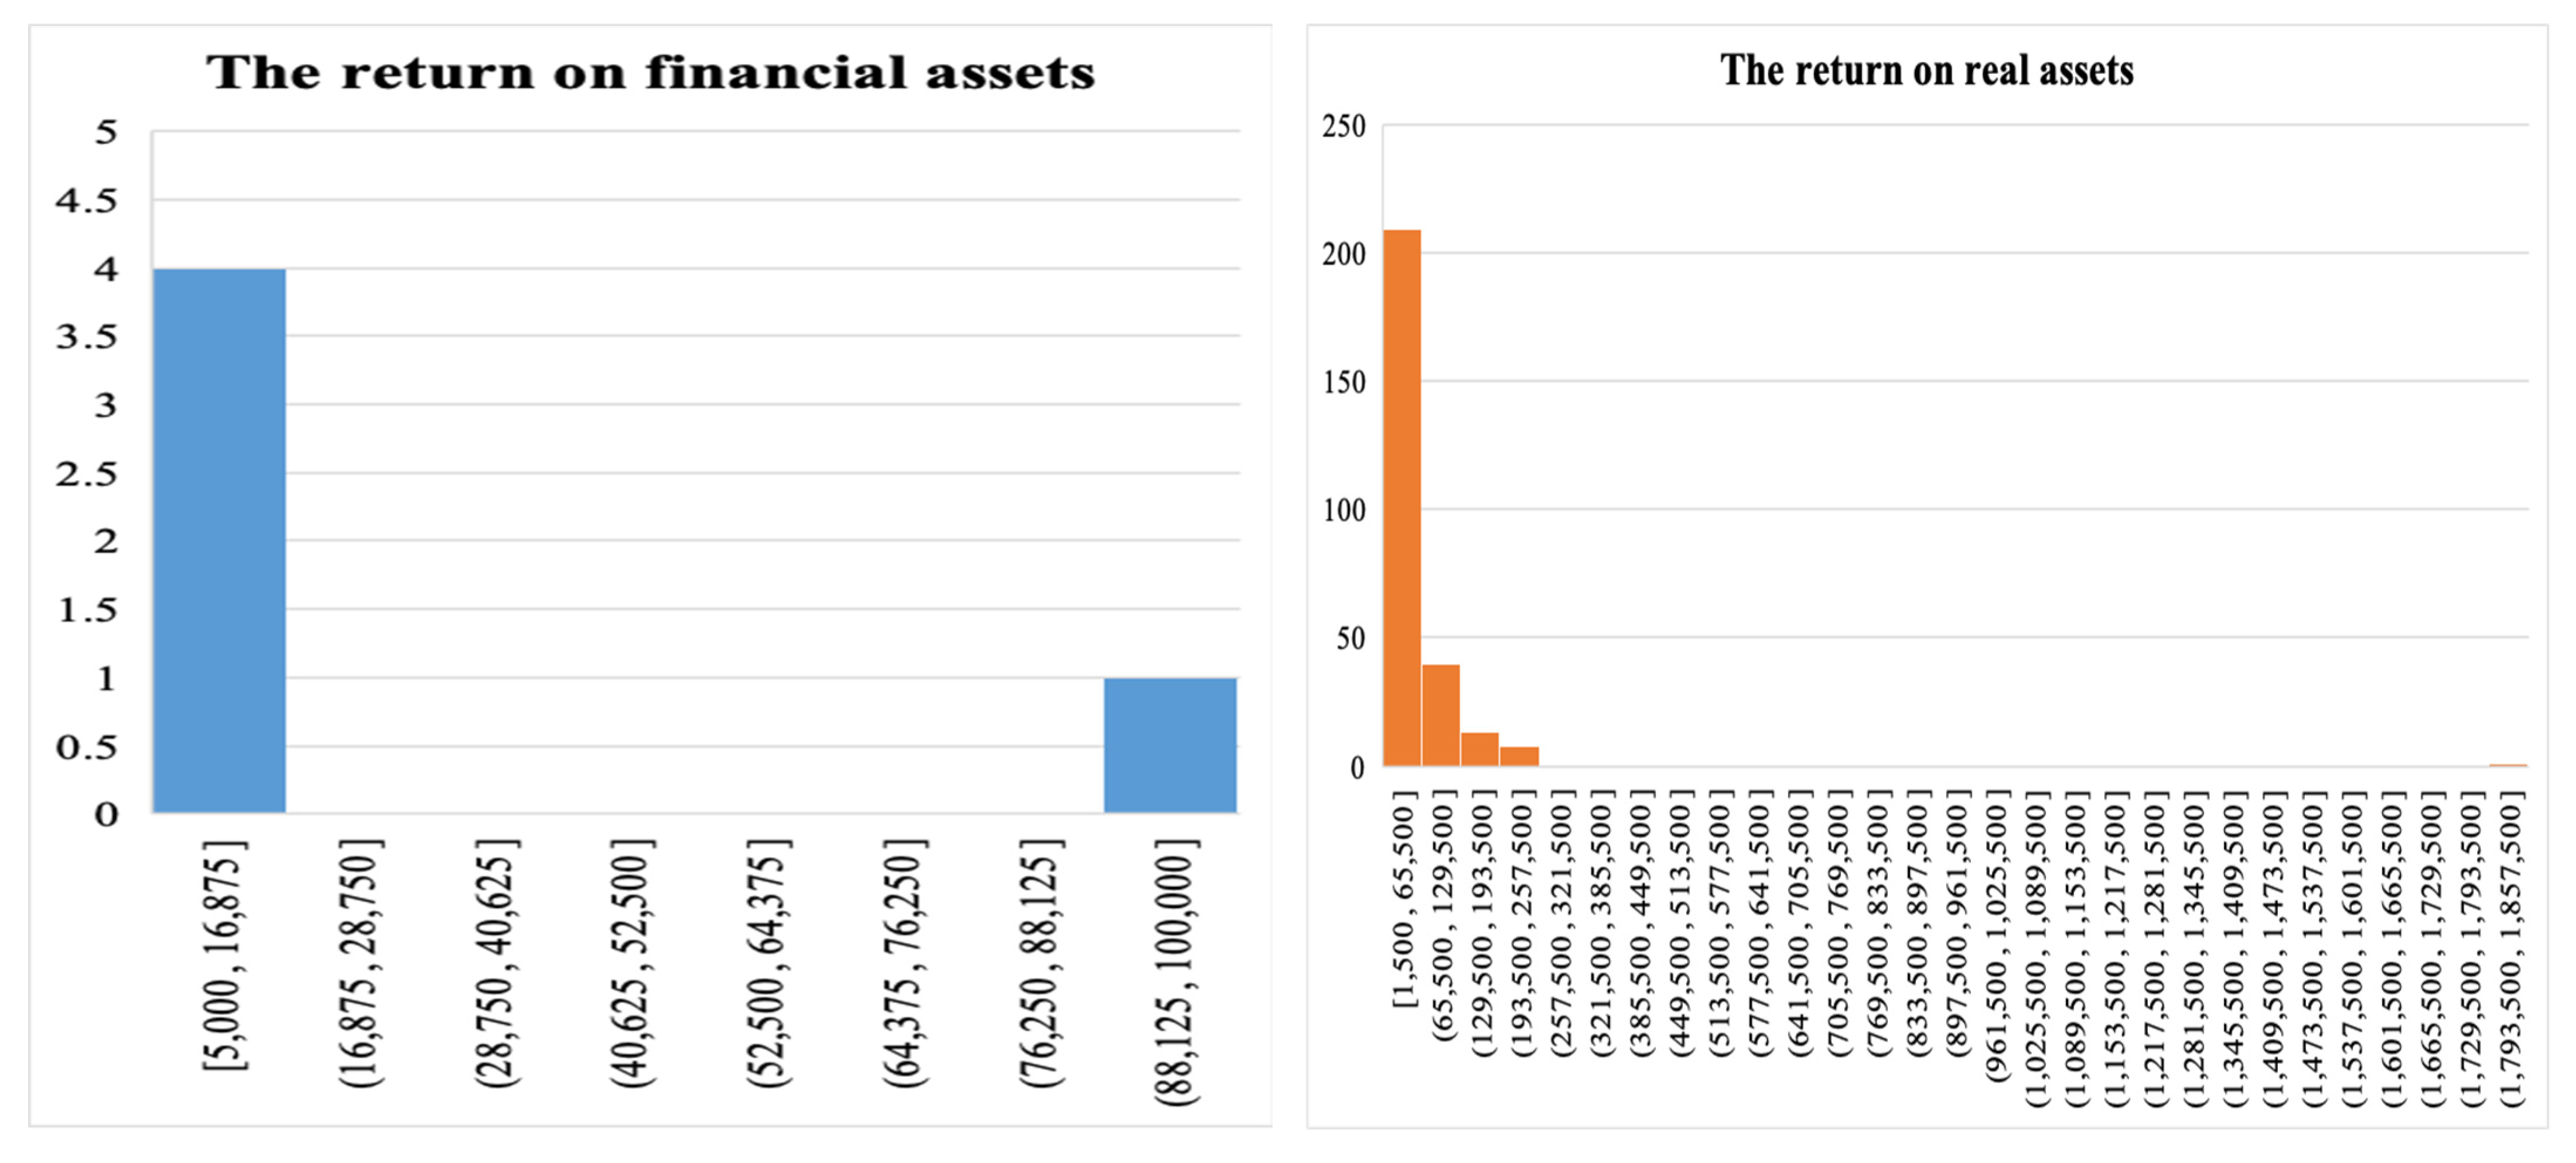
Compared with urban areas, there are fewer financial institutions in rural areas, and it is more difficult to achieve and maintain their sustainability [40]. At the same time, driven by market competition and profit maximization, the products and publicity channels of financial institutions are mostly suitable for urban families, without considering regional differences [41] and often ignoring the financial needs of farmers. At the same time, the government’s policies on rural infrastructure and assistance are not strong [42], which makes it difficult for farmers to obtain corresponding services even if they have financial asset allocation needs.
When financial institutions provide financial products and services, they mainly consider the following factors: one is the cost of providing financial products and services, including the construction cost of business outlets, labor costs, and capital costs. The second is the benefits of providing financial products and services, Sichuan Tibetan region is not adequately covered by financial services, but as it develops, it needs more financial services. Such as loan interest income, intermediary income from providing financial services, etc. The third is the risk of providing financial products and services, mainly the risk of loan default. In addition, it must also incorporate factors such as its own positioning, development strategy and marketing strategy.
From the perspective of cost, the infrastructure construction in rural areas especially ethnic area is relatively backward [43], the geographical location is far from the central city. So, the population is scattered, and the number of transactions and amounts are small. This makes the average cost of providing financial services in those areas is higher, resulting in a smaller number of financial institutions. In terms of the scope of services provided by financial institutions, many outlets only provide basic services such as deposits, withdrawals, and transfers. Due to the lack of business outlets and the single services provided, it is difficult for rural residents to obtain a full range of financial services. In addition, there are higher risks and a more unfavorable contracting environment in serving rural customers [40].
From the perspective of income, the profit of financial institutions mainly depends on the size of the transaction funds. However, due to the characteristics of agriculture is high risk and low yield, rural households’ income is low and lack of sufficient idle funds to free control. As a result, the scale of its financial needs is small, especially investment needs, which makes financial institutions often ignore the needs of rural households in product design and marketing.
All of these reasons have contributed to the results shown in the data. Rural households in ethnic areas rarely invest in financial assets. Financial assets are also mainly cash and bank deposits. If it wants to change this status quo, it should start from the above reasons and prescribe the right remedies to break them one by one.

4.1.2. Risk Status

Taking into account the main asset sources that may produce investment benefits, this study selects taking into account assets and financial assets for further analysis. China’s urban-rural dual economic system and structure have led to a huge gap between urban and rural economic development and income [44]. According to previous studies, scholars often divide the real physical assets of rural households into living consumption and production investment [19,45]. This paper considers the particularities of ethnic regions and asset composition; real assets only consider productive investment assets. Because living consumption assets are few and the liquidity is extremely weak, so it is ignored, and only production investment assets are used for calculation. Financial assets consider two types of security and risk [21], but the data is mainly composited by security financial assets of cash and bank deposits. The box figure is used to analyze and illustrate the potential risks based on the survey data.
The dataset of 271 valid questionnaires is analyzed by box figure. The comparison of the total amount of financial assets and physical assets in Tibet was shown in Figure 5. The total amount of physical asset in Tibetan areas is mostly within 500,000 Yuan, and the total amount of financial assets is relatively low (see Figure 5). For convenient comparison, the data larger than 500,000 Yuan is removed, and the comparison outcomes are shown in Figure 6. It can be seen from Figure 6, showing that the total amount of physical assets in Tibet is more concentrated within 300,000 Yuan, while the total amount of financial assets is concentrated within 100,000 Yuan. In order to analyse the distribution of the two intuitively, the data larger than 300,000 Yuan is removed, and the comparison outcomes are in Figure 7.
From the detailed comparison of financial assets and real assets in Figure 7 and Figure 8, it can be seen that the risk appetite of rural households in ethnic areas is obvious. Because the economic development in ethnic areas is relatively underdeveloped, rural households have limited income and less idle funds. Therefore, residents in this area have lower risk tolerance, high risk aversion, and an obvious preference for investing risk-free assets. In order to avoid uncertain market risks and credit risks, they are more inclined to invest real assets so that rural households can directly profit through production and business activities. In addition, lack of professional knowledge of finance is another key influencing factor for them to keep away from high-risk financial assets. The systematic risks mainly come from market variation and the risk of asset liquidity, even policy change will also make them encounter uncertainties in the financial environment leading to investment risk. Consequently, it is necessary to consider a reasonable investment portfolio to diversify risks and increase property income.

4.2. Investment Portfolio

An investment portfolio is an effective way to avoid risk through the rational allocation of risky assets and risk-free assets to diversify risks and stabilize asset returns.

4.2.1. Family Income

According to the division of disposable income of rural households according to China Rural Statistical Yearbook [46], the income of rural households mainly includes wage income, operational income, property income, and transfer income. In general, operating income occupies the maximum proportion (for example, for Sichuan rural residents in 2020, operating income accounted for 38.6%, wage income, property income, and transfer income accounted for 31.2%, 3.2%, and 26.9%%, respectively), and productive assets and bank deposits, as the main asset sources, can produce investment benefits presented by operating and property incomes. Through the survey data analysis, results show that the statistics for productive assets and bank deposits are ¥35,170 and ¥2866, respectively.

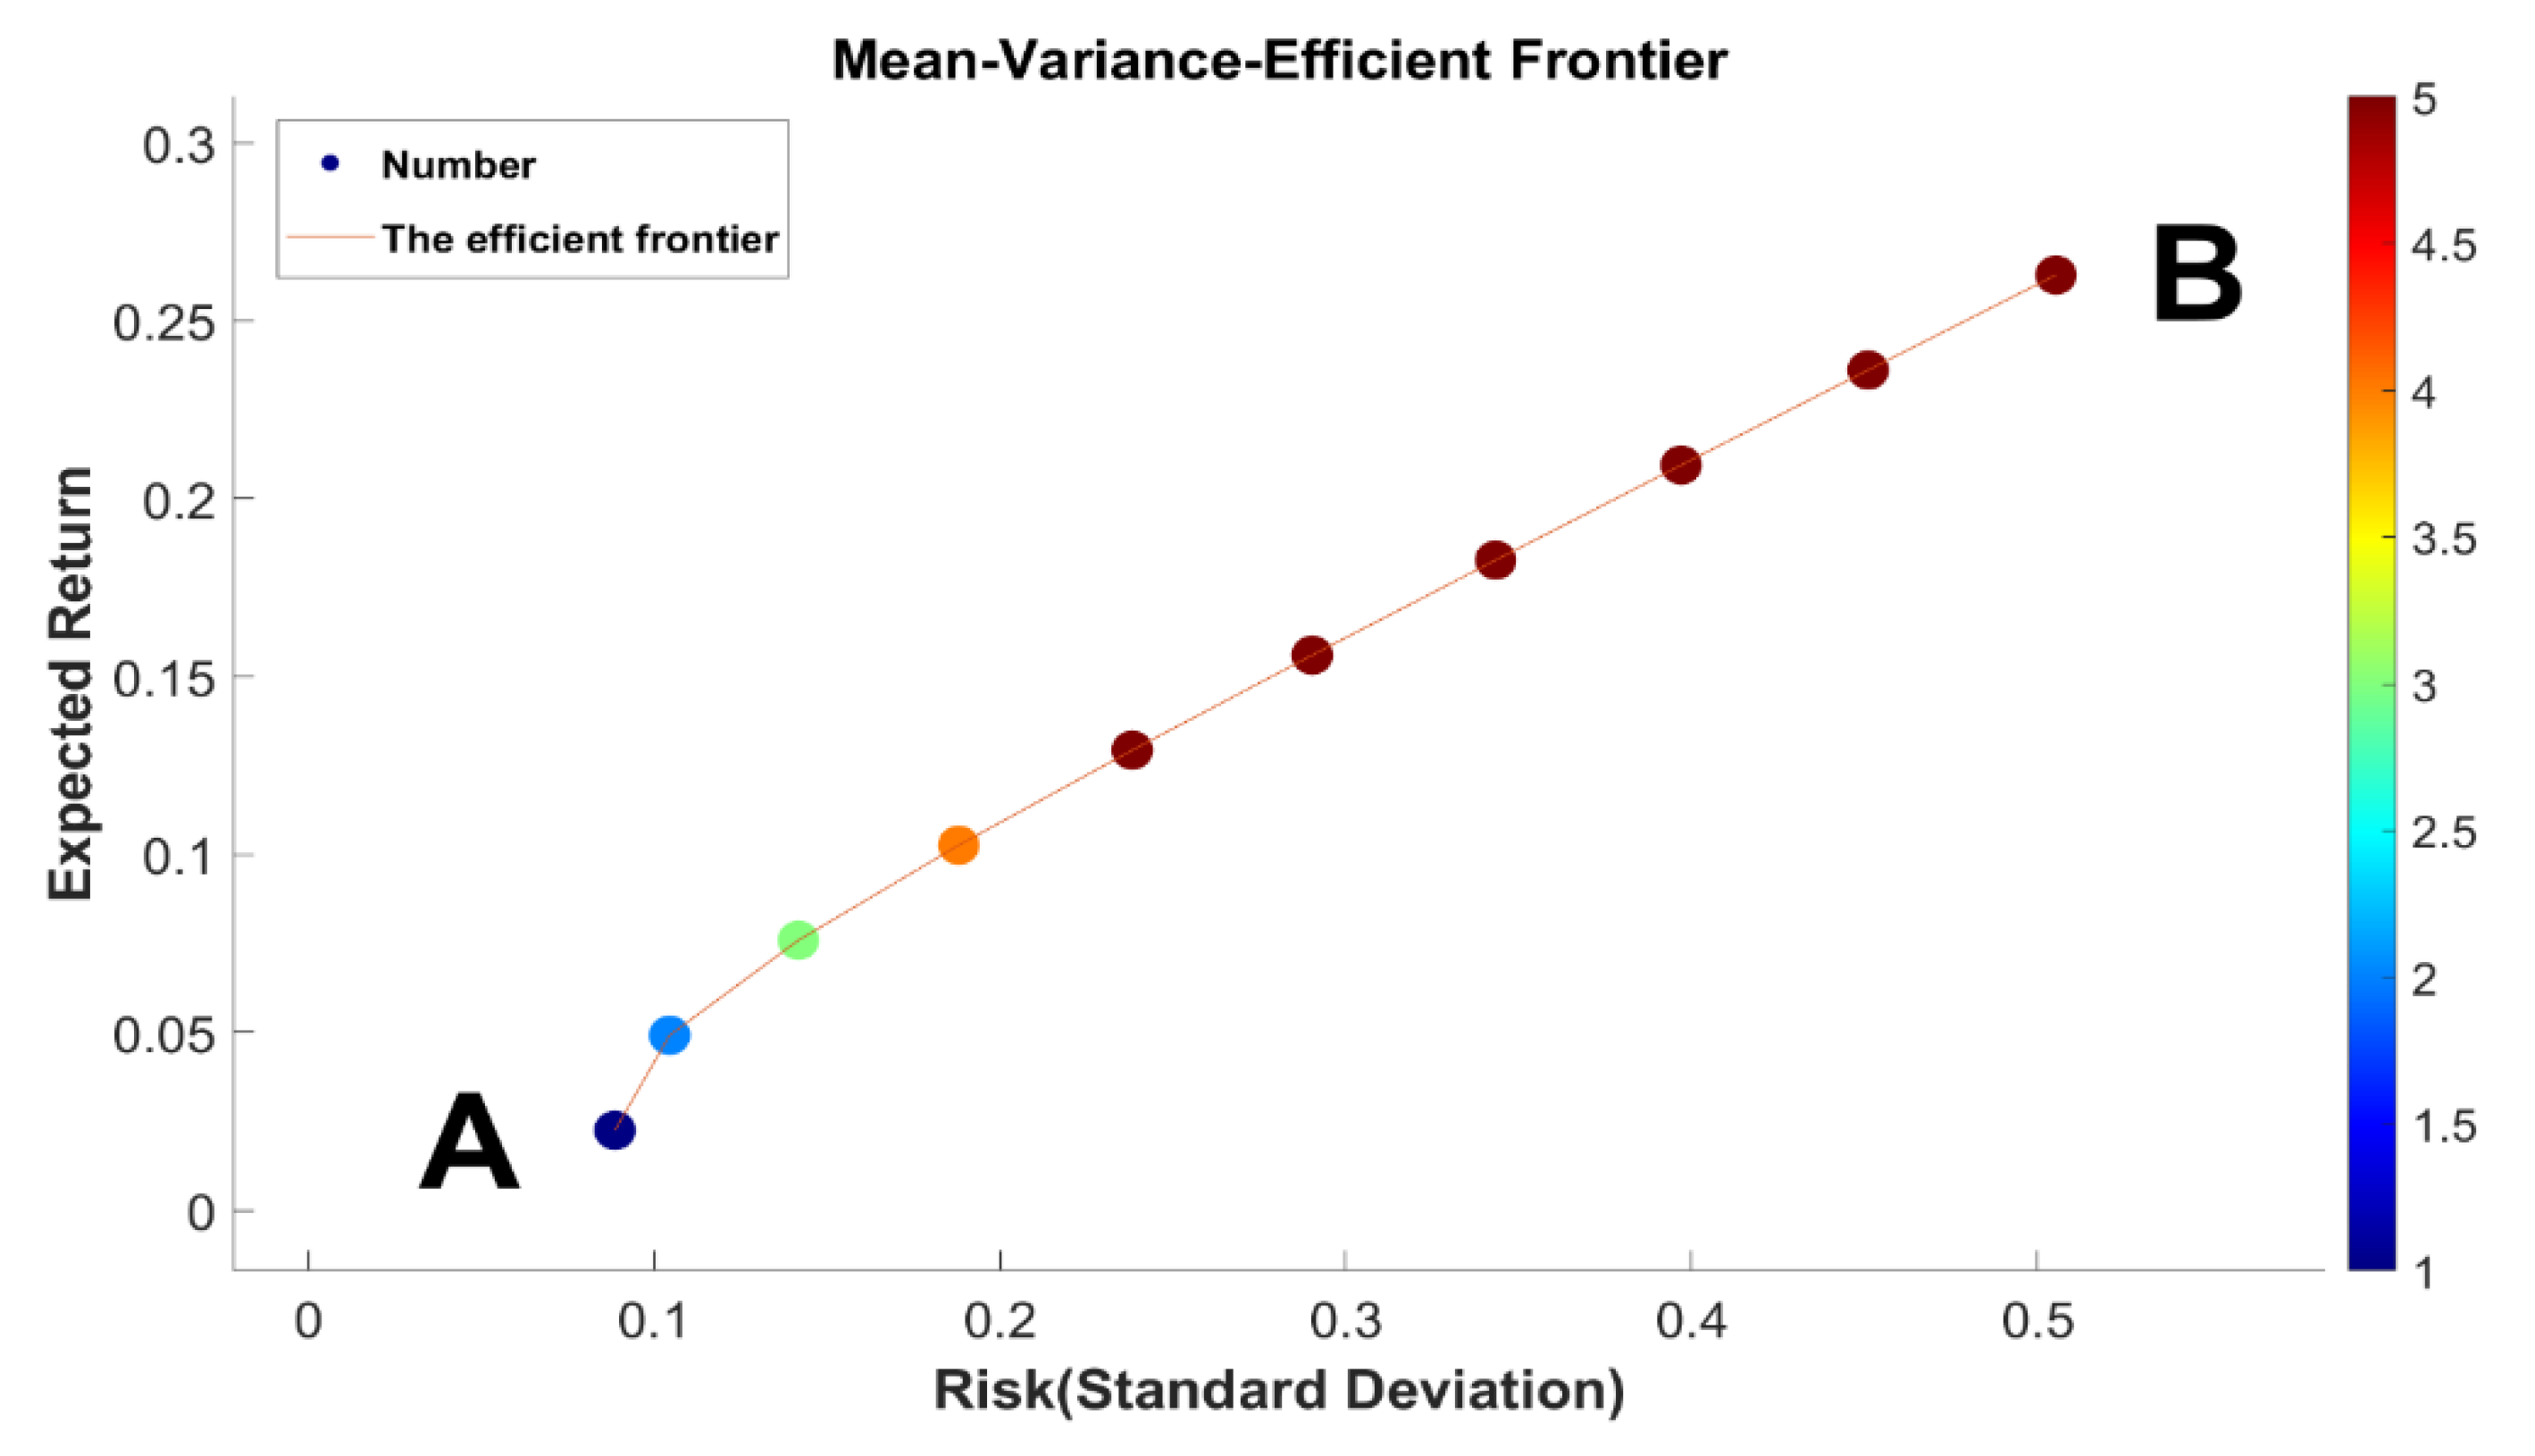
4.2.2. Optimization Model

Mean-variance portfolio model is a venture capital model proposed by H. M. Markowitz in 1952, which is mainly used to solve the problem of market investors in determining the risk and return of portfolio investment and how to balance these two indexes for asset allocation. Markowitz’s portfolio theory has not only revealed the determinants of portfolio risk, but more importantly, it also revealed the important conclusion that ‘the expected return of an asset is determined by its own risk’, namely asset prices (single) assets and portfolio pricing by the risk size, a single asset prices determined by its variance or standard deviation, asset prices are determined by its covariance. This model lays a foundation for modern securities investment theory.
The objective function:
min σ 2 ( r p ) =     x i y i COV ( r i , r j )
r p =   x i y i
Restrictions:
1 =   x i   ( Allow   short-selling )  
1 =   x i ,   x i   >   0   ( Short-selling   is   not   allowed )
where —portfolio returns; —returns on assets; —investment proportion of assets; —variance of portfolio investment (i.e., total portfolio risk); and —the covariance between two rates of return on assets.
In addition, in the investment process, each investor will choose the investment portfolio according to his or her preference for returns and risks. They hope to maximize the expected utility of investors; that is, investment activities must follow a utility function of returns and risks. According to the analysis of classical economics, this utility function uses the mean-variance to express the size and form of the risk-return ratios, which is called the indifference curve (IDC) in the return-standard deviation plane. Each indifference curve represents the degree of preference of different investors for the expected rate of return and standard deviation. In Figure 9, Figure 9a represents the indifference curve family under different expected returns and standard deviation preferences. Once the curve is determined, the optimal portfolio can be determined by the tangent point T between the family of indifference curves and the effective frontier. The tangent point T is the portfolio with the greatest utility among all portfolios, as shown in Figure 9b).

5. Findings and Limitations

5.1. Findings

This paper aims to explore how these impacts can be overcome by providing effective green and sustainable planning strategies through risk analysis and sound investment portfolios. This proves the unreasonable composition of farmers’ assets in ethnic areas. The study found that most households have a high preference for physical assets, which may be due to their risk attitude and resilience. From the perspective of farmers, in order to adapt to suboptimal environmental conditions, farmers should diversify their livelihood strategies and rationally allocate investment portfolios. The proportions of physical assets and financial assets in the sample are 91.86% and 8.14%, respectively, forming a sharp contrast, indicating that the investment willingness in the study area is extremely low. On the one hand, the real estate, durable goods, productive assets, and Tibetan ships owned by farmers accounted for 36.08%, 2.13%, 59.42%, and 2.38% of the physical assets, mainly real estate and productive assets. On the other hand, the detailed composition of financial assets is cash, deposits, loans, and others, accounting for 10.23%, 81.84%, 7.62%, and 0.30%, respectively, mainly cash and deposits. In addition to this, the study found that rural areas have fewer financial institutions.
This paper also proposes a systematic approach to analyzing investment risks for rural households and even communities in Tibetan areas of Sichuan, China. The study examined the assets of 271 rural households in the study area. Statistically describe their asset composition and comparisons with nationwide. Based on the main sources of assets that may generate investment returns, this research selects productive assets and bank deposits. On the basis of survey data, it is illustrated by a block diagram to analyze potential risks. Calculate and discuss risk-averse portfolios based on the Markowitz model using respondents’ income data and corresponding fit functions. The empirical research results show that the asset structure of farmers in ethnic areas such as Tibetan areas still needs to be improved. Most local households prefer physical assets, especially productive assets, with less financial assets. They avoid risks with the low resistance of these families. Despite relying on the country’s strong national protection policies, these households still need a moderate investment and a reasonable investment portfolio to improve their economic situation. In addition, the analysis also provides useful strategic suggestions for the green and sustainable planning and operation of financial institutions and people’s livelihood in China’s ethnic areas, such as Sichuan Tibetan areas.

5.2. Limitations

A limitation of this study is the quality of the questionnaire results. The first is to conduct research on farmers in the form of questionnaires. Due to factors such as farmers’ cultural level, personal wishes, etc., integrity problems may be caused, resulting in inaccurate results of the questionnaires. Therefore, the study excluded some questionnaires that may have problems, and there are certain limitations in the improvement in the overall quality of the questionnaires. Second, due to the impact of the epidemic, the travel of the survey has become difficult, and it is difficult to conduct research in some locations. The location of this research is limited, and a more comprehensive survey cannot be conducted. Therefore, the main article selects 8 Tibetan counties in the Sichuan Tibetan area as the sample area and selects 16 local representative administrative villages as the survey area. Although the general representativeness of the research results is guaranteed, there is still room for improvement in the comprehensiveness of the data.
First is the limitation of potential risks. This study cannot predict or quantify each potential risk. In modern society, any investment has risks. Whether it is a physical investment or financial investment, systemic risk mainly includes three aspects: policy risk, legal risk, and market risk. Policy risks come from changes in national economic development goals. Benjamin and Cornell [47] used an estimated New Keynesian model to analyze the role of policy risk in explaining business cycles. Fiscal policy may drastically alter the existing economic order, thereby adversely affecting existing investments and causing huge losses [48]. The second is the legal risk of some economic activities. Wasiuzzaman and Rahman [49] found that legal risk has a significant impact on investor decision making. However, these risks are difficult for ordinary people to realize, so they may violate national laws and regulations. Once it occurs, it will fall into legal risk, lose money, and bear legal responsibility. Finally, there are the most important and common market risks. Market risks arising from market changes are difficult to predict in many cases. Revenue often changes with cyclical changes in the market or industry. Moreover, the fluctuation of the economic cycle is determined by the cyclical cycles and fluctuations of the social economy. Richer et al. [50] used panels of different sizes to identify fluctuation patterns along the timeline and across sectors and found that post-war monetary policy tried to stabilize the U.S. economy. The systemic risks described above cannot actually be avoided through investment portfolios. In ethnic areas such as Tibetan areas, whether it can be controlled depends on special support policies.
Third, the limitations of some unique risks, such as liquidity risk and credit risk. Liquidity risk arises from the lack of liquidity of assets that cannot be realized in a timely manner at their inherent fair value. Credit risk includes not only the risk caused by the default of the transaction entity but also the indirect default risk caused by the market’s concerns about some potential default risks caused by the price fluctuation of related assets. Chaibi and Ftiti [51] found that, compared to Germany, the French economy is more susceptible to bank-specific determinants. This highlights the impact of the type of economy (bank-based or market-based) on credit risk. Unsystematic risks can be resolved. Due to special climate, topography, and geological conditions, natural risks also play an important role in Tibetan areas. Once the land is abnormal, the income of farmers will often be affected, and the willingness and choice of investment will also change accordingly. The changes in natural factors cannot be predicted, and quantification is also one of the limitations. In the actual financial market, investors not only need to deal with the risks arising from physical assets and financial assets themselves but also need to address the labor income risks brought about by the flow of household labor in the context of the gradual transfer of rural labor to non-labor. The agriculture industry makes the portfolio more efficient. Catherine, ref. [52] estimated a life-cycle model of portfolio selection that found that countercyclical labor income risk has a limited impact on aggregate demand for equity, as it does not significantly affect wealthy households’ portfolios. Uncertainties in investor labor income and entrepreneurial income also affect the utility of long-term investment portfolios. As an important part of background assets, labor income also has an important impact on the construction of investors’ long-term investment portfolios. Therefore, the change in labor income is also one of the limitations of the study.
In addition to this, the optimal portfolio is also one of the limitations. Under the above circumstances, this study finds that more attention should be paid to the business risks of local households. For example, implement an efficient portfolio based on the household’s resilience to risk. According to the empirical results of the efficient frontier of the investment portfolio in Table 4 and Figure 10, it is suggested that local households can choose the corresponding scheme according to their own risk attitude and resistance capacity. For example, if they are willing to compromise with risk, then point 5 in Table 4 will be satisfied, and they will choose No. 1 in Table 4 to completely avoid the risk.

6. Conclusion and Policy Implications

6.1. Concluding Remarks

To measure investors’ preference for the expected rate of return and standard deviations, economists introduced the risk aversion coefficient A to indicate investors’ aversion to risk. The higher the degree of risk aversion of investors, the greater the value of A, so the greater the hindrance to venture capital. The portfolio utility function is as follows, and its independent variables are the expected rate of return and the variance of the rate of return:
U = r p A σ 2 ( r p ) / 2
where U is the utility value. As shown in Equation (5), the utility will increase as the expected rate of return increases and decrease as the risk decreases. The impact of portfolio investment return variance on utility depends on the risk aversion coefficient A.
Process 245 sets of data obtained from the investigation of rural households’ assets and income in the Sichuan Tibetan area using the ratio of income amount to asset investment as the rate of return. The histogram was used to analyse the data, and 239 groups of effective data were obtained by removing the abnormal value of return rate greater than 400%. The return on real financial assets and return on real assets are shown in Figure 10.
According to the solution model, portfolio returns and portfolio risks of different investment ratios of the two assets can be obtained. Meanwhile, according to the utility function, the utility of different portfolios can be obtained, as shown in Table 4. The portfolio returns and portfolio risks of different investment ratios of the two assets can be obtained. At the same time, according to the utility function, the utility of different investment portfolios can be obtained, as shown in Table 4. The effective boundary of the investment portfolio is shown in Figure 10.
The effective boundary curves of the two combinations can be clearly seen in Figure 9 and Figure 11. The X-axis is the risk, and the Y-axis is the return. Point A corresponds to No. 1 in Table 4; that is, the proportion of investment in financial assets and physical assets is 0.96:0.04. We can see that the risk of the investment portfolio at this point is the lowest, which is 0.8%, and the corresponding return is also the lowest, which is 2.2%. Point B corresponds to No. 10 in Table 4, the proportion of investment in financial assets and physical assets is 0:1, and the risk at this point is the highest at 25.5%, and the maximum corresponding return is 26.3%. The higher the risk tolerance, the higher the return. However, for different investors, due to the different degrees of risk aversion, the utility of the same portfolio is different; that is, the risk aversion coefficient A is different. Therefore, investors need to select the portfolio with the maximum utility according to the value of their risk aversion coefficient A when selecting the portfolio.

6.2. Implications

Based on the empirical results, this study offers some suggestions to improve the welfare of rural households in ethnic areas. Firs at the individual level, local families should be encouraged to optimize the structure of their assets and enhance the diversity of their asset portfolios. In terms of real assets, land is an important productive resource in rural areas. Rural households should make effective use of land resources to improve their livelihood. Secondly, they are encouraged to actively buy insurance for productive assets to reduce investment risk. For financial assets, they are encouraged to save rationally to maintain the liquidity of their family assets and improve their ability to resist risk on one hand. On the other hand, local families are encouraged to invest in medium and low-risk financial products such as bonds and funds so that they can obtain relatively stable property income and accumulate family wealth. Second, for financial institutions, those in ethnic area such as the Tibetan region should be encouraged to actively expand their financial network and coverage of financial services and improve their willingness and ability to support agriculture. Financial institutions should innovate and design targeted financial products and services based on the characteristics of asset composition for local families and risk resistance capacity. Simultaneously, the opportunity must be seized to expand coverage of the communication network in those areas and actively promote Internet finance and mobile payment services there. It is helpful to break all types of temporal and spatial barriers that prevent local families from participating in financial activities and strive to improve the availability of financial services for them.
Although the research method is original and the findings are meaningful, there still exists room for potential improvements. Future studies include: (a) considering more detailed types of rural households; (b) introducing internet public opinion to rich the data source for further risk analysis of investment; and (c) employing other methods to identify risk factors.

Author Contributions

Conceptualization, Y.L. and Q.W.; methodology, Y.L. and L.C.; software, Q.W., Y.L., Q.W., L.C. and A.A.C.; formal analysis, Y.L.; investigation, Q.W.; resources, L.G.; data curation, Y.L.; writing—original draft preparation, Y.L.; writing—review and editing, A.A.C.; visualization, L.G.; supervision, A.A.C. and L.G.; project administration, Y.L.; funding acquisition, Y.L. and L.G. All authors have read and agreed to the published version of the manuscript.

Funding

This research was funded by the Major Program of the National Social Science Foundation of China (Grant No.18BMZ126), the Sichuan Province Cyclic Economy Research Center (Grant No. XHJJ-2105), the Research Center of Sichuan County Economy Development (Grant No. xy2021012), and the Nation-al Natural Science Foundation of China (Grant No.72104165).

Institutional Review Board Statement

Not applicable.

Informed Consent Statement

Not applicable.

Data Availability Statement

Not applicable.

Conflicts of Interest

The authors declare no conflict of interest.

References

  1. Chen, L.; Chen, H.; Zou, C.; Liu, Y. The Impact of Farmland Transfer on Rural Households’ Income Structure in the Context of Household Differentiation: A Case Study of Heilongjiang Province, China. Land 2021, 10, 362. [Google Scholar] [CrossRef]
  2. Liu, K.; Huisingh, D.; Zhu, J.; Ma, Y.; O’Connor, D.; Hou, D. Farmers’ perceptions and adaptation behaviours concerning land degradation: A theoretical framework and a case-study in the Qinghai–Tibetan Plateau of China. Land Degrad. Dev. 2018, 29, 2460–2471. [Google Scholar] [CrossRef]
  3. Li, H.; Song, W. Spatiotemporal distribution and influencing factors of ecosystem vulnerability on Qinghai-Tibet Plateau. Int. J. Environ. Res. Public Health 2021, 18, 6508. [Google Scholar] [CrossRef]
  4. Zhao, J.; Fan, C. Risk shock, rural household assets and persistent poverty: An empirical analysis based on CHNS microdata. Agric. Technol. Econ. 2021, 10. [Google Scholar] [CrossRef]
  5. Xia, L. Rural financial ecological environment in Ningxia: Challenges and optimization paths. Ningxia Soc. Sci. 2021, 6, 130–135. [Google Scholar]
  6. Cao, Y.; Bai, Y.; Zhang, L. The impact of farmland property rights security on the farmland investment in rural China. Land Use Policy 2020, 97, 104736. [Google Scholar] [CrossRef]
  7. Niu, G.; Yu, L.; Fan, G.-Z.; Zhang, D. Corporate fraud, risk avoidance, and housing investment in China. Emerg. Mark. Rev. 2019, 39, 18–33. [Google Scholar] [CrossRef]
  8. Shi, X.; He, Z. Housing demolition and financial market investment: Evidence from Chinese household data. Appl. Econ. 2022, 54, 4213–4226. [Google Scholar] [CrossRef]
  9. Jia, D.; Li, R.; Bian, S.; Gan, C. Financial planning ability, risk perception and household portfolio choice. Emerg. Mark. Financ. Trade 2021, 57, 2153–2175. [Google Scholar] [CrossRef]
  10. Jacoby, H.G.; Li, G.; Rozelle, S. Hazards of expropriation: Tenure insecurity and investment in rural China. Am. Econ. Rev. 2002, 92, 1420–1447. [Google Scholar] [CrossRef]
  11. Guo, C.; Wang, X.; Yuan, G. Digital finance and the efficiency of household investment portfolios. Emerg. Mark. Financ. Trade 2021, 58, 2895–2909. [Google Scholar] [CrossRef]
  12. Duan, W.; Shen, J.; Hogarth, N.J.; Chen, Q. Risk preferences significantly affect household investment in timber forestry: Empirical evidence from Fujian, China. For. Policy Econ. 2021, 125, 102421. [Google Scholar] [CrossRef]
  13. Wang, F.; Zheng, H.; Wang, X.; Peng, W.; Ma, D.; Li, C. Classification of the relationship between household welfare and ecosystem reliance in the Miyun Reservoir Watershed, China. Sustainability 2017, 9, 2290. [Google Scholar] [CrossRef]
  14. Xie, Y.; Jin, Y. Household wealth in China. Chin. Sociol. Rev. 2015, 47, 203–229. [Google Scholar] [CrossRef] [PubMed]
  15. Li, S.; Wei, Z.; Ding, S. Empirical analysis on the inequality and the reason of China residents’ property distribution. Econ. Res. J. 2005, 6, 4–15. [Google Scholar]
  16. Chen, Z.; Xiong, P.; Huang, Z. The asset management industry in China: Its past performance and future prospects. J. Portf. Manag. 2015, 41, 9–30. [Google Scholar] [CrossRef]
  17. Chen, J.; Hardin III, W.; Hu, M. Housing, wealth, income and consumption: China and homeownership heterogeneity. Real Estate Econ. 2020, 48, 373–405. [Google Scholar] [CrossRef]
  18. Mulliner, E.; Malys, N.; Maliene, V. Comparative analysis of MCDM methods for the assessment of sustainable housing affordability. Omega 2016, 59, 146–156. [Google Scholar] [CrossRef]
  19. Guiso, L.; Jappelli, T.; Haliassos, M. Household Portfolios: An International Comparison. 2000. Available online: https://papers.ssrn.com/sol3/papers.cfm?abstract_id=245805 (accessed on 10 September 2022).
  20. Xu, D.; Ma, Z.; Deng, X.; Liu, Y.; Huang, K.; Zhou, W.; Yong, Z. Relationships between land management scale and livelihood strategy selection of rural households in China from the perspective of family life cycle. Land 2020, 9, 11. [Google Scholar] [CrossRef]
  21. Palia, D.; Qi, Y.; Wu, Y. Heterogeneous background risks and portfolio choice: Evidence from micro-level data. J. Money Credit Bank. 2014, 46, 1687–1720. [Google Scholar] [CrossRef]
  22. Song, Y.; Wu, W.; Zhou, G. Inequality of opportunity and household risky asset investment: Evidence from panel data in China. China Econ. Rev. 2020, 63, 101513. [Google Scholar] [CrossRef]
  23. Cui, Y.; Geobey, S.; Weber, O.; Lin, H. The impact of green lending on credit risk in China. Sustainability 2018, 10, 2008. [Google Scholar] [CrossRef] [Green Version]
  24. Song, X.; Li, L.; Xiao, L. Review of research on credit risk management for rural credit cooperatives. J. Risk Anal. Crisis Response 2017, 7, 21–26. [Google Scholar] [CrossRef]
  25. Markowitz, H. The utility of wealth. J. Political Econ. 1952, 60, 151–158. [Google Scholar] [CrossRef]
  26. Lu, X.; Xiao, J.; Wu, Y. Financial literacy and household asset allocation: Evidence from micro-data in China. J. Consum. Aff. 2021, 55, 1464–1488. [Google Scholar] [CrossRef]
  27. Li, J.; Li, Q.; Wei, X. Financial literacy, household portfolio choice and investment return. Pac.-Basin Financ. J. 2020, 62, 101370. [Google Scholar] [CrossRef]
  28. Han, H.; Si, F. How does the composition of asset portfolios affect household consumption: Evidence from China based on micro data. Sustainability 2020, 12, 2946. [Google Scholar] [CrossRef]
  29. Choi, H.-S.; Min, D. Efficiency of well-diversified portfolios: Evidence from data envelopment analysis. Omega 2017, 73, 104–113. [Google Scholar] [CrossRef]
  30. Wang, P.; Yan, J.; Hua, X.; Yang, L. Determinants of livelihood choice and implications for targeted poverty reduction policies: A case study in the YNL river region, Tibetan Plateau. Ecol. Indic. 2019, 101, 1055–1063. [Google Scholar] [CrossRef]
  31. Liu, Y.; Liu, J.; Zhou, Y. Spatio-temporal patterns of rural poverty in China and targeted poverty alleviation strategies. J. Rural Stud. 2017, 52, 66–75. [Google Scholar] [CrossRef]
  32. Sheng, Z.; Cai, T. Financial experience, Financial literacy and Household venture capital: An analysis based on the 2017 China Household Financial Survey (CHFS) data. J. Southeast Univ. (Philos. Soc. Sci. Ed.) 2021, 23, 79–88, 151. [Google Scholar]
  33. Chu, Z.; Wang, Z.; Xiao, J.; Zhang, W. Financial Literacy, Portfolio Choice and Financial Well-Being. Soc. -Dicators Res. 2017, 132, 799–820. [Google Scholar] [CrossRef]
  34. Kebede, M.; Kuar, J. Financial literacy and management of personal finance: A review of recent literatures. Res. J. Financ. Account. 2015, 6, 92–106. [Google Scholar]
  35. Hu, J.; Han, H.; Zhang, Z.; Wu, X. Impact of homestead housing on the allocation of financial assets of Chinese rural households. J. Asia Pac. Econ. 2021, 1–20. [Google Scholar] [CrossRef]
  36. Su, L.; He, X.; Kong, R. The impacts of financial literacy on farmers’ behavior of farmland transfer: An analysis based on the regulatory role of farmland certification. China Rural Econ. 2018, 8. Available online: https://www.cabdirect.org/cabdirect/abstract/20183354737 (accessed on 10 September 2022).
  37. Bialowolski, P.; Cwynar, A.; Weziak-Bialowolska, D. Financial management, division of financial management power and financial literacy in the family context—Evidence from relationship partner dyads. Int. J. Bank Mark. 2020, 38, 1373–1398. [Google Scholar] [CrossRef]
  38. Li, X.; Ye, X.; Wu, Q. An Investigation on the concept and Mode of regional financial management of ethnic Minorities—A case study of Yuexi County, Liangshan Yi Autonomous Prefecture, Sichuan Province. China Collect. Econ. 2019, 2, 19–20. [Google Scholar] [CrossRef]
  39. Ye, L.; Pan, S.L.; Li, M.; Dai, Y.; Dong, X. The citizen-led information practices of ICT4D in rural communities of China: A mixed-method study. Int. J. Inf. Manag. 2021, 56, 102248. [Google Scholar] [CrossRef]
  40. Lopez, T.; Winkler, A. The challenge of rural financial inclusion–evidence from microfinance. Appl. Econ. 2018, 50, 1555–1577. [Google Scholar] [CrossRef]
  41. Yang, F.; Jiang, Y.; Paudel, K.P. Impact of Credit Constraints from Formal Financial Institutions on Rural Resi-dents’ Health in China. Healthcare 2021, 9, 6. [Google Scholar] [CrossRef]
  42. Liu, H. Mechanism and difficulty analysis of financial literacy promoting household economic behavior. Economist 2022, 3, 71–73. [Google Scholar]
  43. Sun, W. Research on the efficient allocation of rural financial resources in China under the background of rural revitalization. J. Soochow Univ. (Philos. Soc. Sci. Ed.) 2022, 43, 138–148. [Google Scholar] [CrossRef]
  44. Liu, Y.; Lu, S.; Chen, Y. Spatio-temporal change of urban–rural equalized development patterns in China and its driving factors. J. Rural Stud. 2013, 32, 320–330. [Google Scholar] [CrossRef]
  45. Liu, Z.; Chen, Q.; Xie, H. Influence of the farmer’s livelihood assets on livelihood strategies in the western mountainous area, China. Sustainability 2018, 10, 875. [Google Scholar] [CrossRef]
  46. Rural Socio-Economic Survey Division, National Bureau of Statistics. China Rural Statistical Yearbook; China Statistics Press: Beijing, China, 2021.
  47. Benjamin, J.R.; Cornell, C.A. Probability, Statistics, and Decision for Civil Engineers; Courier Corporation: Chelmsford, MA, USA, 2014. [Google Scholar]
  48. Born, B.; Pfeifer, J. Policy risk and the business cycle. J. Monet. Econ. 2014, 68, 68–85. [Google Scholar] [CrossRef]
  49. Wasiuzzaman, S.; Rahman, H.S.W.H.A. Performance of gold-backed cryptocurrencies during the COVID-19 crisis. Financ. Res. Lett. 2021, 43, 101958. [Google Scholar] [CrossRef]
  50. Ritschl, A.; Sarferaz, S.; Uebele, M. The US business cycle, 1867–2006: A dynamic factor approach. Rev. Econ. Stat. 2016, 98, 159–172. [Google Scholar] [CrossRef]
  51. Chaibi, H.; Ftiti, Z. Credit risk determinants: Evidence from a cross-country study. Res. Int. Bus. Financ. 2015, 33, 1–16. [Google Scholar] [CrossRef]
  52. Catherine, S. Countercyclical labor income risk and portfolio choices over the life cycle. Rev. Financ. Stud. 2022, 35, 4016–4054. [Google Scholar] [CrossRef]
Figure 1. The research framework of the study.
Sustainability 14 11822 g001
Figure 2. The study area.
Sustainability 14 11822 g002
Figure 3. The comparison of asset composition.
Sustainability 14 11822 g003
Figure 4. The proportion of asset composition.
Sustainability 14 11822 g004
Figure 5. The comparison of total financial assets and real assets in Sichuan Tibetan areas.
Sustainability 14 11822 g005
Figure 6. The comparison of total financial assets and real assets within 500,000 Yuan.
Sustainability 14 11822 g006
Figure 7. The comparison of total financial assets and real assets within 300,000 Yuan.
Sustainability 14 11822 g007
Figure 8. Financial assets and realities are linear graphs of the production of all products.
Sustainability 14 11822 g008
Figure 9. Portfolio selection.
Sustainability 14 11822 g009
Figure 10. The return on financial assets and real assets.
Sustainability 14 11822 g010
Figure 11. Portfolio efficient frontier.
Sustainability 14 11822 g011
Table 1. The asset composition of family.
Asset CompositionRural Family of the Study AreaFamily of Nationwide Area
Mean Value (¥)Percentage (%)Mean Value (¥)Percentage (%)
Real assets479,35491.861,426,14088.2
Financial assets42,4498.14190,80611.8
Total assets521,8031001,617,000100
Data source: From the survey data.
Table 2. The composition of real assets.
Real AssetsRural Family of the Study Area
Mean Value (¥)Percentage (%)
Real estate172,95636.08
Durable goods10,1942.13
Productive assets284,81759.42
Tibetan vessels11,3872.37
Real assets479,354100
Data source: From the survey data.
Table 3. The composition of financial assets.
Composition of Financial AssetsRural Family of the Study Area
Mean Value (¥)Percentage (%)
Cash434410.23
Bank deposits34,74281.84
Loans32347.62
Others1290.30
Financial assets42,449100
Note: Others include stocks, bonds, funds, and other financial products. Data source: Collated and calculated according to the questionnaire data.
Table 4. Portfolio income, portfolio risk, and utility of different investment proportions.
Serial NumberX1X2Portfolio ReturnsPortfolio RiskUtility
10.9630.0370.0220.0080.022–0.004 A
20.8560.1440.0490.0110.049–0.005 A
30.7490.2510.0760.0200.076–0.01 A
40.6420.3580.1030.0350.103–0.0184 A
50.5350.4650.1290.0570.129–0.028 A
60.4280.5720.1560.0840.156–0.042 A
70.3210.6790.1830.1180.183–0.059 A
80.2140.7860.2090.1580.209–0.079 A
90.1070.8930.2360.2030.236–0.102 A
10010.2630.2550.263–0.128 A
Publisher’s Note: MDPI stays neutral with regard to jurisdictional claims in published maps and institutional affiliations.

