


A Proposed Performance-Measurement System for Enabling Supply-Chain Strategies


Abstract
1. Introduction
2. Literature Review
2.1. Supply-Chain Strategies
2.2. Performance-Measurement Systems
2.3. Plan-Do-Check-Act and Evidence-Based Management
3. Methodology
3.1. The Context of the Validating Case
3.2. Development of Performance-Measurement System
4. Findings
5. Discussions
5.1. Theoretical Implications
5.1.1. Reflections on the Use of the PDCA Cycle and EBM
5.1.2. Proposed Performance-Measurement System
5.2. Managerial Implications
6. Conclusions
Author Contributions
Funding
Institutional Review Board Statement
Informed Consent Statement
Acknowledgments
Conflicts of Interest
Appendix A
- What is the average lead-time from the moment your company gets the order to the delivery of your service (for export/import, please use lead-time to/from main port/airport): _______________ days
- What is your average lead-time when transporting products to your main customer (for export/import, please use lead time to/from main port/airport): _____________h/days
- What is the average number of days between customer order delivery to receipt of customer payment: ________________ days
- What was the average number of days between supplier order receipt to order payment by your firm:_________________ days
- 5.
- What is the percentage of shipments per month that arrives on time to your main customer?: ______________%
- 6.
- What is the percentages of shipments per month that arrives in full to your main customer?: _______________%
- 7.
- What is the percentage of shipments per month that arrived wrong, arrived damaged and substitute items to your main customer?: _________________%
- 8.
- In recent years, there is a proportion of all accidents that occur during the transportation. Accounted for _________________% of all transportation trips
- 9.
- In recent years, there is a proportion of fatal accidents that occur during the transportation. Accounted for _________________% of all transportation trips
- 10.
- On average, the usage of the space in the transport vehicles accounted for _________________% of the total space in the vehicle used for transportation
| Factors | Strongly Disagree ---> Strongly Agree | ||||
| (1) Modern equipment | |||||
| (2) Physical facilities are visually appealing | |||||
| (3) Employees always look neat | |||||
| (4) Appearance of the physical facilities are consistent with the type of service industry | |||||
| (5) Accuracy of documents | |||||
| (6) Short transit time | |||||
| (7) Consistency of the service | |||||
| (8) Fast responses to customers’ requests | |||||
| (9) Provide enough information to customers | |||||
| (10) Good care of the customers | |||||
| (11) Fast and easy order and document processing | |||||
| (12) Quick respond to customer claims | |||||
| (13) Staff’s willingness to provide service | |||||
| (14) Clear policy on warranty, security | |||||
| (15) No damage goods while in transit | |||||
| (16) Staff’s knowledge and expertise | |||||
| (17) High standard service | |||||
| (18) Keep customers’ information confidentially | |||||
| (19) Care for customers’ needs and interests | |||||
| (20) Assess customers’ future needs | |||||
| Factors | Strongly Disagree ---> Strongly Agree | ||||||
| Social responsibility | |||||||
| (1) There is a current Health and Safety Action Plan for the company | |||||||
| (2) The company keeps any statistics on lost time accidents, lost workdays resulting from incidents or total staff hours worked | |||||||
| (3) Any health and safety training have been provided for company personnel during the previous 2 years | |||||||
| (4) The company employs any personnel under the age of 18 | |||||||
| (5) There is any labor exacted under force, or not performed voluntarily by the workers | |||||||
| (6) There have been any strikes in the last 2 years | |||||||
| (7) The company pays a basic salary that is equal or higher than the legal local minimum wage | |||||||
| (8) The company provides all workers with legally required social security and benefits e.g., health insurance, pension, maternity leave, etc. | |||||||
| Environment concern | |||||||
| (9) The company have an Environmental Management System (EMS) | |||||||
| (10) The company have an environmental action plan outlining key actions and targets for the current year | |||||||
| (11) Any environmental training has been provided for company personnel during the previous three years | |||||||
| Factors | Strongly Disagree ---> Strongly Agree | ||||
| (1) There is a cooperation within the company through joint learning processes/activities | |||||
| (2) There have incentives to be able to achieve their goals | |||||
| (3) There is the involvement of management in activities to create engagement at all levels | |||||
| (4) There is a delegation of the power to make decisions on the actions in all departments | |||||
| (5) There are opportunities to participate in the development of the company | |||||
| (6) There is a trustworthiness among partners | |||||
| (7) There is an information sharing among partners | |||||
| (8) There is knowledge and technology transfer among partners | |||||
| (9) There is a risk sharing among partners | |||||
| (10) There is a written contract agreement between partners | |||||
Appendix B


Appendix C

| Indicator | Description | Standardized Regression Weights |
|---|---|---|
| SQ1 | Modern equipment | 0.535 |
| SQ2 | Physical facilities are visually appealing | 0.518 |
| SQ3 | Employees always look neat | 0.497 |
| SQ4 | Appearance of the physical facilities are consistent with the type of service industry | 0.526 |
| SQ5 | Accuracy of documents | 0.431 |
| SQ6 | Short transit time | 0.558 |
| SQ7 | Consistency of the service | 0.701 |
| SQ8 | Fast responses to customers’ requests | 0.462 |
| SQ9 | Provide enough information to customers | 0.789 |
| SQ10 | Good care of the customers | 0.558 |
| SQ11 | Fast and easy order and document processing | 0.423 |
| SQ12 | Quick respond to customer claims | 0.707 |
| SQ13 | Staff’s willingness to provide service | 0.389 |
| SQ14 | Clear policy on warranty, security | 0.748 |
| SQ15 | No damage goods while in transit | 0.542 |
| SQ16 | Staff’s knowledge and expertise | 0.743 |
| SQ17 | High standard service | 0.414 |
| SQ18 | Keep customer’s information confidentially | 0.579 |
| SQ19 | Care for customer’s need and interest | 0.742 |
| SQ20 | Assess customer’s future need | 0.394 |
| SE1 | There is a current health and safety action plan for the company | 0.556 |
| SE2 | The company keeps any statistics on lost time accidents, lost workdays resulting from incidents or total staff hours worked | 0.469 |
| SE3 | Any health and safety training have been provided for company personnel during the previous 2 years | 0.471 |
| SE4 | The company employs any personnel under the age of 18 | 0.568 |
| SE5 | There is any labor exacted under force, or not performed voluntarily by the workers | 0.511 |
| SE6 | There have been any strikes in the last 2 years | 0.802 |
| SE7 | The company pays a basic salary that is equal or higher than the legal local minimum wage | 0.717 |
| SE8 | The company provides all workers with legally required social security and benefits e.g., health insurance, pension, maternity leave, etc. | 0.752 |
| SE9 | The company have an Environmental Management System (EMS) | 0.783 |
| SE10 | The company have an environmental action plan outlining key actions and targets for the current year | 0.498 |
| SE11 | Any environmental training has been provided for company personnel during the previous three years | 0.734 |
| IR1 | There is a cooperation within the organization through joint learning processes/activities | 0.703 |
| IR2 | There is incentives for personnel to be able to achieve their goals | 0.464 |
| IR3 | Management level is involved in activities to create engagement at all levels | 0.714 |
| IR4 | There is a delegation of the power to make decisions on the actions to the personnel of various parties | 0.706 |
| IR5 | There are opportunities for personnel to participate in the development of the organization | 0.741 |
| IR6 | Trustworthiness among partners | 0.746 |
| IR7 | There is an exchange of information with each other such as co-planning work and joint decisions | 0.778 |
| IR8 | Knowledge and technology transfer | 0.751 |
| IR9 | Risk sharing | 0.739 |
| IR10 | There is a written contract agreement | 0.775 |
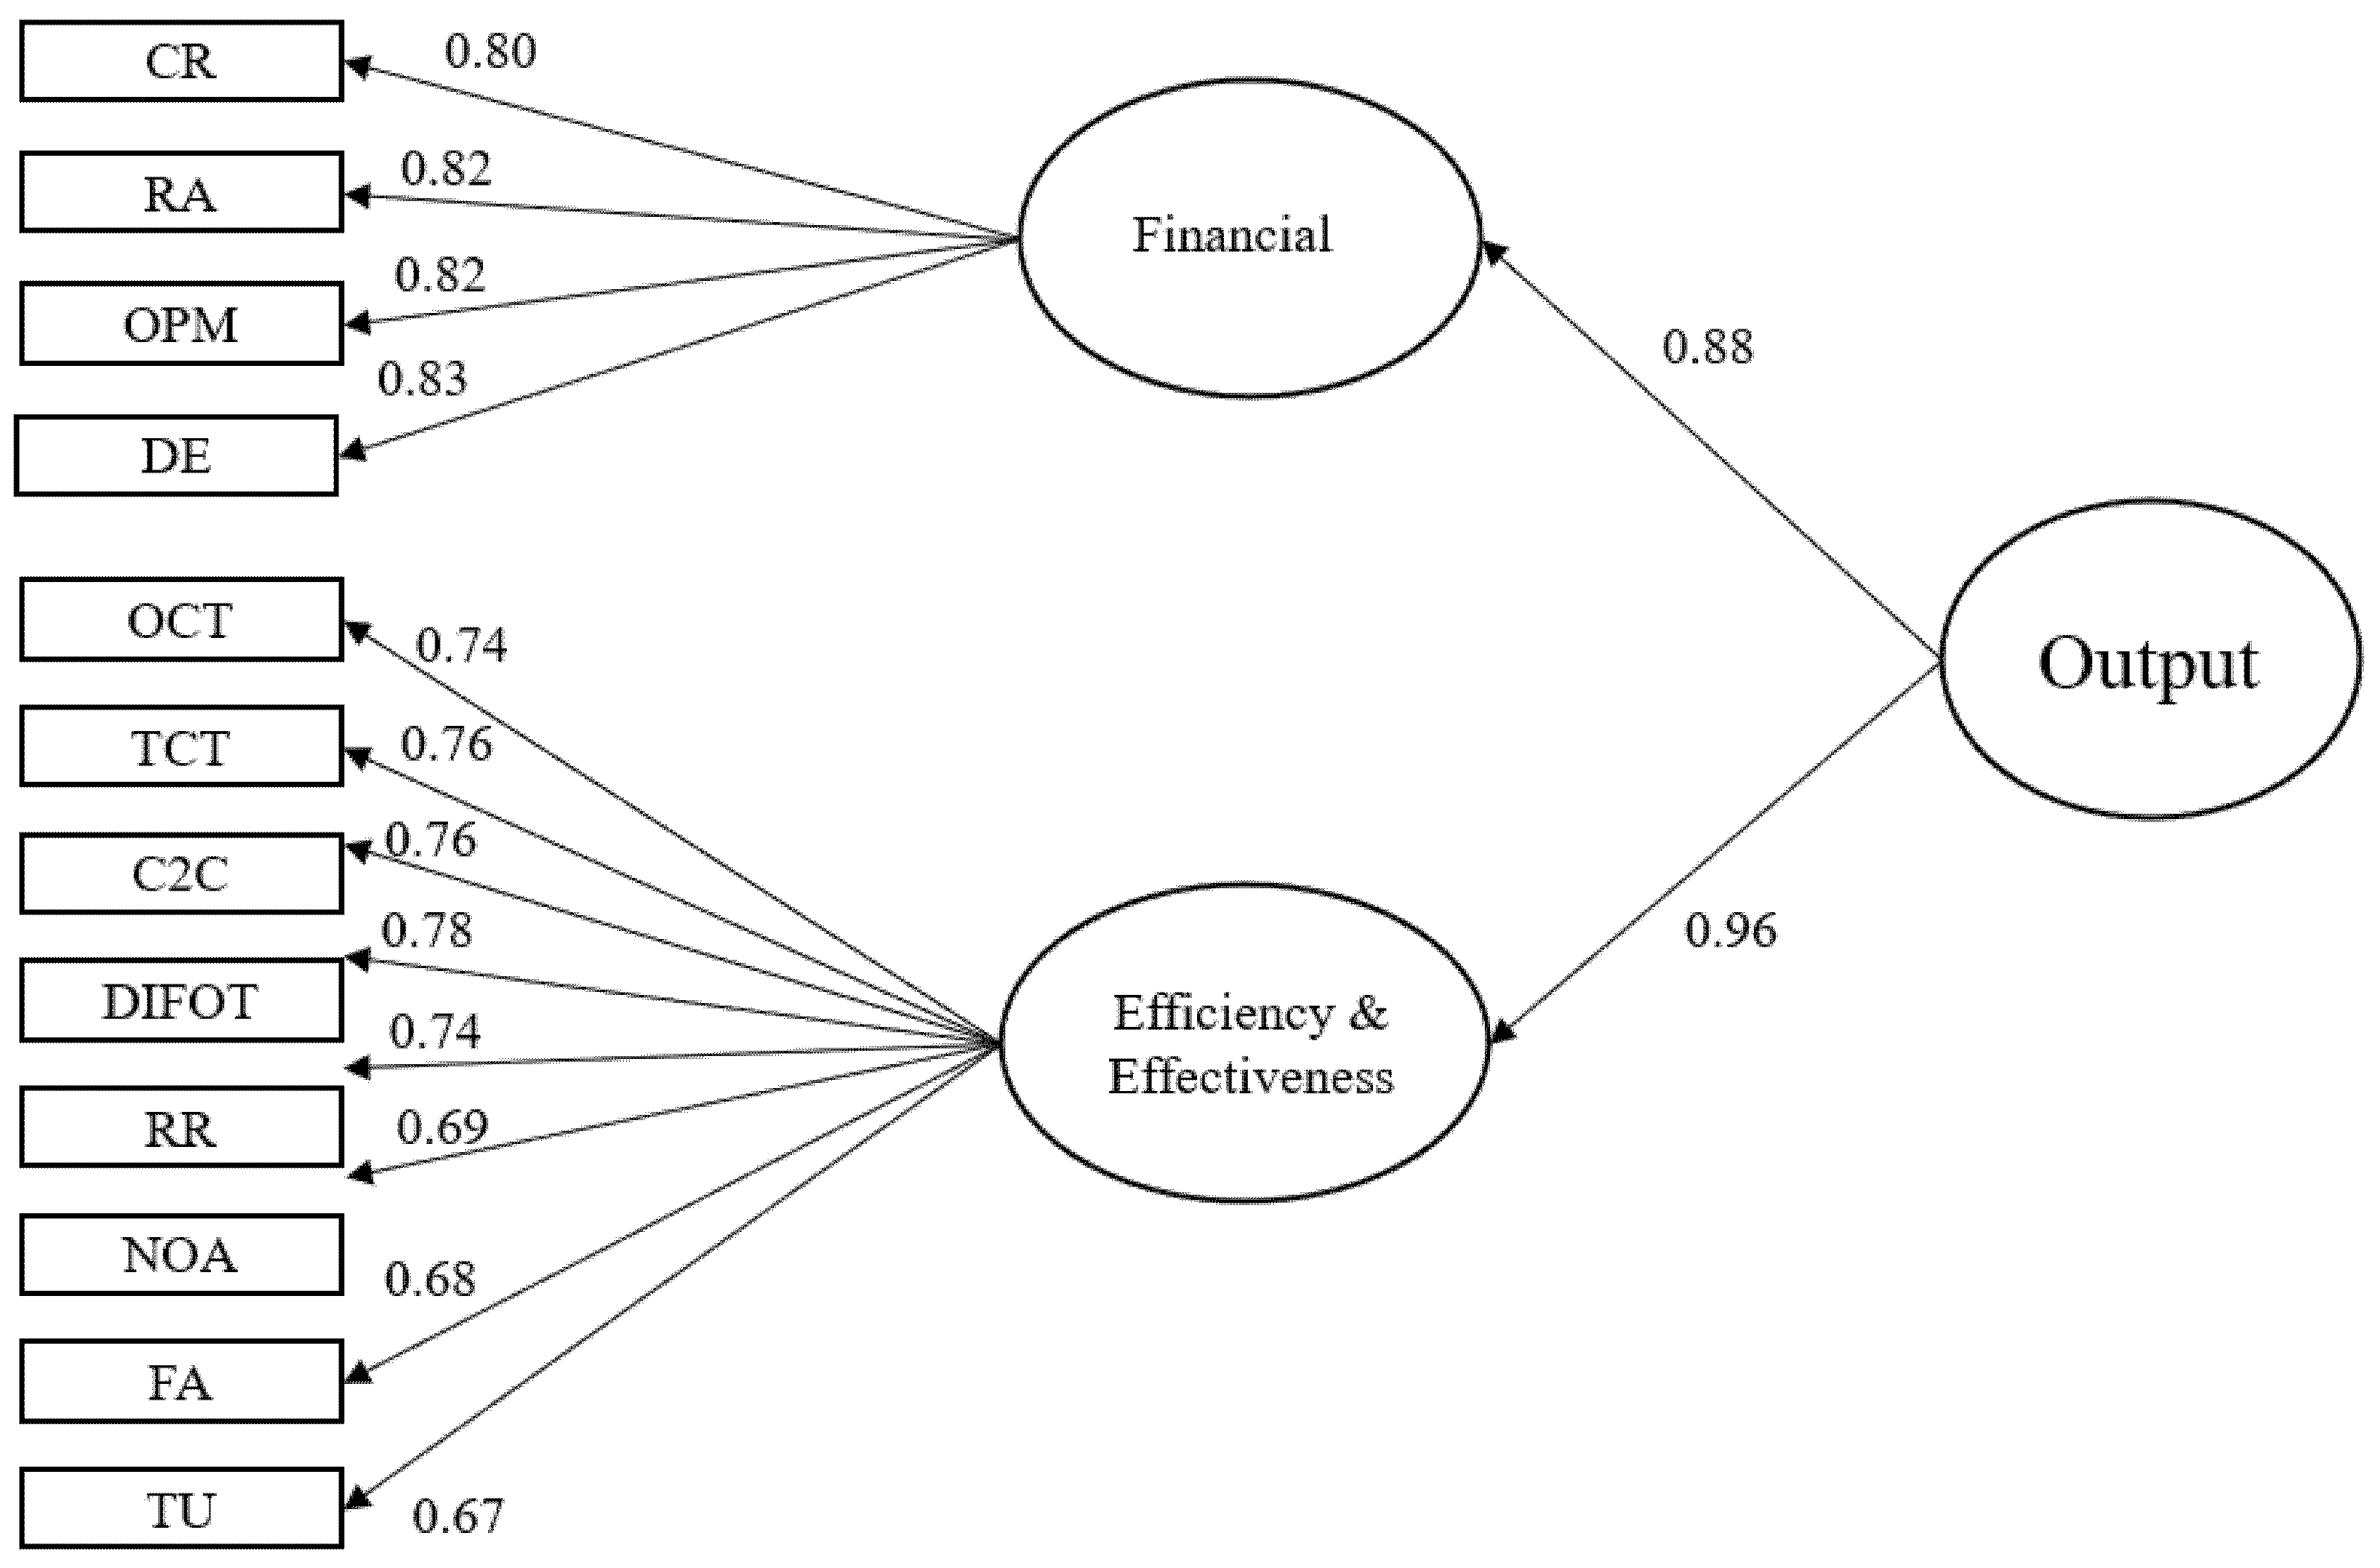
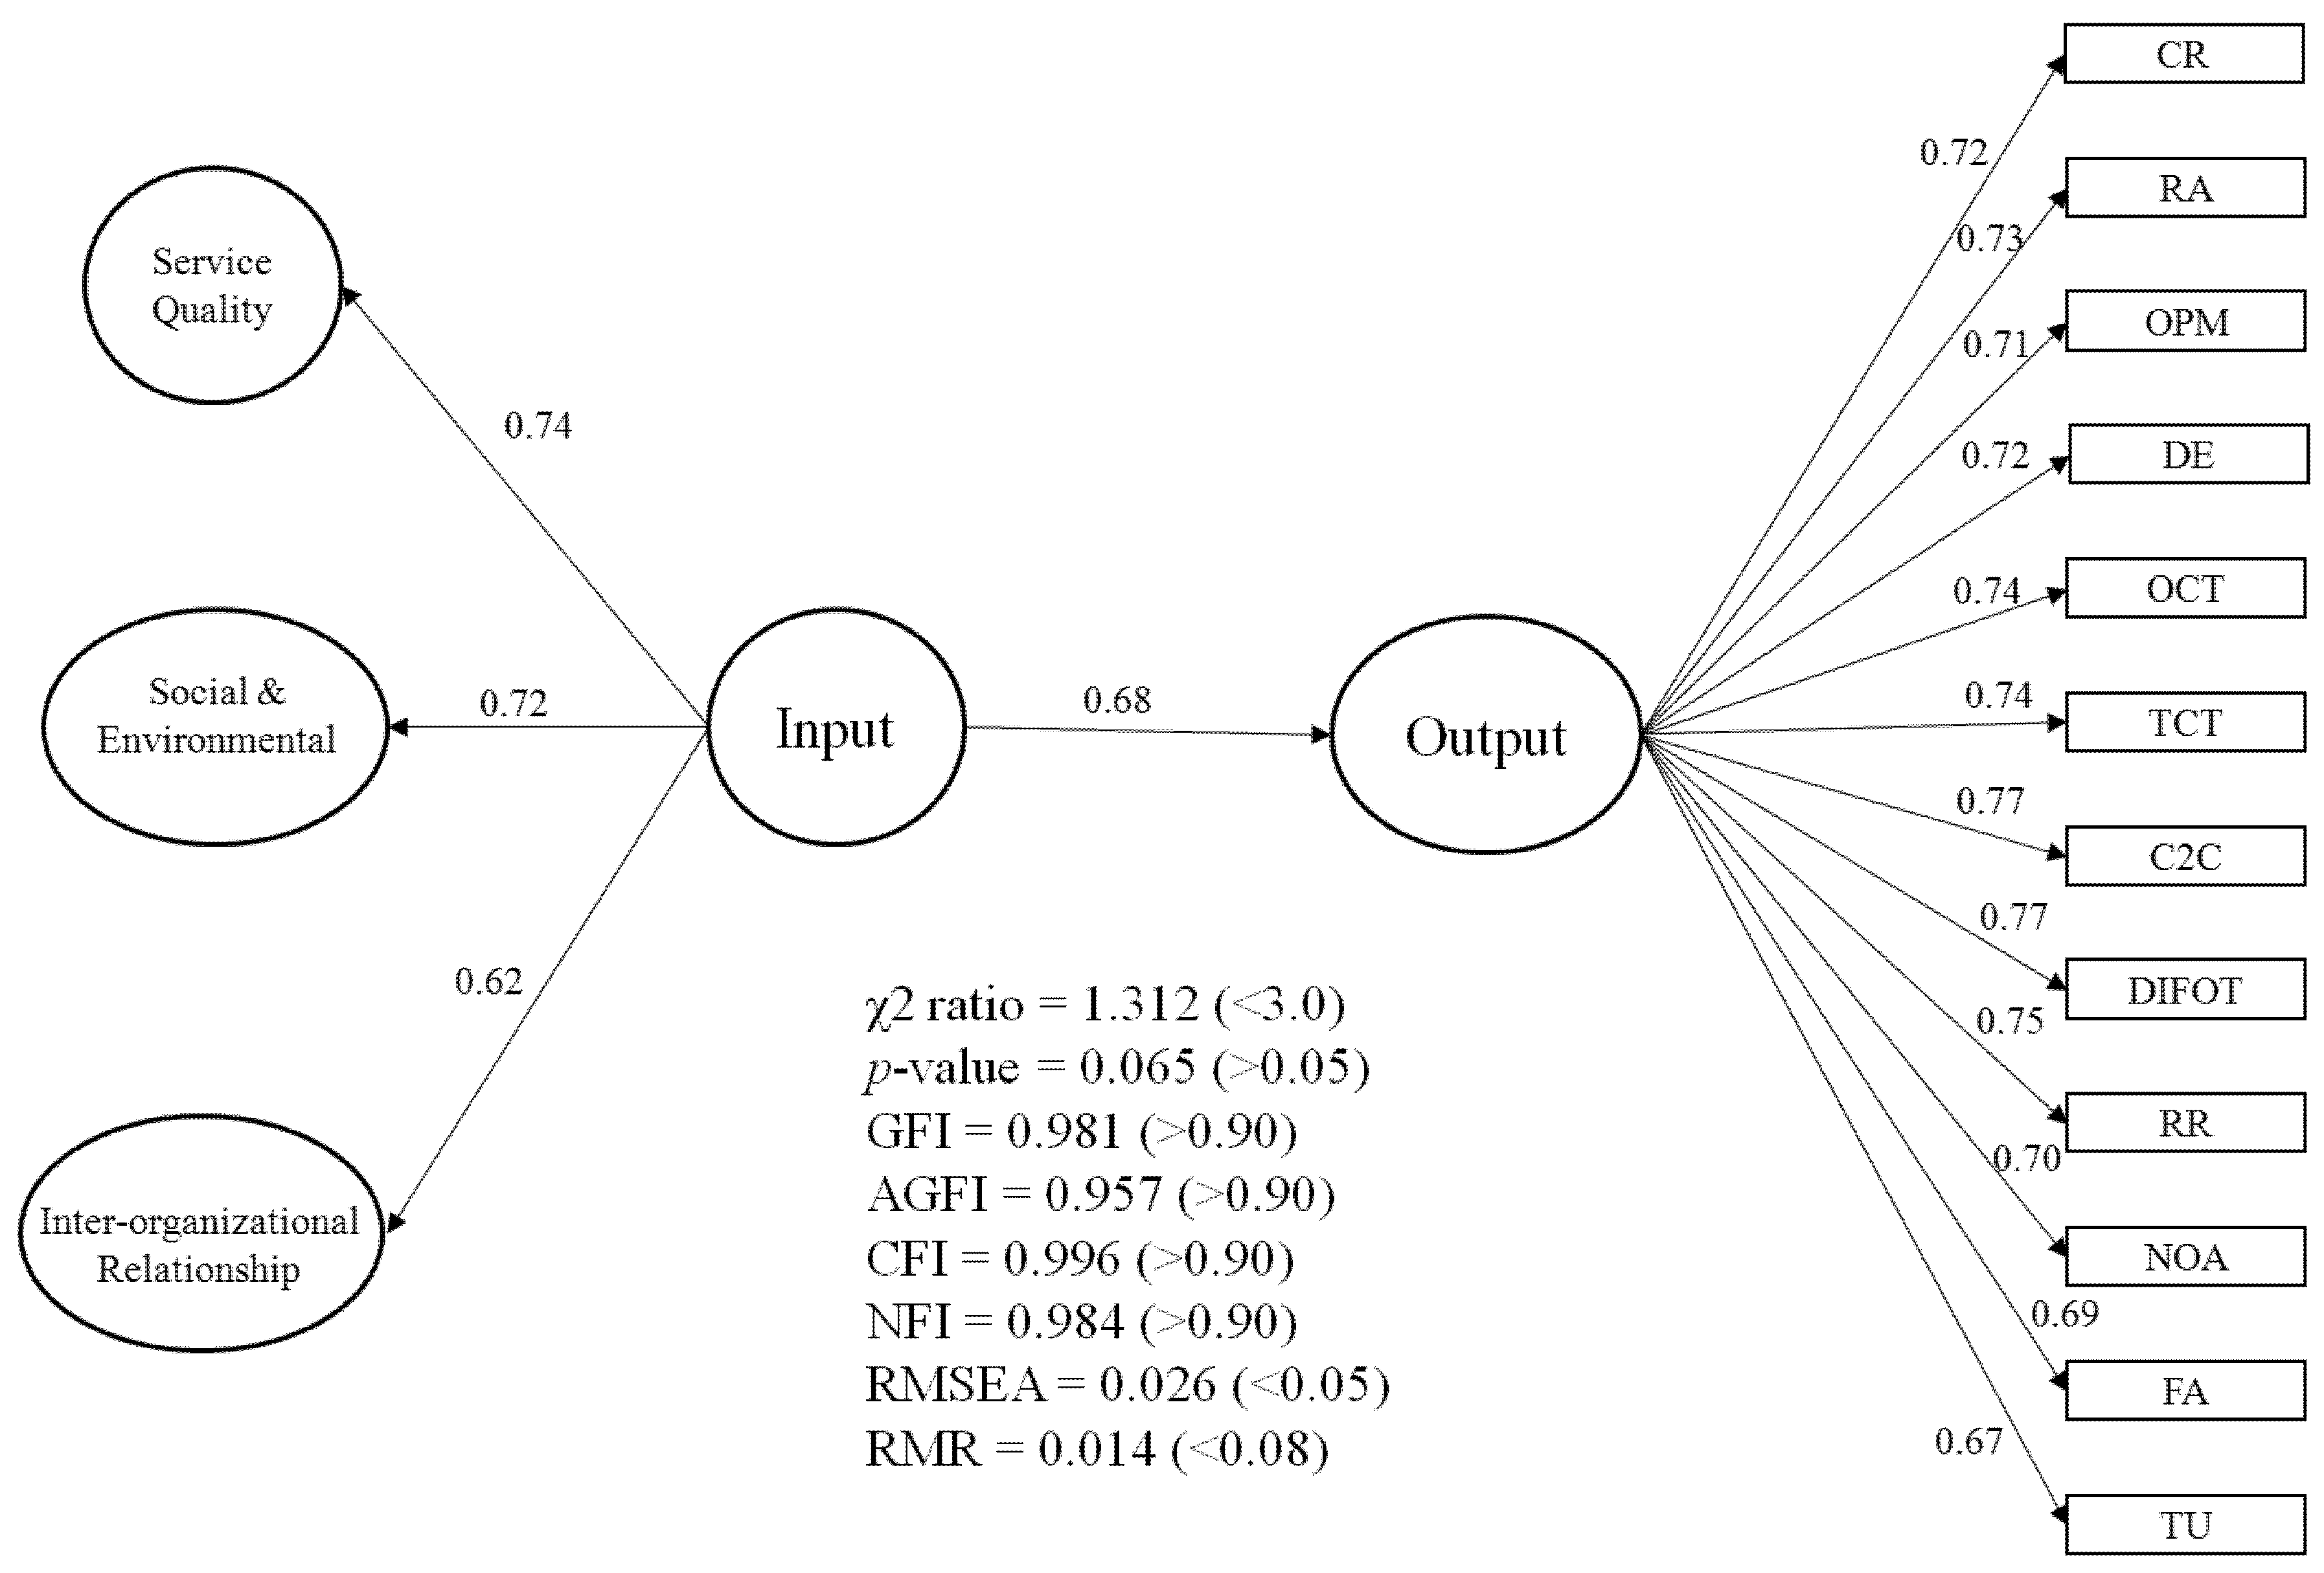
| Indicator | Description | Standardized Regression Weights |
|---|---|---|
| FN1 | Current Ratio (times) | 0.805 |
| FN2 | Return on Asset (%) | 0.815 |
| FN3 | Operating profit margin (%) | 0.818 |
| FN4 | Debt-to-equity ratio (times) | 0.828 |
| EE1 | Order cycle time (days) | 0.744 |
| EE2 | Transportation cycle time (days) | 0.749 |
| EE3 | Cash conversion cycle (days) | 0.763 |
| EE4 | Delivery in-full and on-time (%) | 0.777 |
| EE5 | Return rate (%) | 0.743 |
| EE6 | Number of accidents (%) | 0.689 |
| EE7 | Fatal accident (%) | 0.683 |
| EE8 | Truck utilization (%) | 0.674 |
References
- Christopher, M. Logistics & Supply Chain Management, 4th ed.; Pearson: London, UK, 2011. [Google Scholar]
- Xia, L.X.X. Supply chain modelling and improvement in telecom industry: A case study. In Proceedings of the 2006 4th IEEE International Conference on Industrial Informatics, Singapore, 16–18 August 2006. [Google Scholar]
- Farokhi, S.; Roghanian, E.; Samimi, Y. Quantitative target setting in balanced scorecard method using simultaneous equations system and goal programming. Int. J. Product. Perform. Manag. 2019, 69, 2089–2118. [Google Scholar] [CrossRef]
- Lima-Junior, F.R.; Carpinetti, L.C.R. Predicting supply chain performance based on SCOR® metrics and multilayer perceptron neural networks. Int. J. Prod. Econ. 2019, 212, 19–38. [Google Scholar] [CrossRef]
- Tahir, A.C.; Darton, R.C. The process analysis method of selecting indicators to quantify the sustainability performance of a business operation. J. Clean. Prod. 2010, 18, 1598–1607. [Google Scholar] [CrossRef]
- Shapiro, M.J.; Morey, J.C.; Small, S.D.; Langford, V.; Kaylor, C.J.; Jagminas, L.; Suner, S.; Salisbury, M.L.; Simon, R.; Jay, G.D. Simulation based teamwork training for emergency department staff: Does it improve clinical team performance when added to an existing didactic teamwork curriculum? BMJ Qual Saf. 2004, 13, 417–421. [Google Scholar] [CrossRef]
- Folan, P.; Browne, J. A review of performance measurement: Towards performance management. Comput. Ind. 2005, 56, 663–680. [Google Scholar] [CrossRef]
- Qi, Y.; Huo, B.; Wang, Z.; Yeung, H.Y.J. The impact of operations and supply chain strategies on integration and performance. Int. J. Prod. Econ. 2017, 185, 162–174. [Google Scholar] [CrossRef]
- Schnetzler, M.J.; Sennheiser, A.; Schönsleben, P. A decomposition-based approach for the development of a supply chain strategy. Int. J. Prod. Econ. 2007, 105, 21–42. [Google Scholar] [CrossRef]
- Jacobs, F.R.; Chase, R.B. Operations and Supply Management, 13th ed.; McGraw-Hill/Iriwin: New York, NY, USA, 2011. [Google Scholar]
- Liu, W.B.; Meng, I.W.; Mingers, J.; Tang, N.; Wang, W. Developing a performance management system using soft systems methodology: A Chinese case study. Eur. J. Oper. Res. 2012, 223, 529–540. [Google Scholar] [CrossRef]
- Heikkilä, M.; Bouwman, H.; Heikkilä, J.; Solaimani, S.; Janssen, W. Business model metrics: An open repository. Inf. Syst. E-Bus. Manag. 2016, 14, 337–366. [Google Scholar] [CrossRef][Green Version]
- Kumru, M. A balanced scorecard-based composite measuring approach to assessing the performance of a media outlet. Serv. Ind. J. 2012, 32, 821–843. [Google Scholar] [CrossRef]
- Hradílek, J. Cat Model for Complex Evaluation of Organisational Maturity in Small and Medium Enterprises. Cent. Eur. Bus. Rev. 2020, 9, 1. [Google Scholar] [CrossRef]
- Kaplan, R.; Norton, D. The Balanced Scorecard—Measures That Drive Performance. Harv. Bus. Rev. 2005, 83, 172. [Google Scholar]
- Van Hoek, R. Measuring the unmeasurable—Measuring and improving performance in the supply chain. Int. J. Supply Chain. Manag. 1998, 3, 187–192. [Google Scholar]
- Beamon, B. Measuring supply chain performance. Int. J. Oper. Prod. Manag. 1999, 19, 275–292. [Google Scholar]
- Holmberg, S. A systems perspective on supply chain measurements. Int. J. Phys. Distrib. Logist. Manag. 2000, 30, 847–868. [Google Scholar] [CrossRef]
- Gunasekaran, A.; Patel, C.; Tirtiroglu, E. Performance measures and metrics in a supply chain environment. Int. J. Oper. Prod. Manag. 2001, 21, 71–87. [Google Scholar] [CrossRef]
- APICS. Supply Chain Operations Reference Model; APICS Supply Chain Council: Chicago, IL, USA, 2019; available online: http://www.apics.org/apics-for-business/frameworks/scor (accessed on 12 July 2022).
- Chorfi, Z.; Benabbou, L.; Berrado, A. An integrated performance measurement framework for enhancing public health care supply chains. Supply Chain Forum. 2018, 19, 191–203. [Google Scholar] [CrossRef]
- Reddy, J.M.; Rao, N.; Krishnanand, L. A review on supply chain performance measurement systems. Procedia Manuf. 2019, 30, 40–47. [Google Scholar]
- Zizlavsky, O. The Balanced Scorecard: Innovative Performance Measurement and Management Control System. J. Technol. Manag. Innov. 2014, 9, 210–222. [Google Scholar]
- Van Veen-Dirks, P.M.G. Complementary choices and management control: Field research in a flexible production environment. Manag. Account. Res. 2006, 17, 72–105. [Google Scholar] [CrossRef]
- Bhagwat, R.; Sharma, M. Performance measurement of supply chain management: A balanced scorecard approach. Comput. Ind. Eng. 2007, 53, 43–62. [Google Scholar] [CrossRef]
- Reefke, H.; Trocchi, M. Balanced scorecard for sustainable supply chains: Design and development guidelines. Int. J. Product. Perform. Manag. 2013, 62, 805–826. [Google Scholar] [CrossRef]
- Nouri, F.A.; Nikabadi, M.S.; Olfat, L. Developing the framework of sustainable service supply chain balanced scorecard (SSSC BSC). Int. J. Product. Perform. Manag. 2019, 68, 148–170. [Google Scholar] [CrossRef]
- Li, L.; Su, Q.; Chen, X. Ensuring supply chain quality performance through applying the SCOR model. Int. J. Prod. Res. 2011, 49, 33–57. [Google Scholar] [CrossRef]
- Sellitto, M.A.; Pereira, G.M.; Borchardt, M.; Da Silva, R.I.; Viegas, C.V. A SCOR-based model for supply chain performance measurement: Application in the footwear industry. Int. J. Prod. Res. 2015, 53, 4917–4926. [Google Scholar] [CrossRef]
- Tang, L.C.; Goh, T.N.; Lam, S.W.; Zhang, C.W. Fortification of Six Sigma: Expanding the DMAIC toolset. Qual. Reliab. Eng. Int. 2007, 23, 3–18. [Google Scholar] [CrossRef]
- Lepori, E.; Damand, D.; Barth, B. Benefits and limitations of the SCOR model in warehousing. IFAC Proc. Vol. 2013, 46, 424–429. [Google Scholar] [CrossRef]
- Axelsson, P.; Frankel, J. Performance Measurement System for Warehouse Activities Based on the SCOR® Model; Department of Industrial Management and Logistics, Lund University: Lund, Sweden, 2014. [Google Scholar]
- Rillo, M. Limitations of balanced scorecard. In Proceedings of the 2nd Scientific and Educational Conference, Business Administration: Business in a Globalizing Economy, Parnu, Estonia, 16 July 2004. [Google Scholar]
- Thompson, K.R.; Mathys, N.J. It’s time to add the employee dimension to the balanced scorecard. Organ. Dyn. 2013, 2, 135–144. [Google Scholar] [CrossRef]
- Neely, A. The evolution of performance measurement research: Developments in the last decade and a research agenda for the next. Int. J. Oper. Prod. Manag. 2005, 25, 1264–1277. [Google Scholar] [CrossRef]
- Barber, E. How to measure the “value” in value chains. Int. J. Phys. Distrib. Logist. Manag. 2008, 38, 685–698. [Google Scholar] [CrossRef]
- Shewhart, W.A. Economic Control of Quality of Manufactured Product; Macmillan And Co., Ltd.: New York, NY, USA, 1931. [Google Scholar]
- Deming, W.E. The New Economics, for Industry, Government, Education, 2nd ed.; MIT Press: Cambridge, MA, USA, 2000. [Google Scholar]
- Ribeiro, L.M.M.; Cabral, S.J.A. A benchmarking methodology for metalcasting industry. Benchmarking 2006, 13, 23–35. [Google Scholar] [CrossRef]
- Du, Q.L.; Cao, S.M.; Ba, L.L.; Cheng, J.M. Application of PDCA cycle in the performance management system. In Proceedings of the 2008 4th International Conference on Wireless Communications, Networking and Mobile Computing, Dalian, China, 12–14 October 2008; pp. 1–4. [Google Scholar]
- Realyvásquez-Vargas, A.; Arredondo-Soto, K.C.; Carrillo-Gutiérrez, T.; Ravelo, G. Applying the Plan-Do-Check-Act (PDCA) cycle to reduce the defects in the manufacturing industry. A case study. Appl. Sci. 2018, 8, 2181. [Google Scholar] [CrossRef]
- Hervani, A.M.; Helms, M.; Sarkis, J. Performance measurement for green supply chain management. Benchmarking 2005, 12, 330–353. [Google Scholar] [CrossRef]
- Pesonen, V. Development and Analysis of Performance Measurement Indicators Utilized by Third Party Logistics Service Providers. Master’s Thesis, Industrial Management, School of Technology and Innovations, University of Vaasa, Vaasa, Finland, 2021. [Google Scholar]
- Ghosh, S.; Mandal, M.C.; Ray, A. A PDCA based approach to evaluate green supply chain management performance under fuzzy environment. Int. J. Sci. Manag. Eng. 2022, 1–15. [Google Scholar] [CrossRef]
- Sangpikul, A. Implementing academic service learning and the PDCA cycle in a marketing course: Contributions to three beneficiaries. J. Hosp. Leis. Sports Tour. Educ. 2017, 21, 83–87. [Google Scholar] [CrossRef]
- Matsuo, M.; Nakahara, J. The effects of the PDCA cycle and OJT on workplace learning. Int. J. Hum. Resour. Manag. 2013, 24, 195–207. [Google Scholar] [CrossRef]
- Sarkis, J. Benchmarking for agility. Benchmarking 2001, 8, 88–107. [Google Scholar] [CrossRef]
- Bhutta, K.S.; Huq, F. Benchmarking—Best practices: An integrated approach. Benchmarking 1999, 6, 254–268. [Google Scholar] [CrossRef]
- Pham Evans, M.T.; Tisak, D.J.; Williamson, D.F. Twenty-first century benchmarking: Searching for the next generation. Benchmarking 2012, 19, 760–780. [Google Scholar] [CrossRef]
- Kulikowski, K. The model of evidence-based benchmarking: A more robust approach to benchmarking. Benchmarking 2021, 28, 721–736. [Google Scholar] [CrossRef]
- Barends, E.; Rousseau, D.M. Evidence-Based Management: How to Use Evidence to Make Better Organizational Decisions; Kogan Page Publishers: New York, NY, USA, 2018. [Google Scholar]
- Briner, R.B.; Denyer, D.; Rousseau, D.M. Evidence-based management: Concept cleanup time? Acad. Manag. Perspect. 2009, 23, 19–32. [Google Scholar] [CrossRef]
- Banomyong, R.; Cook, P.; Kent, P. Formulating regional logistics development policy: The case of ASEAN. Int. J. Logist. Res. Appl. 2008, 11, 359–379. [Google Scholar] [CrossRef]
- Rezaei, J.; van Roekel, W.S.; Tavasszy, L. Measuring the relative importance of the logistics performance index indicators using Best Worst Method. Transp. Policy 2018, 68, 158–169. [Google Scholar] [CrossRef]
- Mangiaracina, R.; Perego, A.; Seghezzi, A.; Tumino, A. Innovative solutions to increase last-mile delivery efficiency in B2C e-commerce: A literature review. Int. J. Phys. Distrib. Logist. Manag. 2019, 49, 901–920. [Google Scholar] [CrossRef]
- Gubrium, J.F.; Holstein, J.A. Handbook of Interview Research: Context and Method; Sage Publications: Thousand Oaks, CA, USA, 2001. [Google Scholar]
- Hemingway, P.; Brereton, N. What Is a Systematic Review? Hayward Med. Commun. 2009, 2, 1–8. [Google Scholar]
- Varadejsatitwong, P.; Banomyong, R.; Julagaasigorn, P. Developing a Performance Measurement Framework for Logistics Service Providers. In Proceedings of the 2021 Conference: The International Conference on Industrial Engineering and Operations Management (IEOM), Monterrey, Mexico, 3–5 November 2021; pp. 994–1005. [Google Scholar]
- Ramos, T.B. Development of regional sustainability indicators and the role of academia in this process: The Portuguese practice. J. Clean. Prod. 2009, 17, 1101–1115. [Google Scholar] [CrossRef]
- De Nooy, W.; Mrvar, A.; Batagelj, V. Exploratory Social Network Analysis with Pajek; Cambridge University Press: Cambridge, UK, 2005. [Google Scholar]
- Hummon, N.P.; Dereian, P. Connectivity in a citation network: The development of DNA theory. Soc. Netw. 1989, 11, 39–63. [Google Scholar] [CrossRef]
- Kemp, P.A. Researching housing management performance. Urban. Stud. 1995, 32, 779–790. [Google Scholar] [CrossRef]
- Southern, G. A systems approach to performance measurement in hospitality. Int. J. Contemp. Hosp. 1999, 11, 366–376. [Google Scholar] [CrossRef]
- Straub, A.; Koopman, M.; van Mossel, H.J. Systems approach and performance measurement by social enterprises. Facilities 2010, 28, 321–331. [Google Scholar] [CrossRef]
- Sulek, J.M.; Lind, M.R. A systems model for evaluating transit performance. J. Public Trans. 2000, 3, 2. [Google Scholar] [CrossRef][Green Version]
- Banomyong, R.; Julagasigorn, P.; Varadejsatitwong, P.; Piboonrungroj, P. The humanitarian supply chain assessment tool (HumSCAT). J. Humanit. Logist. Supply Chain Manag. 2019, 9, 221–249. [Google Scholar] [CrossRef]
- Brown, S.R. A primer on Q methodology. Operant. Subj. 1993, 6, 91–138. [Google Scholar]
- Hinkin, T.R.; Tracey, J.B.; Enz, C.A. Scale construction: Developing reliable and valid measurement instruments. J. Hosp. Tour. Res. 1997, 21, 100–120. [Google Scholar] [CrossRef]
- Oppenheim, A.N. Questionnaire Design, Interviewing and Attitude Measurement; Bloomsbury Publishing: London, UK, 2000. [Google Scholar]
- Hair, J.F.; Black, W.C.; Babin, B.J.; Anderson, R.E. Multivariate Data Analysis, 8th ed.; Cengage Learning EMEA: London, UK, 2019. [Google Scholar]
- Srivastava, S.; Singh, R.K. Exploring integrated supply chain performance in healthcare: A service provider perspective. Benchmarking 2021, 28, 106–130. [Google Scholar] [CrossRef]
- George, D.; Mallery, P. SPSS for Windows Step by Step: A Simple Guide and Reference 11.0 Update, 4th ed.; Allyn & Bacon: Boston, MA, USA, 2003. [Google Scholar]
- Osborn, A.F. Principles and Procedures of Creative Thinking. In Applied Imagination; Scribners: Hunter, NY, USA, 1953. [Google Scholar]
- Byrne, B.M. Structural Equation Modeling with LISREL, PRELIS, and SIMPLIS: Basic Concepts, Applications, and Programming; Lawrence Erlbaum Associates: Mahwah, NJ, USA, 1998. [Google Scholar]
- De Jong, G. Causal loops in long-term supply relationships: Theory and evidence from the United States, Japan, and Europe. Ph.D. Thesis, SOM, University of Groningen, Groningen, The Netherlands, 1999. [Google Scholar]
- Bagozzi, R.P.; Yi, Y. On the evaluation of structural equation models. J. Acad. Mark. Sci. 1988, 16, 74–94. [Google Scholar] [CrossRef]
- Browne, M.W.; Cudeck, R. Alternative ways of assessing model fit. Sociol. Methods Res. 1992, 21, 230–258. [Google Scholar] [CrossRef]
- Fu, X.; Dong, M.; Liu, S.; Han, G. Trust based decisions in supply chains with an agent. Decis. Support Syst. 2016, 82, 35–46. [Google Scholar] [CrossRef]
- Panahifar, F.; Byrne, P.J.; Heavey, C. A hybrid approach to the study of CPFR implementation enablers. Prod. Plan. Control 2015, 26, 1090–1109. [Google Scholar] [CrossRef]
- Lorenzo Ochoa, O.; Claes, B.; Koryak, O.; Diaz, A. Integration through orchestration: The interplay between enterprise systems and inventory management capabilities. J. Enterp. Inf. Manag. 2017, 30, 555–582. [Google Scholar] [CrossRef]
- Tang, O.; Musa, S.N. Identifying risk issues and research advancements in supply chain risk management. Int. J. Prod. Econ. 2011, 133, 25–34. [Google Scholar] [CrossRef]
- Lyu, J.; Ding, J.H.; Chen, P.S. Coordinating replenishment mechanisms in supply chain: From the collaborative supplier and store-level retailer perspective. Int. J. Prod. Econ. 2010, 123, 221–234. [Google Scholar] [CrossRef]
- Greening, D.W.; Turban, D.B. Corporate social performance as a competitive advantage in attracting a quality workforce. Bus. Soc. 2000, 39, 254–280. [Google Scholar] [CrossRef]
- Ting, I.W.K.; Azizan, N.A.; Bhaskaran, R.K.; Sukumaran, S.K. Corporate social performance and firm performance: Comparative study among developed and emerging market firms. Sustainability 2019, 12, 26. [Google Scholar] [CrossRef]
- Hong, B.; Li, Z.; Minor, D. Corporate governance and executive compensation for corporate social responsibility. J. Bus. Ethics 2016, 136, 199–213. [Google Scholar] [CrossRef]
- Bansal, P.; Roth, K. Why companies go green: A model of ecological responsiveness. Acad. Manag. J. 2000, 43, 717–736. [Google Scholar]
- Journeault, M. The influence of the eco-control package on environmental and economic performance: A natural resource-based approach. Manag. Account. Res. 2016, 28, 149–178. [Google Scholar] [CrossRef]
- Ormazabal, M.; Rich, E.; Sarriegi, J.M.; Viles, E. Environmental Management Evolution Framework. Organ Environ. 2017, 30, 27–50. [Google Scholar] [CrossRef]
- Szymczyka, K.; Kadłubek, M. Challenges in general cargo distribution strategy in urban logistics—Comparative analysis of the biggest logistics operators in EU. Transp. Res. Proc. 2019, 39, 525–533. [Google Scholar] [CrossRef]
- Islam, M.Z.; Jasimuddin, S.M.; Hasan, I. Organizational culture, structure, technology infrastructure and knowledge sharing: Empirical evidence from MNCs based in Malaysia. VINE J. Inf. Knowl. Manag. Syst. 2015, 45, 67–88. [Google Scholar] [CrossRef]
- Rosendaal, B.; Frankema, K.B. Knowledge sharing within teams: Enabling and constraining factors. Knowl. Manag. Res. Pract. 2013, 13, 235–247. [Google Scholar] [CrossRef]
- Rutten, W.; Blaas-Franken, J.; Martin, H. The impact of (low) trust on knowledge sharing. J. Knowl. Manag. 2016, 20, 199–214. [Google Scholar] [CrossRef]
- Wang, C.L.; Siu, N.Y.M.; Barnes, B.R. The significance of trust and renqing in the long-term orientation of Chinese business-to-business relationships. Ind. Mark. Manag. 2008, 37, 819–824. [Google Scholar] [CrossRef]
- Wang, C.L.; Shi, Y.; Barnes, B.R. The role of satisfaction, trust and contractual obligation on long-term orientation among Chinese and Western managers. J. Bus. Res. 2015, 68, 473–479. [Google Scholar] [CrossRef]
- Vij, S.; Farooq, R. Multi-group moderation analysis for relationship between knowledge sharing orientation and business performance. J. Knowl. Manag. 2014, 10, 36–53. [Google Scholar] [CrossRef]
- Baba, M.D.; Sha’ri, M.Y.; Azhari, M.S. A benchmarking implementation framework for automotive manufacturing SMEs. Benchmarking 2006, 13, 396–430. [Google Scholar] [CrossRef]


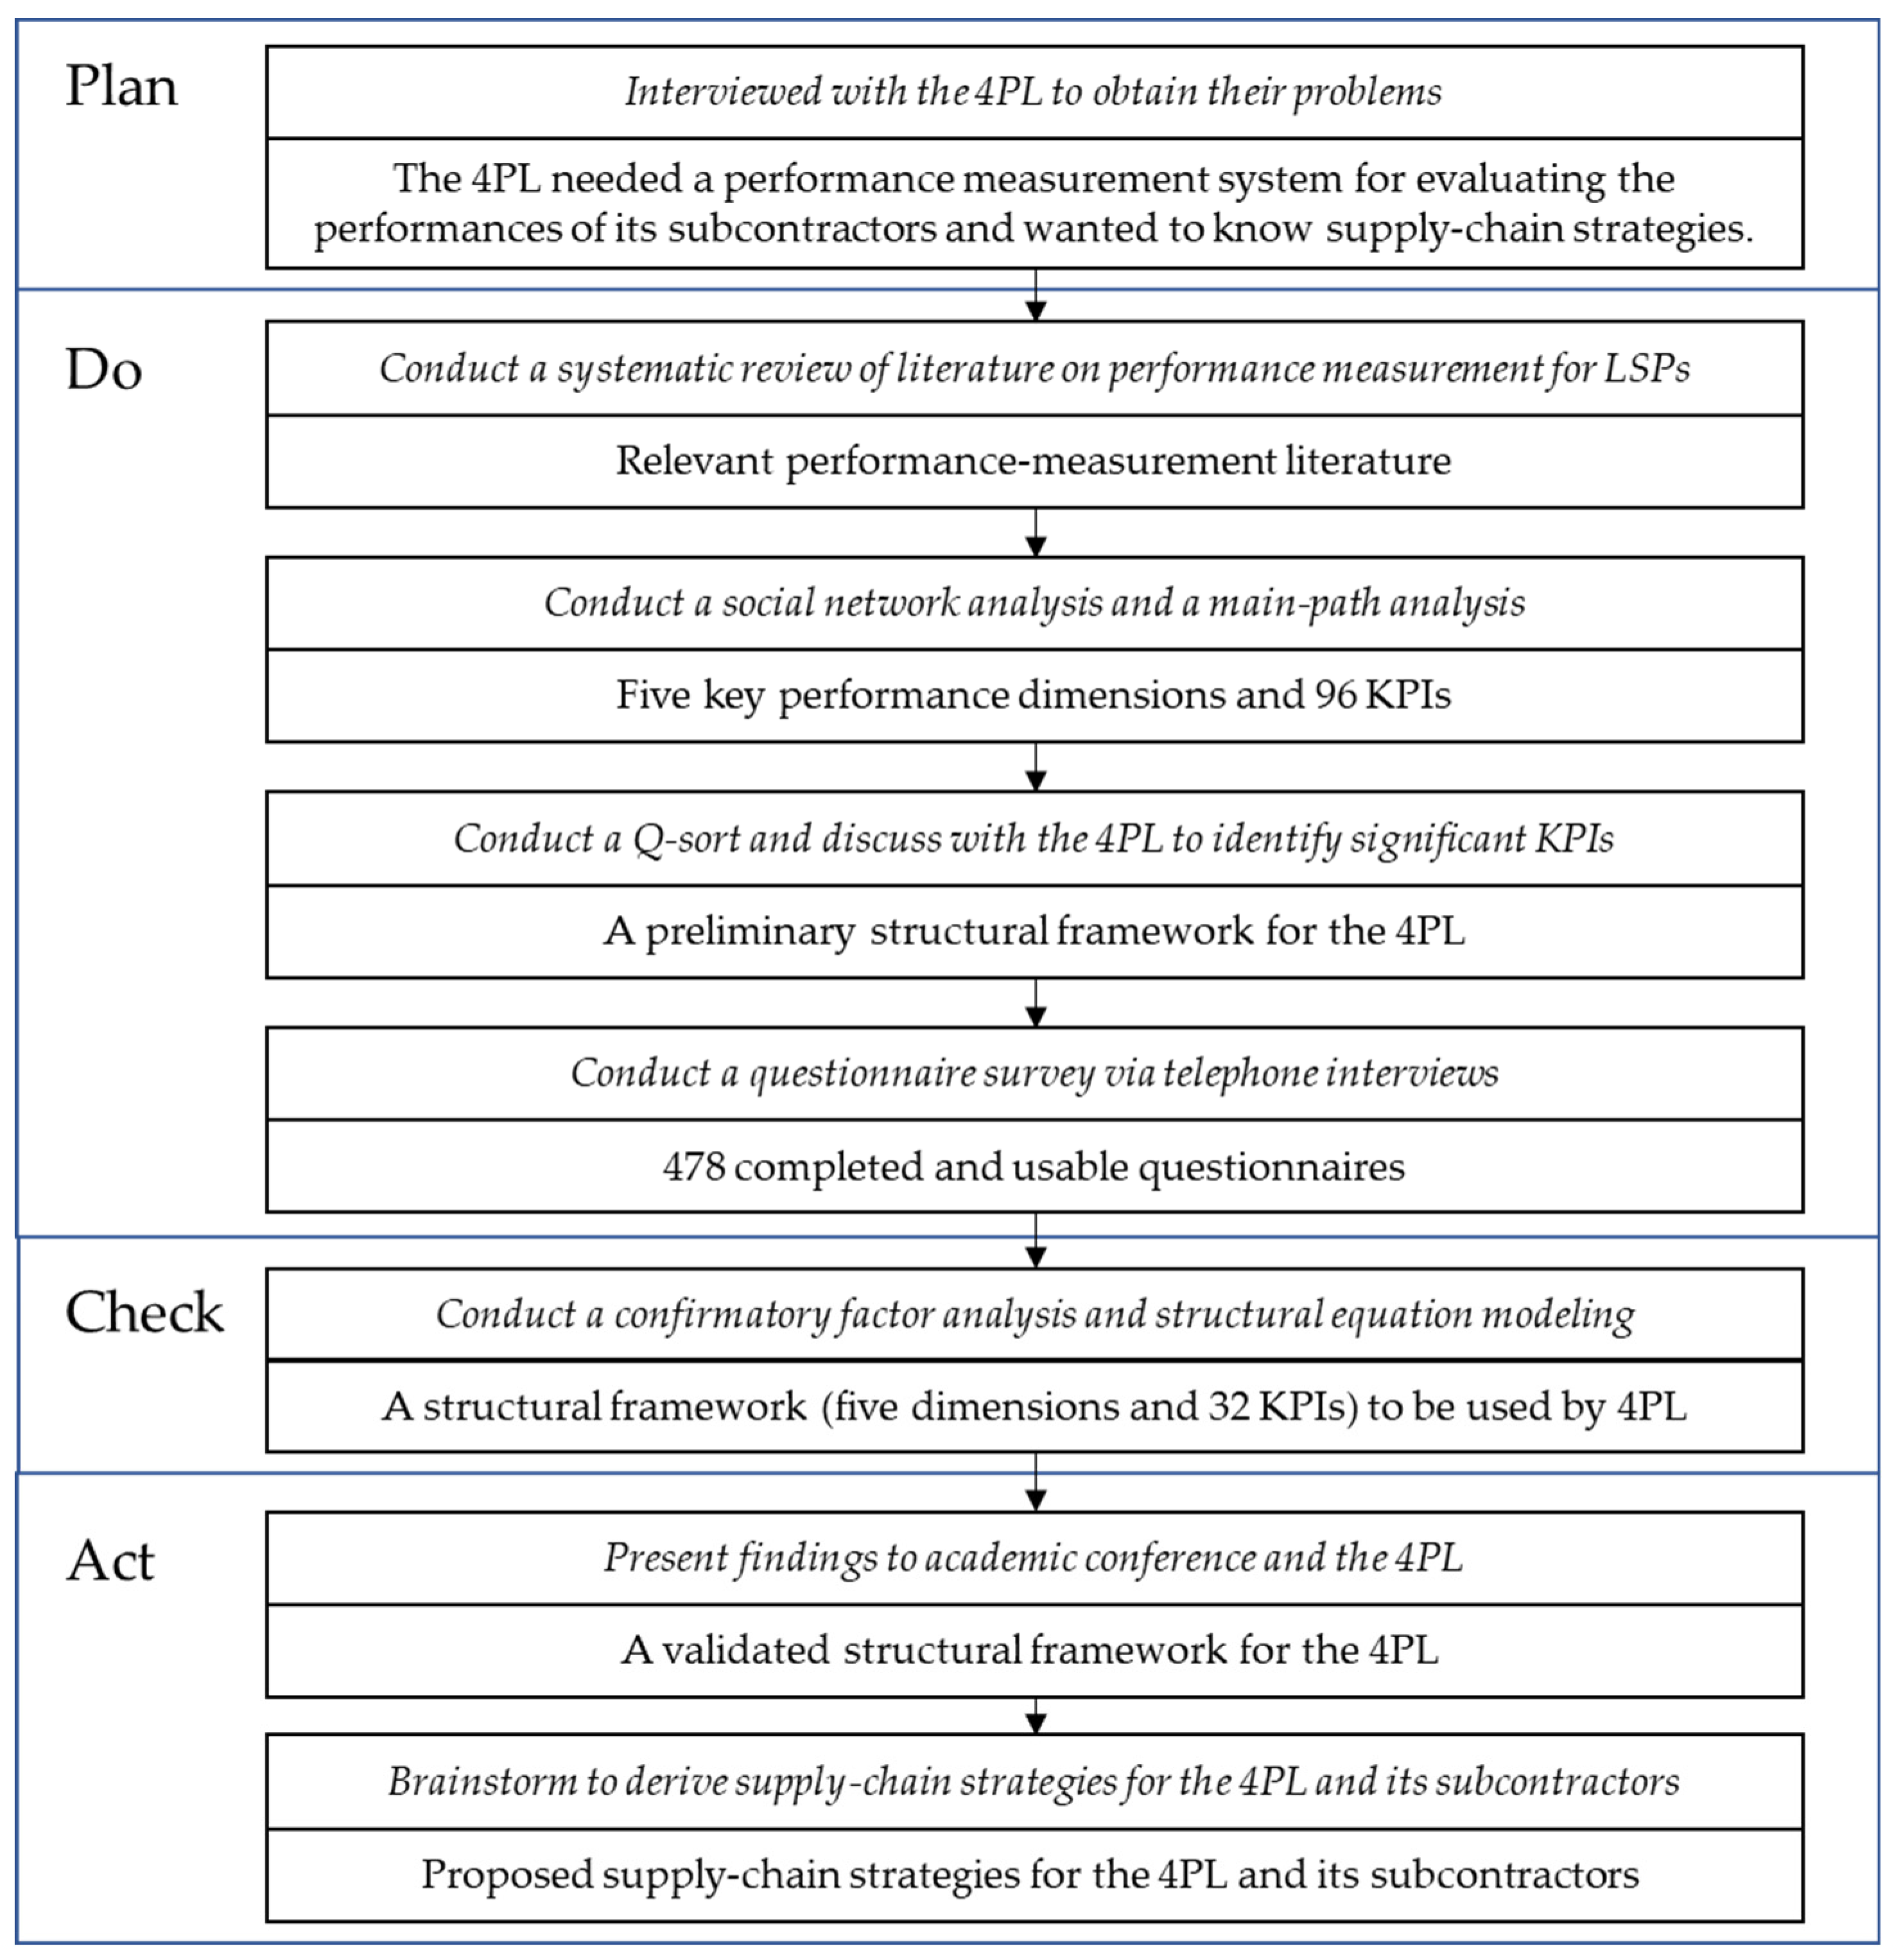
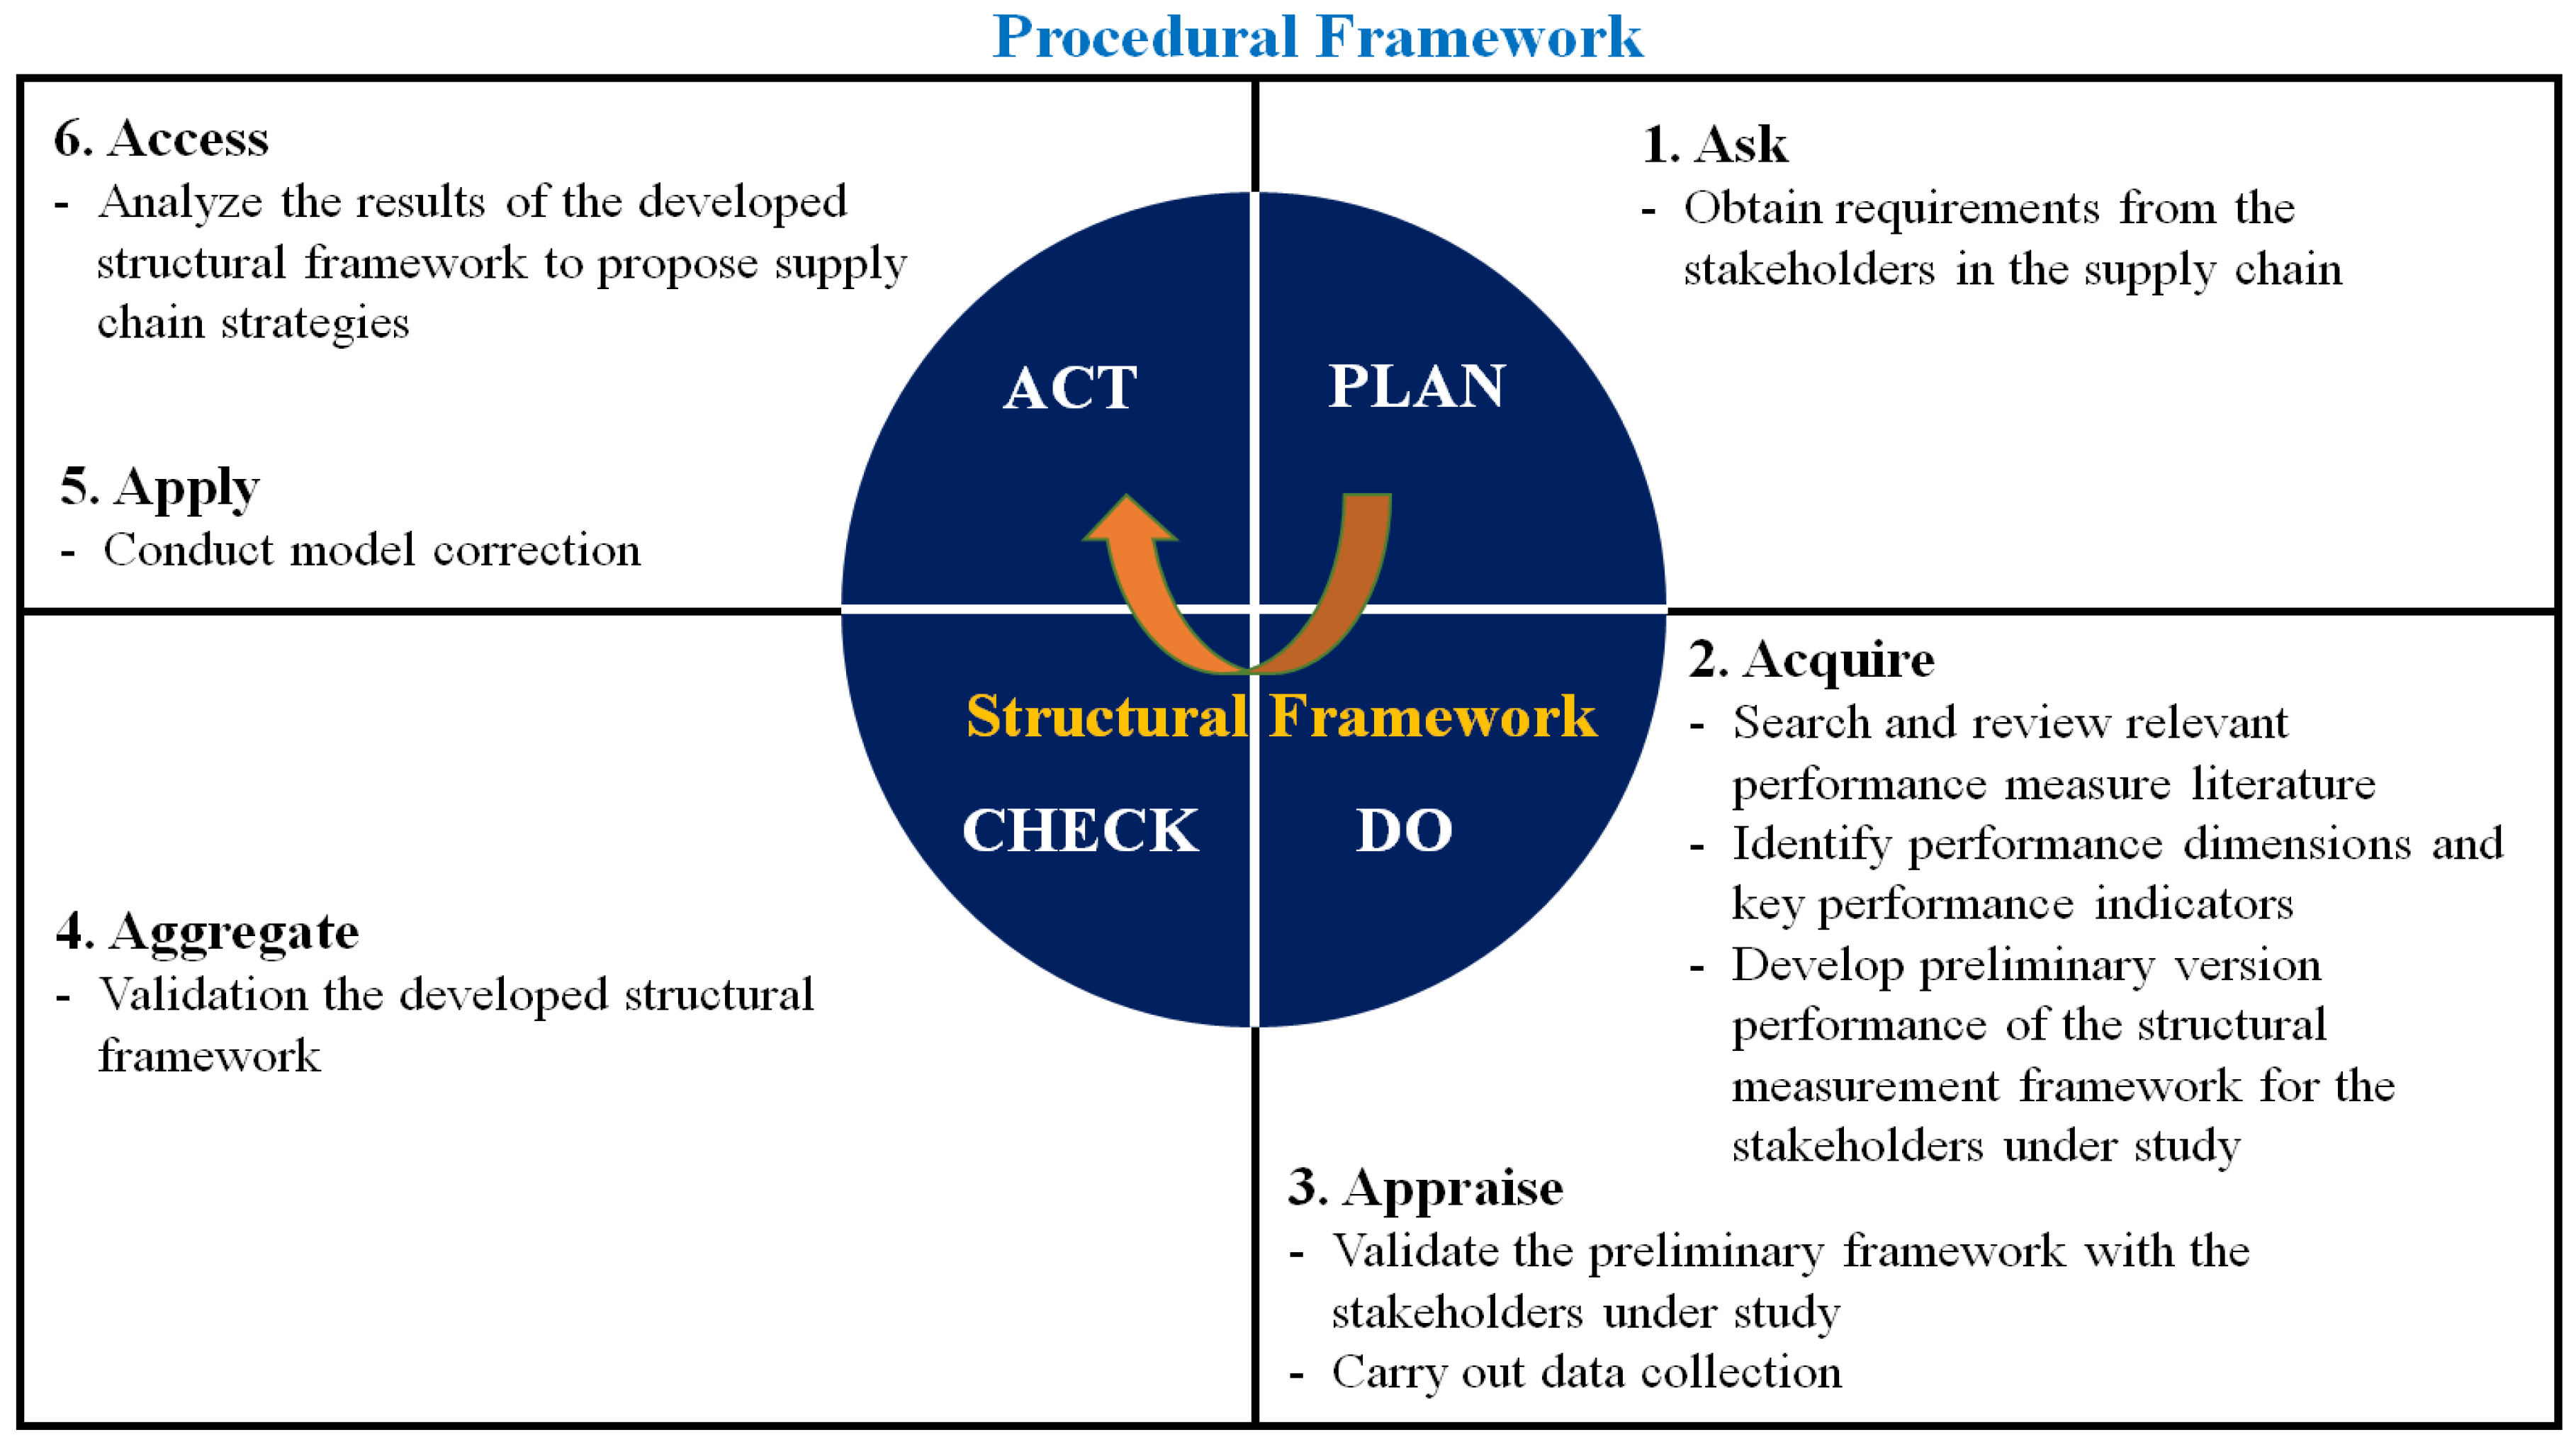
| PDCA | EBM | Proposed Procedural Framework | Research Instruments Used in the Study |
|---|---|---|---|
| Plan: identifying a problem. | Ask: translate practical problems into answerable inquiries. | Obtain requirements from FIRM. | Interview with the management team of FIRM. |
| Do: carrying out the Plan. | Acquire: systematically search for and retrieve the evidence. | Search and review relevant performance-measurement literature. | Conduct a systematic review of literature on performance-measurement for LSPs. |
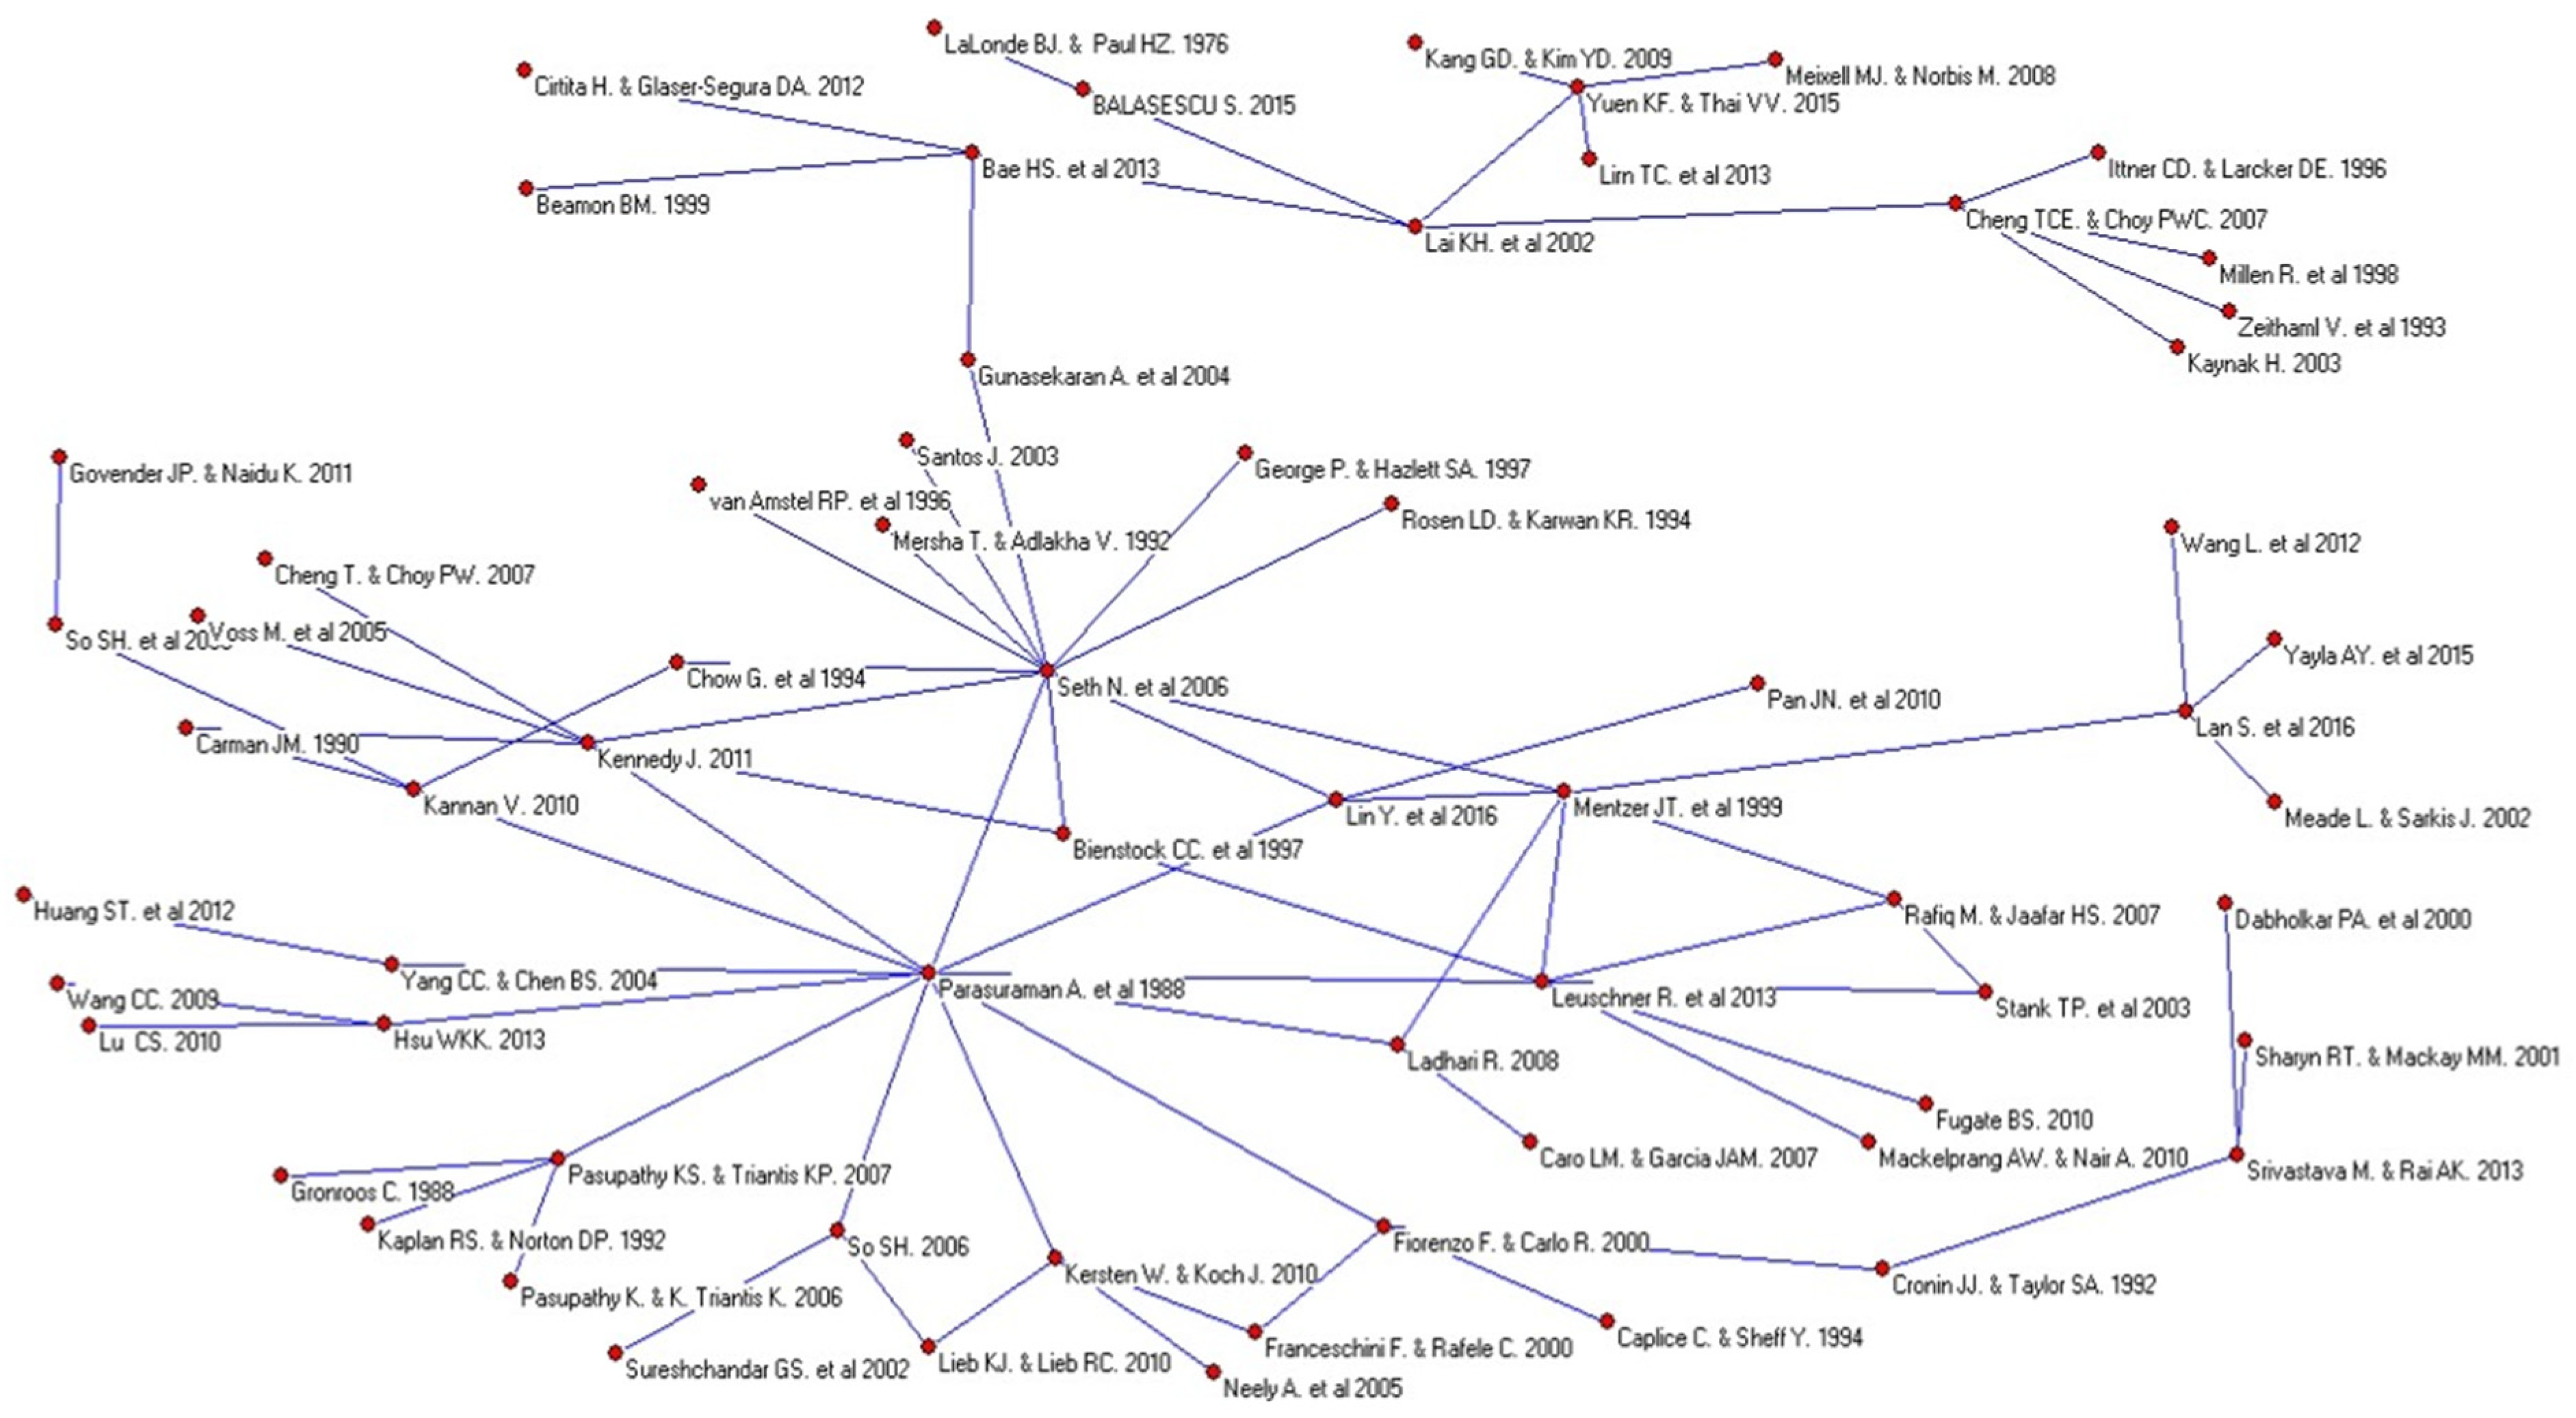
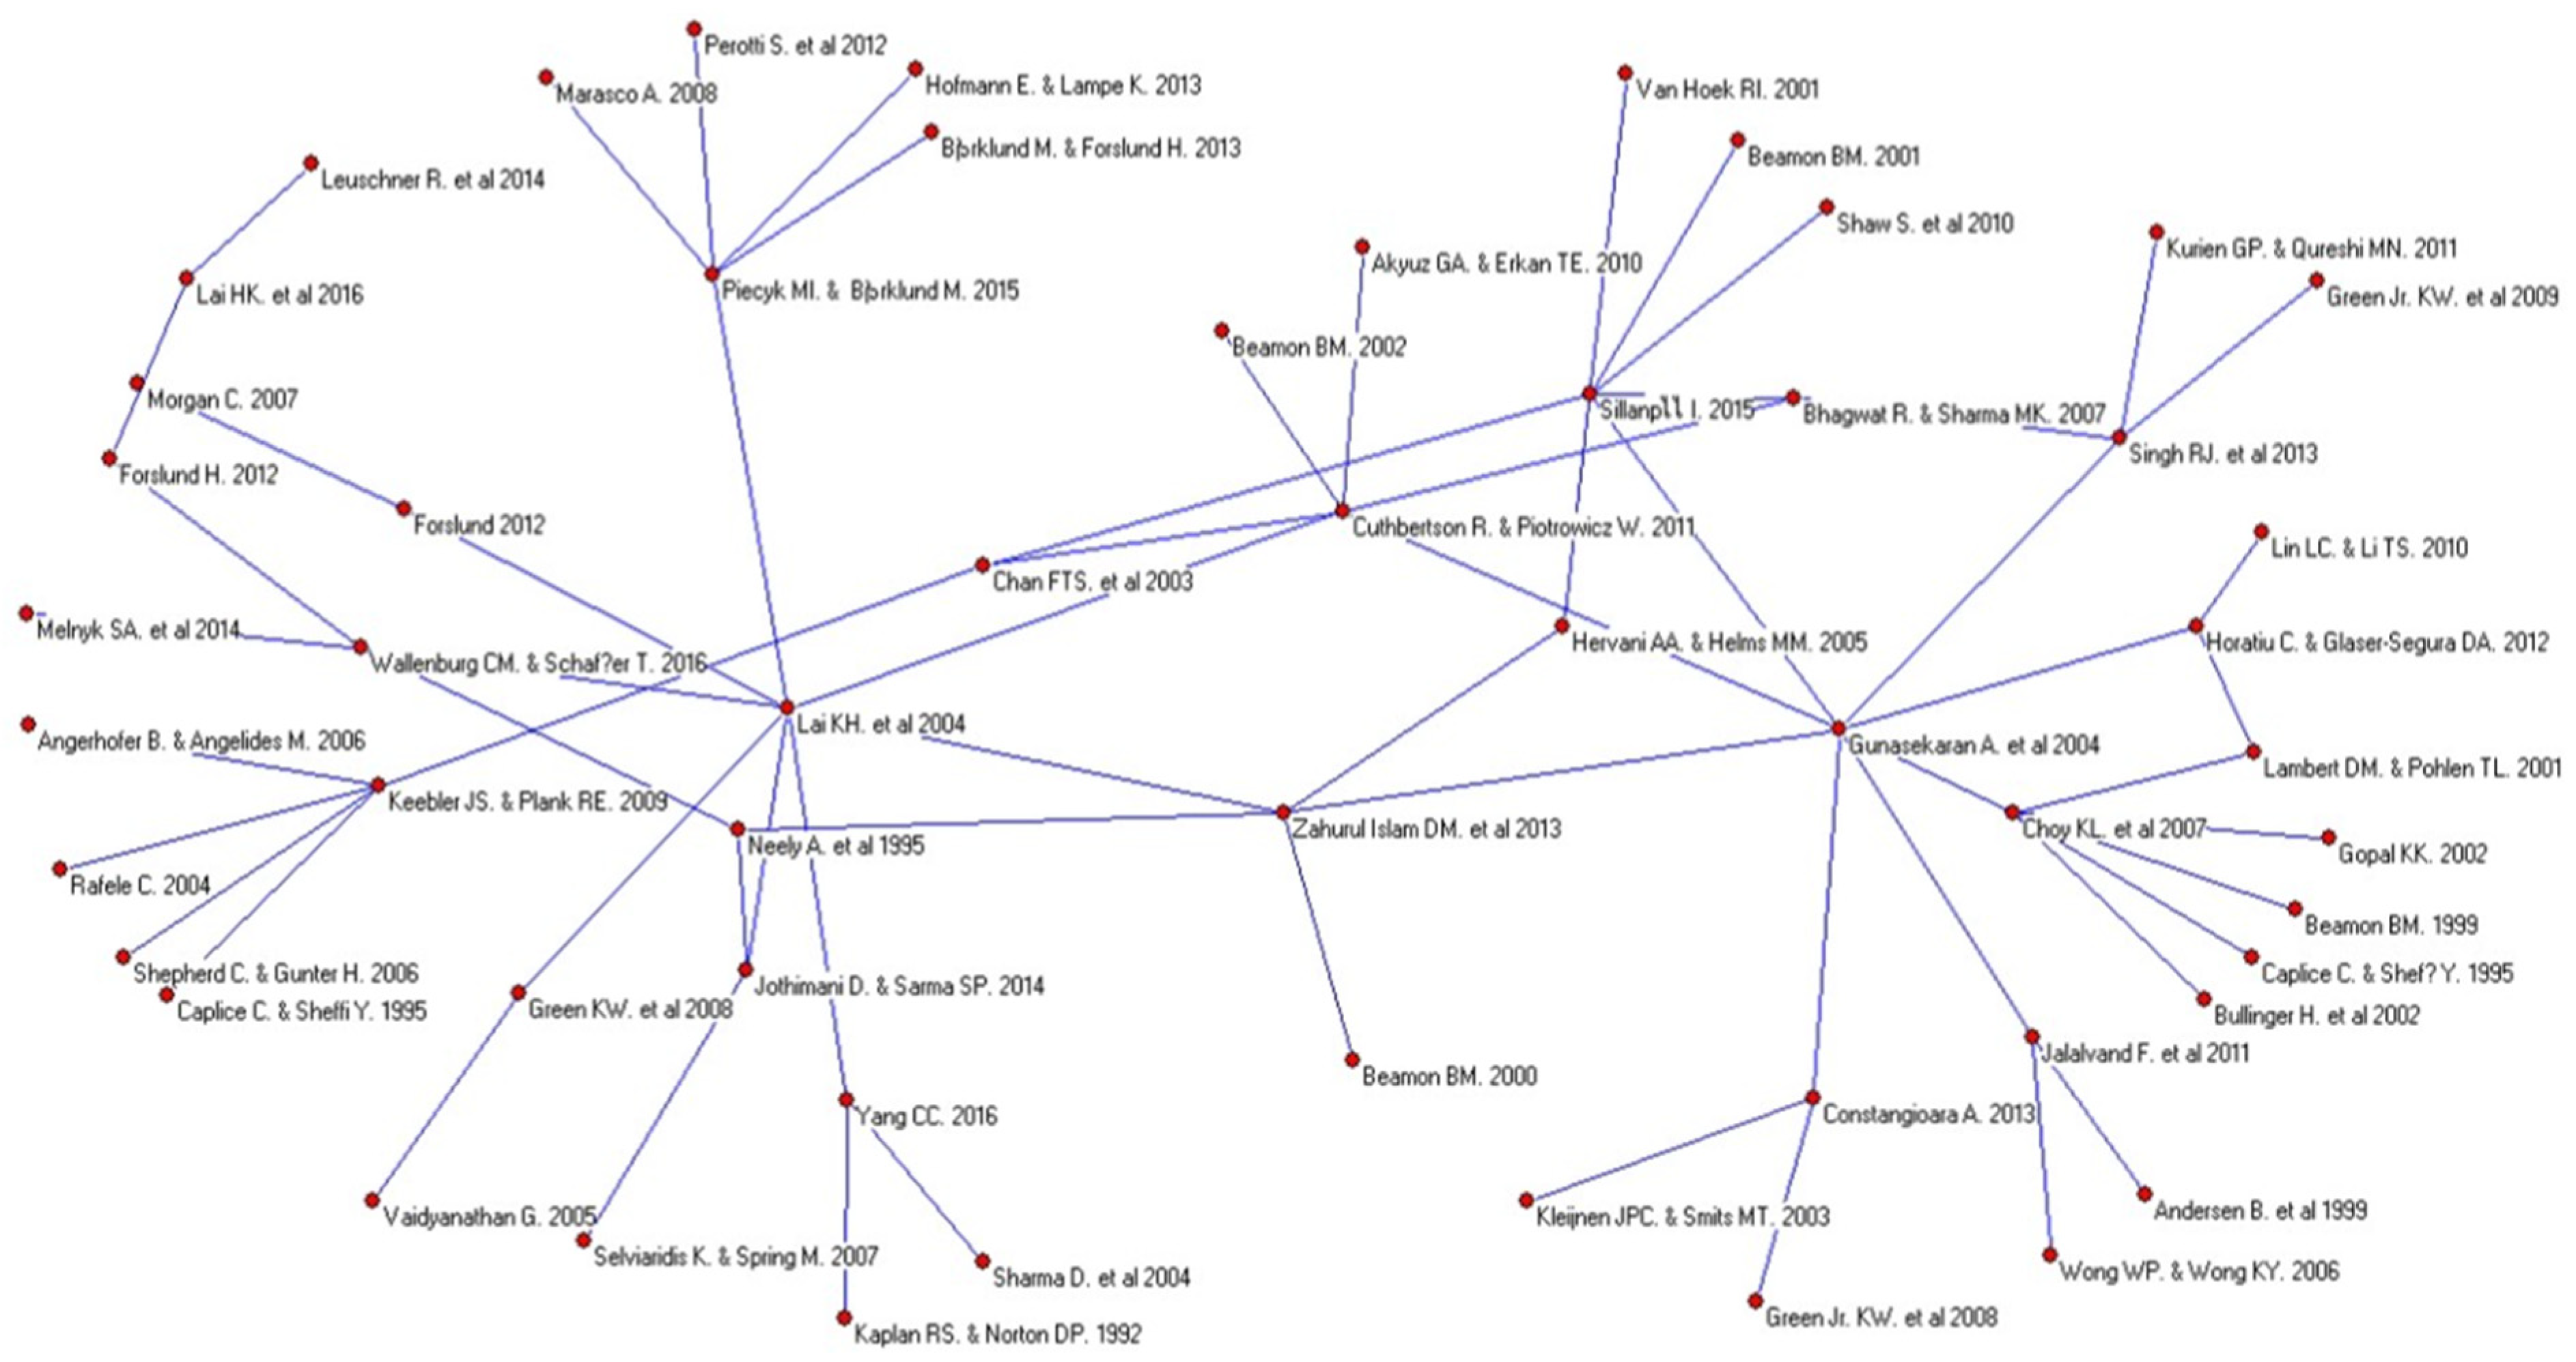
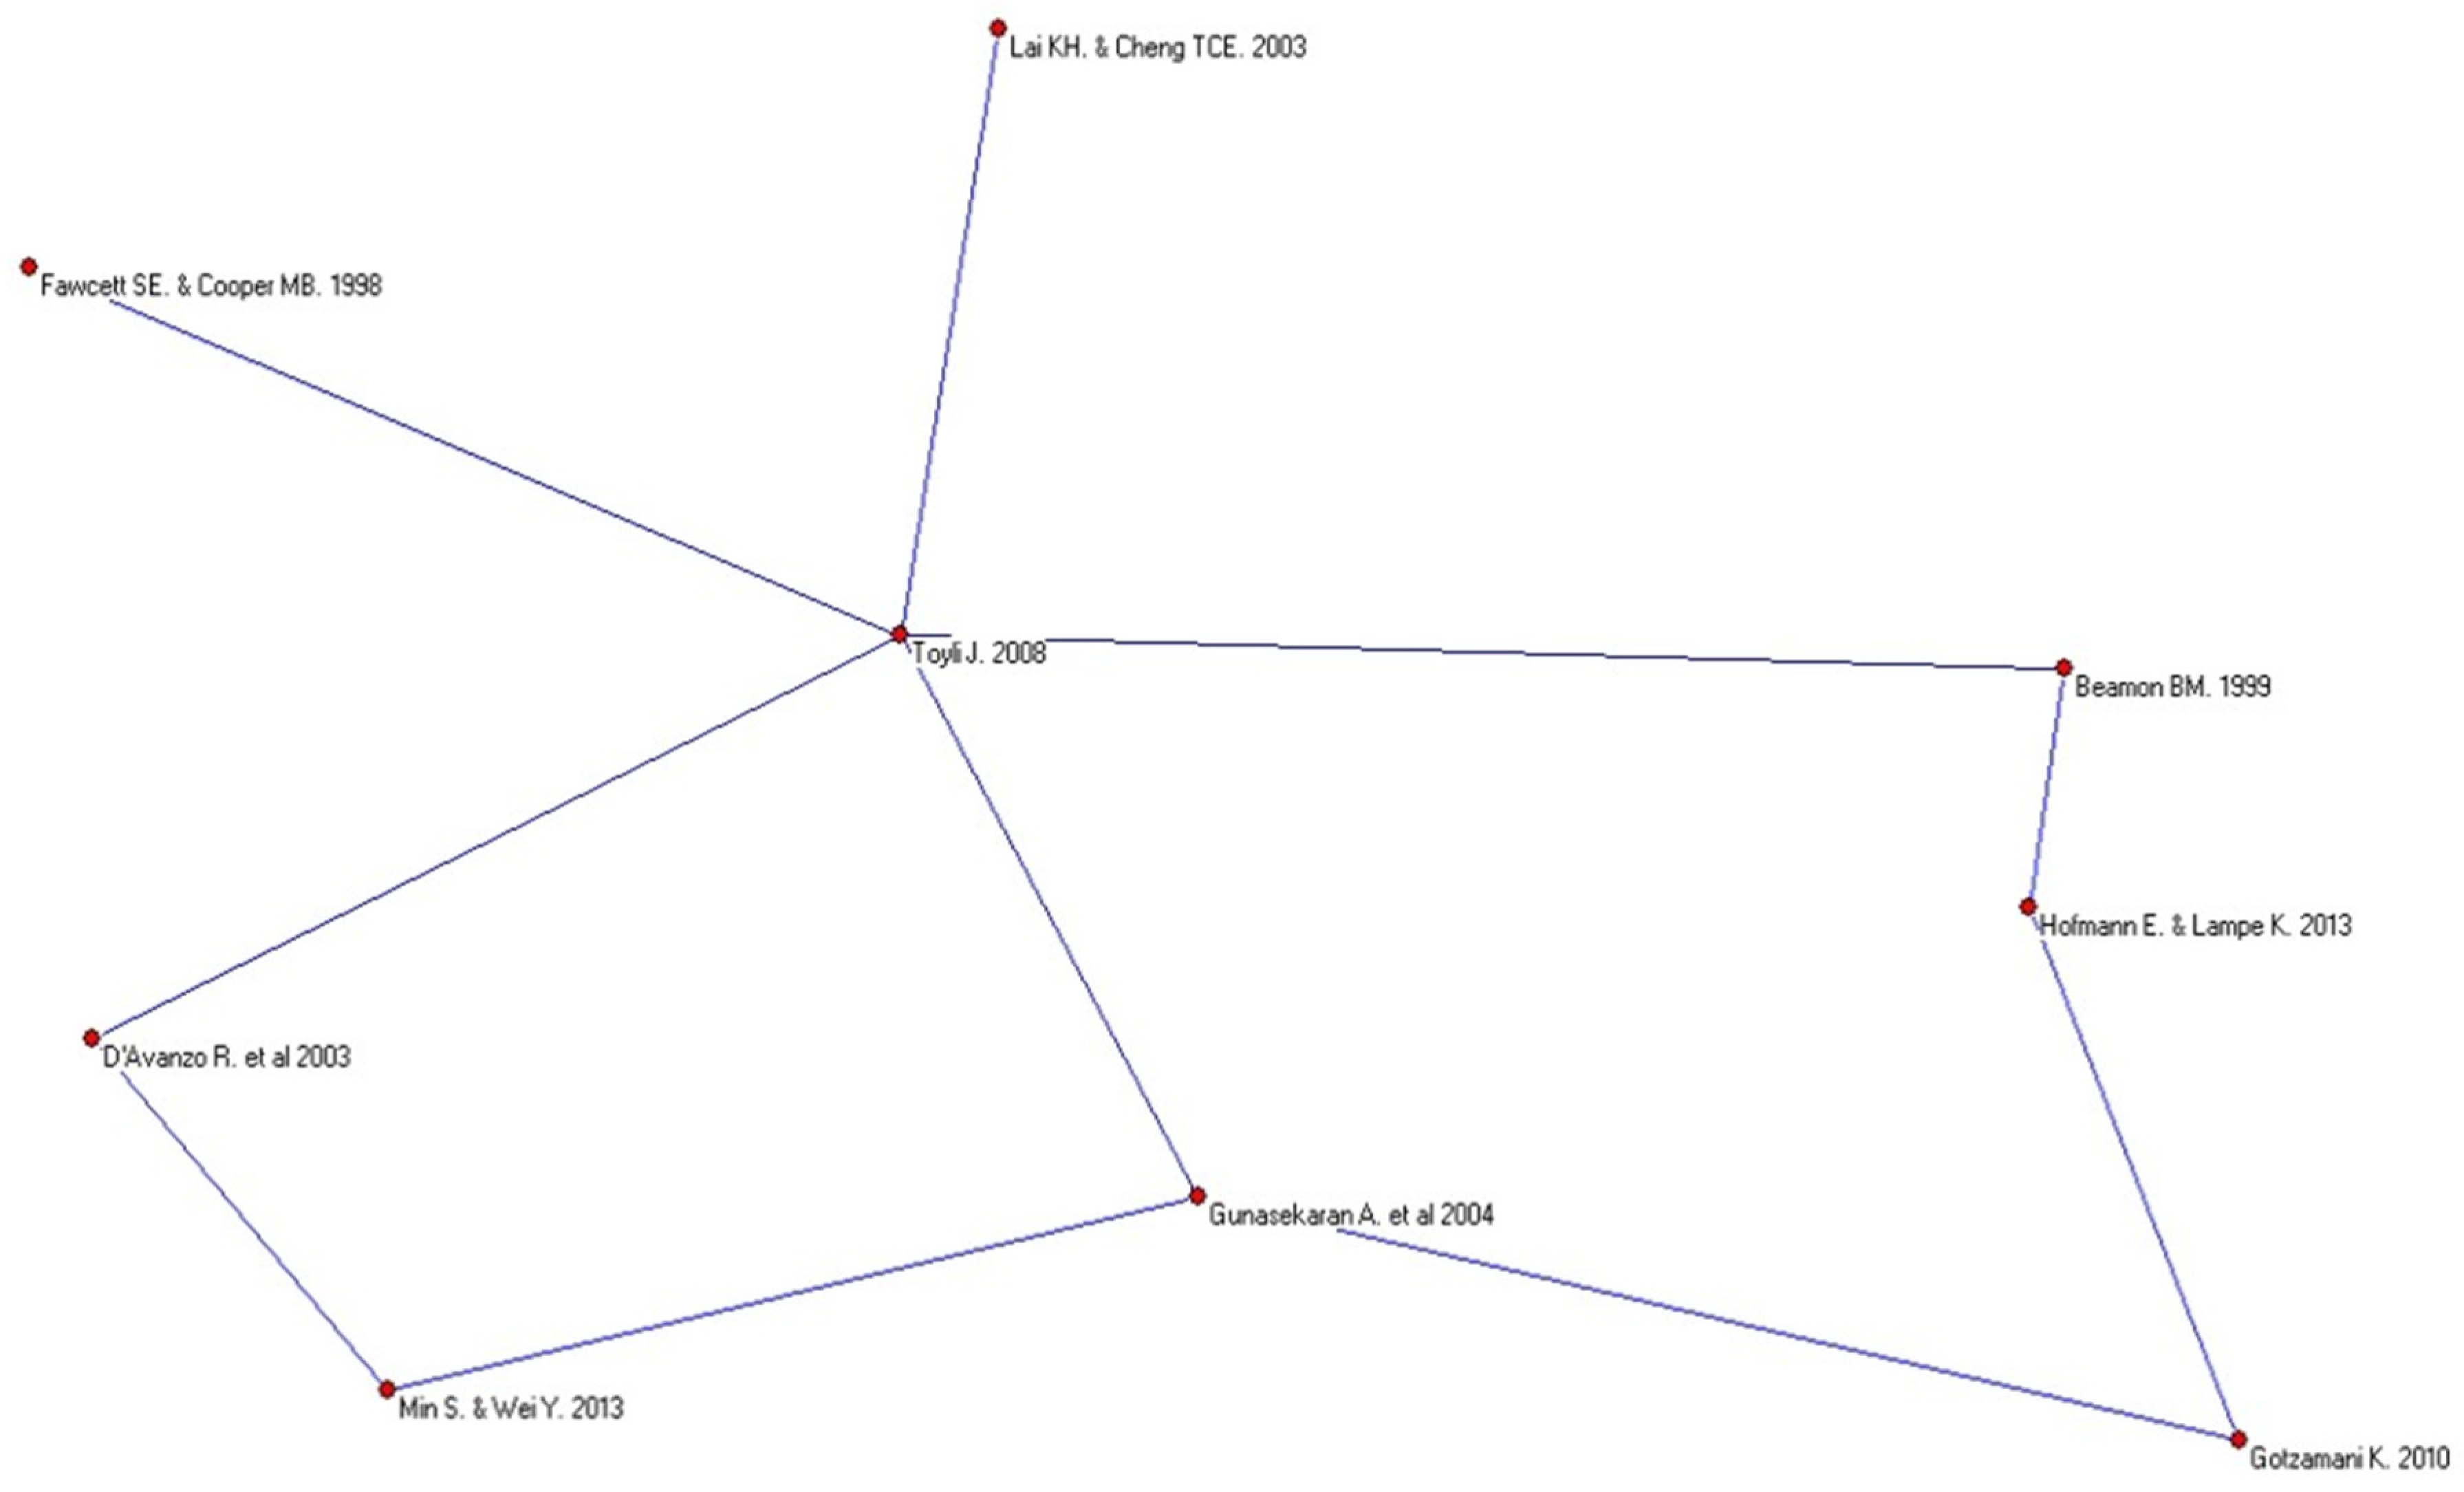
| Identify performance dimensions and key performance indicators (KPIs). | Conduct a social network analysis, to reveal key performance dimensions and a main-path analysis to identify relevant KPIs. | ||
| Develop preliminary-version performance of the structural-measurement framework for FIRM and its subcontractors under study. | Choose the system model as a theoretical foundation for a preliminary framework, using the Q-sort technique to sort the key performance dimensions and KPIs into a preliminary framework. | ||
| Appraise: critically assess the reliability and significance of the evidence. | Validate the preliminary framework with FIRM under study. | Interview and discuss with FIRM, to refine the preliminary framework to fit with the FIRM context. | |
| Carry out data collection. | Collect data from FIRM’s subcontractors, using a questionnaire survey via telephone interviews. | ||
| Check: analysis of data. | Aggregate: weigh and pull evidence together. | Validate the measurement model and the structural model. | Analyze the obtained data, using confirmatory factor analysis and structural equation modeling. |
| Act: activities to close the gaps and evaluations of the outcomes of these actions. | Apply: incorporate the evidence in the decision-making process. | Conduct model correction. | Present findings to academic conference, and to the management team of FIRM. |
| Assess: analyze the outcome of the decision made. | Analyze the results of the developed structural framework to propose supply-chain strategies. | Brainstorm between the authors, to derive supply-chain strategies for FIRM. |
| PDCA | EBM | Proposed Procedural Framework | Evidence-Based Findings |
|---|---|---|---|
| Plan | Ask | Obtain requirements from FIRM. |
|
| Do | Acquire | Search and review relevant performance-measurement literature. |
|
| Identify performance dimensions and key performance indicators (KPIs). |
| ||
| Develop preliminary-version performance of the structural-measurement framework for FIRM and its subcontractors under study. |
| ||
| Appraise | Validate the preliminary framework with FIRM under study. |
| |
| Carry out data collection. |
| ||
| Check | Aggregate | Validate the measurement model and the structural model. |
|
| Act | Apply | Conduct model correction. |
|
| Assess | Analyze the results of the developed structural framework to propose supply-chain strategies |
|
| Dimension | Input Performance | Output Performance | |||
|---|---|---|---|---|---|
| Service Quality | Social and Environmental | Inter-Organizational Relationship | Financial | Efficiency and Effectiveness | |
| KPI |
|
|
|
|
|
| Dimension | Indicator | Examples of Supply-Chain Strategies | Examples of Operations Strategies |
|---|---|---|---|
| ‘Service Quality’ | Provide enough information to FIRM (SQ9). | Improve the effectiveness of the information-sharing system between FIRM and subcontractors, in terms of day-to-day operational information. |
|
| ‘Social and Environmental’ | Encounter any employee strike in the past two years (SE6). | Increase collaboration between FIRM and subcontractors, to develop collaborative workforce management. |
|
| Adopt an Environmental Management System (EMS) (SE9). | Promote sustainable resources management between FIRM and subcontractors. |
| |
| ‘Inter-organizational Relationship’ | Exchange information with each other, such as co-planning work, and joint decisions (IR7). | Improve the effectiveness of the information-sharing system between FIRM and subcontractors, in terms of joint decision making, planning, and research and development programs. |
|
| Implement knowledge and technology transfer (IR8). | Initiate knowledge- and technology- sharing orientation between FIRM and subcontractors. | ||
| Have a written contract agreement (IR10). | Adopt efficient legal enforcing contracts and agreements. |
|
Publisher’s Note: MDPI stays neutral with regard to jurisdictional claims in published maps and institutional affiliations. |
© 2022 by the authors. Licensee MDPI, Basel, Switzerland. This article is an open access article distributed under the terms and conditions of the Creative Commons Attribution (CC BY) license (https://creativecommons.org/licenses/by/4.0/).
Share and Cite
Varadejsatitwong, P.; Banomyong, R.; Julagasigorn, P. A Proposed Performance-Measurement System for Enabling Supply-Chain Strategies. Sustainability 2022, 14, 11797. https://doi.org/10.3390/su141911797
Varadejsatitwong P, Banomyong R, Julagasigorn P. A Proposed Performance-Measurement System for Enabling Supply-Chain Strategies. Sustainability. 2022; 14(19):11797. https://doi.org/10.3390/su141911797
Chicago/Turabian StyleVaradejsatitwong, Paitoon, Ruth Banomyong, and Puthipong Julagasigorn. 2022. "A Proposed Performance-Measurement System for Enabling Supply-Chain Strategies" Sustainability 14, no. 19: 11797. https://doi.org/10.3390/su141911797
APA StyleVaradejsatitwong, P., Banomyong, R., & Julagasigorn, P. (2022). A Proposed Performance-Measurement System for Enabling Supply-Chain Strategies. Sustainability, 14(19), 11797. https://doi.org/10.3390/su141911797