Abstract
Rivers within urban areas could influence the thermal environment by modifying air temperature (AT) and relative humidity (RH). To further explore the cooling effect of a large river on surrounding urban areas, we conducted mobile measurements near the Yangtze River in Wuhan during a hot and humid summer day. This research examined the river cooling effect, determined the thresholds of the cooling and humidifying distance using a third-order polynomial method, assessed littoral heat stress at the pedestrian level and investigated the impact of the littoral built environment using stepwise regression analysis. The results revealed that (1) the cooling and humidifying effect of the river was up to 3.55 °C, 1741 m and 17.25%, 1369 m in the daytime, which was much greater than that at night; (2) the river significantly mitigated pedestrian heat stress within 1200 m from the riverbank in the daytime, but showed a weak negative effect at night; (3) the built environment has a significant impact on the littoral areas, e.g., urban greening during the daytime and building morphology at night. The findings of this study provide empirical evidence for the cooling effect of a large river in urban areas and further support climate-sensitive planning and design for our thermal environment.
1. Introduction
Facing the great challenge of climate change [], urban heat island (UHI) is becoming an urgent topic for the improvement of human habitats. In 2018, more than 55% of the world’s population lived in cities [], and this number is increasing as the urbanization process develops. For the health of urban residents, global cities are facing a pressing need for mitigation and adaptation strategies to alleviate UHI for urban planning and management processes [,,,]. One of the widely applied strategies is to utilize the cooling effect of natural resources (i.e., urban open waterbodies) to improve the thermal environment.
Urban waterbodies have great potential to modify the thermal environment through heat capacity and evaporative processes [,]. A large number of studies have demonstrated the thermal impact of open waterbodies on surrounding urban areas in warm seasons. However, conclusions about the cooling provision of urban waterbodies remain controversial in the current literature. For example, some studies observed cooling effects provided by small rivers, i.e., average cooling of nearly 1 °C in the warm season [] and a maximum of 3 °C in extremely hot weather [], whereas some studies revealed that open waterbodies in urban areas could increase, rather than decrease, the UHI effect [,]. In general, the water cooling effect is related to the geometric characteristics of the waterbody and is not consistent between day and night [,]. So far, there is limited empirical evidence to underpin the argument. In addition, urban waterbodies could decrease temperature and increase humidity simultaneously, having the opposite effect on thermal comfort [,]. In extremely hot weather, the assessment of heat stress at the pedestrian level by combining the water cooling effect and humidifying effect is worthy of further attention.
The cooling effect of urban waterbodies has been explored by both remote-sensed land surface temperature [,,,] and ground-observed air temperature [,,,,,,] in previous studies. The data collection methods of ground-based observation in previous studies mainly involved fixed and mobile measurements []. Compared with a fixed station, mobile measurement could provide better spatial resolution data at a lower cost. Mobile data collection at the pedestrian level is helpful to acquire “real-world” microclimate parameters and describe accurate thermal conditions that people can feel. Therefore, it has been regarded as a cost-effective method and is being increasingly used to investigate the outdoor thermal environment. A typical case of mobile measurement was conducted near the Cheonggye River and revealed a mean river cooling effect of 0.46 °C, 32.7 m at 2 p.m. and 0.37 °C, 37.2 m at 10 p.m. []. Other researchers used mobile measurement to monitor intra-urban air temperature at a micro-scale [,], examine the cooling effect of urban green spaces [,] and assess the UHI effect inside local climate zones [,]. These previous studies confirm the feasibility of using mobile measurement methods for microclimate investigation [].
The cooling effect of the urban waterbody is also influenced by the characteristics of the littoral built environment, including urban greening and building morphology. On one hand, urban greening could provide a cooling effect during the hot summer season by shading and evapotranspiration [,]. The green coverage ratio is one of the main impact factors affecting the cooling provision [,] and a 10% increase in tree cover led to a 0.052 °C drop in temperature in Hong Kong []. On the other hand, building morphology plays an important role in pedestrian microclimate [,,]. Previous scholars related the openness of an urban form, which is measured as the sky view factor, with UHI intensity [,]. Air temperature was also found to correlate with building morphology, including the indicators of building density [,,], building height [,] and floor area ratio [,,]. In littoral areas, local building environment indicators were found to have an impact on the water cooling effect. For example, since potential cooling by urban greening and waterbodies may jointly modify the temperature and humidity with interactive effects [], higher vegetation cover in littoral areas has been observed to increase the water cooling effect []. Additionally, specific urban forms, including opening up streets to the river [,], building narrower streets and positioning lower buildings near the river [], were revealed to enhance the water cooling effect. Those efforts underlined the thermal impact of the urban built environment in littoral areas and raised the necessity to explore the interactive effects of these factors and water cooling effect in the littoral areas by local observation.
The Yangtze River, the largest river in China, has great cooling potential for the cities it flows through. Wuhan, the most populous city in the middle reaches of the Yangtze River, has a large littoral area and developers are aiming to build a waterfront ecological city. Consequently, this study obtained a mobile measurement near the Yangtze River in Wuhan and aimed to investigate the river cooling effect and the impact of the littoral built environment in the hot summer season. This study aimed to answer two main research questions: How does a large urban river cool the littoral areas? Does the urban built environment have an impact on the water cooling effect? Subsequently, three objectives were raised:
- (1)
- To reveal the spatial distribution of air temperature (AT) and relative humidity (RH) near the river in the daytime and nighttime;
- (2)
- To quantify the heat stress conditions by heat index (HI) and its spatial pattern in the littoral area;
- (3)
- To investigate the impacts of the urban built environment and the distance from the river bank on the water cooling effect within the littoral areas.
2. Materials and Methods
2.1. Study Area and Route Description
Wuhan (29°58′–31°22′ N, 113°41′–115°05′ E) is one of China’s megacities and is located in the central region (Figure 1). Over the past decade, rapid urbanization has led to the growing UHI phenomenon, which places Wuhan in top tier of the hottest cities in China. The Koppen Climate Classification is Cfa, Humid Subtropical Climate. The average annual temperature is 17.5 °C, the average annual rainfall is 1269 mm and the total annual sunshine hours range from 1810 to 2100 h. The prevailing wind direction is southeast in summer and northwest in winter. Wuhan features a long summer period from June to September, with a maximum temperature of 37–39 °C, abundant rainfall and typically low wind speed. Known as the River City, Wuhan is built along the Yangtze River, which flows through the city with an average width of 1.3 km. Open waterbodies are not only essential for hydrological and carbon cycles [,], but also play an important role in regulating urban climate [].
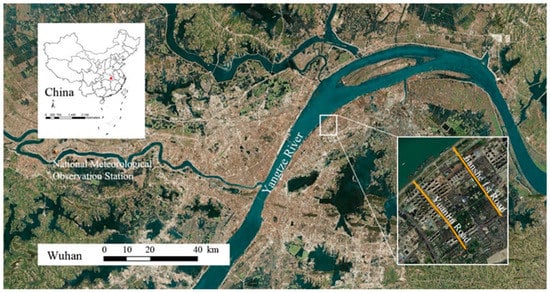
Figure 1.
Study area and the measurement routes.
To investigate the water cooling effect in urban areas, we selected a relatively typical urban area near the Yangtze River to conduct the mobile measurement. The density and height of surrounding buildings are moderate. The survey points arrayed along two routes: Yuanlin road (YL) and Jianshe 1st road (JS). Both start from the riverside and have the same orientation, i.e., approximately perpendicular to the river. The two routes, less than one kilometer from each other, provide 35 survey points within a 1.8 km distance from the riverbank to collect temperature and humidity data. The locations are shown in Figure 1 and the detailed surrounding environment is shown in Figure 2.
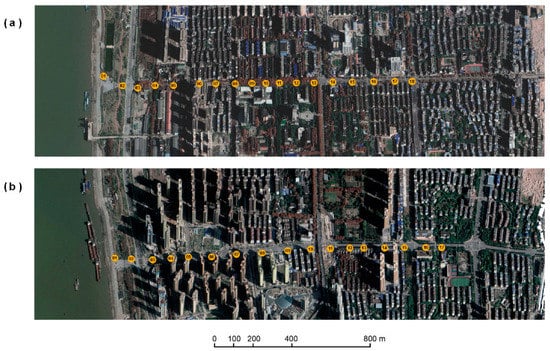
Figure 2.
Survey points and the surrounding built environment: (a) Jianshe 1st Road; (b) Yuanlin Road.
2.2. Field Measurements
HOBO U23 Pro V2 data loggers were used to collect air temperature (AT) and relative humidity (RH). The operation ranges were −40 °C to 70 °C and 0% to 100%, the accuracies were ±0.2 °C and ±2.5% and the resolutions were 0.04 °C and 0.05%, respectively. To avoid direct sunshine, each HOBO sensor was sheltered under a ventilated solar shelter. The sensors were set at a 1.5 m height and logged at a time interval of one second. Meanwhile, a portable GPS device (Magellan eXplorist 310) was used to record the location during the mobile measurement.
The measurement was taken on 21 July 2018, an extremely hot day with a clear sky and calm weather. The average daily temperature was 32.72 °C, the maximum temperature was 38.40 °C and the average daily wind speed was 1.50 m/s. The details of the weather conditions are listed in Table A1. The sensors were calibrated before the measurement and the data collected from different routes were corrected using the difference between the calibration values. The mobile measurement was taken during both daytime (9:00–10:30) and nighttime (22:00–23:30). A total of 35 survey points were set in the two routes (Figure 2) and the distances between the points ranged from 50 to 200 m. Between each measurement point, the equipment was ensured to stabilize for at least 20 s; afterwards, it stayed for 2 min for data collection before moving to the next point.
2.3. Survey Data Preprocess
For each point, the data collected in the first 20 s were removed for the stabilized periods, and the data of the remaining 100 s and the last 10 s were then compared. The correlations between these two periods were almost equal, with R2 above 0.99 and the slope nearly equaling 1 (Figure A1). Therefore, the equipment was deemed to be stabilized and the data during the last 100 s were averaged for each survey point.
To limit the impact of background weather, the duration of each transect measurement was no more than 90 min. Then, we corrected the temporal change of background AT and RH for the transect survey points based on the data from the National Meteorological Observation Station (No. 57494) (Figure 2). The hourly air temperature and relative humidity data on the measurement day were obtained (Table A1) and the measured AT and RH were corrected by a linear detrending for each route [,].
2.4. Heat Stress
Then, we further examined the impact of the river on apparent temperature and quantify the littoral heat stress at the pedestrian level. The apparent temperature is affected by air temperature, relative humidity, solar radiation, wind speed, air pressure, clothing condition, etc., and was proposed to assess sultriness in high temperature and humidity conditions []. As a simplified version of apparent temperature, Heat Index (HI) has become a popular heat exposure metric in thermal comfort and environmental health []. It is a primary indicator used by the US National Weather Service (NWS) because it is closely relevant to heat-related morbidity [] and it has been employed to investigate thermal comfort in some Chinese cities [,]. HI measures how the temperature feels to the human body [] by combining the effects of air temperature and relative humidity []. Focusing on the apparent temperature under a relatively high temperature, high humidity and low wind speed, HI was selected subsequently and calculated as shown in Equation (1) []:
where T was air temperature (AT in degrees Fahrenheit) and R was the relative humidity (RH) [].
HI = −42.379 + 2.04901523 T + 10.14333127 R − 0.22475541 T R − 0.00683783
T2 − 0.05481717 R2 + 0.00122874 T2 R + 0.00085282 T R2 − 0.00000199 T2 R2
T2 − 0.05481717 R2 + 0.00122874 T2 R + 0.00085282 T R2 − 0.00000199 T2 R2
2.5. The Urban Built Environment
The measured area is located in the southeast of the Yangtze River and all the roads are parallel or vertical to the riverbank (Figure 1). This area is dominated by mid- and high-rise buildings (no more than 100 m), with relatively moderate building density and urban greening. The built environment at the local scale usually includes street location, building geometry and vegetation cover. Since the survey points of this study were distributed in the streets with the same orientation, the impact of the built environment was considered to be mainly from urban greening and building morphology. To quantify the urban greening coverage around the survey points, NDVI-based Fractional Vegetation Cover (FVC) was used. The Sentinel-2A imagery (10 m resolution multispectral) obtained on July 29, 2018, with a cloud cover percentage of 1.59%, was employed to calculate the NDVI. Both the image date and time were very close to that of our field measurement. Therefore, the selected imagery can generally represent the green coverage on the day of the measurement. Initially, the NDVI was calculated as shown in Equation (2):
where NIR was the Band 8 (central wavelength 842 nm) of Sentinel-2 and RED was the B4 (central wavelength 665 nm), respectively. Then, the fractional vegetation cover (FVC) was derived by scaling NDVI based on a dense vegetation mosaic-pixel model [,], as shown in Equation (3):
where NDVIs was the NDVI of bare soil and NDVI∞ was the NDVI of pure vegetation.
NDVI = (NIR − RED)/(NIR + RED)
FVC = (NDVI − NDVIs)/(NDVI∞ − NDVIs)
To quantify the urban morphology, four commonly used indicators were selected from both 2D (two-dimensional) and 3D (three-dimensional) perspectives [,,,,,,,,]. The 2D indicator was building density (BD) and building height (BH). The 3D indicators were sky view factor (SVF) and floor area ratio (FAR). Lan and Zhan [] revealed that 200 m was an optimal spatial scale for examining the AT–building relationship in Wuhan, so we calculated the morphological indicators at a 200 m scale (i.e., with a buffer radius of 100 m around each point). The details of the indicators and their formula can be found in Table 1.

Table 1.
Definition and formula of the selected building morphological indicators.
2.6. Data Analysis
A third-order polynomial method was used to determine the maximum distance where the cooling effect of the river could reach [,]. The inflexion distance was calculated from the fitting curve of the distance–AT/RH function, which indicated that the microclimatic variables were no longer affected by the river beyond this distance.
To examine the relationship between the microclimate variables and morphological indicators, Pearson correlation and unary linear regression analyses were conducted. Then, taking the microclimatic variables as dependent variables, we used a stepwise multivariable regression model to analyze the potential impact factors, including distance from the riverbank, urban greening and building morphological indicators. The data analysis of this study was conducted in SPSS 22.0 and R version 4.0.0.
3. Results
3.1. The Cooling and Humidifying Effect of the River
As shown in Table 2, AT showed a range of 32.74–36.29 °C in the daytime and a range of 31.23–32.33 °C in the nighttime. The measured daytime RH ranged from 50.82% to 68.07% and the nighttime RH from 63.58% to 71.92%. Overall, the temperature was higher, the humidity was lower, and the standard deviation was larger during the daytime than that during nighttime. Additionally, there was a linear relationship between RH and AT (Figure 3) of the survey points, with the determinate coefficient of 0.907 in the daytime and 0.916 at night. The negative correlation between AT and RH implied simultaneous cooling and humidifying by the river.
Table 2.
Statistic summary of measured AT and RH.
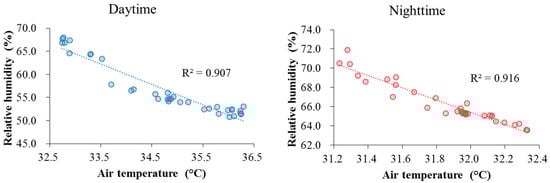
Figure 3.
Correlation between relative humidity and air temperature.
Figure 4 described the spatial distribution of littoral AT and RH. With the the distance from the riverbank (DIST) rising, the air temperature increased while the relative humidity decreased. Both AT and RH have cubic polynomial relationships with DIST. A higher coefficient was presented in the daytime for both the DIST–AT relation (R2 = 0.936) and DIST–RH relation (R2 = 0.910) than that in the nighttime (0.734 and 0.855, respectively). The inflexion distances of those cubic polynomial functions, which means the turning point of the curve and the distance of the highest or lowest values, were 1741 m for daytime AT, 1253 m for nighttime AT, 1369 m for daytime RH and 1170 m for nighttime RH. The cooling and humidifying extent during the daytime is much larger than that at night, for instance, the daytime cooling distance is 488 m and the daytime humidifying distance is 199 m farther than nighttime. Those distances indicated the furthest microclimatic influence that the Yangtze River could reach in the selected routes. Therefore, the points located out of the inflexion distances were excluded in the regression analysis in the subsequent multiple regression.
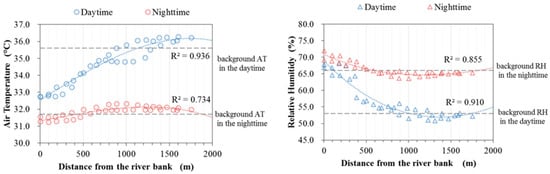
Figure 4.
Spatial variation of air temperature and relative humidity.
Taking the data from a national weather station in Wuhan (No. 57494) as a reference, we extracted the AT and RH during the hour of the mobile measurement. As shown in Figure 4, the dashed lines represent the background urban climate conditions. The intersection points between the reference line and the measurement trends appeared at around 1100 m for AT and 1000 m for RH in the daytime, which was much further than that in the nighttime, with roughly 400 m and 600 m, respectively. This indicates that, compared to the background weather condition, the cooling effect of the Yangtze River can extend to around 1000 m during the day and about 500 m at night.
3.2. Assessment of Littoral Heat Stress
As shown in Figure 3, the AT and RH of the survey points showed a negative relationship, which may exert the opposite effect on the apparent temperature. Therefore, HI, defined as apparent temperature, was selected to assess the heat stress by considering both AT and RH and its spatial variation, as illustrated in Figure 5. HI showed a linear relationship with DIST in the daytime, with the coefficient at 0.738. Similar to Section 3.1, we took the background HI value as a reference line and found that the intersection point of the daytime appeared at nearly 1200 m, which was close to that of AT and RH. During the nighttime, only a weak correlation between the HI and distance from the riverbank presented, and most of the survey points showed higher HI values than the background reference level. This implied that during the daytime, the temperature reduction from the waterbody could offset the disadvantage of the humidity promotion in the littoral zone. However, at night, humidity promotion played a bigger role and there was a slightly negative effect for littoral heat stress.
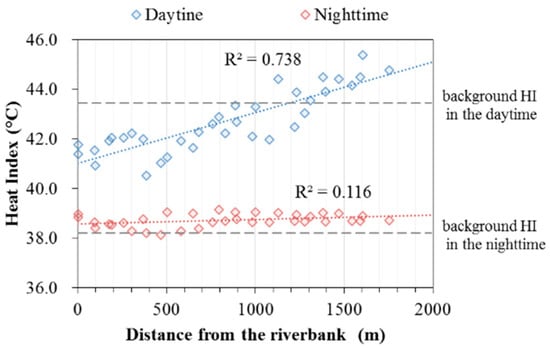
Figure 5.
Spatial variation of the heat index.
To further investigate how HI was affected by AT and RH, the relationships between them are plotted in Figure 6. Overall, the AT–HI relations were positive, and the RH–HI relations were negative. Additionally, there were some data points present as outliers during the daytime (Figure 6a,b). These outliers came from the first nine survey points in the near-shore area (Figure 6e). After excluding them, the HI showed a linear relationship with AT (R2 = 0.944) and RH (R2 = 0.695). This pattern persisted during the night, but those nine outlier points had a weaker influence on the correlations. The spatial anomaly may be due to the uneven urban form of the littoral area. The first nine points were located in the areas transecting from the open space near the river to the built environment. There is a green belt and a city road with few buildings along the riverside. The cold, damp air from the Yangtze River spreads to the littoral area and the humidity decreases gradually. Due to the lack of building obstruction, the humidity in the near-shore area is particularly high and led to higher HI values than expected. Since the near-shore area does not have a typical urban built environment, the first nine points were excluded in the regression analysis in the next step. This also underlined the necessity of exploring the impact of the morphological indicators of the built environment on the cooling effect of the urban river.
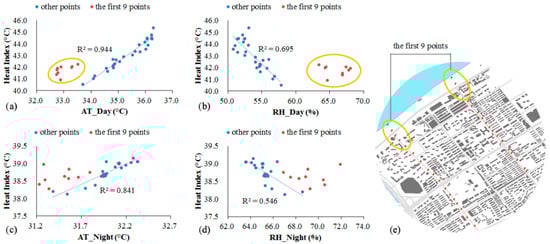
Figure 6.
Relationships between HI and AT/RH: (a) HI-AT_Day; (b) HI-RH_Day; (c) HI-AT_Night; (d) HI-RH_Night; (e) location of the first nine survey points. The red dot represents the data of the first nine survey points, and the blue dot represents the data of other survey points.
3.3. Impact of the Urban Built Environment
Table 3 summarized the main features of selected indicators, which describes the morphological conditions of greening and building along the measurement routes. FVC ranged from 0.10 to 0.67, with the regularly planted street trees for the sidewalk, an urban park beside Yuanlin Road and a university campus adjacent to Jianshe Road. As the street width along the survey routes was about 40–60 m, SVF has a mean value of 0.82 and the maximum value, which was obtained at the riverside, was nearly 1.00. BH reached up to 65 m and had an average height of 21.54 m. BD and FAR of the survey site had a mean value of 0.17 and 3.37, respectively, and reached a maximum of 0.33 and 9.12 separately. Considering the potential relations between building morphological indicators, we examined the Pearson correlation coefficients between SVF, BD, BH and FAR (Table 4), and found that FAR significantly correlated with SVF, BD and BH.
Table 3.
Statistic of urban greening and morphological indicators.
Table 4.
Pearson correlation coefficient between SVF, BD, BH and FAR.
Stepwise multivariable regression analysis was applied to investigate the relationship between the microclimate variables and the built environment features. Other than five indicators of greening and building morphology, DIST was also involved in the analysis. The first nine points in the near-shore area were excluded for their lack of representativeness of the morphological conditions (see Section 3.2), and the points exceeding the inflexion distance were also not included because they were out of the impact zone of the Yangtze River (see Section 3.1). Consequently, the regression analysis involved 25 points for daytime AT, 17 points for nighttime AT, 19 points for daytime RH, 15 points for nighttime RH and 26 points for daytime HI, respectively. Nighttime HI is not presented here, as it showed no apparent variations along with the routes at night, which is illustrated in Section 3.2.
The regression result presented in Table 5 showed that DIST was the dominant factor to influence AT and RH in both the daytime and nighttime. This reconfirmed the significant cooling effect of the large river. Among the selected indicators, FVC, together with DIST, played an important role in the daytime with the adjusted R2 of 0.831 for AT and 0.820 for RH. In the nighttime, FAR and DIST affected both AT and RH, with the adjusted R2 being 0.685 and 0.897, respectively. Similar to AT and RH, daytime HI was mainly influenced by DIST and FVC with the adjusted R2 of 0.821. Although the littoral thermal environment is complex and dynamic, the regression results indicated the urban built environment has significant impact on the cooling and humidifying effect of the urban river.
Table 5.
Multiple regression results.
4. Discussion
4.1. Cooling Effect of the Large River
Through mobile measurement, this study revealed that the large river had a great cooling effect on the surrounding built environment in the daytime and a weak cooling effect in the nighttime. For instance, during the daytime, the temperature reduction was up to 3.55 °C and the influence extended 1741 m away from the riverbank, which was much greater than most conclusions from previous studies [,,]. In the nighttime, although previous studies observed very weak cooling of 0.37 °C in Seoul [] and not evident cooling [] or relative warming in Sheffield [,], we found slight but not negligible cooling with temperature reduction of 1.10 °C and influence distance of 1253 m. One possible reason is that the Yangtze River is the largest in China, with a river width of approximately 2 km near the survey routes. The huge heat capacity of the large river makes its temperature rise very slowly [], so it still maintains a lower temperature than the urban surface at night.
Except for the cooling effect, the large river shows a humidifying effect at the same time. In the hot summer season, As the RH becomes higher, it makes it difficult for the skin surface to reduce temperature by evaporation of sweat [], which may lead to thermal discomfort [,,]. As a result, HI is a better index to assess the impact of waterbody on the littoral heat stress as it considers AT and RH simultaneously. This study found a great reduction in daytime HI and a slight increase in nighttime HI by the river. The daytime HI values of survey points were lower than the background HI of the city when within 1200 m from the riverbank. However, in the nighttime, HI values showed a trivial change in the littoral zone and HI was slightly higher than the background HI of the city. This meant that the benefits of AT cooling can offset the negative impact of humidifying during the daytime, but not in the nighttime. In addition, the daytime HI had a strong negative relation (R2 = 0.738) with the distance from the riverbank. This is in line with the study in Shanghai [], which claimed that urban waterbody can effectively improve thermal comfort and areas closer to the waterbody had greater benefits.
4.2. Influence of the Urban Built Environment
The influence of the urban built environment on water cooling effect cannot be ignored [,]. The microclimatic influence of the urban waterbody has been shown as the decrease in temperature and the increase in humidity in littoral areas. Our study confirmed temperature and humidity changes but revealed that the modification of the littoral thermal environment presents spatial anomaly by examining the HI–AT and HI–RH relations (shown in Figure 6) in the near-shore area, where the urban form was uneven. In other words, the built environment of the near-shore area, with much lower building coverage, resulted in higher daytime heat stress than expected. This finding highlighted the impact of the littoral built environment on cooling effect of the river.
In littoral areas with relatively moderate urban morphology, we found that the distance from the riverbank is one of the most influential factors affecting the water cooling effect, which was verified in the current literature [,]. Additionally, vegetation coverage was demonstrated to exert a second important impact (except for the distance) on AT, RH and HI, especially in the daytime. Our finding extended the understanding of cooling provision by urban greening, from playing a role in urban areas [,] and increasing water-cooling on the riverbank [], to enhancing water cooling effect hundreds of meters away from the riverbank and contributing to mitigating heat stress at the pedestrian level during the daytime. In the nighttime, our findings implied that building morphology played a more important role than greening. It was consistent with the conclusion from Lan and Zhan [] that most of the building–AT relations in Wuhan were significant during nighttime rather than the daytime. In detail, FAR entered two nighttime models in stepwise regressions and we found that a smaller FAR contributed to cooling and humidifying effects. This is because urban buildings would block the cold damp air from the river and a lower building volume can benefit to the propagation of cooling []. Additionally, FAR appeared to be an important variable in the nighttime models instead of the daytime models, possibly confirming the important thermal influence of the heat storage released at night from building materials [,,,]. According to the regression results, SVF did not have a significant impact on microclimate variables in this study, although it correlated significantly with FAR (r = −0.747). This may be because we only calculate SVF based on 3D building data and not involve the impact of street trees. Since FAR comprehensively measures the three-dimensional space occupation of buildings (Table 4), the impact of FAR on littoral microclimatic variables in our result was also the combined influence of building density and height.
4.3. Implications for Urban Planning and Design
China is making efforts to beat urban heat [], aiming to build a climate-resilient society by 2035 and striving to preserve the green and blue spaces in urban areas []. There are many cities along the rivers, canals, lakes and coastal regions [], which have the natural advantage of utilizing the cooling effects of the waterbody to mitigate urban heat stress during the summer days. It is warranted to understand the mutual impacts between the urban waterbody and the littoral built environment []. The findings of this study revealed the great potential of the large river for providing cooling benefits in summer daytime and contributing to mitigating pedestrian heat stress in littoral areas. For large rivers such as the Yangtze River, a microclimate-sensitive zone with a width of no less than 1 km or half of the river width, shall be set along the riverside. Climate-sensitive urban planning and design, including land-use planning, urban geometry design and urban greening, is warranted in this area. For example, green space is strongly recommended and street trees are also effective to enhance the water cooling effect. This offers urban residents the opportunity to benefit from cooling effect of blue and green spaces synthetically. Meanwhile, it should be noted that, despite the temperature reduction, rivers slightly increase pedestrian heat stress at night. Hence, the land-use type mainly used during the daytime, such as schools, hospitals and office buildings, are more favorable in this area than the land-use type mainly occupied at night, such as residential buildings. In this area, the building form should be strictly controlled and the FAR is the primary index. Less densely distributed and moderately shorter buildings are conducive to the cooling extension of the large river. Those strategies for urban planners and designers would help to make good use of the cooling effect of the large river for UHI mitigation and support the building of climate-adaptive communities and climate-resilient cities.
4.4. Limitations and Future Research Directions
There are some limitations in this study to inspire future research. First, only one-day data was collected through mobile measurement and each round took 90 min in the morning and evening, respectively. Future studies are expected to involve a longer survey period and more data points to explore the thermal environment in the littoral zone of the urban river. Second, given the typically low background wind speed and relatively homogeneous built environment, this study mainly measured air temperature and relative humidity. Other microclimate variables (i.e., mean radiant temperature, specific humidity and wind conditions) are essential for measuring thermal comfort and their interactions with urban morphological factors []. Considering the complexity and dynamics of the urban environment, a comprehensive assessment of the littoral built environment, including more influential factors such as building materials, vegetation species, human behaviors, etc. [], will deepen our understanding of the interaction between the water cooling effect and the littoral built environment. Third, as the cooling potential of a waterbody may vary across different seasons [], it is warranted to investigate whether the findings in this study are consistent in other seasons. Additionally, as this study measured two routes in the same orientation, another possible direction is to include different street orientations in the future to investigate its impact on the extension of the water cooling effect [].
5. Conclusions
We presented the spatial distribution of air temperature and relative humidity by mobile measurement and applied the heat index to assess pedestrian heat stress on a hot summer day near the Yangtze River. Thereafter, the relationships between the microclimatic variables and the urban built environment factors within the influence distances were analyzed. The main conclusions can be summarized as follows:
- The large river showed great cooling and humidifying effect during the daytime. The temperature reduction was up to 3.55 °C with an influence distance of 1741 m away from the riverbank. The humidity increased up to 17.25% with an influence distance of 1369 m. In the nighttime, the cooling and humidifying effect still existed but was much weaker than daytime.
- Considering both the influence of temperature and humidity, the river can significantly mitigate the pedestrian heat stress by reducing the heat index within 1200 m from the riverbank during the daytime but showed a weak negative effect in the nighttime.
- A high level of vegetation cover in littoral areas can enhance water-cooling and humidifying and contribute to mitigating pedestrian heat stress during the daytime. Building morphology had a significant influence in the nighttime. Lower FAR could be beneficial for nighttime cooling and humidifying.
The analysis results of this study can provide suggestions for urban planning and design of littoral zones to better utilize the water cooling effect of urban waterbodies. Those strategies can be incorporated as part of mitigation and adaptation strategies.
Author Contributions
Conceptualization, Y.W. and W.O.; methodology, Y.W., W.O. and L.Z.; formal analysis, Y.W. and W.O.; writing—original draft preparation, Y.W.; writing—review and editing, Y.W., W.O., Q.Z. and L.Z.; funding acquisition, Y.W. and Q.Z. All authors have read and agreed to the published version of the manuscript.
Funding
This research was funded by Zhejiang Provincial Natural Science Foundation of China under Grant No. LY20E080007; National Natural Science Foundation of China, Grant No. 52078389 and No. 51878515.
Institutional Review Board Statement
Not applicable.
Informed Consent Statement
Not applicable.
Data Availability Statement
Not applicable.
Conflicts of Interest
The authors declare no conflict of interest.
Appendix A
Table A1.
Weather condition on the measurement day (21 July 2018).
Table A1.
Weather condition on the measurement day (21 July 2018).
| Time (h) | AT (°C) | RH (%) | WS (m/s) | WD (°) |
|---|---|---|---|---|
| 00:00 | 28.00 | 87 | 0.0 | 120 |
| 01:00 | 27.50 | 89 | 0.1 | 283 |
| 02:00 | 27.00 | 91 | 0.0 | 292 |
| 03:00 | 26.80 | 91 | 0.0 | 263 |
| 04:00 | 26.60 | 94 | 0.0 | 262 |
| 05:00 | 26.60 | 96 | 0.0 | 35 |
| 06:00 | 26.50 | 97 | 0.0 | / * |
| 07:00 | 29.40 | 89 | 0.6 | 59 |
| 08:00 | 33.00 | 65 | 1.9 | 127 |
| 09:00 | 34.50 | 57 | 2.3 | 135 |
| 10:00 | 35.60 | 53 | 2.1 | 102 |
| 11:00 | 36.20 | 51 | 1.8 | 99 |
| 12:00 | 36.60 | 49 | 2.1 | 215 |
| 13:00 | 37.10 | 47 | 0.5 | 288 |
| 14:00 | 37.60 | 44 | 2.5 | 333 |
| 15:00 | 38.10 | 44 | 2.8 | 9 |
| 16:00 | 38.40 | 41 | 2.5 | 6 |
| 17:00 | 38.00 | 43 | 2.4 | 3 |
| 18:00 | 37.30 | 45 | 1.6 | 346 |
| 19:00 | 35.10 | 54 | 1.3 | 356 |
| 20:00 | 33.20 | 64 | 1.3 | 10 |
| 21:00 | 33.50 | 64 | 3.3 | 32 |
| 22:00 | 32.90 | 62 | 4.1 | 42 |
| 23:00 | 31.70 | 66 | 2.6 | 28 |
* No data. Data source: http://www.wunderground.com/ accessed on 21 July 2021.
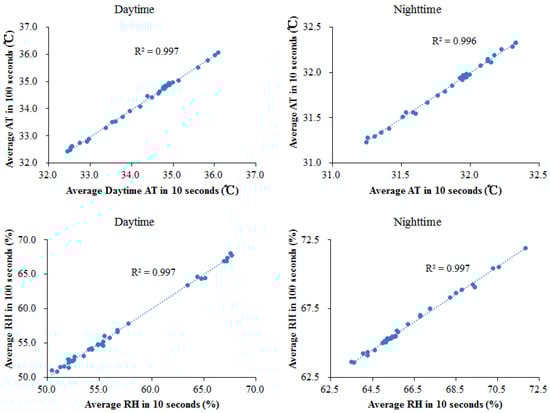
Figure A1.
Correlations between these two periods were almost equal, with the R2 above 0.99 and the slope nearly equal to 1.
References
- IPCC. Climate Change 2022: Impacts, Adaptation, and Vulnerability. Contribution of Working Group II to the Sixth Assessment Report of the Intergovernmental Panel on Climate Change; Cambridge University Press: Cambridge, UK, 2022. [Google Scholar]
- United Nations. The World’s Cities in 2018—Data Booklet (ST/ESA/ SER.A/417. 2018. Available online: https://www.un.org/development/desa/pd/content/worlds-cities-2018-data-booklet (accessed on 8 August 2022).
- Seto, K.C.; Golden, J.S.; Alberti, M.; Turner, B.L. Sustainability in an urbanizing planet. Proc. Natl. Acad. Sci. USA 2017, 114, 8935–8938. [Google Scholar] [CrossRef]
- Masson, V.; Lemonsu, A.; Hidalgo, J.; Voogt, J. Urban Climates and Climate Change. Annu. Rev. Environ. Resour. 2020, 45, 411–444. [Google Scholar] [CrossRef]
- Sharifi, A. Co-benefits and synergies between urban climate change mitigation and adaptation measures: A literature review. Sci. Total Environ. 2021, 750, 141642. [Google Scholar] [CrossRef] [PubMed]
- Wang, Y.; Wang, A.; Zhai, J.; Tao, H.; Jiang, T.; Su, B.; Yang, J.; Wang, G.; Liu, Q.; Gao, C.; et al. Tens of thousands additional deaths annually in cities of China between 1.5 °C and 2.0 °C warming. Nat. Commun. 2019, 10, 3376. Nat. Commun. 2019, 10, 3376. [Google Scholar] [CrossRef]
- Gunawardena, K.R.; Wells, M.J.; Kershaw, T. Utilising green and bluespace to mitigate urban heat island intensity. Sci. Total Environ. 2017, 584–585, 1040–1055. [Google Scholar] [CrossRef]
- Volker, S.; Baumeister, H.; Classen, T.; Hornberg, C.; Kistemann, T. Evidence for the temperature-mitigating capacity of urban blue space—A health geographic perspective. Erdkunde 2013, 67, 355–371. [Google Scholar] [CrossRef]
- Hathway, E.A.; Sharples, S. The interaction of rivers and urban form in mitigating the Urban Heat Island effect: A UK case study. Build. Environ. 2012, 58, 14–22. [Google Scholar] [CrossRef]
- Tsai, C.W.; Young, T.; Warren, P.H.; Maltby, L. Riparian thermal conditions across a mixed rural and urban landscape. Appl. Geogr. 2017, 87, 106–114. [Google Scholar] [CrossRef]
- Moyer, A.N.; Hawkins, T.W. River effects on the heat island of a small urban area. Urban Clim. 2017, 21, 262–277. [Google Scholar] [CrossRef]
- Heusinkveld, B.G.; Steeneveld, G.J.; van Hove, L.W.A.; Jacobs, C.M.J.; Holtslag, A.A.M. Spatial variability of the Rotterdam urban heat island as influenced by urban land use. J. Geophys. Res. Atmos. 2014, 119, 677–692. [Google Scholar] [CrossRef]
- Murakawa, S.; Sekine, T.; Narita, K.I.; Nishina, D. Study of the effects of a river on the thermal environment in an urban area. Energy Build. 1991, 16, 993–1001. [Google Scholar] [CrossRef]
- Wong, N.H.; Tan, C.L.; Nindyani, A.D.S.; Jusuf, S.K.; Tan, E. Influence of Water Bodies on Outdoor Air Temperature in Hot and Humid Climate. In Proceedings of the International Conference on Sustainable Design & Construction (CSDC) 2011, Kansas City, MO, USA, 23–25 March 2011; pp. 81–89. [Google Scholar] [CrossRef]
- Wu, D.; Wang, Y.; Fan, C.; Xia, B. Thermal environment effects and interactions of reservoirs and forests as urban blue-green infrastructures. Ecol. Indic. 2018, 91, 657–663. [Google Scholar] [CrossRef]
- Gupta, N.; Mathew, A.; Khandelwal, S. Analysis of cooling effect of water bodies on land surface temperature in nearby region: A case study of Ahmedabad and Chandigarh cities in India. Egypt. J. Remote Sens. Space Sci. 2019, 22, 81–93. [Google Scholar] [CrossRef]
- Yu, K.; Chen, Y.H.; Liang, L.; Gong, A.; Li, J. Quantitative analysis of the interannual variation in the seasonal water cooling island (WCI) effect for urban areas. Sci. Total Environ. 2020, 727, 138750. [Google Scholar] [CrossRef] [PubMed]
- Wu, J.; Li, C.; Zhang, X.; Zhao, Y.; Liang, J.; Wang, Z. Seasonal variations and main influencing factors of the water cooling islands effect in Shenzhen. Ecol. Indic. 2020, 117, 106699. [Google Scholar] [CrossRef]
- Tominaga, Y.; Sato, Y.; Sadohara, S. CFD simulations of the effect of evaporative cooling from water bodies in a micro-scale urban environment: Validation and application studies. Sustain. Cities Soc. 2015, 19, 259–270. [Google Scholar] [CrossRef]
- Xu, J.; Wei, Q.; Huang, X.; Zhu, X.; Li, G. Evaluation of human thermal comfort near urban waterbody during summer. Build. Environ. 2010, 45, 1072–1080. [Google Scholar] [CrossRef]
- Steeneveld, G.J.; Koopmans, S.; Heusinkveld, B.G.; Theeuwes, N.E. Refreshing the role of open water surfaces on mitigating the maximum urban heat island effect. Landsc. Urban Plan. 2014, 121, 92–96. [Google Scholar] [CrossRef]
- Bowler, D.E.; Buyung-Ali, L.; Knight, T.M.; Pullin, A.S. Urban greening to cool towns and cities: A systematic review of the empirical evidence. Landsc. Urban Plan. 2010, 97, 147–155. [Google Scholar] [CrossRef]
- Park, C.Y.; Lee, D.K.; Asawa, T.; Murakami, A.; Kim, H.G.; Lee, M.K.; Lee, H.S. Influence of urban form on the cooling effect of a small urban river. Landsc. Urban Plan. 2019, 183, 26–35. [Google Scholar] [CrossRef]
- Tsin, P.K.; Knudby, A.; Krayenhoff, E.S.; Ho, H.C.; Brauer, M.; Henderson, S.B. Microscale mobile monitoring of urban air temperature. Urban Clim. 2016, 18, 58–72. [Google Scholar] [CrossRef]
- Qaid, A.; Bin Lamit, H.; Ossen, D.R.; Raja Shahminan, R.N. Urban heat island and thermal comfort conditions at micro-climate scale in a tropical planned city. Energy Build. 2016, 133, 577–595. [Google Scholar] [CrossRef]
- Yan, H.; Wu, F.; Dong, L. Influence of a large urban park on the local urban thermal environment. Sci. Total Environ. 2018, 622–623, 882–891. [Google Scholar] [CrossRef]
- Ouyang, W.; Morakinyo, T.E.; Ren, C.; Liu, S.; Ng, E. Thermal-irradiant performance of green infrastructure typologies: Field measurement study in a subtropical climate city. Sci. Total Environ. 2021, 764, 144635. [Google Scholar] [CrossRef]
- Shi, Y.; Lau, K.L.; Ren, C.; NG, E. Evaluating the local climate zone classification in high-density heterogeneous urban environment using mobile measurement. Urban Clim. 2018, 25, 167–186. [Google Scholar] [CrossRef]
- Leconte, F.; Bouyer, J.; Claverie, R.; Pétrissans, M. Using Local Climate Zone scheme for UHI assessment: Evaluation of the method using mobile measurements. Build. Environ. 2015, 83, 39–49. [Google Scholar] [CrossRef]
- Liu, Z.; Cheng, K.; He, Y.; Jim, C.Y.; Brown, R.; Shi, Y.; Lau, K.; Ng, E. Microclimatic measurements in tropical cities: Systematic review and proposed guidelines. Build. Environ. 2022, 222, 109411. [Google Scholar] [CrossRef]
- Cheung, P.; Jim, C. Comparing the cooling effects of a tree and a concrete shelter using PET and UTCI. Build. Environ. 2017, 130, 49–61. [Google Scholar] [CrossRef]
- Demuzere, M.; Orru, K.; Heidrich, O.; Olazabal, E.; Geneletti, D.; Orru, H.; Bhave, A.; Mittal, N.; Feliu, E.; Faehnle, M. Mitigating and adapting to climate change: Multi-functional and multi-scale assessment of green urban infrastructure. J. Environ. Manag. 2014, 146, 107–115. [Google Scholar] [CrossRef]
- Ng, E.; Chen, L.; Wang, Y.N.; Yuan, C. A study on the cooling effects of greening in a high-density city: An experience from Hong Kong. Build. Environ. 2012, 47, 256–271. [Google Scholar] [CrossRef]
- Ouyang, W.; Morakinyo, T.E.; Ren, C.; Ng, E. The cooling efficiency of variable greenery coverage ratios in different urban densities: A study in a subtropical climate. Build. Environ. 2020, 174, 106772. [Google Scholar] [CrossRef]
- Cheung, P.K.; Jim, C.Y. Effects of urban and landscape elements on air temperature in a high-density subtropical city. Build. Environ. 2019, 164, 106362. [Google Scholar] [CrossRef]
- Jamei, E.; Rajagopalan, P.; Seyedmahmoudian, M.; Jamei, Y. Review on the impact of urban geometry and pedestrian level greening on outdoor thermal comfort. Renew. Sust. Energ. Rev. 2016, 54, 1002–1017. [Google Scholar] [CrossRef]
- Yin, C.; Yuan, M.; Lu, Y.; Huang, Y.; Liu, Y. Effects of urban form on the urban heat island effect based on spatial regression model. Sci. Total Environ. 2018, 634, 696–704. [Google Scholar] [CrossRef]
- Yang, F.; Lau, S.S.Y.; Qian, F. Urban design to lower summertime outdoor temperatures: An empirical study on high-rise housing in Shanghai. Build. Environ. 2011, 46, 769–785. [Google Scholar] [CrossRef]
- Oke, T.R.; Mills, G.; Christen, A.; Voogt, J.A. Urban Climates; Cambridge University Press: Cambridge, UK, 2017. [Google Scholar] [CrossRef]
- Yan, H.; Fan, S.; Guo, C.; Wu, F.; Zhang, N.; Dong, L. Assessing the effects of landscape design parameters on intra-urban air temperature variability: The case of Beijing, China. Build. Environ. 2014, 76, 44–53. [Google Scholar] [CrossRef]
- Lan, Y.; Zhan, Q. How do urban buildings impact summer air temperature? The effects of building configurations in space and time. Build. Environ. 2017, 125, 88–98. [Google Scholar] [CrossRef]
- Perini, K.; Magliocco, A. Effects of vegetation, urban density, building height, and atmospheric conditions on local temperatures and thermal comfort. Urban For. Urban Green. 2014, 13, 495–506. [Google Scholar] [CrossRef]
- Liu, L.; Lin, Y.; Liu, J.; Wang, L.; Wang, D.; Shui, T.; Chen, X.; Wu, Q. Analysis of local-scale urban heat island characteristics using an integrated method of mobile measurement and GIS-based spatial interpolation. Build. Environ. 2017, 117, 191–207. [Google Scholar] [CrossRef]
- Zhao, C.; Fu, G.; Liu, X.; Fu, F. Urban planning indicators, morphology and climate indicators: A case study for a north-south transect of Beijing, China. Build. Environ. 2011, 46, 1174–1183. [Google Scholar] [CrossRef]
- Hu, L.Q.; Li, Q. Greenspace, bluespace, and their interactive influence on urban thermal environments. Environ. Res. Lett. 2020, 15, 034041. [Google Scholar] [CrossRef]
- Manteghi, G. Influence of Street Orientation and Distance To Water Body on Microclimate Temperature Distribution In Tropical Coastal City of Malacca. Int. J. Appl. Environ. Sci. 2015, 10, 749–766. [Google Scholar]
- Katayama, T.; Hayashi, T.; Shiotsuki, Y.; Kitayama, H.; Ishii, A.; Nishida, M.; Tsutsumi, J.I.; Oguro, M. Cooling effects of a river and sea breeze on the thermal environment in a built-up area. Energy Build. 1991, 16, 973–978. [Google Scholar] [CrossRef]
- Schwarz, N.; Schlink, U.; Franck, U.; Großmann, K. Relationship of land surface and air temperatures and its implications for quantifying urban heat island indicators—An application for the city of Leipzig (Germany). Ecol. Indic. 2012, 18, 693–704. [Google Scholar] [CrossRef]
- Charabi, Y.; Bakhit, A. Assessment of the canopy urban heat island of a coastal arid tropical city: The case of Muscat, Oman. Atmos. Res. 2011, 101, 215–227. [Google Scholar] [CrossRef]
- Steadman, R.G. The Assessment of Sultriness. Part I: A Temperature-Humidity Index Based on Human Physiology and Clothing Science. J. Appl. Meteorol. 1979, 18, 861. [Google Scholar] [CrossRef]
- Anderson, G.B.; Bell, M.L.; Peng, R.D. Methods to Calculate the Heat Index as an Exposure Metric in Environmental Health Research. Environ. Health Perspect. 2013, 121, 1111–1119. [Google Scholar] [CrossRef]
- Davis, R.E.; Knappenberger, P.C.; Michaels, P.J.; Novicoff, W.M. Changing heat-related mortality in the United States. Environ. Health Perspect. 2003, 111, 1712–1718. [Google Scholar] [CrossRef]
- Wu, D. Environmental Meteorology and Special Meteorological Forecasts. Meteorol. Mon. 2000, 26, 3–5. [Google Scholar]
- Ahrens, C.D. Essentials of Meteorology: An Invitation to the Atmosphere; Cengage Learning: Boston, MA, USA, 2010. [Google Scholar]
- Hass, A.L.; Ellis, K.N.; Reyes Mason, L.; Hathaway, J.M.; Howe, D.A. Heat and Humidity in the City: Neighborhood Heat Index Variability in a Mid-Sized City in the Southeastern United States. Int. J. Environ. Res. Public Health 2016, 13, 117. [Google Scholar] [CrossRef]
- NOAA. Available online: https://www.wpc.ncep.noaa.gov/html/heatindex_equation.shtml (accessed on 24 May 2022).
- Jiang, Z.; Huete, A.R.; Jin, C.; Chen, Y.; Jing, L.; Yan, G.; Zhang, X. Analysis of NDVI and scaled difference vegetation index retrievals of vegetation fraction. Remote Sens. Environ. 2006, 101, 366–378. [Google Scholar] [CrossRef]
- Gutman, G.; Ignatov, A. The derivation of the green vegetation fraction from NOAA/AVHRR data for use in numerical weather prediction models. Int. J. Remote Sens. 1998, 19, 1533–1543. [Google Scholar] [CrossRef]
- Xu, Y.; Ren, C.; Ma, P.; Ho, J.; Wang, W.; Lau, K.K.-L.; Lin, H.; Ng, E. Urban morphology detection and computation for urban climate research. Landsc. Urban Plan. 2017, 167, 212–224. [Google Scholar] [CrossRef]
- Edussuriya, P.; Chan, A.; Ye, A. Urban morphology and air quality in dense residential environments in Hong Kong. Part I: District-level analysis. Atmos. Environ. 2011, 45, 4789–4803. [Google Scholar] [CrossRef]
- Yang, F.; Qian, F.; Lau, S.S.Y. Urban form and density as indicators for summertime outdoor ventilation potential: A case study on high-rise housing in Shanghai. Build. Environ. 2013, 70, 122–137. [Google Scholar] [CrossRef]
- Yang, F.; Lau, S.S.Y.; Qian, F. Summertime heat island intensities in three high-rise housing quarters in inner-city Shanghai China: Building layout, density and greenery. Build. Environ. 2010, 45, 115–134. [Google Scholar] [CrossRef]
- Merbitz, H.; Fritz, S.; Schneider, C. Mobile measurements and regression modeling of the spatial particulate matter variability in an urban area. Sci. Total Environ. 2012, 438, 389–403. [Google Scholar] [CrossRef] [PubMed]
- Bernard, J.; Bocher, E.; Petit, G.; Palominos, S. Sky View Factor Calculation in Urban Context: Computational Performance and Accuracy Analysis of Two Open and Free GIS Tools. Climate 2018, 6, 60. [Google Scholar] [CrossRef]
- Peng, J.; Dan, Y.; Qiao, R.; Liu, Y.; Dong, J.; Wu, J. How to quantify the cooling effect of urban parks? Linking maximum and accumulation perspectives. Remote Sens. Environ. 2021, 252, 112135. [Google Scholar] [CrossRef]
- Wang, Y.; Ouyang, W. Investigating the heterogeneity of water cooling effect for cooler cities. Sustain. Cities Soc. 2021, 75, 103281. [Google Scholar] [CrossRef]
- Sobolewski, A.; Młynarczyk, M.; Konarska, M.; Bugajska, J. The influence of air humidity on human heat stress in a hot environment. Int. J. Occup. Saf. Ergon. 2021, 27, 226–236. [Google Scholar] [CrossRef] [PubMed]
- Imam Syafii, N.; Ichinose, M.; Kumakura, E.; Jusuf, S.K.; Chigusa, K.; Wong, N.H. Thermal environment assessment around bodies of water in urban canyons: A scale model study. Sustain. Cities Soc. 2017, 34, 79–89. [Google Scholar] [CrossRef]
- Amani-Beni, M.; Zhang, B.; Xie, G.-d.; Xu, J. Impact of urban park’s tree, grass and waterbody on microclimate in hot summer days: A case study of Olympic Park in Beijing, China. Urban For. Urban Green. 2018, 32, 1–6. [Google Scholar] [CrossRef]
- Cheng, L.; Guan, D.; Zhou, L.; Zhao, Z.; Zhou, J. Urban cooling island effect of main river on a landscape scale in Chongqing, China. Sustain. Cities Soc. 2019, 47, 101501. [Google Scholar] [CrossRef]
- Ng, E.; Yuan, C.; Chen, L.; Ren, C.; Fung, J.C.H. Improving the wind environment in high-density cities by understanding urban morphology and surface roughness: A study in Hong Kong. Landsc. Urban Plan. 2011, 101, 59–74. [Google Scholar] [CrossRef]
- Chow, W.T.L.; Roth, M. Temporal dynamics of the urban heat island of Singapore. Int. J. Climatol. 2006, 26, 2243–2260. [Google Scholar] [CrossRef]
- Masson, V. A physically-based scheme for the urban energy budget in atmospheric models. Bound. Layer Meteorol. 2000, 94, 357–397. [Google Scholar] [CrossRef]
- He, B.-J.; Wang, J.; Zhu, J.; Qi, J. Beating the urban heat: Situation, background, impacts and the way forward in China. Renew. Sustain. Energy Rev. 2022, 161, 112350. [Google Scholar] [CrossRef]
- Chinese Ministry of Ecology and Environment; National Development and Reform Commission; Ministry of Science and Technology; Ministry of Finance; Ministry of Natural Resources; Ministry of Housing and Urban-Rural Development; Ministry of Transport; Ministry of Water Resources; Ministry of Agriculture and Rural Affairs; Ministry of Culture and Tourism; et al. National Climate Change Adaptation Strategy 2035; Ministry of Ecology and Environment of the People’s Republic of China: Beijing, China, 2022.
- Liu, H.; Huang, B.; Zhan, Q.; Gao, S.; Li, R.; Fan, Z. The influence of urban form on surface urban heat island and its planning implications: Evidence from 1288 urban clusters in China. Sustain. Cities Soc. 2021, 71, 102987. [Google Scholar] [CrossRef]
- Bassolino, E.; D’Ambrosio, V.; Sgobbo, A. Data Exchange Processes for the Definition of Climate-Proof Design Strategies for the Adaptation to Heatwaves in the Urban Open Spaces of Dense Italian Cities. Sustainability 2021, 13, 5694. [Google Scholar] [CrossRef]
Publisher’s Note: MDPI stays neutral with regard to jurisdictional claims in published maps and institutional affiliations. |
© 2022 by the authors. Licensee MDPI, Basel, Switzerland. This article is an open access article distributed under the terms and conditions of the Creative Commons Attribution (CC BY) license (https://creativecommons.org/licenses/by/4.0/).