
The Application of a Fish-Based Multi-Metric Index for the Assessment of Ecological Qualities of Estuaries in the Korean Peninsula

 , ,
, , 
Abstract
:1. Introduction
2. Materials and Methods
2.1. Field Sampling
2.2. Calculation of Multimetric Index
2.3. Data Analysis
3. Results
3.1. Estuarine Fish Assemblages in Korean Peninsula
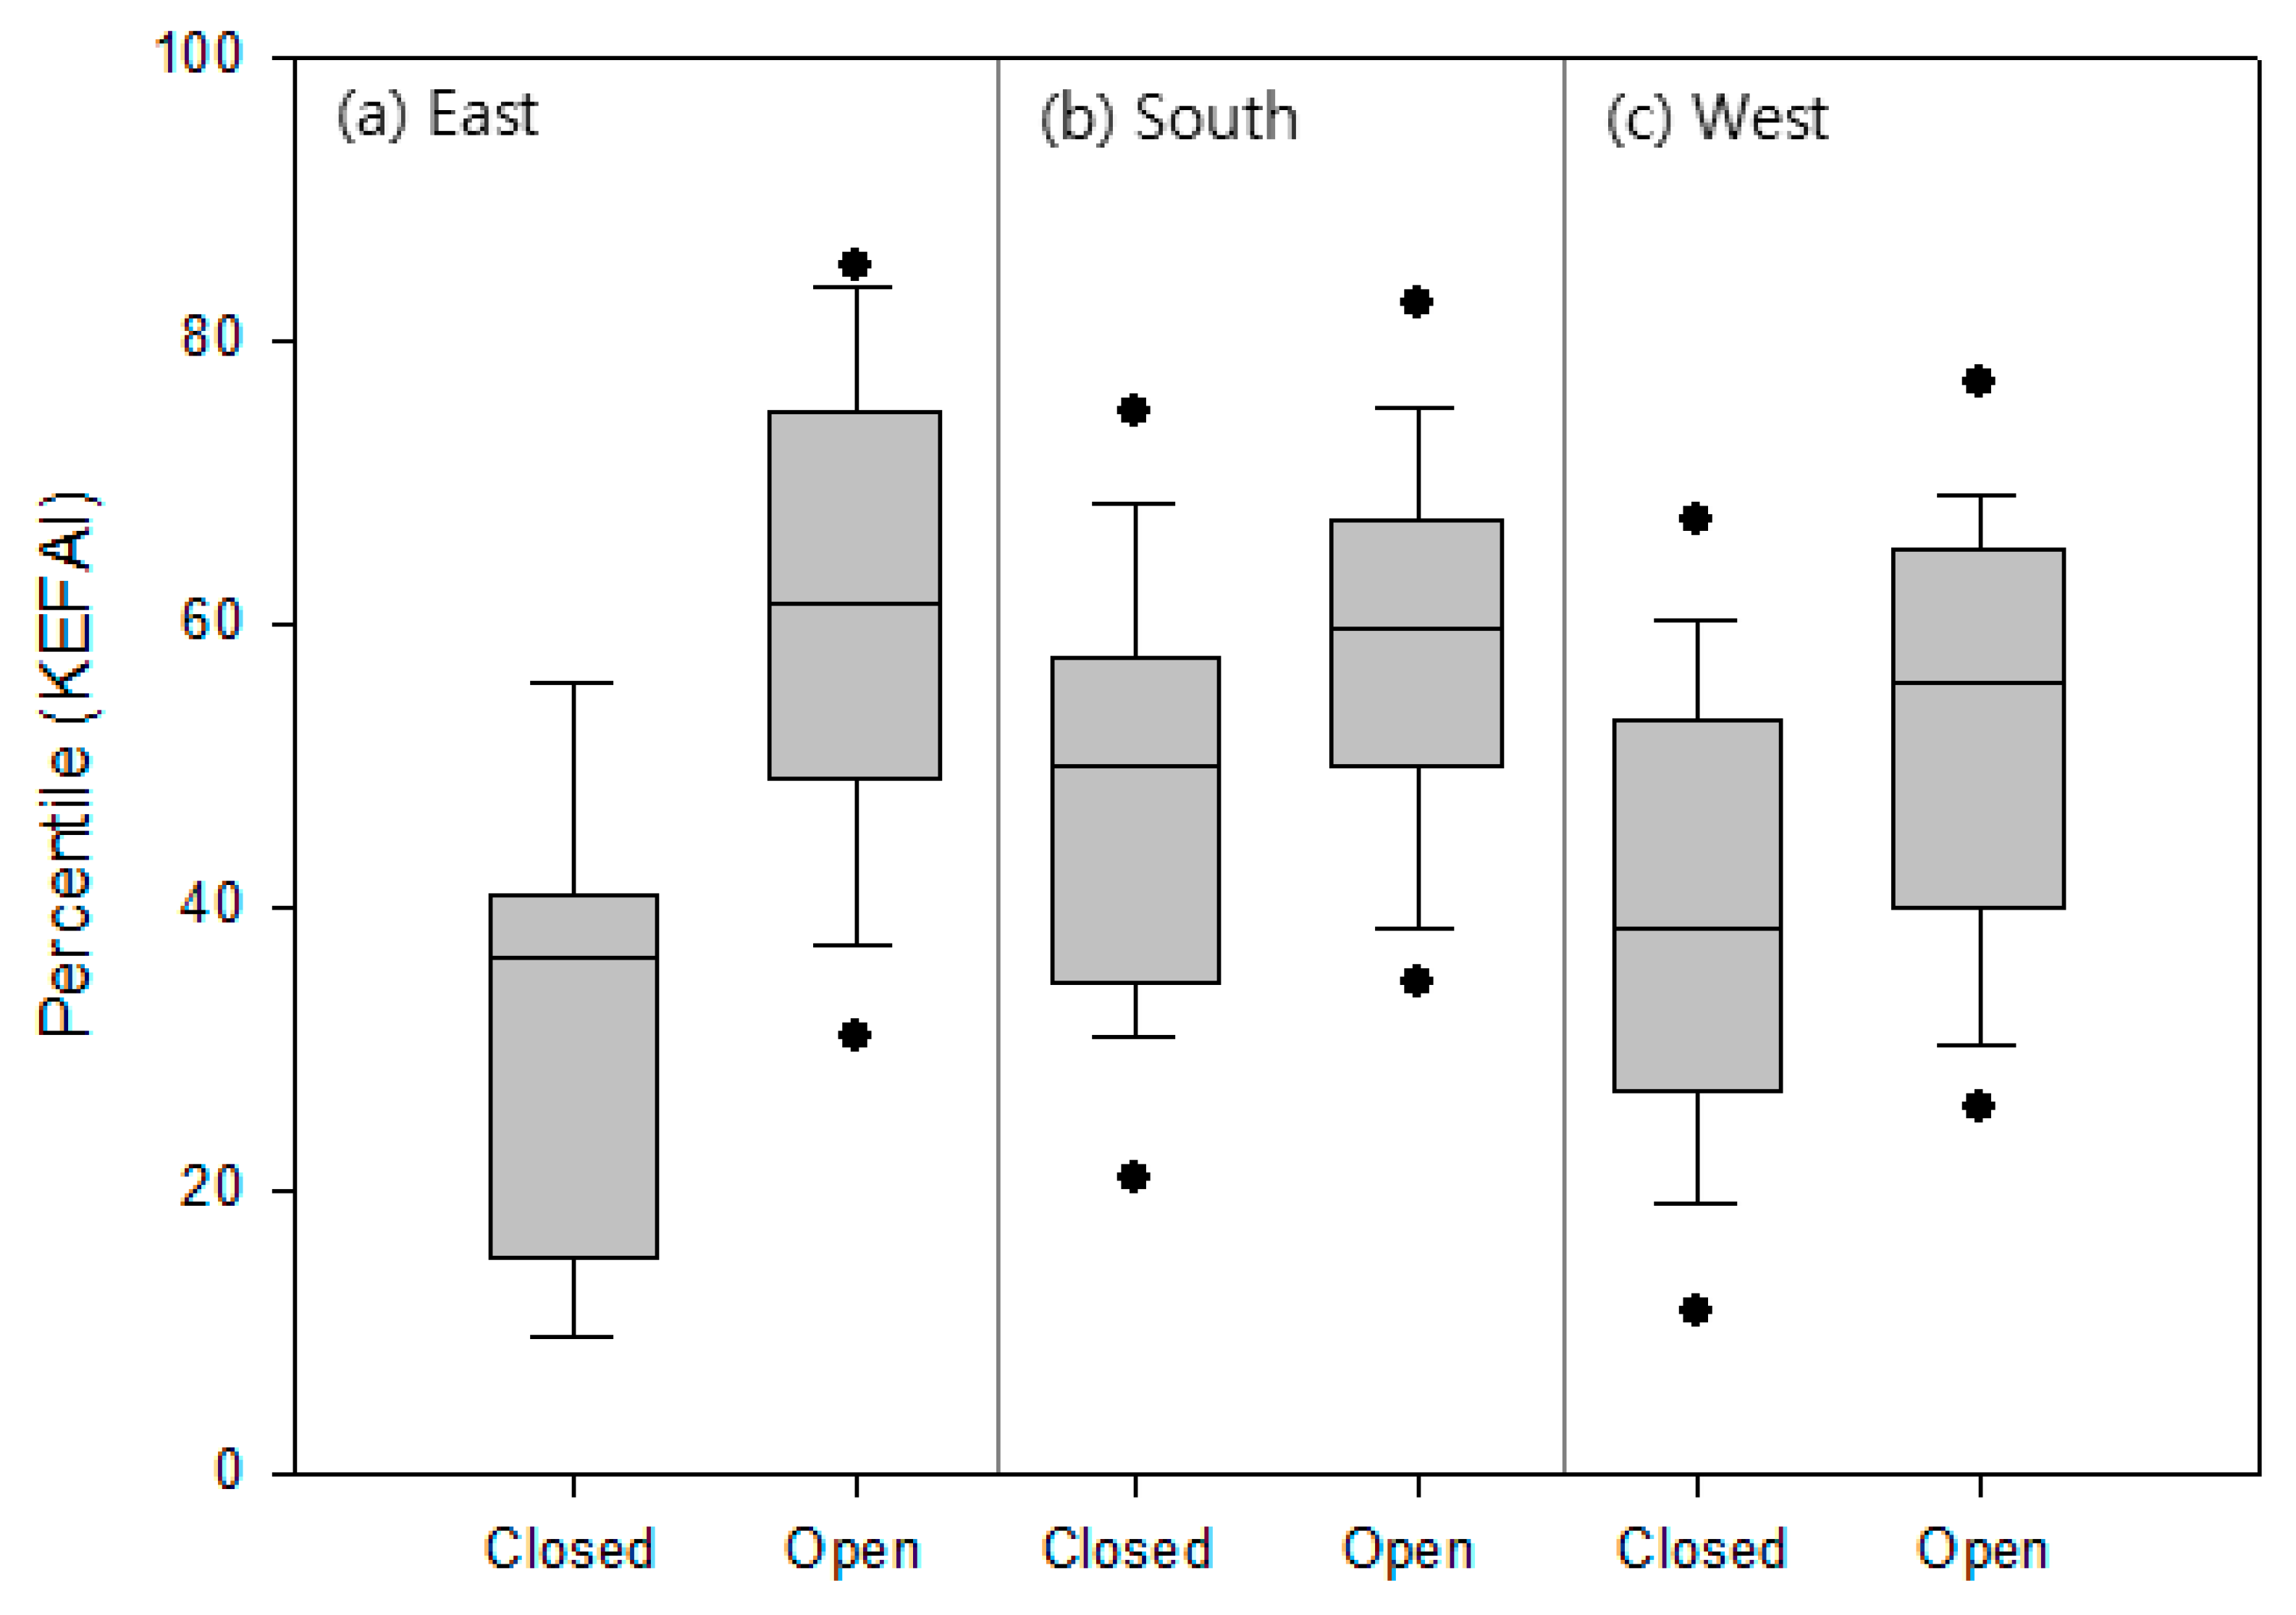
3.2. KEFAI (Korea Estuary Fish Assessment Index)
4. Discussion
4.1. Fish Assemblages of Estuaries in Korean Peninsula
4.2. Impact of Estuary Barrages on Fish Assemblages
4.3. KEFAI (Korea Estuary Fish Assessment Index)
5. Conclusions
Author Contributions
Funding
Institutional Review Board Statement
Informed Consent Statement
Data Availability Statement
Acknowledgments
Conflicts of Interest
References
- Day, J.W.; Hall, C.A.S.; Kemp, W.M.; Yanez-Arancibia, A. Estuarine Ecology; John Wiley & Sons: Hoboken, NJ, USA, 1989; p. 576. [Google Scholar]
- Bennett, B.A. The fish community of a moderately exposed beach on the southwestern Cape Coast of South Africa and an assessment of this habitat as a nursery for juvenile fish. Estuar. Coast. Shelf Sci. 1989, 28, 293–305. [Google Scholar] [CrossRef]
- Elliott, M.; McLusky, D.S. The Need for Definitions in Understanding Estuaries. Estuar. Coast. Shelf Sci. 2002, 55, 815–827. [Google Scholar] [CrossRef]
- Akin, S.; Buhan, E.; Winemiller, K.O.; Yilmaz, H. Fish assemblage structure of Koycegiz LagooneEstuary, Turkey: Spatial and temporal distribution patterns in relation to environmental variation. Estuar. Coast. Shelf Sci. 2005, 64, 671–684. [Google Scholar] [CrossRef]
- Montagna, P.; Vaughan, B.; Ward, G. The Importance of Freshwater Inflows to Texas Estuaries. In Water Policy in Texas: Responding to the Rise of Scarcity; Griffin, R.C., Ed.; The Rff Press: Washington, DC, USA, 2011; pp. 107–127. [Google Scholar]
- Abrahim, G.; Parker, R. Heavy-metal contaminants in Tamaki Estuary: Impact of city development and growth, Auckland, New Zealand. Environ. Geol. 2002, 42, 883–890. [Google Scholar]
- Rafael, M.; Enrique, M.O.; Jose, G.B.; Joan, A. Tailoring dam structures to water quality predictions in new reservoir projects: Assisting decision-making using numerical modeling. J. Environ. Manag. 2010, 91, 1255–1267. [Google Scholar]
- Zarfl, C.; Lumsdon, A.E.; Berlekamp, J.; Tydecks, L.; Tockner, K. A global boom in hydropower dam construction. Aquat. Sci. 2015, 77, 161–170. [Google Scholar] [CrossRef]
- Connell, D.W.; Bycroft, B.M.; Miller, G.J.; Lather, P. Effects of a barrage on flushing and water quality in the Fitzroy River estuary, Queensland. Aust. J. Mar. Freshw Res. 1981, 32, 57–63. [Google Scholar] [CrossRef]
- Leentvaar, J.; Nijboer, S.M. Ecological impacts of the construction of dams in an estuary. Water Sci. Technol. 1986, 18, 181–191. [Google Scholar] [CrossRef]
- Methven, D.A.; Haedrich, R.L.; Rose, G.A. The fish assemblage of a Newfoundland estuary: Diel monthly and annual variation. Estuar. Coast. Shelf Sci. 2001, 52, 669–687. [Google Scholar] [CrossRef]
- Patrick, B.C.; Thomas, J.K. Spatial Extent and Dynamics of Dam Impacts on Tropical Island Freshwater Fish Assemblages. BioScience 2013, 63, 176–190. [Google Scholar]
- Yoon, J.D.; Kim, J.H.; Park, S.H.; Kim, E.; Jang, M.H. Impact of estuary barrage construction on fish assemblages in the lower part of river and the role of fishways as a passage. Ocean Sci. J. 2017, 52, 147–164. [Google Scholar] [CrossRef]
- Loneragan, N.R.; Potter, I.C.; Lenanton, R.C.J.; Caputi, N. Spatial and seasonal differences in the fish fauna in the shallows of a large Australian estuary. Mar. Biol. 1986, 92, 575–586. [Google Scholar] [CrossRef]
- Thiel, R.; Sepulveda, A.; Kafemann, R.; Nellen, W. Environmentalfactors as forces structuring the fish communityof the Elbe Estuary. J. Fish Biol. 1995, 46, 47–69. [Google Scholar] [CrossRef]
- Foss, A.; Evensen, T.H.; Imsland, A.K.; Øiestad, V. Effects of reduced salinities on growth, food conversion efficiency and osmoregulatory status in the spotted wolffish. J. Fish Biol. 2001, 59, 416–426. [Google Scholar] [CrossRef]
- Yoon, J.D.; Jang, M.H.; Jo, H.B.; Jeong, K.S.; Kim, G.Y.; Joo, G.J. Changes of fish assemblages after construction of an estuary barrage in the lower Nakdong River, South Korea. Limnology 2016, 17, 183–197. [Google Scholar] [CrossRef]
- Rho, P.; Lee, C.H. Using GIS to estimate estuarine wetlands in three major estuaries and to quantify wetland changes over the last century. J. Wetl. Res. 2007, 9, 21–31. [Google Scholar]
- Rho, P.; Lee, C.H. Spatial distribution and temporal variation of estuarine wetlands by estuary type. J. Korean Geogr. Soc. 2014, 49, 321–338. [Google Scholar]
- Kwak, S.N.; Huh, S.H. Changes in species composition of fishes in the Nakdong River Estuary. Korean J. Fish. Aquat. Sci. 2003, 36, 129–135. [Google Scholar]
- Park, J.S.; Gwak, W.S. Effects of estuarine dam on fish assemblage in Danghang Bay of the South Sea. Korean J. Ichthyol. 2019, 31, 83–89. [Google Scholar] [CrossRef]
- Park, S.H.; Lee, J.W.; Kim, J.H.; Baek, S.H.; Yoon, J.D.; Choi, K.R.; Jang, M.H. Fish distribution and salinity in the Saemangeum Reservoir. Korean Soc. Environ. Biol. 2013, 31, 411–418. [Google Scholar] [CrossRef]
- Burkhard, B.; Müller, F.; Lill, A. Ecosystem Health Indicators. In Encyclopedia of Ecology; Jørgensen, S.E., Fath, B.D., Eds.; Academic Press: Cambridge, MA, USA, 2008; pp. 1132–1138. [Google Scholar]
- Karr, J.R. Assessment of biotic integrity using fish communities. Fisheries 1981, 6, 21–27. [Google Scholar] [CrossRef]
- Cabral, H.N.; Fonseca, V.F.; Goncalves, C.I.; Costa, J.L.; Erzini, K.; Goncalves, J.; Martins, J.; Leite, L.; Andrade, J.P.; Ramos, S.; et al. Ecological quality assessment of transitional waters based on fish assemblages in Portuguese estuaries: The Estuarine Fish Assessment Index (EFAI). Ecol. Indic. 2012, 19, 144–153. [Google Scholar] [CrossRef]
- Hallett, C.S.; Trayler, K.M.; Valesini, F.J. The Fish Community index: A Practical Management Tool for Monitoring and Reporting Estuarine Ecological Condition. Integr. Environ. Assess. Manag. 2019, 15, 726–738. [Google Scholar] [CrossRef] [PubMed]
- Lee, D.H.; Park, G.W.; Lee, C.H.; Shin, Y.S. Assessment of Ecosystem Health during the Freshwater Discharge in the Youngsan River Estuary. Korean J Ecol. Environ. 2017, 50, 46–56. [Google Scholar] [CrossRef]
- Baek, S.H.; Choi, H.W.; Kim, Y.O. A Prelimiary Study for Marine Ecosystem Health Assessment Using the Planktonic Organism in Jinhae Bay. Korean J. Environ. Biol. 2010, 28, 125–132. [Google Scholar]
- Moyle, P.B.; Cech, J.J. Fishes: An Introduction to Ichthyology; Prentice Hall Inc.: Hoboken, NJ, USA, 2000. [Google Scholar]
- MOE/NIER. Survey and Assessment of Estuary Ecosystem; The Ministry of Environment/National instiute of Environmental Research: Inchen, Korea, 2019; pp. 396–397.
- Kim, I.S.; Park, J.Y. Freshwater Fishes of Korea; Kyohak Publishing: Seoul, Korea, 2002. [Google Scholar]
- Choi, Y.; Kim, J.H.; Park, J.Y. Marine Fishes of Korea; Kyohak Publishing: Seoul, Korea, 2002. [Google Scholar]
- Nelson, J.S. Fishes of the World; Wiley: New York, NY, USA, 2016. [Google Scholar]
- Rice, E.W.; Baird, R.B.; Eaton, A.D. Standard Methods for the Examination of Water and Wastewater, 23rd ed.; American Public Health Association: Washington, DC, USA, 2017. [Google Scholar]
- Field, J.G.; Clarke, K.R.; Warwick, R.M. A practical strategy for analysing multispecies distribution patterns. Mar. Ecol. Prog. Ser. 1982, 8, 37–52. [Google Scholar] [CrossRef]
- Yoon, J.D.; Kim, J.H.; Park, S.H.; Jang, M.H. The distribution and diversity of freshwater fishes in Korean Peninsula. Korean J. Ecol. Environ. 2018, 51, 71–85. [Google Scholar] [CrossRef]
- Jeon, S.R. Studies on freshwater fish fauna in the rivers flowing in the East Sea. Sangmyung Univ. 1982, 10, 465–487. [Google Scholar]
- Lee, W.O.; Ko, M.H.; Bak, J.M.; Kim, D.H.; Jeon, H.J.; Kim, K.H. Characteristics of fish fauna and community structure in Buk Stream of Goseong, Korea. Korean J. Ichthyol. 2010, 22, 238–248. [Google Scholar]
- Claridge, P.N.; Potter, I.C.; Hardisty, M.W. Seasonal changes in movements, abundance, size composition and diversity of the fish fauna of the Severn Estuary. Mar. Biol. Assoc. U. K. 1986, 66, 229–258. [Google Scholar] [CrossRef]
- Harrel, R.C.; Davis, B.J.; Dorris, T.C. Stream order and species diversity of fishes in an intermittent Oklahoma stream. Am. Midl. Nat. 1967, 78, 428–436. [Google Scholar] [CrossRef]
- Pinckney, J.L.; Paerl, H.W.; Tester, P.; Richardson, T.L. The role of nutrient loading and eutrophication in estuarine ecology. Environ. Health Perpect. 2001, 109, 699–706. [Google Scholar]
- Nixon, S.W.; Olsen, B.; Buckley, E.; Rulweiler, R. Lost to Tide: The Importance of Freshwater Flow to Estuaries; Final Report Submitted to URI Coastal Resources Center; University of Rhode Island, Graduate School of Oceanography: Narragansett, RI, USA, 2004; Volume 14. [Google Scholar]
- Lee, S.W.; Hwang, S.J.; Lee, S.B.; Hwang, H.S.; Sung, H.C. Landscape ecological approach to the relationships of land use patterns in watersheds to water quality characteristics. Landsc. Urban Plan. 2009, 92, 80–89. [Google Scholar] [CrossRef]
- Hwang, U.G.; Min, E.Y.; Kang, J.C. Effect of Salinity on Survival and Growth of 3 Gobiidae. Korean J. Environ. Biol. 2012, 30, 9–14. [Google Scholar]
- Duque, G.; Gamboa-García, D.E.; Molina, A.; Cogua, P. Effect of water quality variation on fish assemblages in an anthropogenically impacted tropical estuary, Colombian Pacific. Environ. Sci. Pollut. Res. 2020, 27, 25740–25753. [Google Scholar] [CrossRef] [PubMed]
- Potter, I.C.; Hyndes, G.A. Composition of the fish fauna of a permanently open estuary on the southern coast of Australia, and comparisons with a nearby seasonally closed estuary. Mar. Biol. 1994, 121, 199–209. [Google Scholar] [CrossRef]
- Griffiths, S.P. Factors Influencing Fish Composition in an Australian Intermittently Open Estuary. Is Stability Salinity-Dependent? Estuar. Coast. Shelf Sci. 2001, 52, 739–751. [Google Scholar] [CrossRef]
- Whitfield, A.C.; Adams, J.B.; Bate, G.C.; Bezuidenhout, K.; Bornman, T.G.; Cowley, P.D.; Froneman, P.W.; Gama, P.T.; James, N.C.; Mackenzie, B.; et al. A multidisciplinary study of a small, temporarily open/closed South African estuary, with particular emphasis on the influence of mouth state on the ecology of the system. Afr. J. Mar. Sci. 2008, 30, 453–473. [Google Scholar] [CrossRef]
- Dauwalter, D.C.; Pert, E.J.; Keith, W.E. An index of biotic integrity for fish assemblages in Ozark Highland streams of Arkansas. Southeast. Nat. 2003, 2, 447–468. [Google Scholar] [CrossRef]
- Karr, J.R.; Rausch, K.D.; Angermeier, P.L.; Yant, P.R.; Schlosse, I.J. Assessing Biological Integrity in Running Water: A Method and Its Rationale; Special Publication 5; Illinois National History Survey: Champaign, IL, USA, 1986; p. 28. [Google Scholar]
- Davis, W.S. Biological assessment and criteria: Building on the past. In Biological Assessment and Criteria: Tools for Water Resource Planning and Decision Making; Davis, W.S., Simon, T.P., Eds.; CRC Press: Boca Raton, FL, USA, 1995; pp. 15–29. [Google Scholar]
- Kiranya, B.; Sahadevan, P.; Bhavan, S.G.; Kumar, A.B.; Raghavan, R. Characterization of fish community structure and an estuarine fish community index for temporarily closed estuaries (TCEs) from India’s south-western coast. Environ. Sci. Pollut. Res. 2022, 29, 37969–37988. [Google Scholar] [CrossRef]
- Bennett, B.A. A comparison of the fish communities in nearby permanently open, seasonally open and normally closed estuaries in the South-Western Cape. S. Afr. J. Mar. Sci. 2010, 8, 43–55. [Google Scholar] [CrossRef]
- Nicolas, D.; Lobry, J.; Pape, O.L.; Boet, P. Functional diversity in European estuaries: Relating the composition of fish assemblages to the abiotic environment. Estuar. Coast. Shelf Sci. 2010, 88, 329–338. [Google Scholar] [CrossRef]
- Connor, L.; Ryan, D.; Feeney, R.; Roche, W.K.; Shephard, S.; Kelly, F.L. Biogeography and fish community structure in Irish estuaries. Reg. Stud. Mar. Sci. 2019, 32, 100836. [Google Scholar] [CrossRef]
- Vannote, R.L.; Minshall, G.W.; Cummins, K.W.; Sedell, J.R.; Cushing, C.E. The river continuum concept. Can. J. Fish Aquat. Sci. 1980, 37, 130–137. [Google Scholar] [CrossRef]


| Metric | Score | East (n = 87) | South (n = 151) | West (n = 87) | ||||||||
|---|---|---|---|---|---|---|---|---|---|---|---|---|
| Closed (n = 7) | Open (n = 80) | Closed (n = 49) | Open (n = 102) | Closed (n = 68) | Open (n = 19) | |||||||
| 8 | 6 | 4 | 2 | 1 | 0 | |||||||
| Diversity index (M1) | M1 > 1.7 | 1.7 ≥ M1 > 1.4 | 1.4 ≥ M1 > 1.2 | 1.2 ≥ M1 > 0.9 | - | 0.9 ≥ M1 | 0 | 4 | 2 | 4 | 4 | 4 |
| Total number of species (M2) | M2 > 10 | 10 ≥ M2 > 8 | 8 ≥ M2 > 6 | 6 ≥ M2 > 3 | - | 3 ≥ M2 | 2 | 4 | 2 | 2 | 4 | 4 |
| Number of Migratory species (M3) | - | - | - | M3 ≥ 3 | 3 > M3 ≥ 1 | M3 = 0 | 0 | 1 | 0 | 0 | 0 | 0 |
| Number of estuary species (M4) | M4 > 5 | - | 5 ≥ M4 > 1 | - | - | 1 ≥ M4 | 4 | 4 | 4 | 8 | 4 | 4 |
| Number of marine species (M5) | - | - | - | M5 ≥ 3 | 3 > M5 ≥ 1 | M5 = 0 | 0 | 0 | 0 | 0 | 0 | 0 |
| Proportion of tolerant species (M6) | M6 ≤ 12 | 12 < M6 ≤ 36 | 36 < M6 ≤ 60 | 60 < M6 ≤ 85 | - | 85 < M6 | 2 | 4 | 4 | 4 | 2 | 2 |
| Proportion of benthic species (M7) | M7 > 63 | 63 ≥ M7 > 35 | 35 ≥ M7 > 13 | 13 ≥ M7 > 3 | - | 3 ≥ M7 | 2 | 4 | 4 | 6 | 4 | 6 |
| Proportion of abnormal individuals (M8) | M8 = 0 | - | 0 < M8 ≤ 0.01 | - | - | 0.01 < M8 | 0 | 0 | 0 | 0 | 0 | 0 |
| KEFAI (Mean ± SD) | - | - | - | - | - | - | 32.4 ± 15.4 | 60.6 ± 17.1 | 47.8 ± 15.6 | 58.5 ± 13.9 | 39.8 ± 15.8 | 51.8 ± 16.2 |
| Factor | East (n = 87) | South (n = 151) | West (n = 87) | ||||||
|---|---|---|---|---|---|---|---|---|---|
| Closed (n = 7) | Open (n = 80) | p-Value | Closed (n = 49) | Open (n = 102) | p-Value | Closed (n = 68) | Open (n = 19) | p-Value | |
| Stream order | 1.3 (0.5) | 2.5 (0.9) | - | 2.1 (0.7) | 2.1 (0.9) | - | 2.1 (0.8) | 1.8 (1.1) | - |
| Stream width (m) | 36.4 (59.9) | 65.0 (88.1) | - | 113.8 (334.2) | 71.1 (160.0) | - | 89.4 (298.3) | 71.2 (195.1) | - |
| Water temperature (°C) | 21.4 (3.0) | 20.8 (3.1) | 0.440 | 23.5 (3.0) | 23.2 (2.9) | 0.416 | 22.7 (2.8) | 22.5 (1.8) | 0.775 |
| DO (mg/L) | 6.5 (1.3) | 7.7 (3.0) | 0.166 | 7.0 (2.0) | 8.1 (2.3) | <0.001 | 7.2 (2.4) | 6.1 (2.0) | 0.004 |
| pH | 7.8 (1.1) | 8.5 (1.5) | 0.101 | 8.0 (0.7) | 7.8 (0.8) | 0.024 | 8.1 (0.9) | 8.2 (0.8) | 0.743 |
| Conductivity (uS/cm) | 7605.9 (12,593.3) | 8386.7 (14,648.2) | 0.528 | 4785.9 (10,919.5) | 14,385.9 (16,226.4) | <0.001 | 5054.7 (10,317.0) | 16,575.8 (17,063.4) | <0.001 |
| Turbidity (NTU) | 11.7 (15.6) | 33.0 (74.4) | 0.029 | 52.6 (108.0) | 54.0 (140.0) | 0.001 | 54.6 (60.5) | 161.1 (257.6) | 0.001 |
| Salinity (psu) | 6.2 (9.0) | 6.0 (10.0) | 0.704 | 2.3 (4.6) | 8.2 (10.1) | <0.001 | 3.5 (7.0) | 11.8 (11.8) | <0.001 |
| COD (mg/L) | 4.6 (1.8) | 4.4 (3.7) | 0.155 | 5.2 (3.3) | 3.9 (3.5) | <0.001 | 5.6 (3.3) | 6.5 (7.5) | 0.824 |
| Total Nitrogen (mg/L) | 5.9 (7.0) | 1.7 (1.5) | <0.001 | 3.3 (2.5) | 2.4 (2.3) | <0.001 | 3.8 (3.0) | 3.9 (3.9) | 0.411 |
| Total Phosphorus (mg/L) | 0.1 (0.2) | 0.1 (0.2) | 0.013 | 0.1 (0.1) | 0.1 (0.1) | <0.001 | 0.2 (0.5) | 0.3 (0.4) | 0.720 |
| Fish Assemblage | East (n = 87) | South (n = 151) | West (n = 87) | ||||
|---|---|---|---|---|---|---|---|
| Closed (n = 7) | Open (n = 80) | Closed (n = 49) | Open (n = 102) | Closed (n = 68) | Open (n = 19) | ||
| Total | No. families | 17 | 39 | 25 | 38 | 22 | 18 |
| No. species | 30 | 90 | 62 | 78 | 71 | 57 | |
| No. individuals | 3472 | 35,427 | 11,406 | 18,670 | 31,133 | 6838 | |
| Primary freshwater | No. species (RA) | 10 (24.8) | 39 (20.4) | 28 (52.0) | 15 (3.2) | 40 (72.2) | 22 (8.8) |
| Estuary | No. species (RA) | 12 (66.2) | 23 (29.2) | 23 (46.5) | 31 (81.1) | 24 (25.3) | 28 (72.3) |
| Migratory | No. species (RA) | 2 (2.9) | 7 (47.1) | 3 (00.2) | 3 (2.0) | 2 (0.4) | 2 (0.1) |
| Marine | No. species (RA) | 6 (6.0) | 21 (3.4) | 8 (1.3) | 29 (13.7) | 5 (2.1) | 5 (18.9) |
| Exotic | No. species (RA) | 0 | 2 (0.8) | 4 (2.8) | 1 (0.0) | 5 (3.1) | 2 (0.1) |
| Endemic | No. species (RA) | 1 (2.4) | 12 (2.7) | 5 (1.7) | 4 (0.3) | 7 (3.0) | 3 (2.0) |
| Endangered | No. species (RA) | 1 (1.6) | 2 (3.2) | 0 | 0 | 0 | 0 |
| Tolerant | No. species (RA) | 11 (55.4) | 18 (26.0) | 16 (56.9) | 15 (53.1) | 23 (81.2) | 18 (68.7) |
| Area | Group (Type) | Group Dissimilarity (%) | Species | Average Abundance (%) | Average Dissimilarity (%) | Ratio Dissimilarity | Species Contribution (%) | Cumulative Contribution (%) | |
|---|---|---|---|---|---|---|---|---|---|
| Closed | Open | ||||||||
| East | Closed and Open | 85.85 | Mugil cephalus | 5.02 | 3.42 | 9.66 | 0.94 | 11.25 | 11.25 |
| Tribolodon hakonensis | 0.61 | 4.81 | 8.04 | 0.90 | 9.36 | 20.61 | |||
| Plecoglossus altivelis | 0.65 | 2.52 | 4.64 | 0.69 | 5.40 | 26.01 | |||
| Chaenogobius urotaenia | 0.80 | 2.02 | 4.34 | 0.80 | 5.06 | 31.07 | |||
| Pseudorasbora parva | 2.43 | 0.77 | 4.24 | 0.71 | 4.94 | 36.01 | |||
| South | Closed and Open | 88.36 | Mugil cephalus | 1.86 | 2.15 | 7.02 | 0.94 | 7.94 | 7.94 |
| Tridentiger brevispinis | 1.30 | 1.98 | 6.05 | 0.95 | 6.85 | 14.80 | |||
| Carassius auratus | 2.31 | 0.20 | 5.72 | 0.94 | 6.47 | 21.27 | |||
| Acanthogobius flavimanus | 1.17 | 1.49 | 5.07 | 0.85 | 5.74 | 27.01 | |||
| Lateolabrax maculatus | 0.30 | 1.53 | 4.35 | 0.84 | 4.93 | 31.94 | |||
| West | Closed and Open | 88.05 | Carassius auratus | 4.94 | 1.06 | 8.32 | 1.30 | 9.45 | 9.45 |
| Chelon haematocheilus | 2.16 | 3.94 | 8.15 | 0.84 | 9.26 | 18.70 | |||
| Mugil cephalus | 1.44 | 2.37 | 6.04 | 0.83 | 6.85 | 25.56 | |||
| Pseudorasbora parva | 3.01 | 0.42 | 5.34 | 0.92 | 6.06 | 31.62 | |||
| Synechogobius hasta | 0.78 | 1.97 | 4.58 | 0.75 | 5.21 | 36.82 | |||
| East (n = 87) | South (n = 151) | West (n = 87) | ||||
|---|---|---|---|---|---|---|
| Closed (n = 7) | Open (n = 80) | Closed (n = 49) | Open (n = 102) | Closed (n = 68) | Open (n = 19) | |
| KEFAI | KEFAI | KEFAI | KEFAI | KEFAI | KEFAI | |
| Stream order | 0.421 | 0.293 ** | −0.037 | 0.241 ** | 0.001 | 0.156 |
| Salinity (psu) | −0.315 | 0.002 | 0.018 | 0.038 | 0.061 | 0.141 |
| COD (mg/L) | −0.001 | −0.071 | −0.086 | −0.068 | −0.005 | −0.176 |
| T-N (mg/L) | −0.018 | −0.169 * | −0.035 | −0.150 * | −0.078 | −0.149 |
| T-P (mg/L) | −0.019 | 0.006 | −0.211 * | −0.182 * | 0.007 | −0.086 |
Publisher’s Note: MDPI stays neutral with regard to jurisdictional claims in published maps and institutional affiliations. |
© 2022 by the authors. Licensee MDPI, Basel, Switzerland. This article is an open access article distributed under the terms and conditions of the Creative Commons Attribution (CC BY) license (https://creativecommons.org/licenses/by/4.0/).
Share and Cite
Kim, J.-W.; Kim, K.-J.; Choi, B.-M.; Lee, K.-L.; Jang, M.-H.; Yoon, J.-D. The Application of a Fish-Based Multi-Metric Index for the Assessment of Ecological Qualities of Estuaries in the Korean Peninsula. Sustainability 2022, 14, 11608. https://doi.org/10.3390/su141811608
Kim J-W, Kim K-J, Choi B-M, Lee K-L, Jang M-H, Yoon J-D. The Application of a Fish-Based Multi-Metric Index for the Assessment of Ecological Qualities of Estuaries in the Korean Peninsula. Sustainability. 2022; 14(18):11608. https://doi.org/10.3390/su141811608
Chicago/Turabian StyleKim, Jun-Wan, Kyu-Jin Kim, Beom-Myeong Choi, Kyung-Lak Lee, Min-Ho Jang, and Ju-Duk Yoon. 2022. "The Application of a Fish-Based Multi-Metric Index for the Assessment of Ecological Qualities of Estuaries in the Korean Peninsula" Sustainability 14, no. 18: 11608. https://doi.org/10.3390/su141811608
APA StyleKim, J.-W., Kim, K.-J., Choi, B.-M., Lee, K.-L., Jang, M.-H., & Yoon, J.-D. (2022). The Application of a Fish-Based Multi-Metric Index for the Assessment of Ecological Qualities of Estuaries in the Korean Peninsula. Sustainability, 14(18), 11608. https://doi.org/10.3390/su141811608