Article

Rail Sample Laboratory Evaluation of Eddy Current Rail Inspection Sustainable System

1
College of Civil Engineering, Nanjing Forestry University, Nangjing 210037, China
2
Department of Civil, Environmental, and Geospatial Engineering, Michigan Technological University, Houghton, MI 49931, USA
3
Civil and Transportation Engineering, Beijing University of Technology, Beijing 100124, China
4
Institute of Civil Engineering Materaisl, Southwest Jiaotong University, Chengdu 610031, China
*
Author to whom correspondence should be addressed.
Sustainability 2022, 14(18), 11568; https://doi.org/10.3390/su141811568
Submission received: 25 July 2022 / Revised: 11 September 2022 / Accepted: 13 September 2022 / Published: 15 September 2022

Abstract

:
Increasing the efficiency, frequency, and speed of rail defect detection can reduce maintenance costs and improve the sustainability of railways. The non-contact eddy current (EC) system can be operated along with a railcar for detecting rail flaws. Even if the EC can be utilized for rail defect identification and characterization, current commercial devices are not sufficient for defect classification on rails by providing highly sensitive signals for post-processing. In this study, we established an efficient and expandable eddy current rail inspection system and verified its capability for classification of different defect signals. The integrated hardware and software EC measurement system was firstly applied to detect notched cracks in steel samples with different crack depths and angles. The measured voltage and current analog inputs from the eddy current sensor were acquired and processed with a fast Fourier transformation (FFT) algorithm in the LabVIEW platform. The real-time impedance was then obtained by transferring signals to a normalized impedance plane plot. The processed EC signals showed adequate sensitivity and efficiency with changes of notched crack depths and angles during the sensor movement. A comparative case study on field rail samples was then conducted to examine the feasibility and capability of the established system on different types of actual rail defects. The experimental analysis and case study results demonstrate that the integrated eddy current system could possibly be used for non-destructive rail crack inspection and classification. The enhanced detection capability (especially on subsurface cracks) and real-time post-processing technique could further contribute to improving rail-life sustainability.

1. Introduction

Rail transportation is an important part of the worldwide transportation system [1], and its safety is heavily dependent on the performance of steel rails that form the smooth surface for rolling stock steel wheels [2]. With today’s rail production techniques, surface defects have become more common than internal defects under repeated bending and shear stresses [3,4,5]. Nowadays, rails are exposed to constantly increased traffic with heavy loads and higher speeds, increasing the possibility of surface defect propagation [6,7]. The accumulation of such defects increases the maintenance costs and may lead to a sudden breakage once the crack propagation exceeds the limit of the structural integrity. In the meantime, corrosion more easily occurs at such places [8]. Therefore, the accurate detection of rail defects can affect operational safety and passenger comfortability [9] and the interaction of the vehicle with overhead systems [10]. In addition to safety improvements made by earlier and more accurate identification of rail defects, the higher expectations on the sustainability of infrastructures require effective diagnostic methods of rail defects.
Generally, rail inspections are conducted in three different ways, including manual (visual) observation, computer vision evaluation, and other nondestructive measurements (eddy-current-based method and ultrasonic techniques) [11,12,13]. Among different methods, the non-destructive testing (NDT) methods have attracted more attentions in recent years due to their preferable efficiency and time-saving ability [14]. The eddy current (EC) method is a well-known technique that has been widely used in the inspection of cracks in conductive materials, such as pipes, rivets, and welds [15,16]. Rails are made of steel that are suited for testing by EC. In terms of the surface flaws on rails, the eddy current can be operated along with the running train to collect a real-time signal and locate the defect positions with GPS devices [17]. Meanwhile, ultrasound is also used for rail inspection, which is more suitable for internal defect identification [18] because of the physical properties of ultrasonic waves. In addition, the computer vision evaluation is generally based on the machine learning algorithm that needs a considerable volume of training sets [19,20]; however, the surface defects on rails are mostly minor and invisible before the crack propagation. Image-based analysis may not accurately capture such defects, and the defects are distinctive in different locations and regions [7], which limits the applicability of computer vision evaluation. Therefore, the eddy current technique is the most suitable method for the surface defect monitoring on rails among different NDT methods [21].
While methods that rely on eddy currents are available, the commercial EC system cannot directly provide defect types and patterns [15]. It is generally based on live measurement data and also relies on commercially designed data acquisition devices for signal display, for instance, the impedance analyzer that is considerably expensive [22]. In addition, the inspection depth is mainly related to the operational frequency. A frequency range from 1 kHz to 350 kHz is normally used for rail inspection. For a better penetration depth, the inspection frequency is recommended to be lower; nevertheless, the signal-to-noise ratio would hardly be controllable at such frequencies [23]. Moreover, the ability to identify crack types and the possibility of detecting near-top subsurface defects have been of concern with the current commercial EC system [24], which needs to be further investigated to promote the applicability of EC in rail inspection and maintenance. Current EC detection techniques mostly require human decision; thus, having relatively low efficiency, the commercially available devices display the real-time signals based on the complex impedance plane plot, which needs trained technicians to read and analyze the results. Additionally, the capability of classifying defect types, patterns, and locations have not been well-established, especially the crack patterns, which are significantly important for maintenance decisions in terms of the crack severity and rail sustainability.
Overall, the current commercial EC devices are not easily expandable for investigators to distinguish and classify rail defects. The main objective of this research was to develop an expandable eddy-current-based system for detecting defects with enhanced post-processing capability and crack classification capacities for application in sustainable rail safety inspection. Throughout this investigation, the integrated hardware and software EC system was established with combination of an EC probe, a function generator, a data acquisition module, and a host PC. The voltage and current signals of the EC probe were processed with the developed LabVIEW platform to obtain and analyze the real-time impedance. The reliability of defect inspection and the ability for classification of defect patterns was examined with lab notched steel and signal effectiveness analysis, as well as defect detection on sample rail specimens obtained from the industry. The established EC system could become an efficient tool in the future for rail defect detection and classification at the surface zones through the proposed signal post-processing and analyzing modules.

2. System Development

An integrated hardware and software EC measurement system was established to accurately detect machined cracks in steel samples with different crack depths and angles, and the effectiveness of the signal differences with defect geometry changes were investigated.

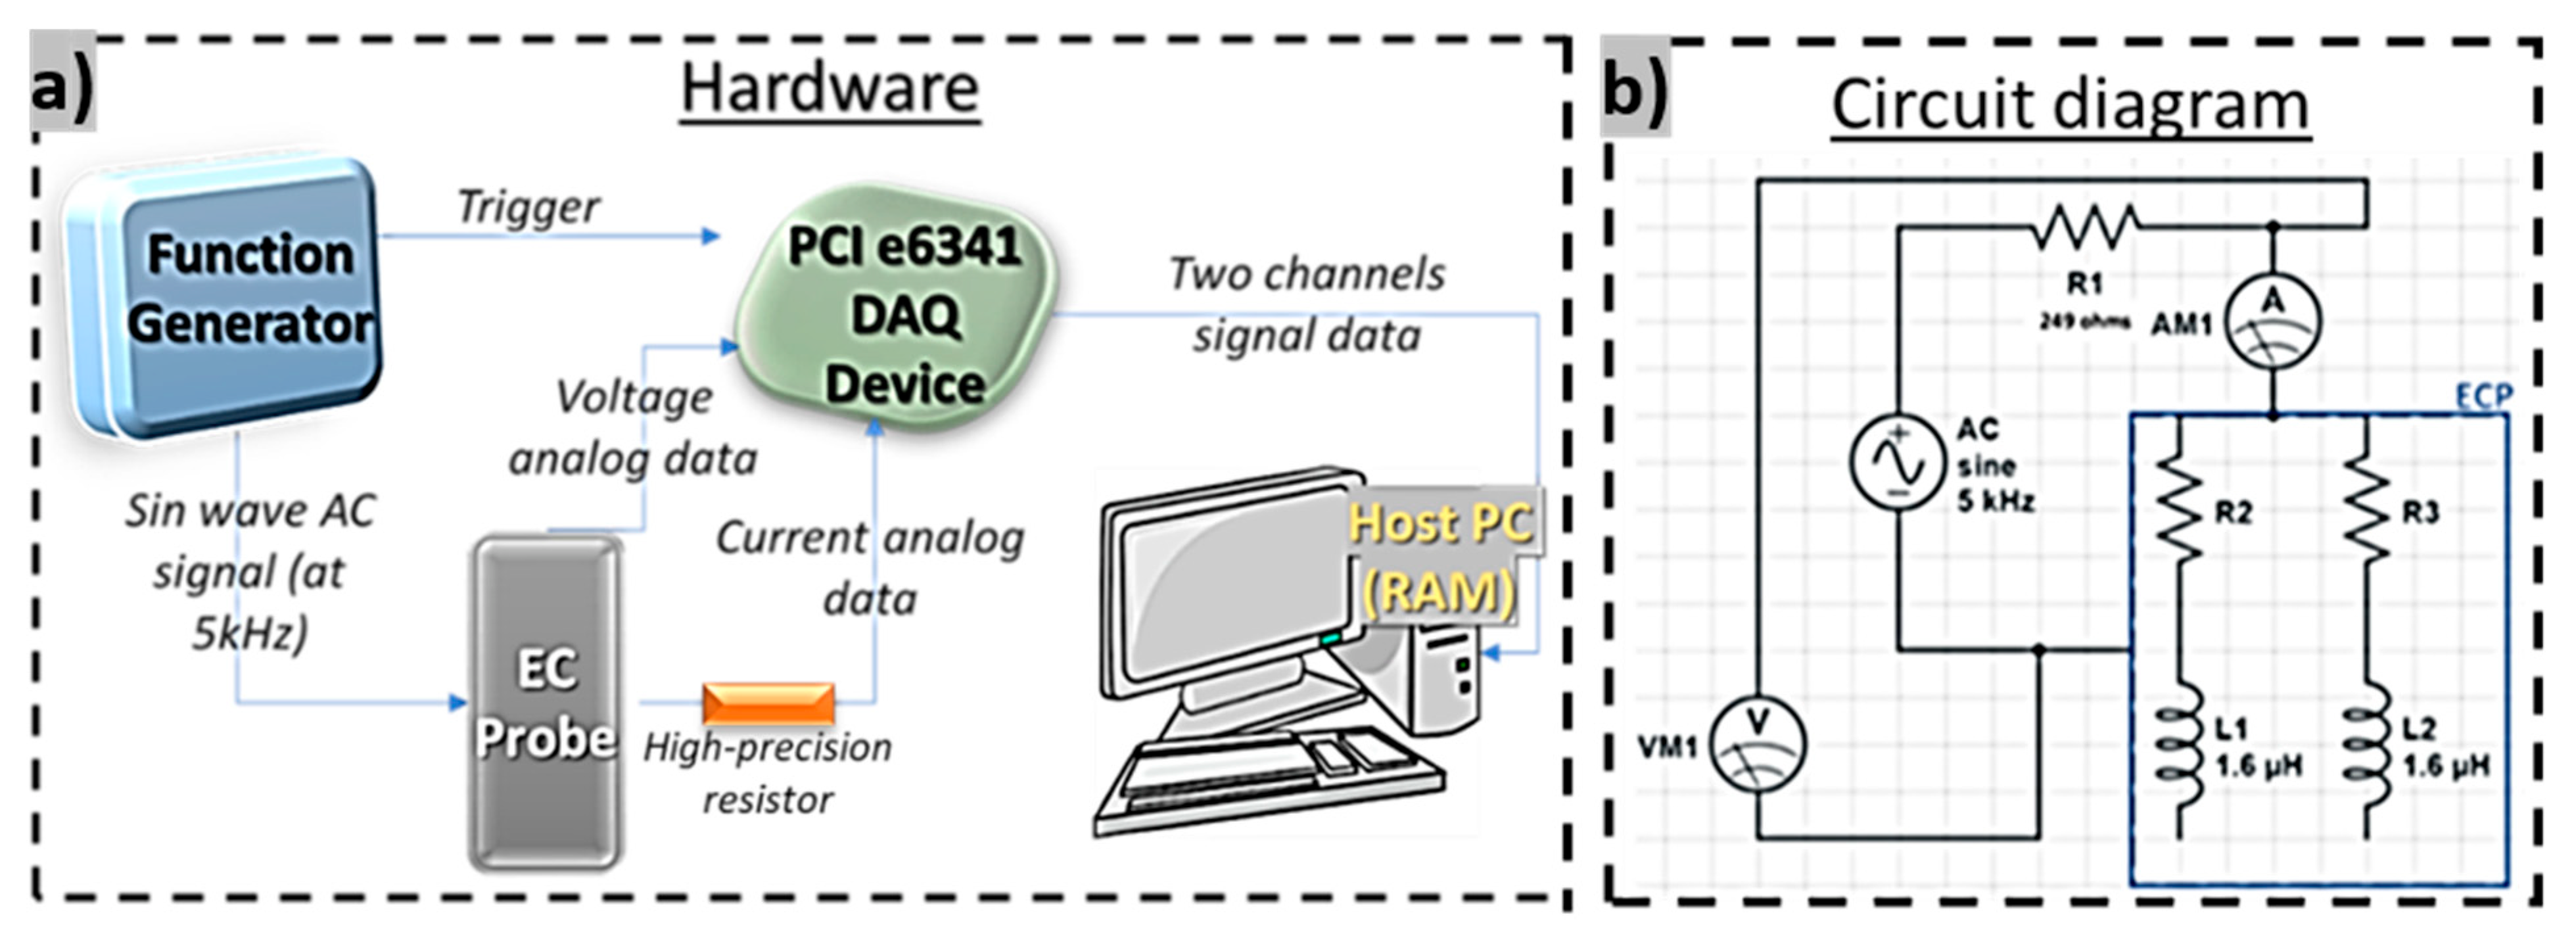
2.1. Sensor Measurement Setup

The eddy current probe (ECP) used in this investigation has a low-frequency operation range from 5 kHz to 100 kHz, which is suitable for scanning larger areas and for detecting relatively deep cracks. The ECP head diameter is about 6.3 mm. Conventionally, the frequency used for eddy current detection is relatively high since it is dedicated to inspecting minor defects on aircrafts; however, it may not suitable for rail inspection due to the complex defects on rail surface and subsurface regions. An alternating current (AC) function generator was used to produce an excitation sinewave at a constant frequency of 5 kHz [23], which was able to detect a relatively large surface area, along with a possible capacity for inspecting near-surface internal defects. To collect the signals from the ECP, a NI PCIe 6341 card was used for data acquisition along with a NI SCB-68A terminal block connector. The voltage and current across the EC probe were measured through analog inputs to the PCI card. Especially for the current measurement, an external shunt high-precision resistor was applied, since the analog input is in accordance with voltage signals. The voltage across the resistor was measured through the analog input, which was utilized in Ohm’s law for computing the current values. Consequently, the current and voltage signals from the ECP were able to be captured simultaneously by two different analog input channels. The established EC hardware system is illustrated in Figure 1.

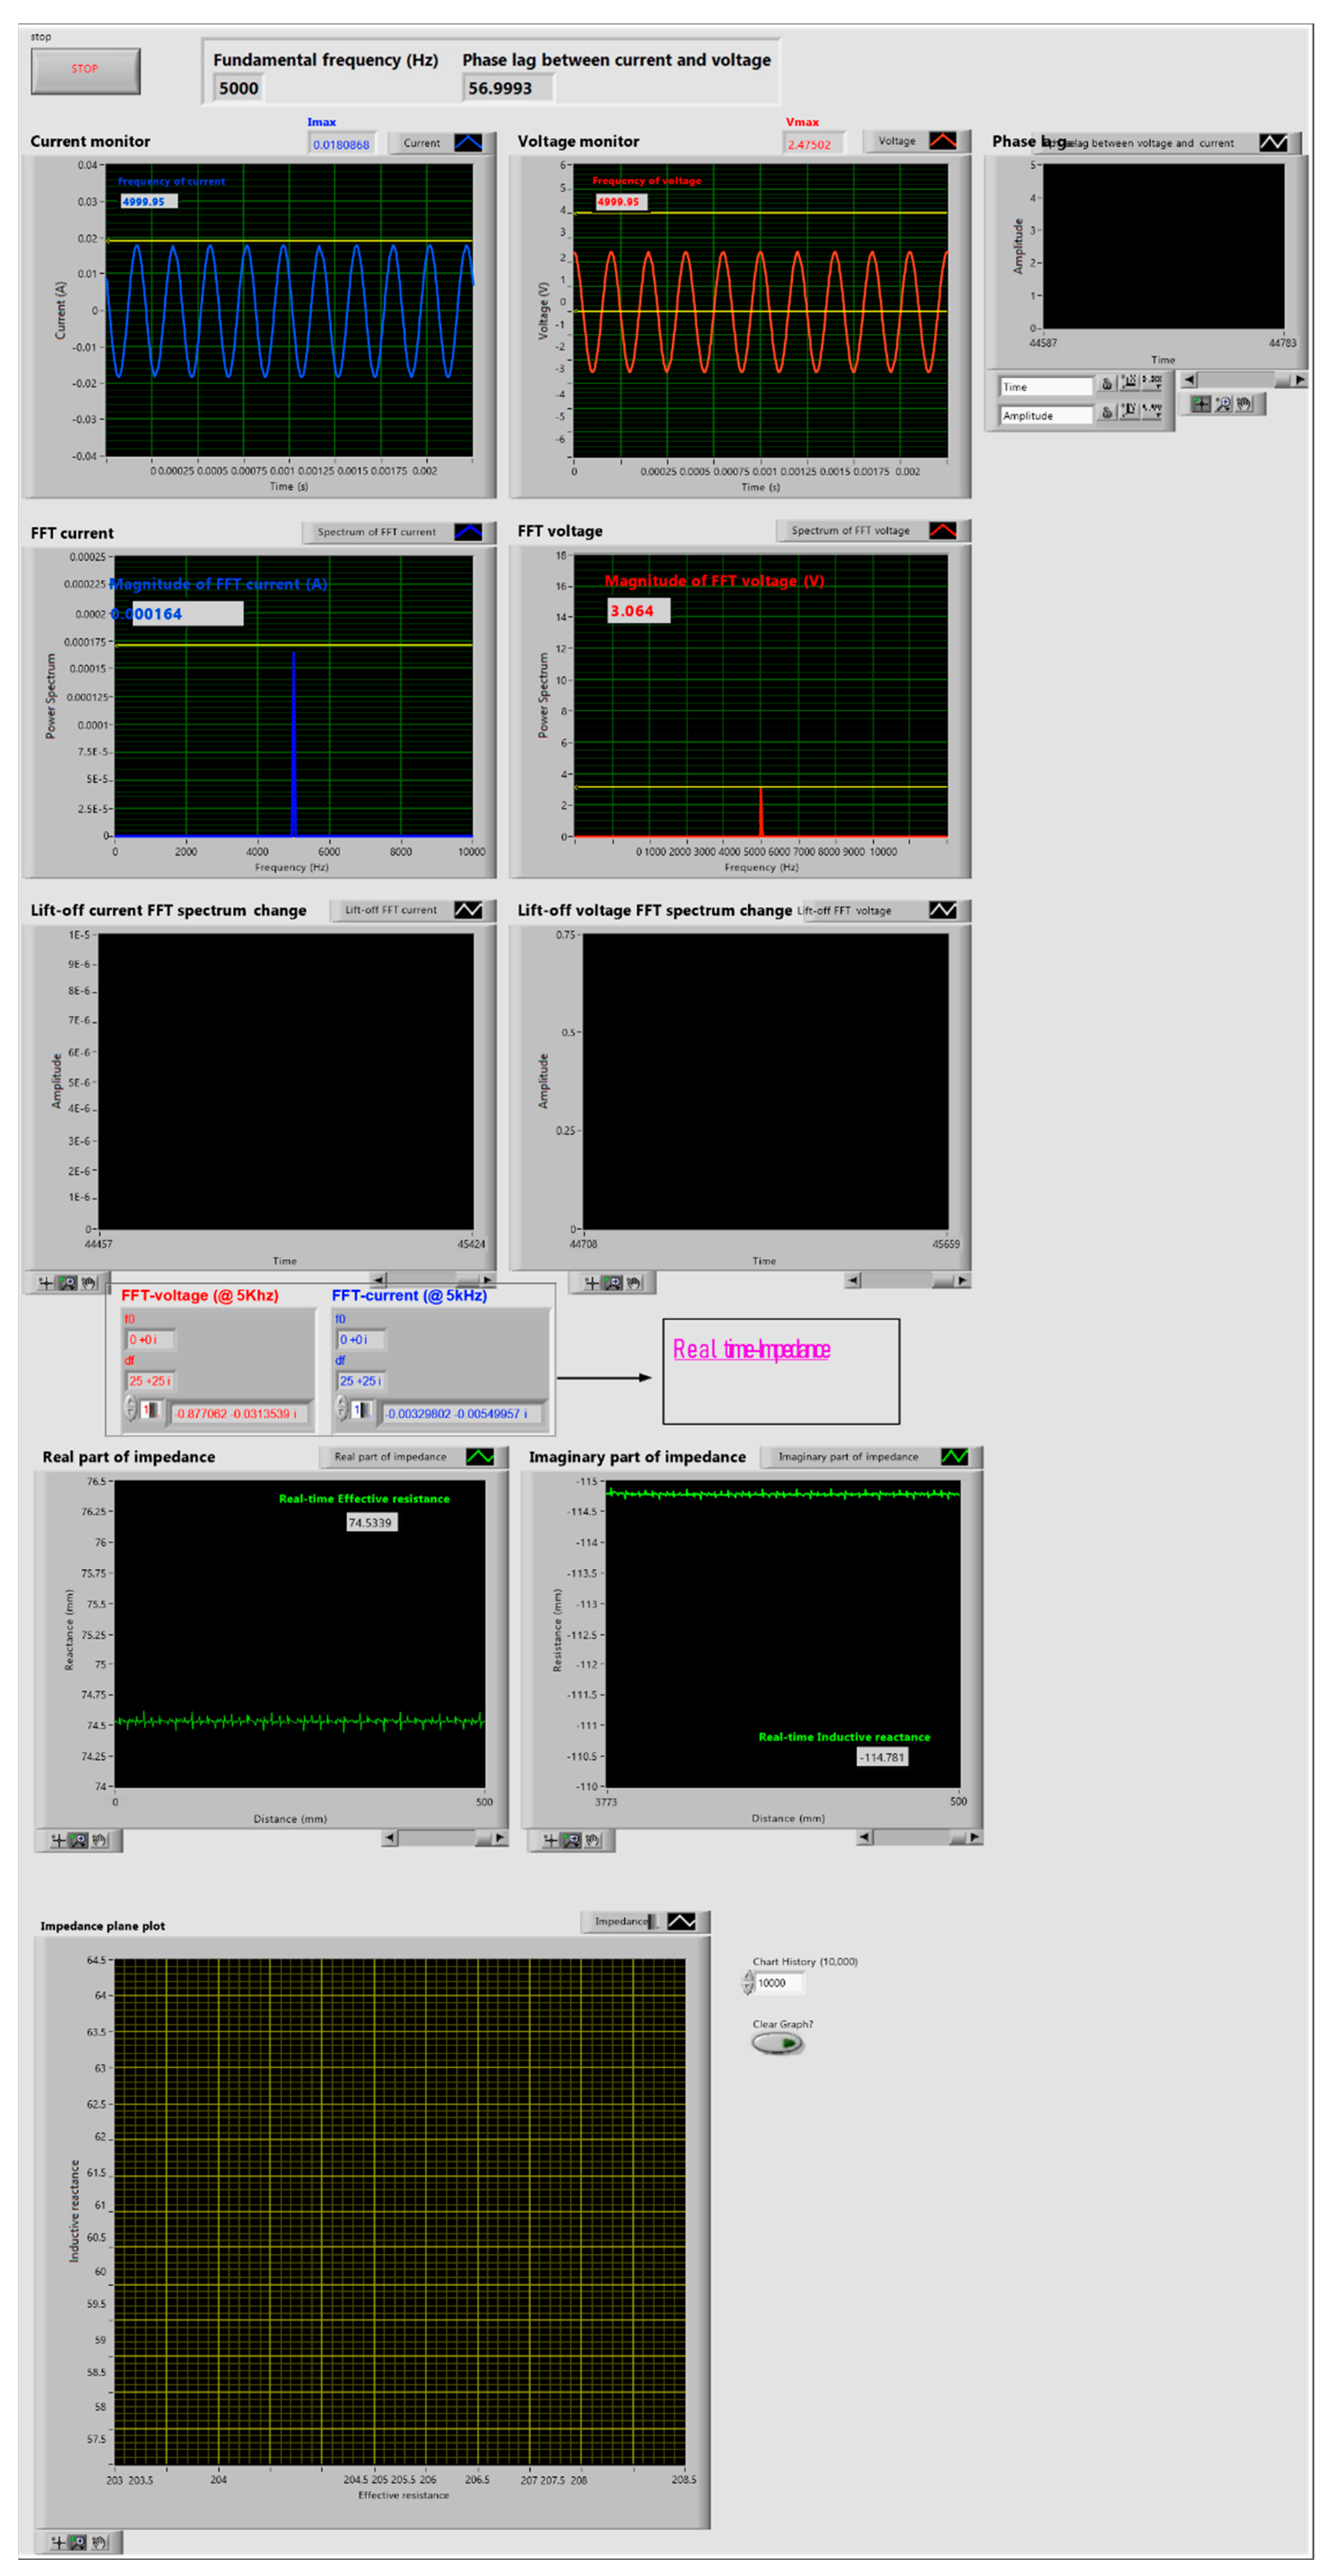
2.2. Data Acquisition and Processing Platform

With the establishment of the hardware system, the real-time signal acquisition and processing software was developed based on the LabVIEW platform. The entire front panel is illustrated in Appendix A. The developed platform mainly contains two sections: (1) real-time acquisition of current and voltage signals; (2) real-time signal monitoring and impedance analyzer. The DAQmx block acquired the voltage and current of the EC probe with a continuous data sampling rate of 250 kHz, which allows a fast detection speed in field applications. Simultaneously, the fast Fourier transform (FFT) functions were applied to process real-time impedance signals, and plots of real and imaginary parts of the impedance were established for real-time monitoring. The complex impedance plane of the EC system was obtained based on the original analog input signals through a fast Fourier transform (FFT) algorithm based on Equations (1) and (2). The obtained time-domain current and voltage signals were transformed to frequency-domain FFT current and voltage signals at 5 kHz, respectively. Meanwhile, the real-time impedance and the complex impedance plane were computed.
X f = F x t = x t e j 2 π f t d t
where x t is the time-domain signal; X f is the frequency-domain signal; f t is the frequency to analyze (Hz).
Z = R 2 + X 2
where Z is the complex impedance (Ω); R is the resistance (Ω) or the real part of the complex impedance; X is inductive reactance (Ω) or the imaginary part of the complex impedance.

3. Lab Examination of the EC System on Notched Cracks in Steel Samples

3.1. Feasibility Analysis on the EC System

The feasibility of using eddy current to detect notched crack depths and angles on steel blocks needs to be verified. In our hypothesis, the presence of a material flaw will affect the induced eddy currents in the material and result in the apparent impedance change of the coil. Eddy currents are more concentrated at the surface and decrease in intensity with a distance below the surface of the metal [25]. As shown in Equation (3), the standard depth of penetration (d) can be calculated as:
d = ρ f μ r
where d is the standard penetration depth (mm), μ r is the relative permeability, ρ is electrical resistivity (mohm-cm), and f is the operating frequency (Hz).
Based on the steel material properties and the EC excitation frequency of 5 kHz, the standard depth (d) can be estimated as 5.7 mm, at which eddy current density has decreased to about 37% of the surface density. At three depths (3d), the eddy current density is down to about 5% of the surface density. This depth of 17.1 mm can be treated as the effective depth [25]. At the same time, the material under testing should have a thickness larger than the effective depth, which ascertains the accuracy of the measurement.
In our investigation, we used three different machined notched crack depths (4 mm, 8 mm, and 12 mm), all within the range of effective depth. Our steel block had a thickness larger than the effective depth, eliminating the possible influence on the measurement results [26].

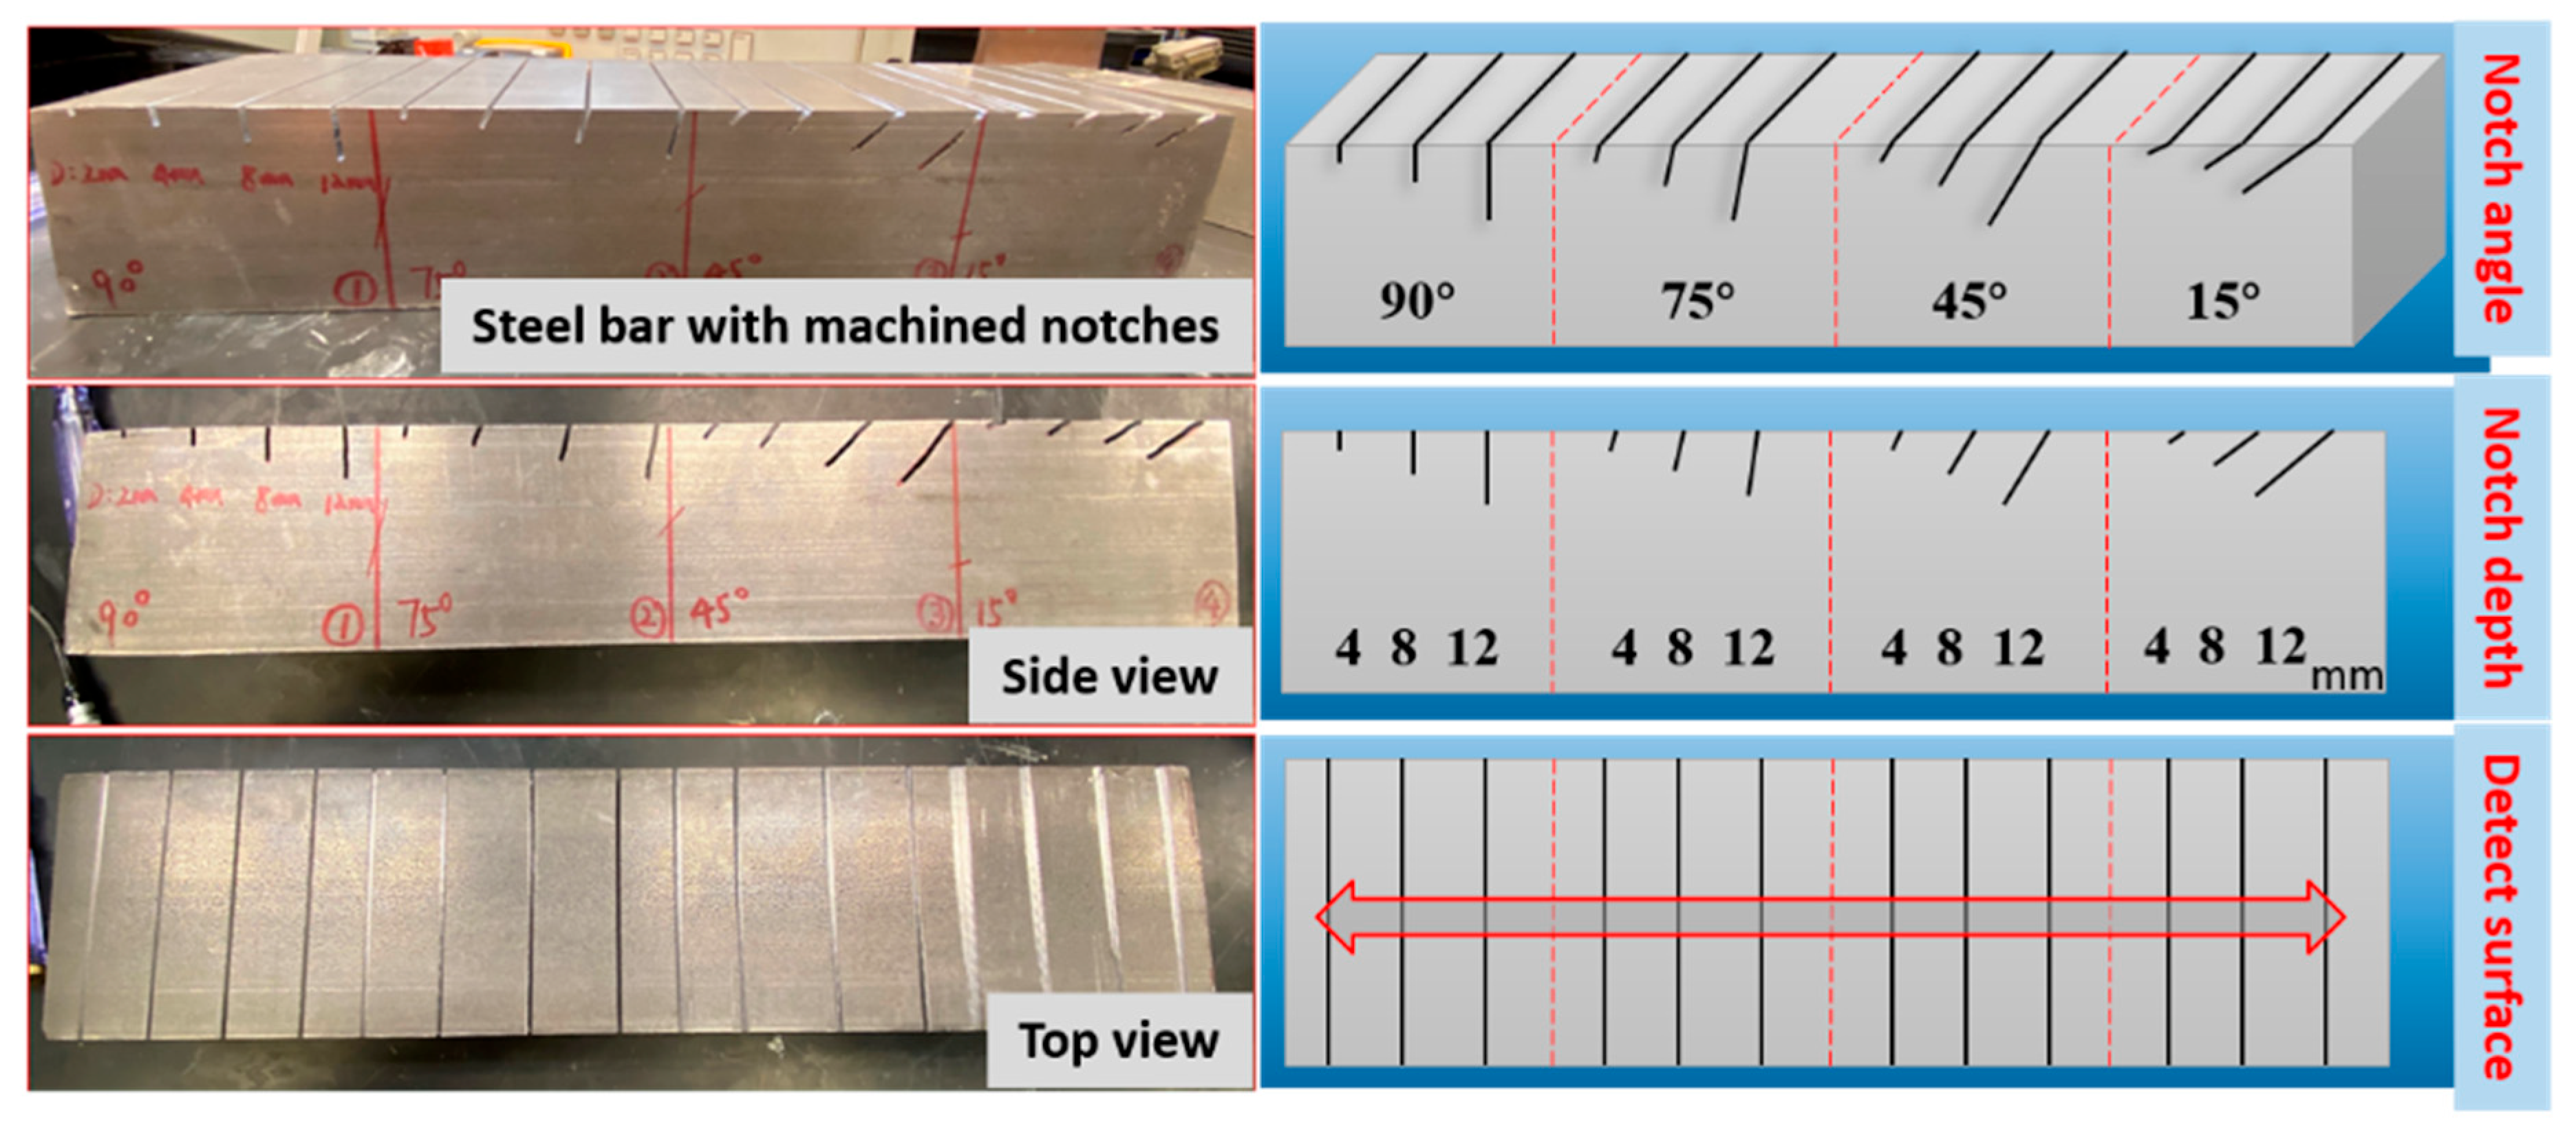
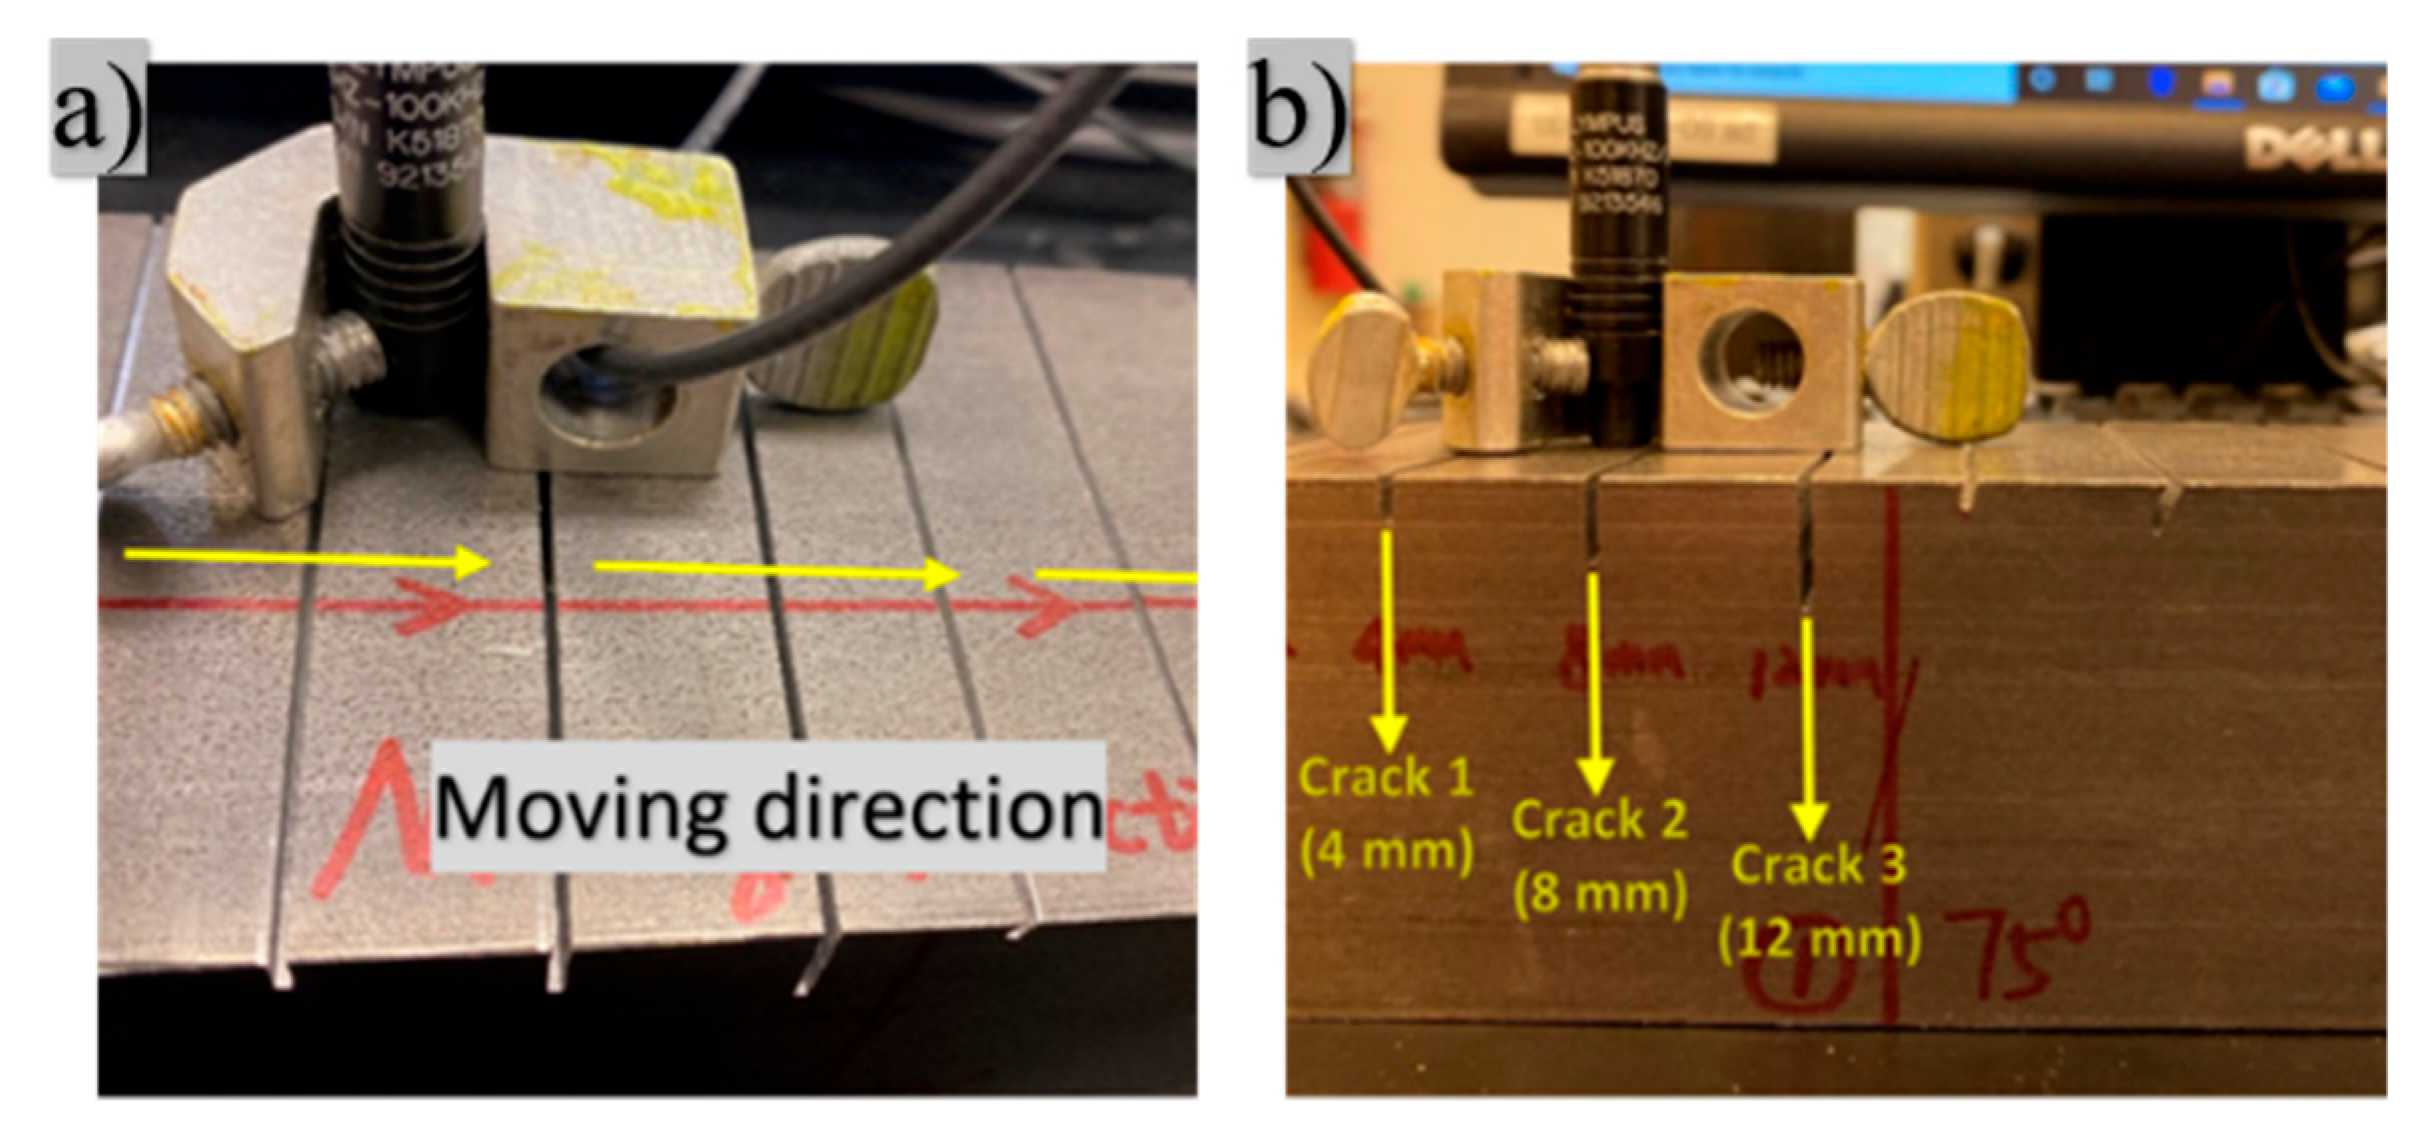
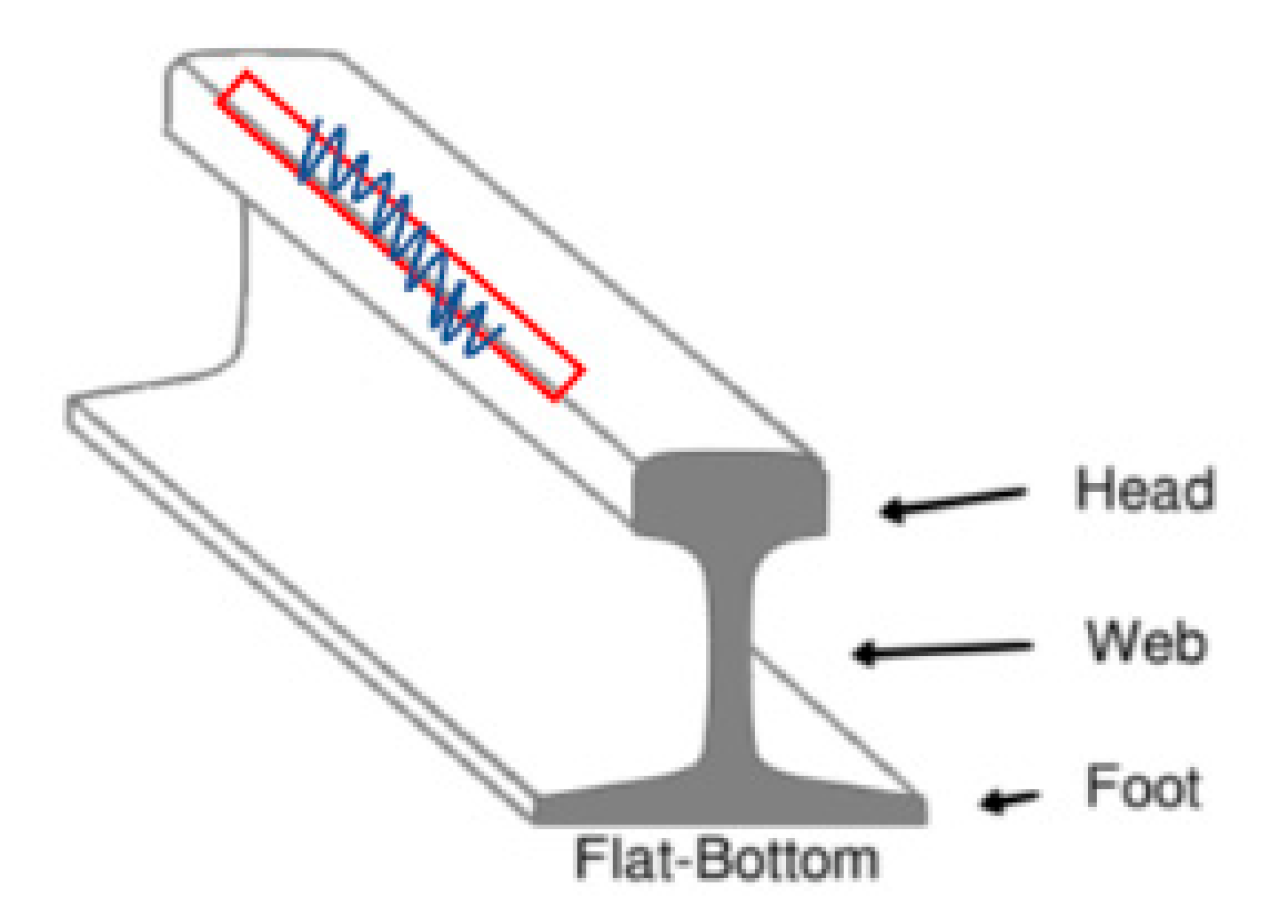
3.2. Preparation of Notched Cracks and Test Setup

To simulate the steel materials used for rails, an AISI 1018 carbon steel bar [27] with 50.8 mm by 76.2 mm cross-section and 304.8 mm was selected. The notched crack depths and notched crack angles were determined based on typical applications for eddy current measurement on the ferromagnetic materials [28,29], as shown in Table 1. The notches were machined with a band saw at a constant operation speed, where the crack width is the same as 1.0 mm for all cracking types and the space between notches was about 19 mm.
The photographs of the finished steel block with various notched cracks are illustrated in Figure 2. The detection surface was selected as the top surface of the steel block, where the different notches were shown as a straight line across the entire working surface.
The test setup is shown in Figure 3 for inspecting notched cracks. The eddy current probe was fixed in the vertical position by an aluminum clamp, and the distance between the probe head and the working surface was adjusted to minimize the lift-off effect [26]. The notches were measured by following the moving direction constantly with an operation speed of 2.0 m/min.
An example of the real-time impedance plot based on the established LabVIEW platform is shown in Figure 4. The real part of impedance reflected the real-time resistance change, while the imaginary part of impedance reflected the inductive reactance change, which are represented in Figure 4a,b, respectively. From these two waveform charts, the change in the signals can be found when the sensor moved on these cracks and the peak values changed with increased crack depths.

3.3. The Effect of Crack Depths and Angles on the Normalized Impedance Plane

In the following sections, the effects of crack depth and crack angles are analyzed based on the measured impedance signals, cracks with different depths were investigated at 90 degrees and 75 degrees, while cracks with different angles were evaluated at 4 mm and 8 mm, respectively. To analyze the data in detail from the measured signals, the MATLAB data processing code was developed based on the relative impedance changes between the flawless surface position and different crack positions. The normalized impedance plane plots were generated for different cracks with various depths and angles by implementing the developed MATLAB code. The MATLAB code can handle the data post-processing based on the measured voltage and current signals, which can automatically calculate the impedance from the measured signals.

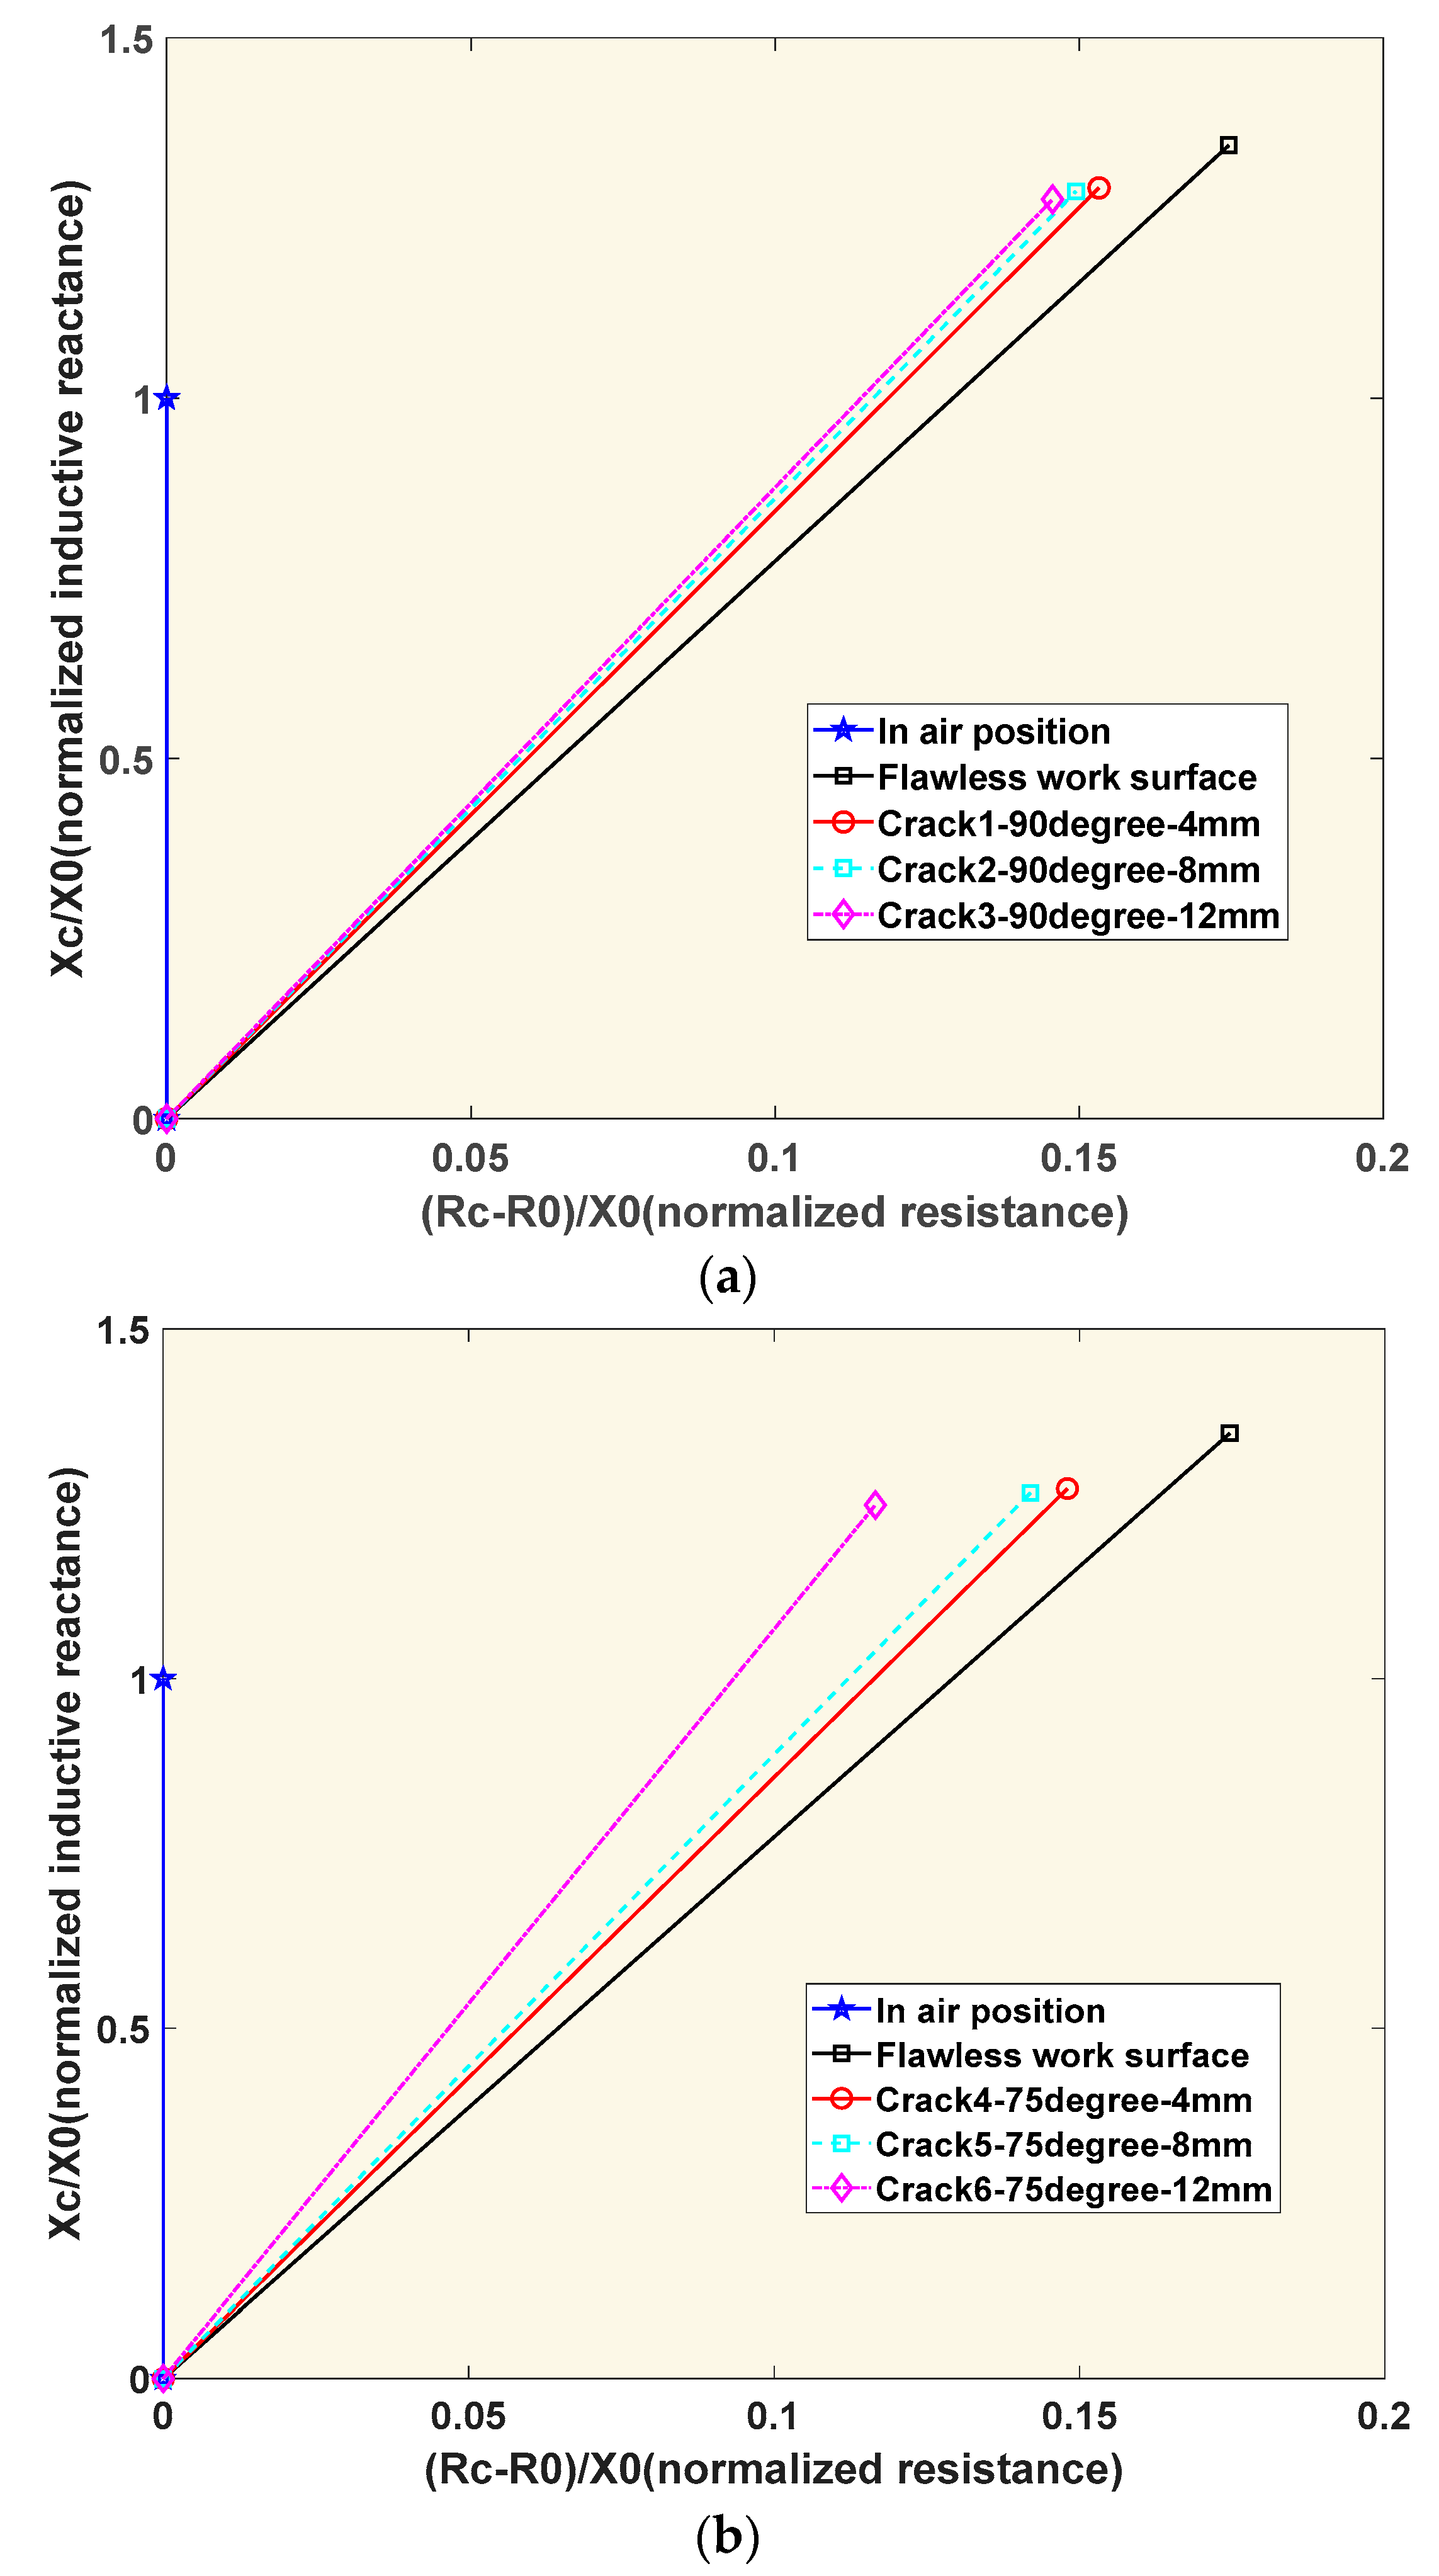
3.3.1. Analysis of Different Notched Crack Depths

The equations for calculating the normalized impedance plane are illustrated in (4) and (5) [30]:
X c n = X c X 0
and
R c n = R c R 0 X 0
where X 0 ,     R 0 are the inductive reactance and resistance with the sensor placed in the air, respectively; X c ,   R c are the new inductive reactance and resistance with the sensor placed on the working surface, respectively; X c n ,     R c n are the normalized inductive reactance and normalized resistance, respectively. When the sensor is in the air, X c n = 1 ,     R c n = 0 .
The normalized impedance plane plot of different crack depths at 90 degrees and 75 degrees are shown in Figure 5. In eddy current inspection, when the EC probe is placed on the magnetic steel block, the eddy current forms. The energy of the coil in the EC probe was dissipated, thus resulting in increased resistance in the flawless work surface [23]. However, with the presence of a crack, the induced eddy current is obstructed. With increasing crack depth, more eddy current flow is affected in the testing piece. This effect leads to the reduction of the secondary magnetic field from the eddy currents [31]. As shown in Figure 5a,b, with cracks oriented at 90 degrees and 75 degrees, both the relative reactance X c n and resistance R c n decreased with increasing crack depths. These values were also compared with the data from the flawless surface.

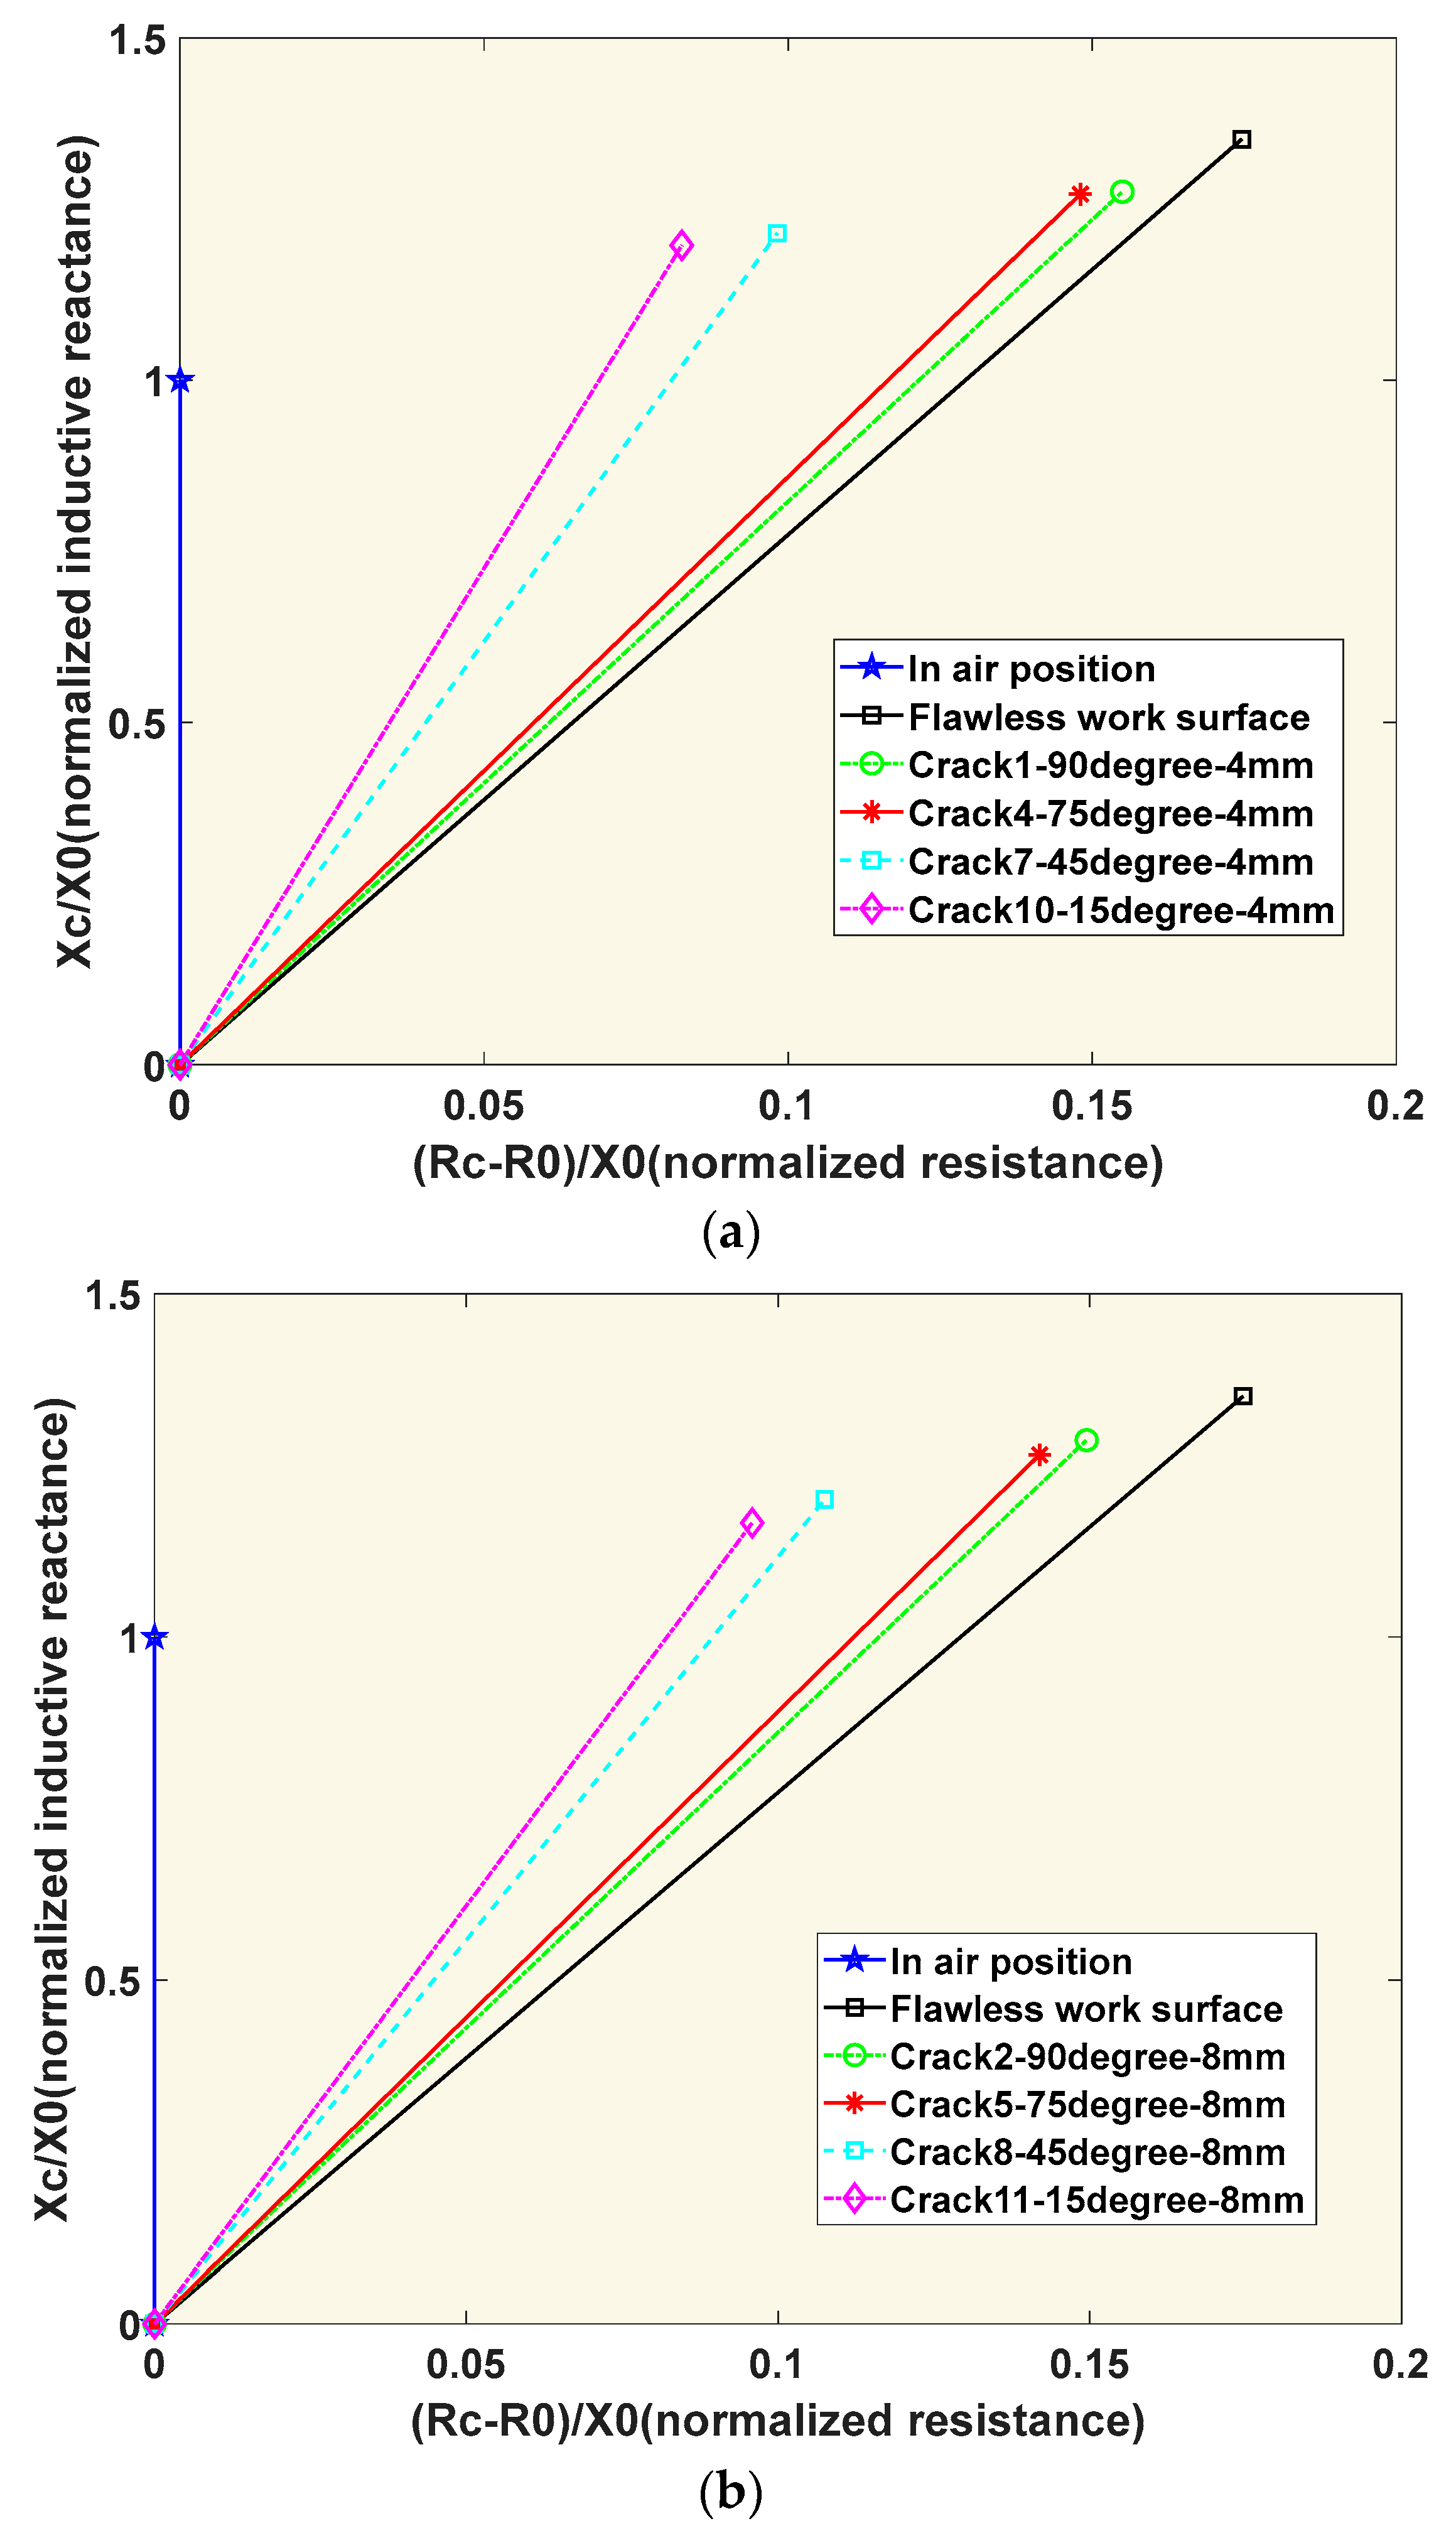
3.3.2. Analysis of Different Notched Crack Angles

Besides the crack depth effect, the crack angle effect was examined in this section. It can be observed that the real and imaginary parts of the impedance were continuously changed with the crack angle differences during the EC inspection. The normalized impedance plane was analyzed at different crack angles at 4 mm and 8 mm depths, as shown in Figure 6. It can be seen that the magnitude and phase of the impedance would change with the variations of crack angles. By comparing the normalized impedance plane plot, it can be observed that 90 degrees (vertical crack) represented the smallest effect on the normalized impedance when compared to a flawless surface. However, when the crack direction approached to be parallel to the detection surface, the effect was enlarged. With the crack angle changed from 90 degrees to 15 degrees, the crack was close to the detection surface, which obstructed more eddy currents that concentrated near the surface, leading to the reduced induction resistance and reactance. Therefore, both the relative induction resistance R c n and relative reactance X c n decreased when the crack angles changed from 90 degrees to 15 degrees.

3.4. Statistical Analysis and Discussions

3.4.1. Correlation Analysis

To verify the correlation between the normalized impedance and crack geometries, the Pearson correlation coefficient ( ρ ) [32] was computed. Coefficient values can range from +1 to −1, where +1 or −1 indicates a perfect relationship and a 0 indicates there is no relationship. The correlation between the normalized impedance ( Z c n = X c n 2 + R c n 2 ) and crack depth or crack angles was statistically evaluated. The analysis was conducted based on the data shown in Figure 7, and the results are summarized in Table 2.
The Z c n value was reduced by about 0.082 when the crack depth changed from 0 mm to 4 mm. Thereafter, the normalized impedance value was continuously reduced by 0.089 and 0.109, in terms of the crack depths at 8 mm and 12 mm, respectively, compared to that of 0 mm. The reduction of Z c n at a 12 mm depth is about 32% and 22% higher compared to that of 4 mm and 8 mm. Meanwhile, the Z c n was reduced when the angles changed from 15 degrees to 90 degrees, compared to a 0 flawless surface, and the normalized impedance value was reduced by 0.061, 0.082, 0.143, and 0.162 at 15 degrees, 45 degrees, 75 degrees, and 90 degrees, respectively.
The correlation analysis results verified that the normalized impedance has a high-strong correlation with crack geometries, especially the crack angle, which represented correlation coefficient of −0.9773 and −0.9798 at crack depths of 4 mm and 8 mm, respectively. Meanwhile, the crack depth changes are also highly correlated with the normalized impedance change; the increase of the crack depth obviously reduced the normalized impedance, where the correlation coefficient was −0.8969 and −0.9043 at crack angles of 75 degrees and 90 degrees, respectively. In addition, with the increase of the crack angles and crack depth, the Pearson correlation coefficient also approached −1, which indicated that the crack with a larger depth and angles presented a higher correlation with the normalized impedance. This phenomenon was in accordance with the physical properties of eddy current; the volume of the defect zone within the center of the eddy current field is increased with crack depths and angles.

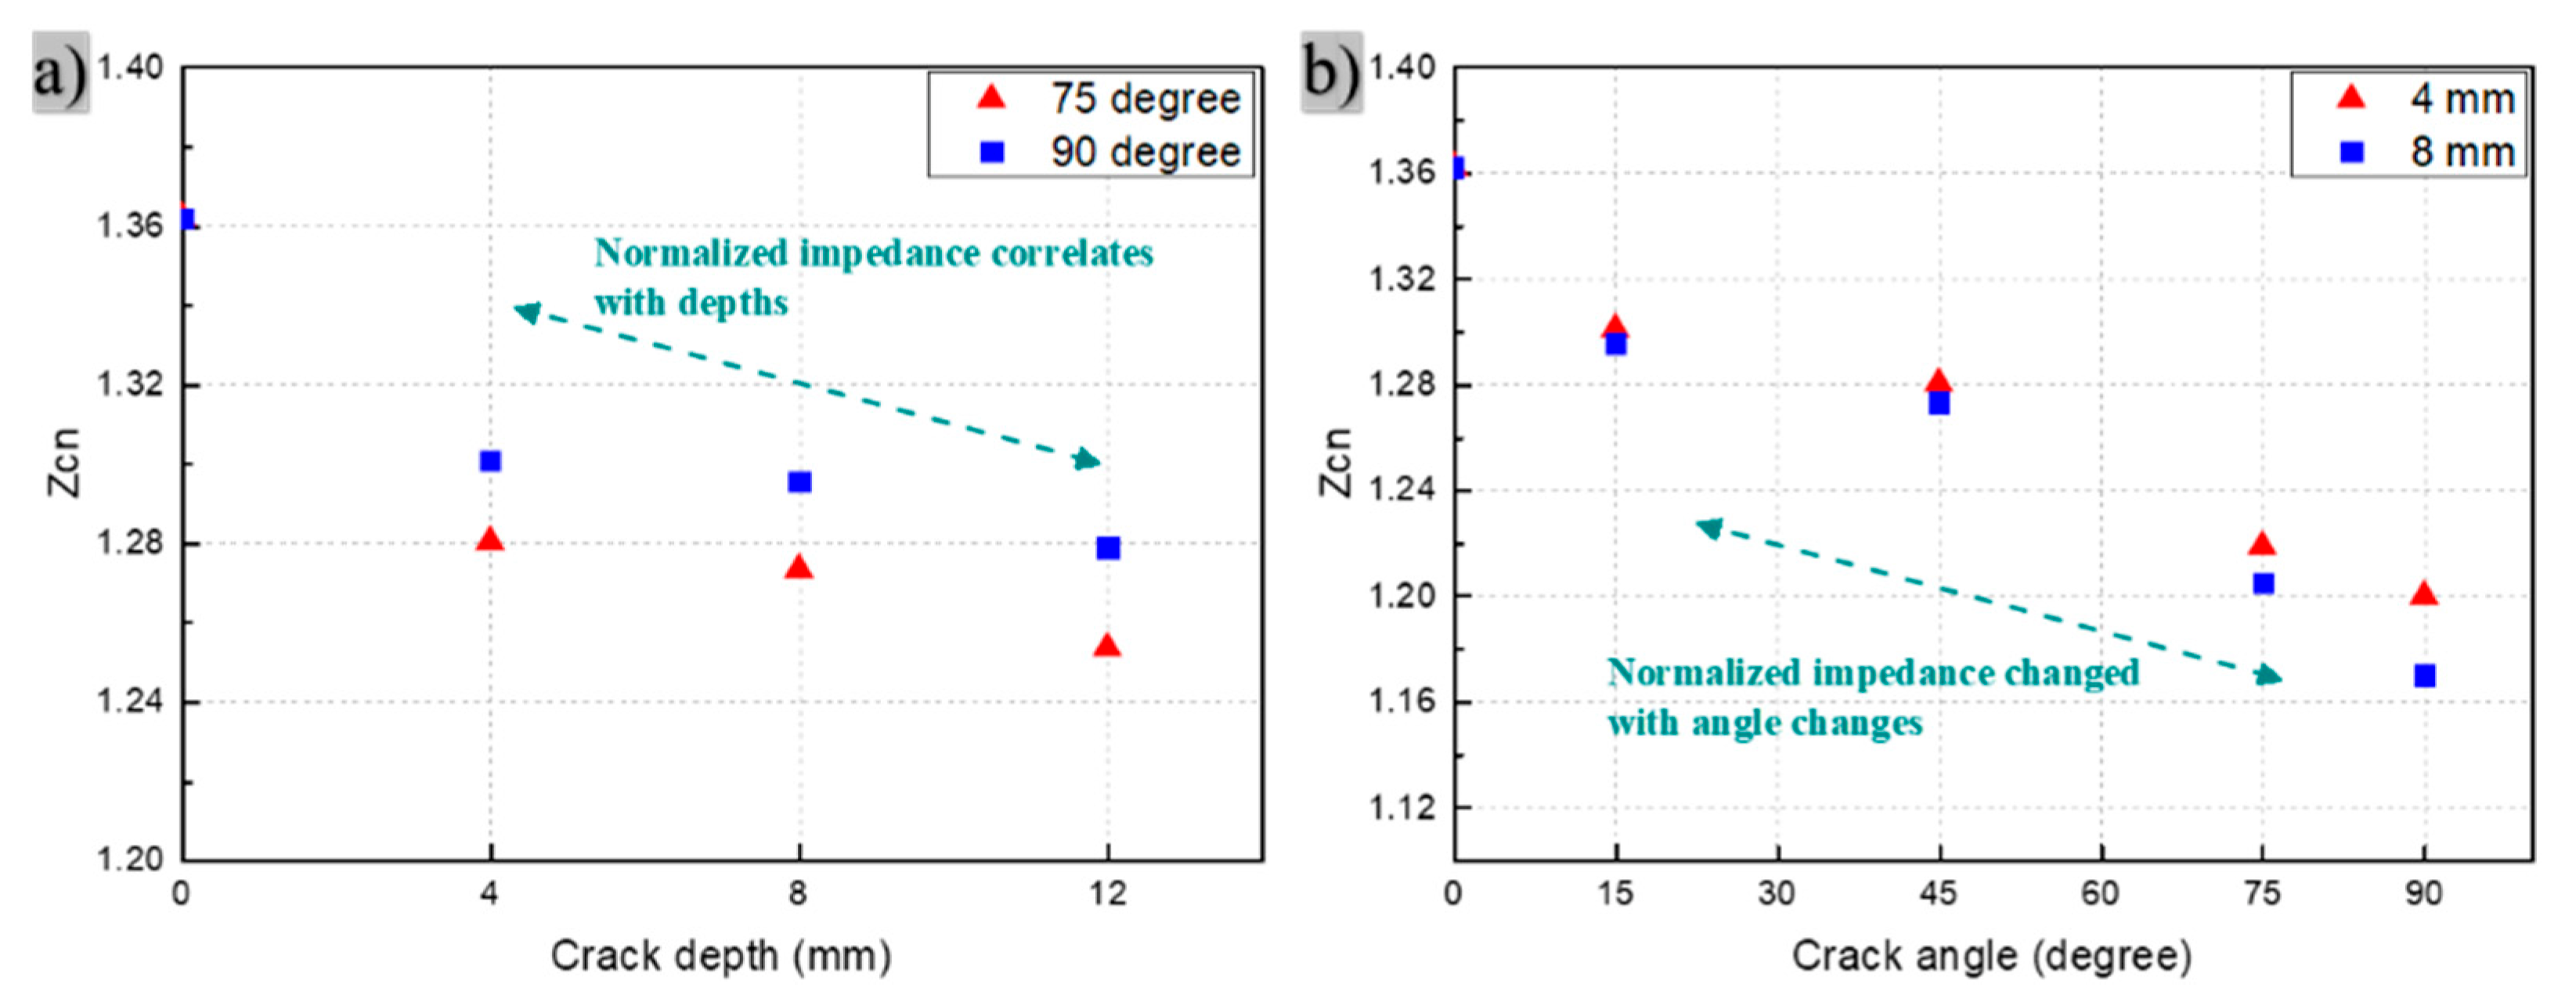
3.4.2. Analysis on the Effects of Defect Depths and Angles on the EC Results

During the inspection of machined defects, the effects of crack depths and angles on the impedance signal changes were investigated. The integrated EC system was then applied to detect and classify crack geometries. The impedance signal represented critical characterizations with the crack geometry changes. When the depths of cracks changed from 4 mm to 8 mm and 12 mm, the measured impedance signal, including both the relative induction resistance R c n and reactance X c n decreased with the increasing of crack depths. These results were also compared to the data from the flawless surface location. When the degrees of cracks changed from 90 degrees to 75 degrees, 45 degrees, and 15 degrees, both the normalized induction resistance R c n and induction reactance X c n decreased. According to the notched cracks measurement results and the statistical analysis, the developed EC system shows potential for classifying cracks with different depths and angles. Consequently, the processed normalized impedance could be used as characterization values for classifying the crack depth and angles by checking the Pearson correlation analysis. The further investigation of rail track samples was then conducted to validate the feasibility and applicability of the aforementioned EC system and signal analysis method.

4. Field Sample Detection and Evaluation

With the establishment and examination of the integrated EC hardware and software, the detection of actual defects on rail samples obtained from CN Railway was conducted and the capability of the established EC system for measuring rail defects with different geometries was evaluated. The inspection results demonstrate that the defect signals changed with different defect classifications and crack geometries. Within the same defect type, the geometry differences can be characterized by the defect signal changes, as represented in the normalized impedance plane. The detailed measurement results and analysis are discussed in the following sections.

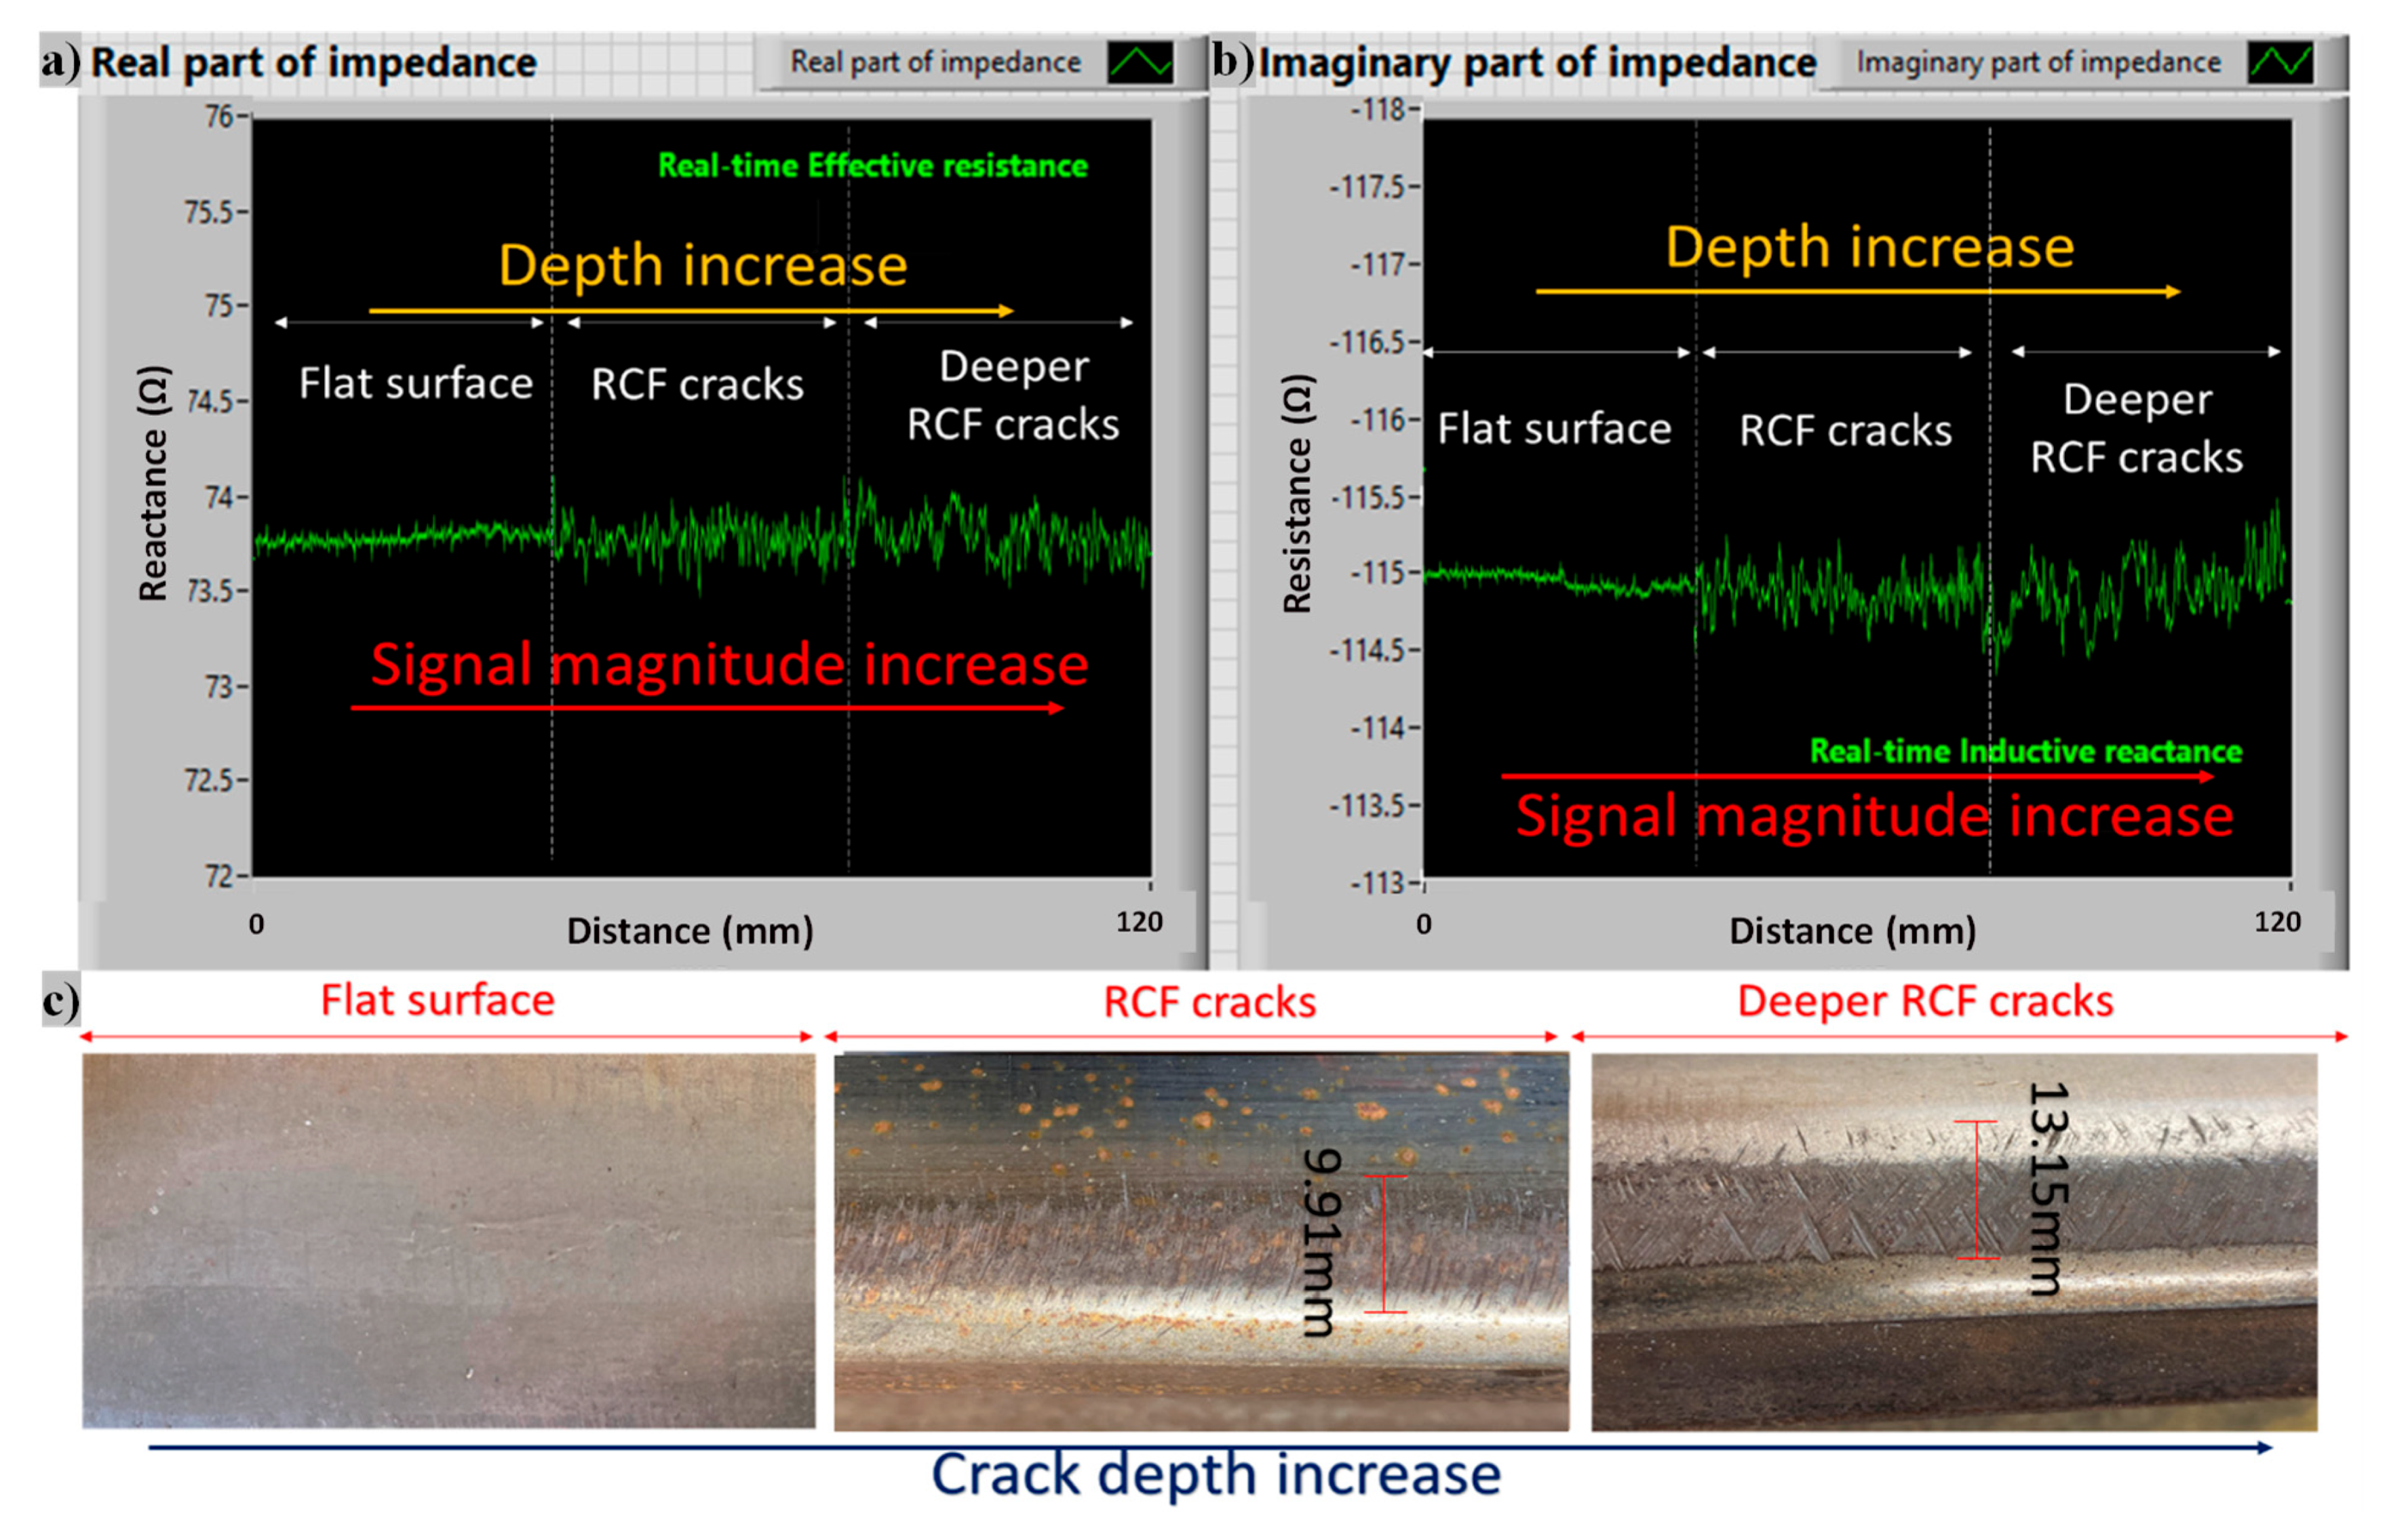
4.1. Detection on Rolling Contact Fatigue (RCF) Defects

The rolling contact fatigue (RCF) defect is caused by cyclic loading, which is represented as early fatigue damage called crack-like flaws, as shown in Figure 8. With further loading, these crack-like flaws can grow to more significant cracks and cause fractures, including rail breaks [33]. Thus, the severity of the RCF defects should be able to be determined during the EC inspection. Two types of RCF defects with different severity were selected for a comparative study and inspected with the established EC system as shown in Figure 9.
The impedance signal showed very limited fluctuation in magnitude changes when the sensor moved on the flawless (flat) surface of the rail sample. It can be noticed that the real and imaginary parts of the impedance signal showed an obvious change in RCF defect areas when compared to that of the flawless surface. In addition, with the increase of RCF defect severity, the signal also showed different magnitudes and waveforms. For instance, the signal magnitude difference of inductive reactance was increased from 0.25 Ω to 0.5 Ω when the RCF defect depth increased by about 0.5 mm. This indicated that the integrated hardware and software EC system can provide a quantitatively comparable evaluation of the damage level of RCF defects.

4.2. Detection on Surface Cracks of Rail Samples

4.2.1. Bolt Hole Crack at Rail Web

Some cracks can develop from the bolt hole at the rail web due to stress concentration, and these cracks could cause rail web fracture if not detected and repaired adequately at the early stage [34]. In this investigation, a very tiny crack that developed from the bolt hole at the rail web was inspected by the established EC system (Figure 10).
As shown in Figure 10, the bolt hole crack is very tiny, with only a 0.12 mm width. As shown in the impedance signal results, the magnitude of the signal showed a small peak jump when the EC probe passed the tiny crack. This result demonstrates the capability of the established system to detect very tiny cracks (0.12 mm width). The relatively low working frequency at 5 kHz is still adequate for capturing small surface cracks in real rails.

4.2.2. Gauge Corner Surface Defect

A surface crack at the gauge corner with an increasing crack depth was inspected by continuously moving the sensor along the crack (Figure 11).
The inspection results (Figure 12) show that the signal changed with the increased crack depth and width along with the sensor’s moving direction. This result indicates the adequate sensitivity of the established system for detecting crack geometry change in rails, as the defect signal peak increased with the crack depth. The impedance signal magnitudes of real and imaginary parts were continuously recorded along the crack.
From the previous analysis on the notched cracks, the normalized impedance was selected as the critical characterization, and processed based on the measured signal changes, which is shown in Figure 13. It can be observed from the normalized impedance value that the magnitude and phase kept changing during the sensor movement with increasing crack severity. With the increased crack depth and width, both the normalized induction resistance R c n and induction reactance X c n decreased. Therefore, the normalized impedance could also reflect the induction magnetic field changes with an increased crack depth (from C1 to C2 to C3 to C4) in the rails, which is inconsistent with the trends found in notched cracks.

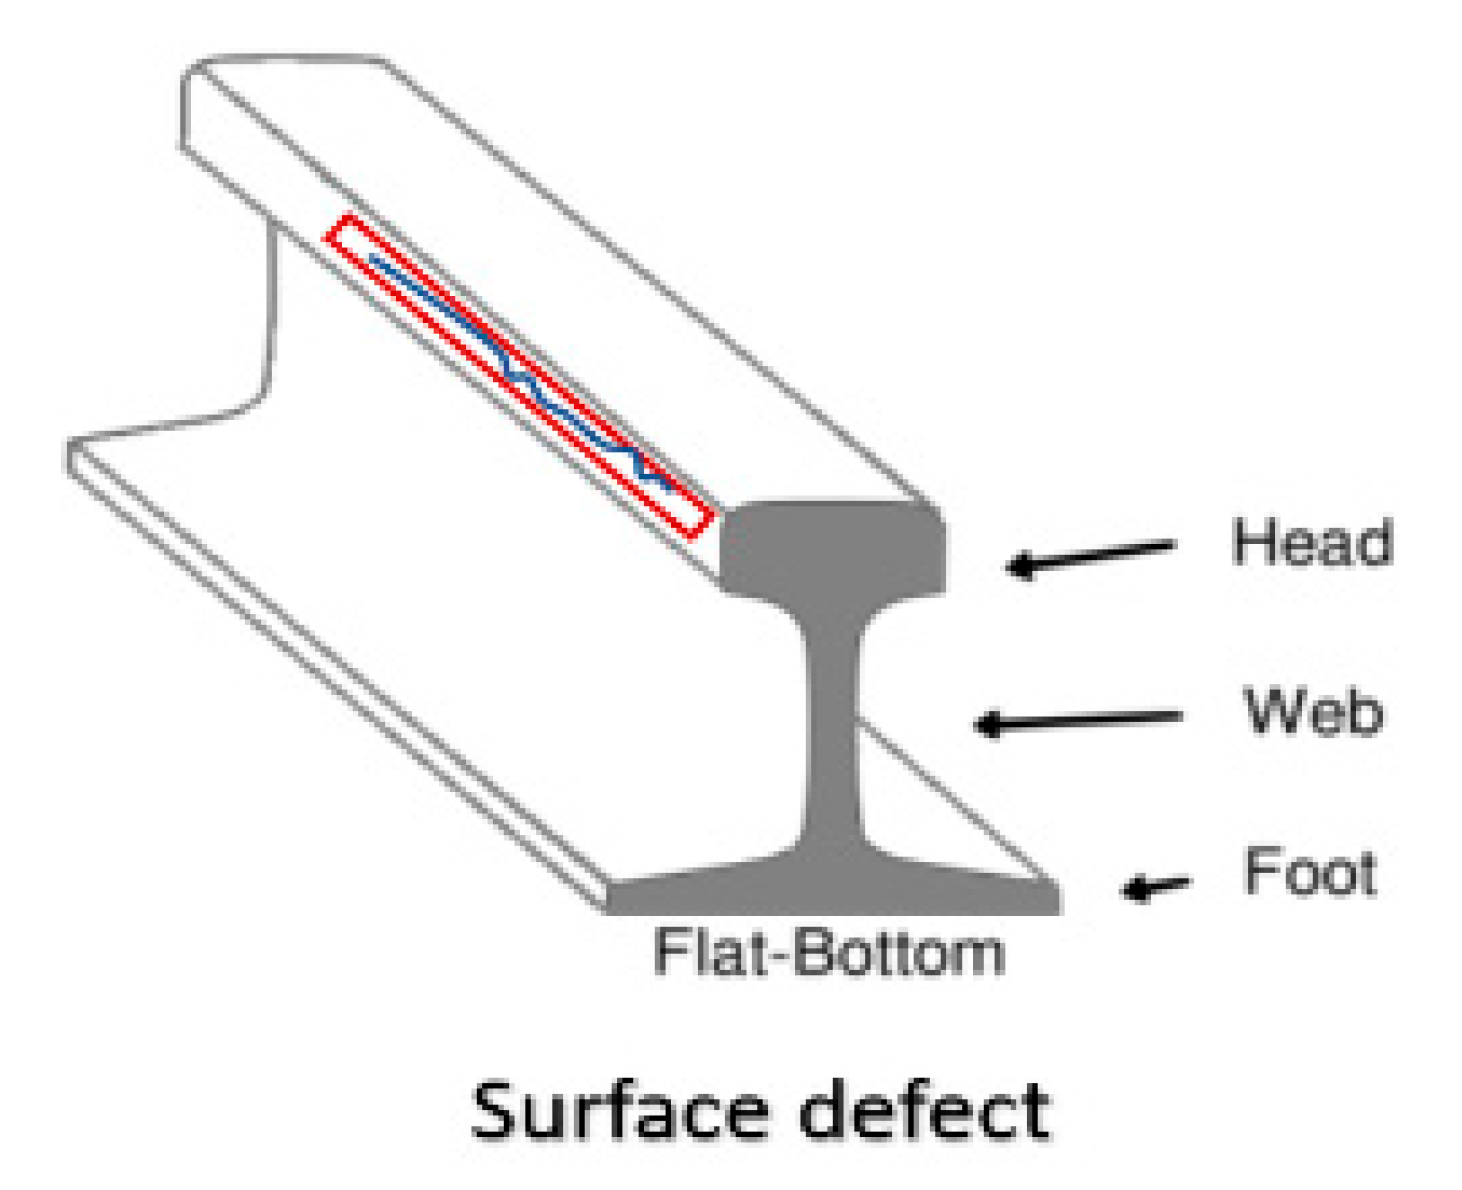
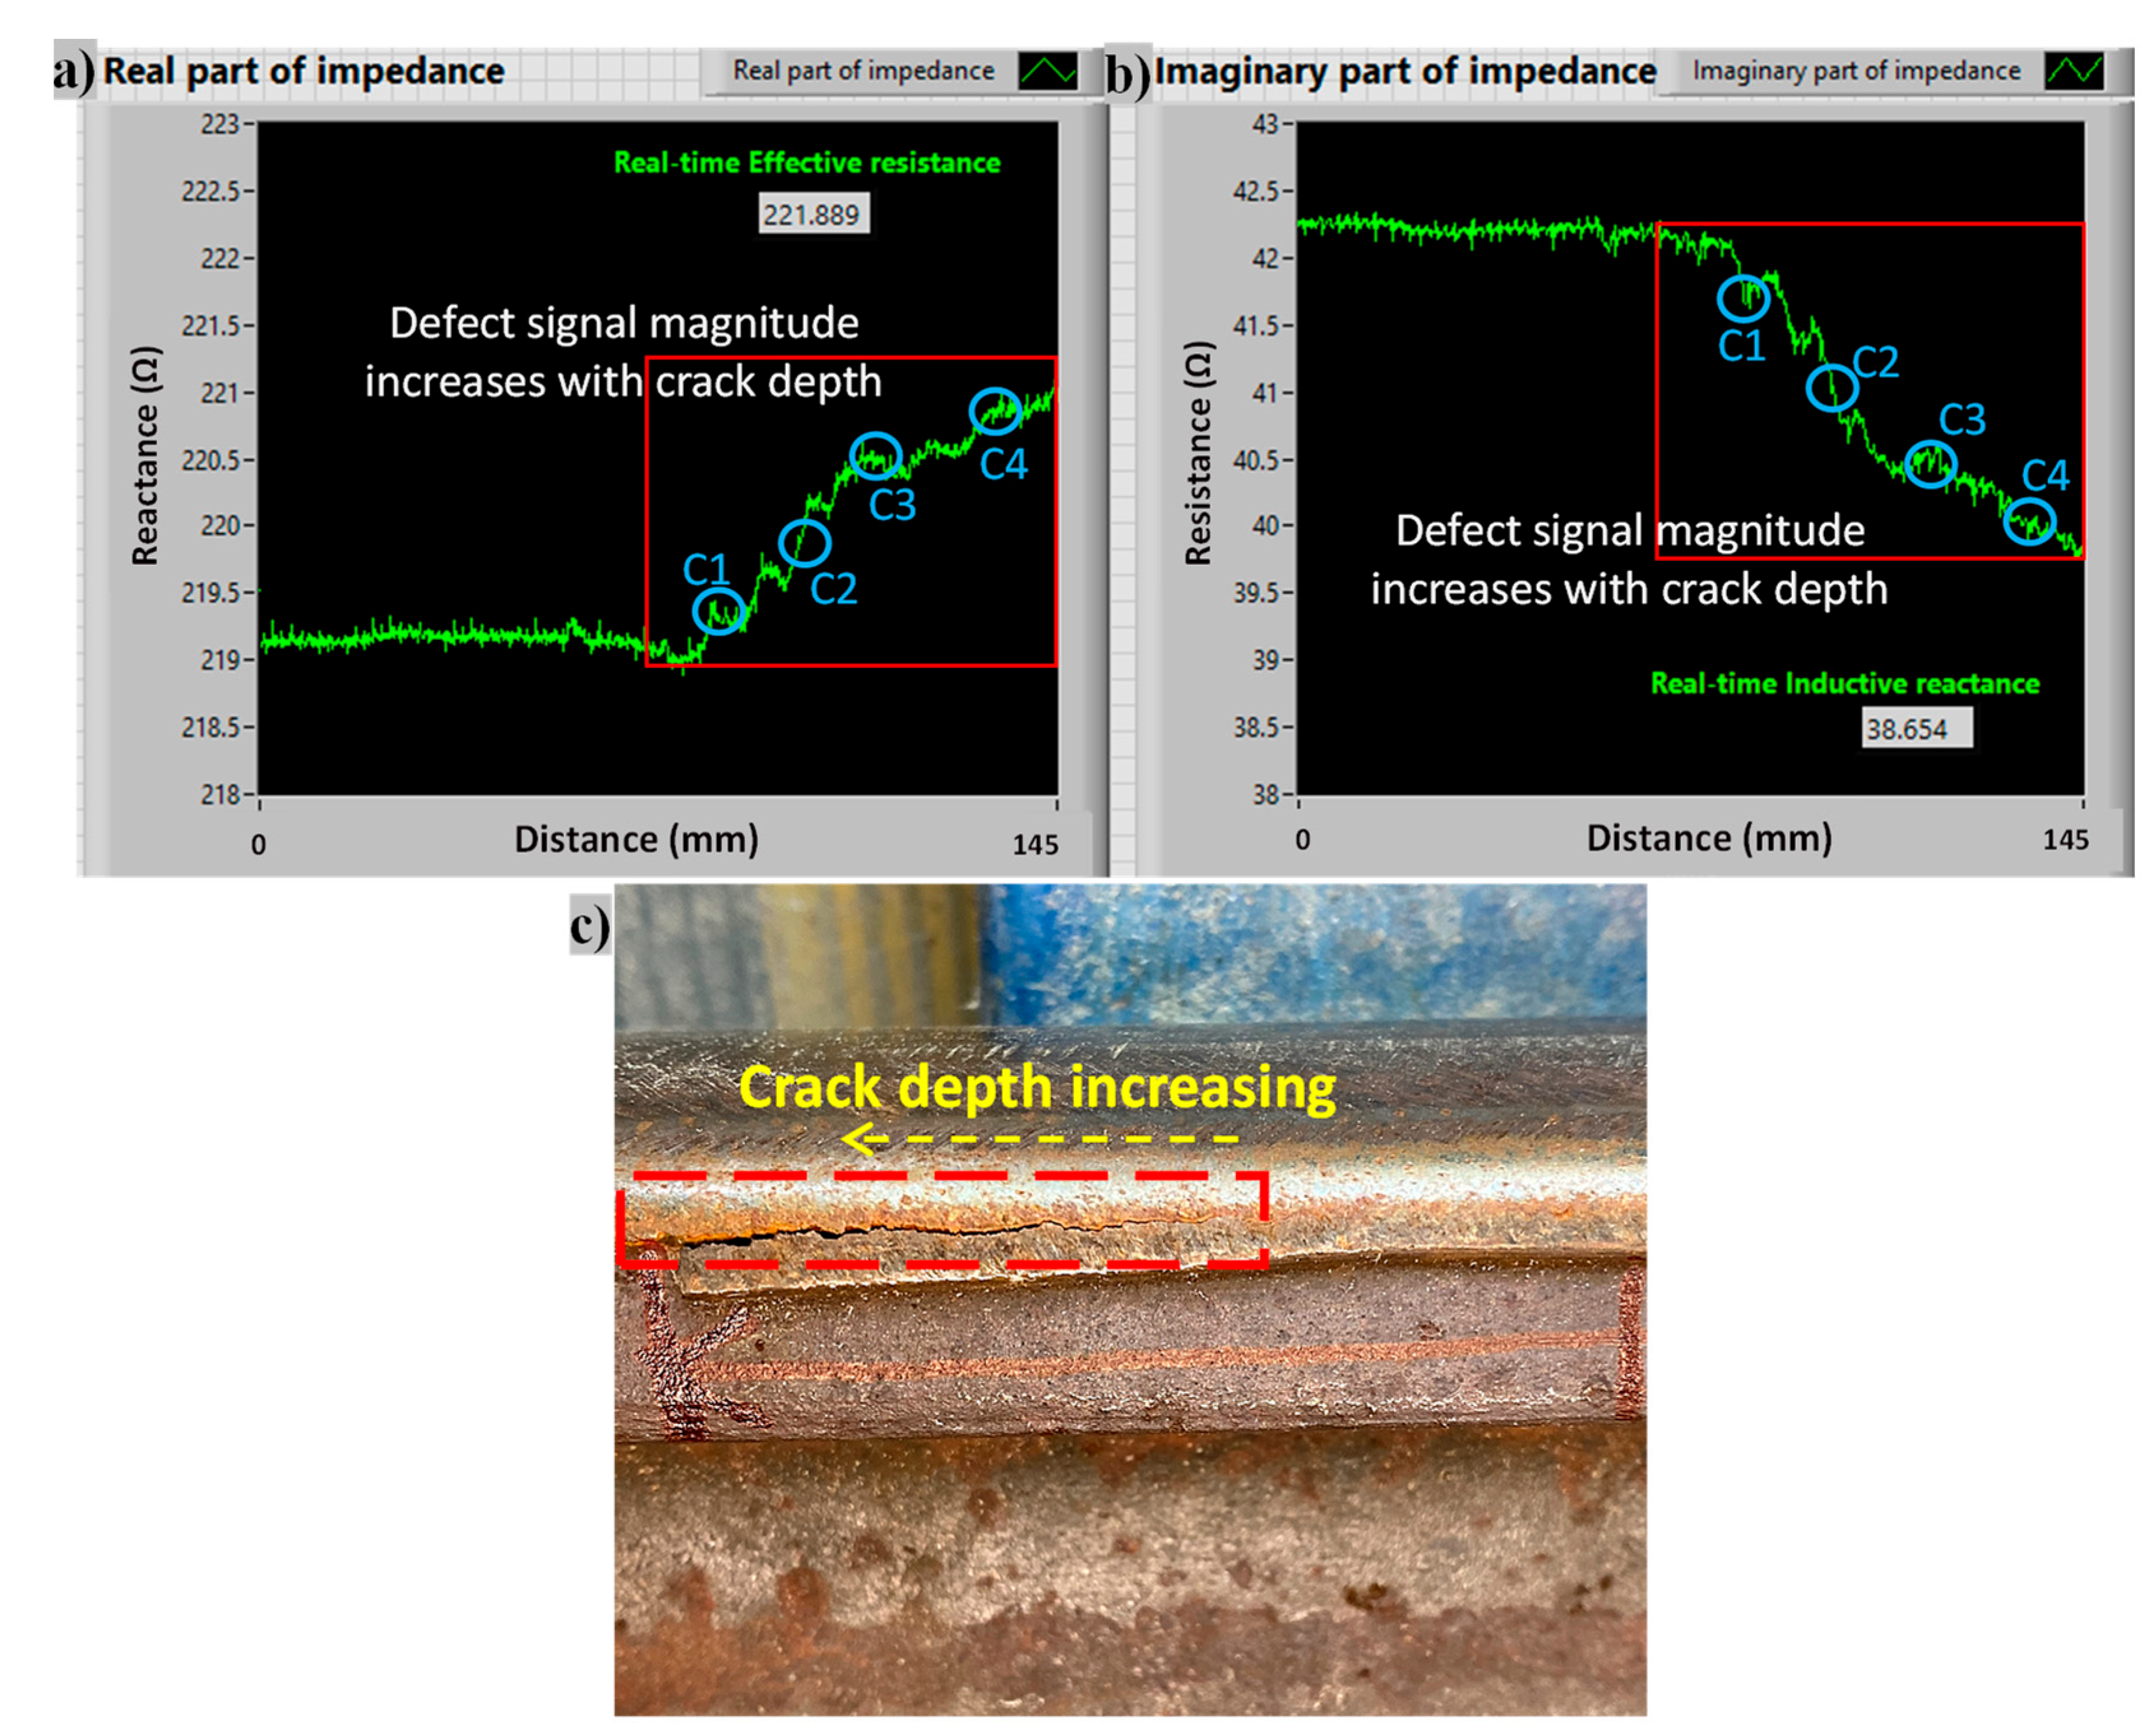
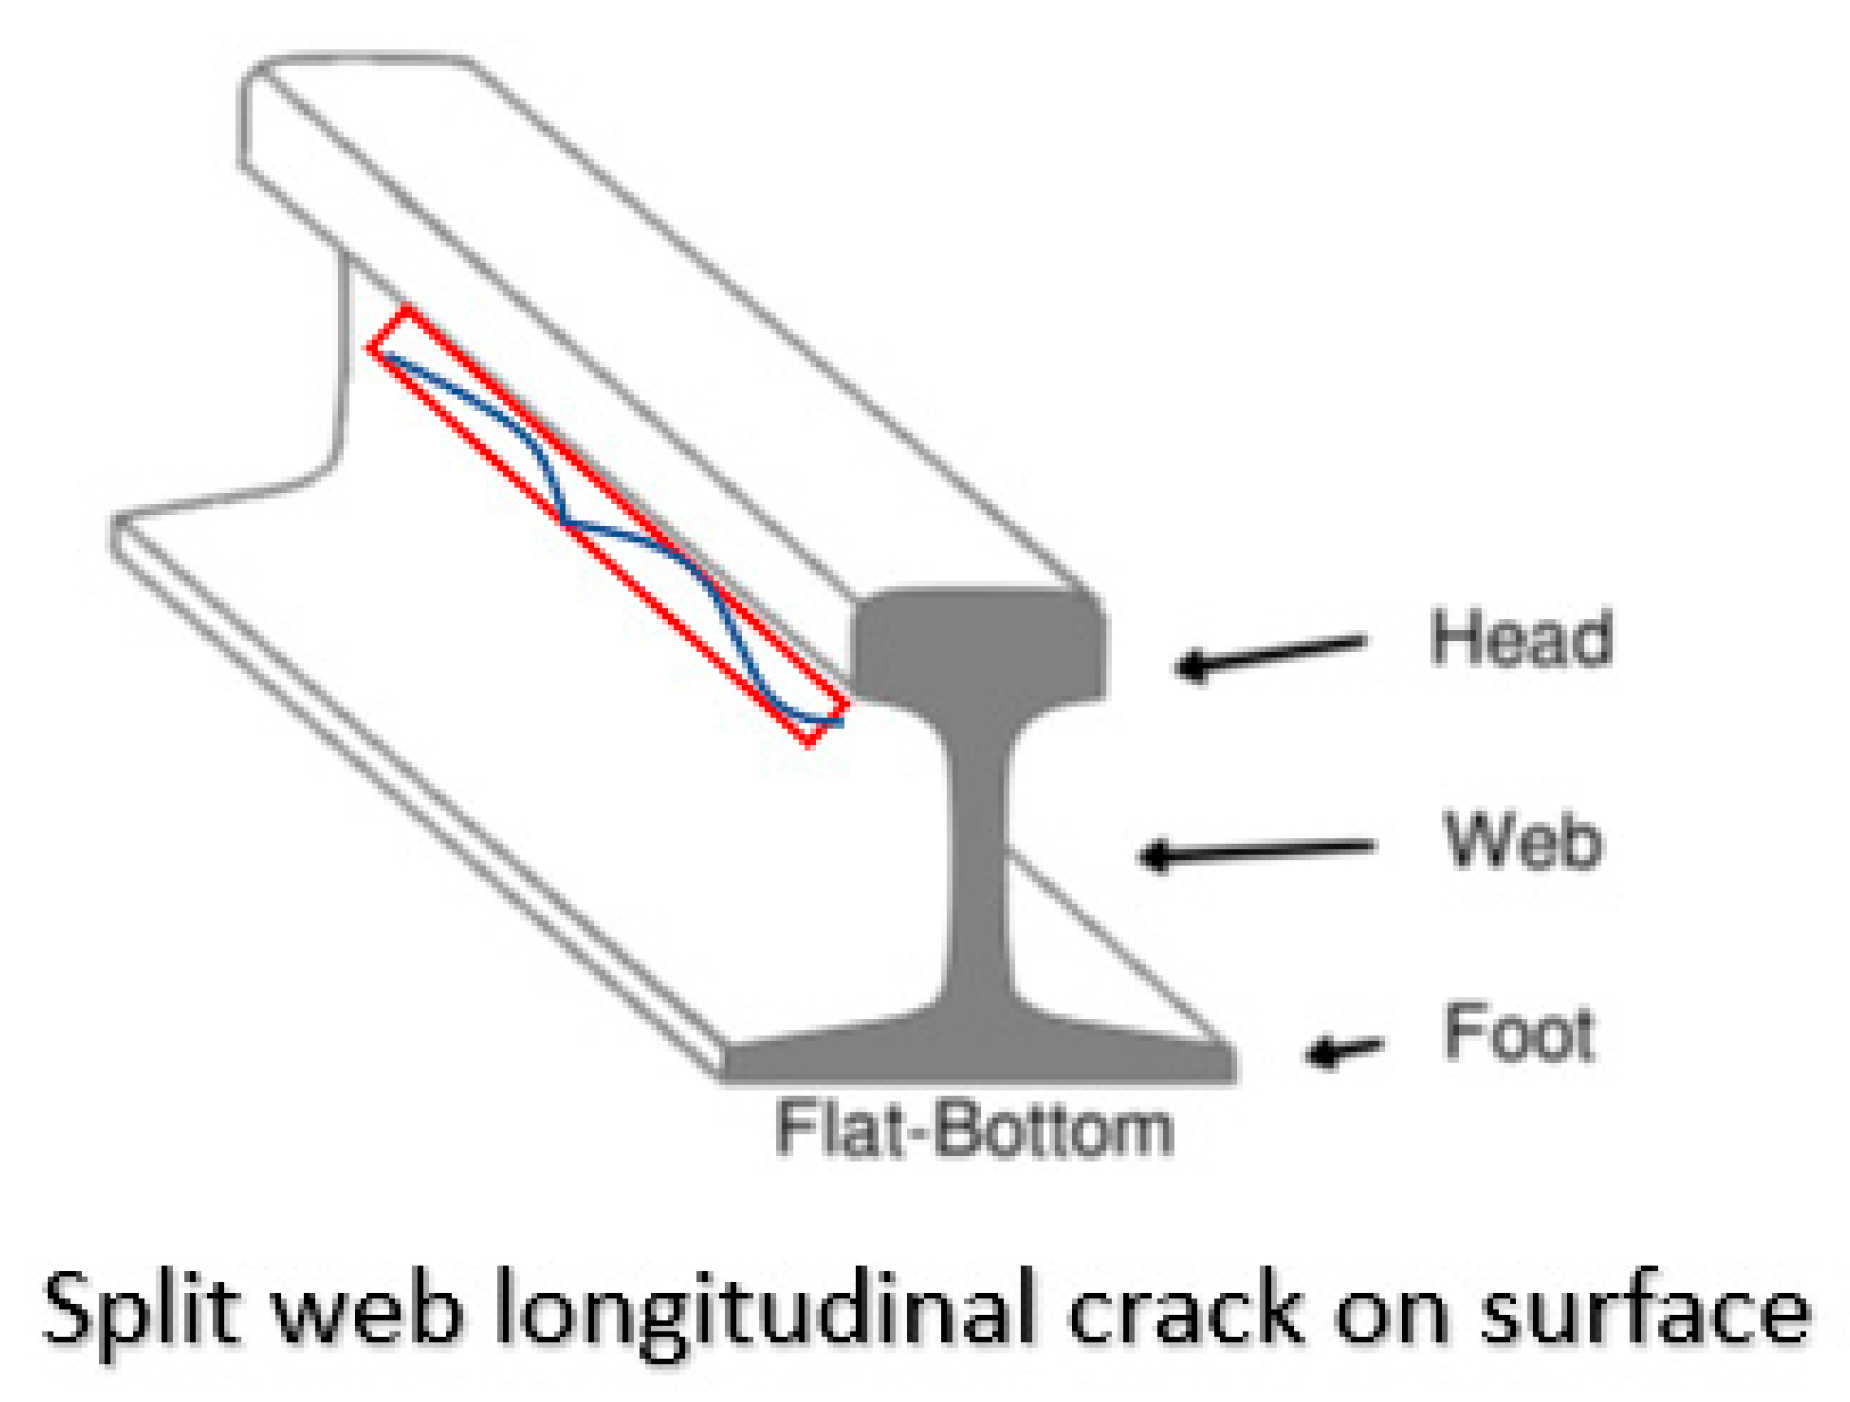
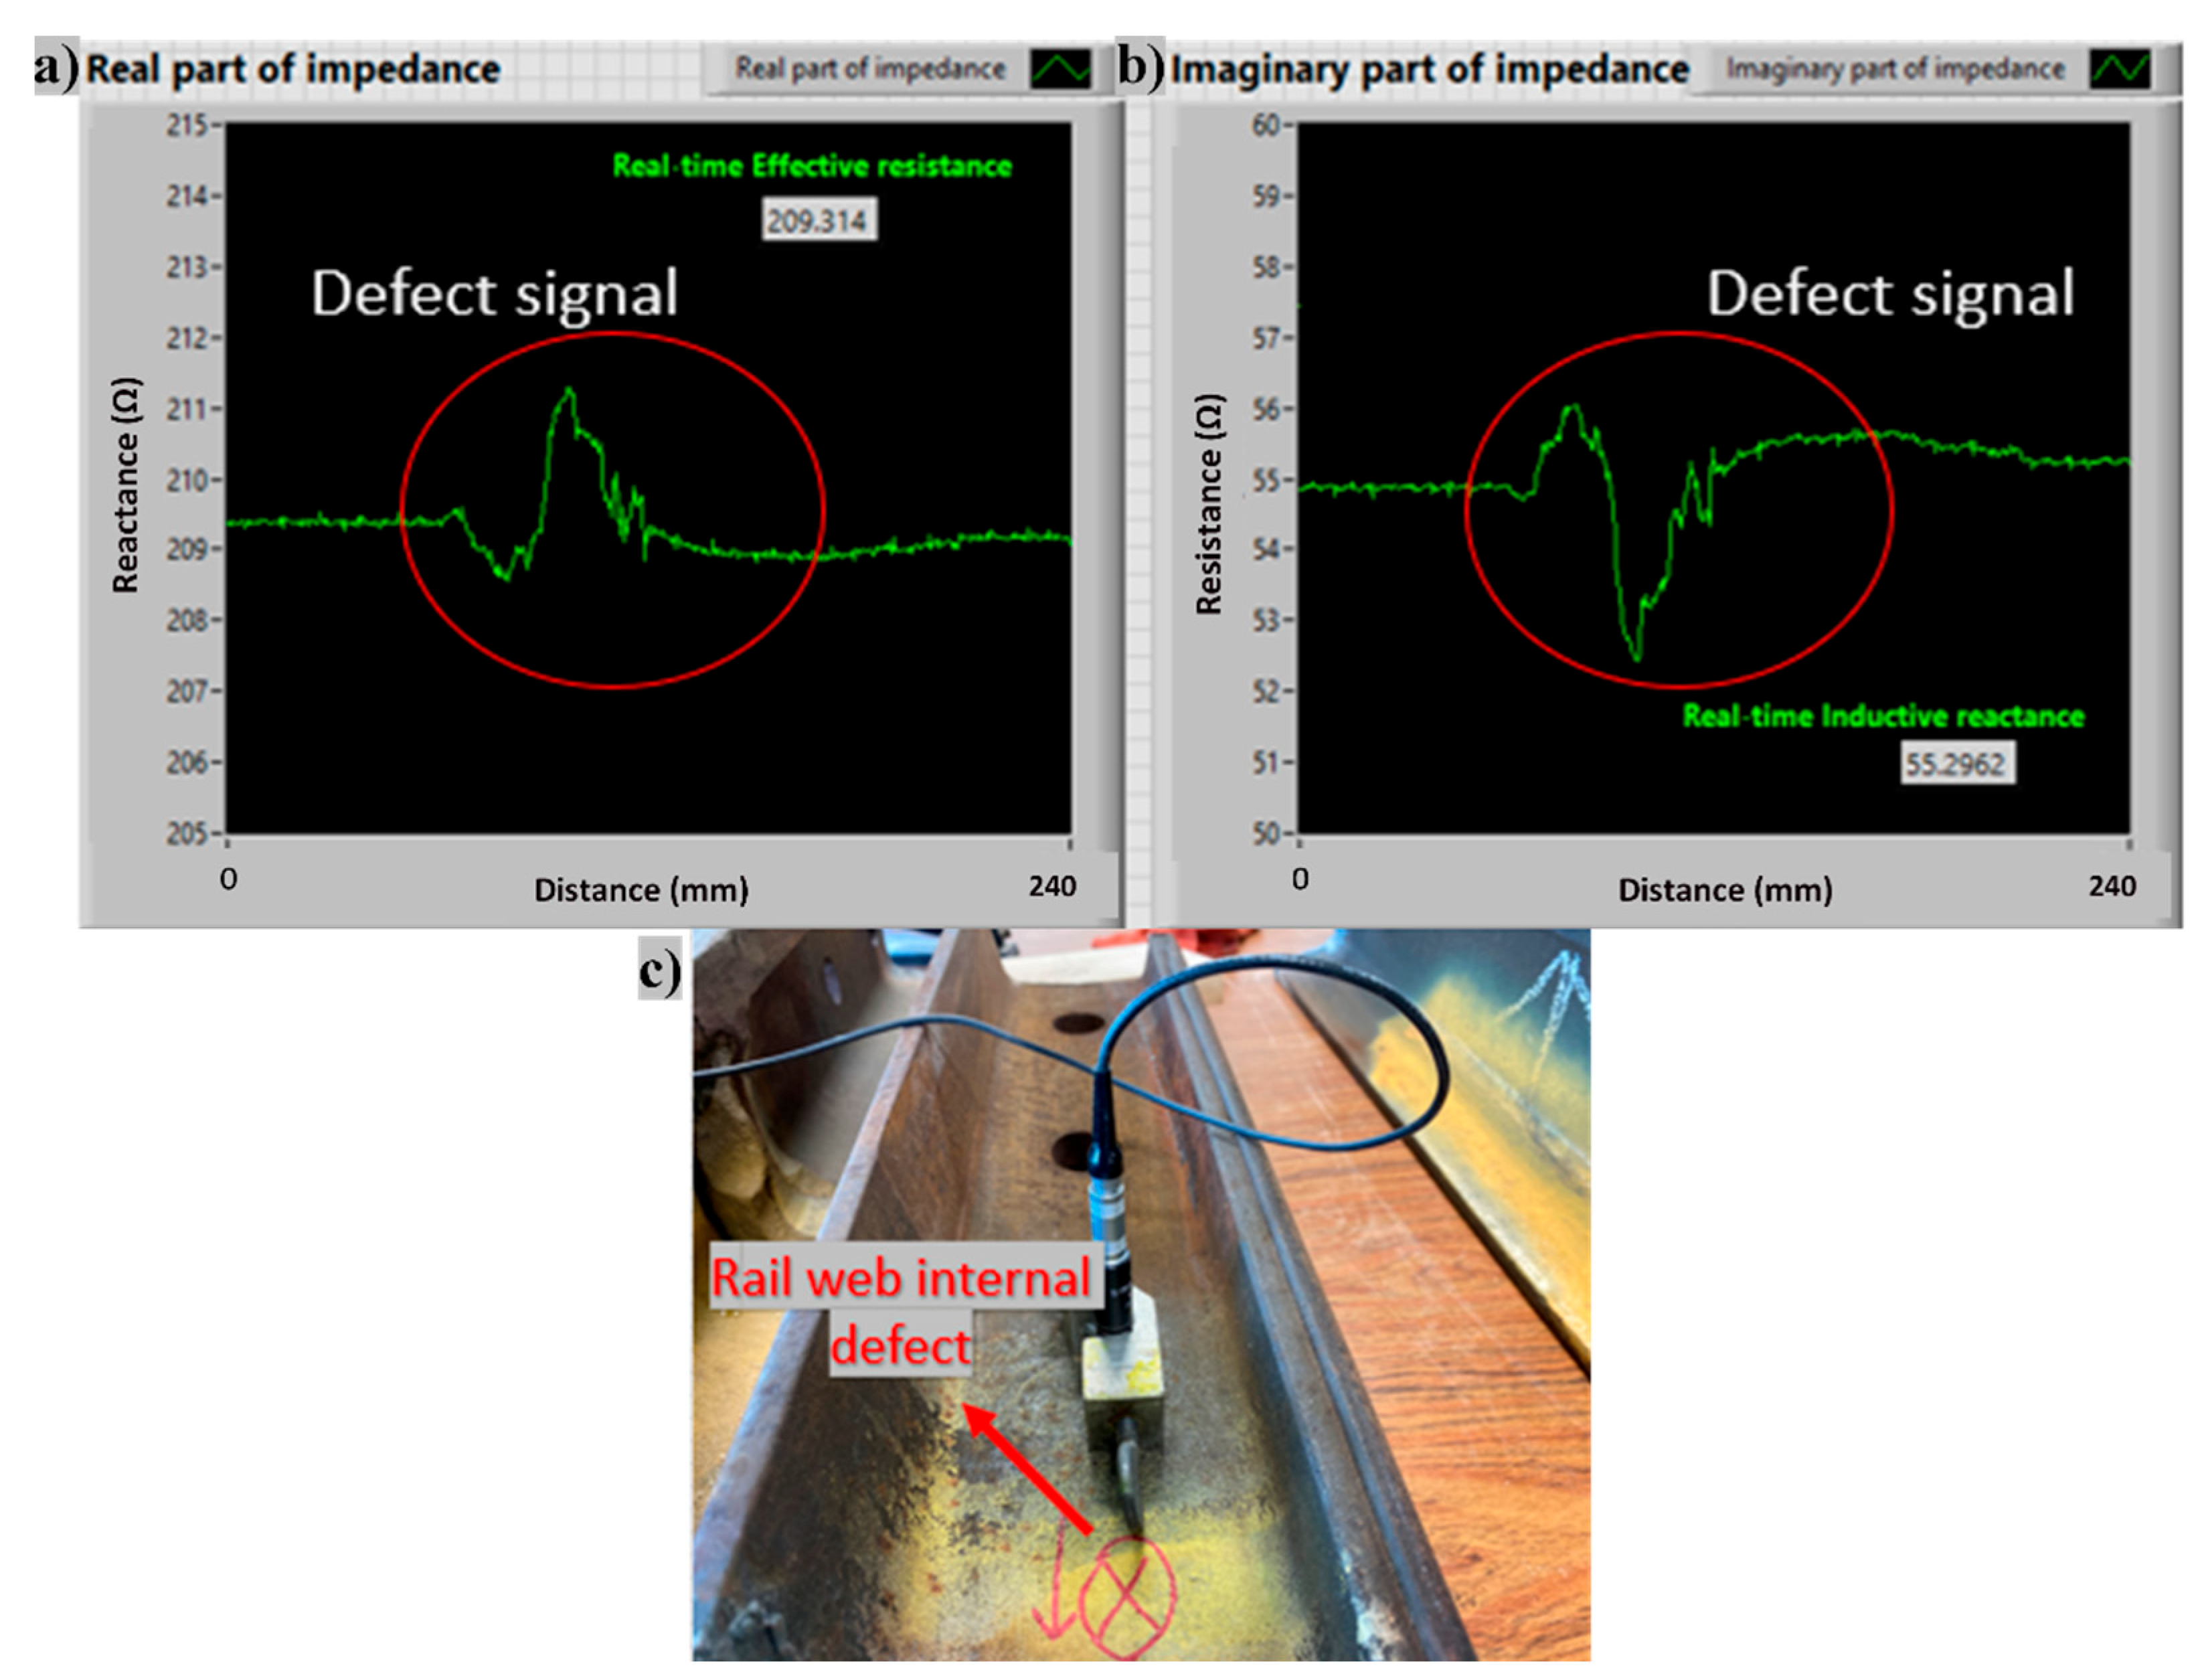
4.2.3. Surface Rail Web Defect

A longitudinal crack at the rail web was observed and detected by the EC system as shown in Figure 14. Four different locations were selected along the split web crack, where the visual observation cannot accurately distinguish the crack depth changes. The inspection results at four different locations are shown in Figure 15, and it can be seen that the signal magnitude represented different characterizations at different locations. The crack depth change can be reflected by the impedance changes among these four locations.
The normalized impedance plane was processed to compare the difference between four different crack locations, as shown in Figure 16. It can be observed that the normalized impedance was significantly different at each location. Based on the trend that was observed in the notched cracks and rail gauge corner crack, it can be estimated from the normalized impedance plane that the Crack Position 3 has the largest depth, while the Crack Position 2 has the smallest depth.

4.3. Detection on Surface Cracks of Rail Samples

It is well-known that subsurface defects are hard to locate by conventional EC systems due to relatively high excitation frequencies. Many studies have verified that the EC has the ability to detect subsurface defects as long as the defects are located in the range of an effective penetration depth [35]. Once the flaw exists in the subsurface zone of the rail, the induced eddy current is disturbed and the impedance of the coil is affected [36]. Our developed EC system had a low excitation frequency of 5 kHz. It has been illustrated before that the effective penetration depth at 5 kHz is about 17 mm for steel material. All the subsurface defects in the depth of less than 17 mm below the rail surface could possibly be found by the developed system. Thus, the capability of the established system for measuring near-surface subsurface defects in rail samples was conducted.

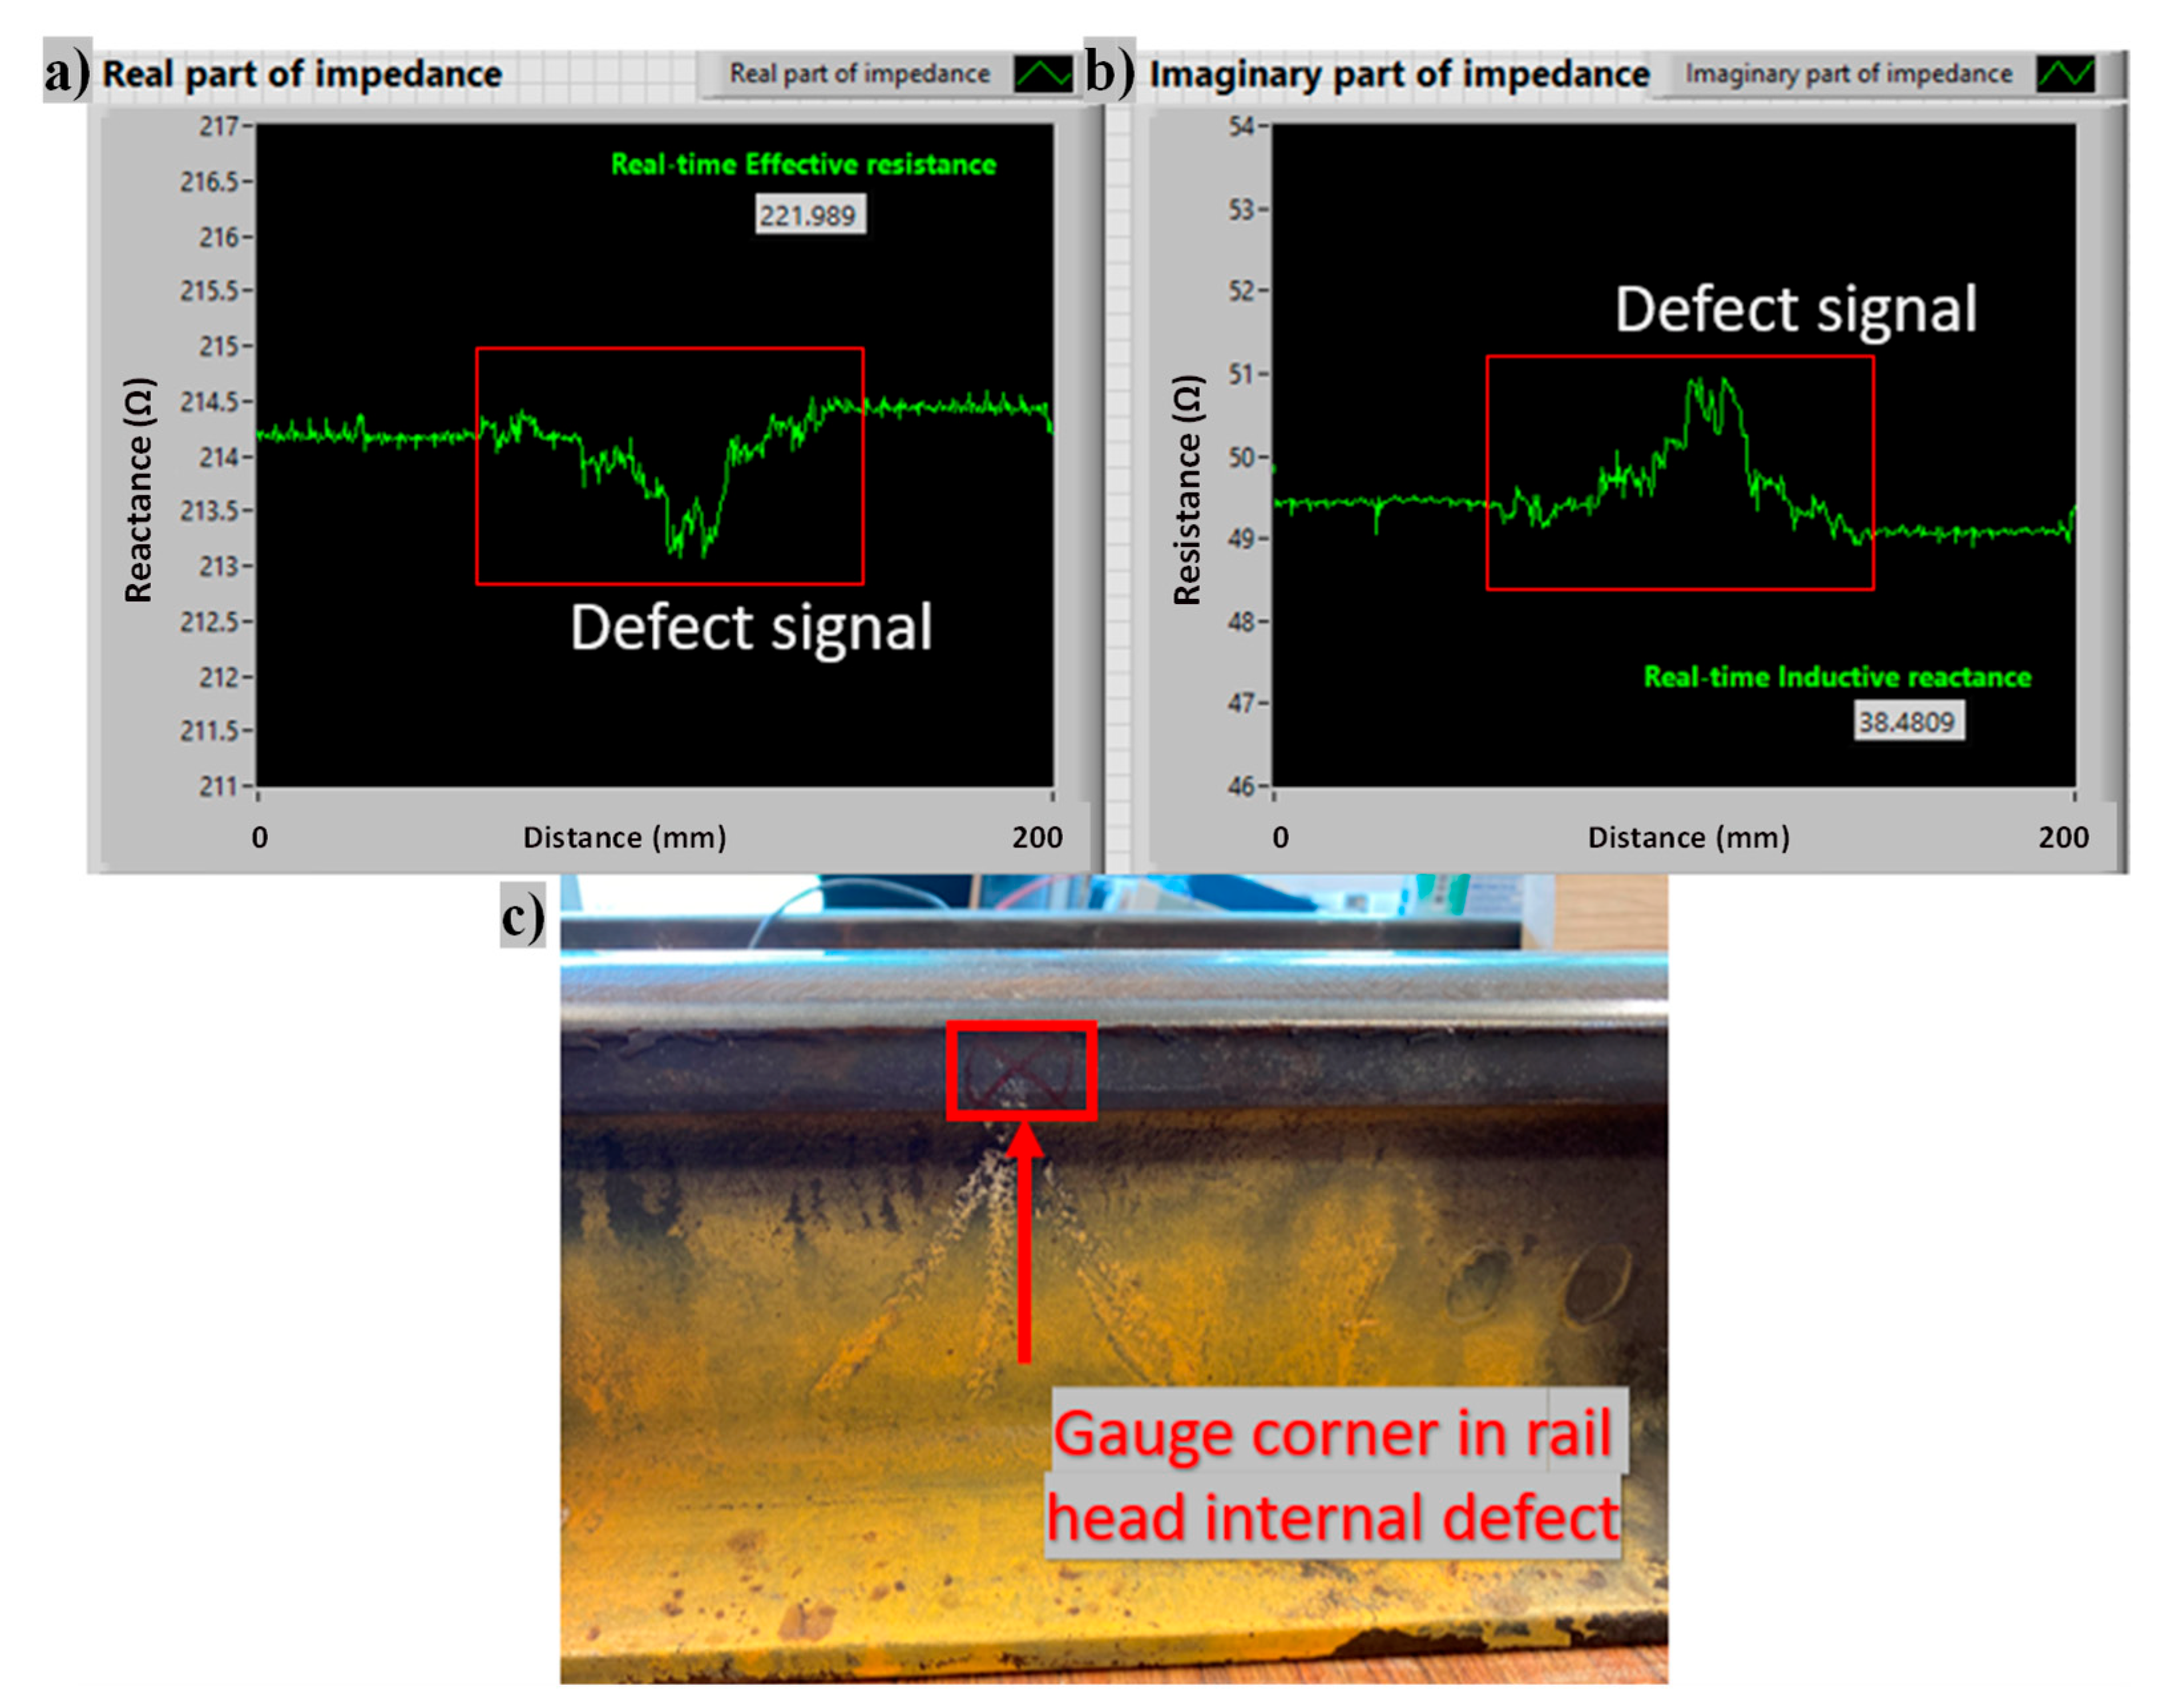
4.3.1. Subsurface Defect at Rail Head

The subsurface rail head defect was observed and detected in this investigation by the established EC system. As shown in Figure 17, the location of the detected rail head subsurface defect was illustrated in the red circle. Based on visual inspection, it is assumed that this was caused by material changes due to weld processing at a near location.
The defect in the rail sample from the CN railway had been detected by the ultrasonic device before and labeled with yellow paint, which indicated subsurface defects, as shown in Figure 17. The signal showed three magnitude peaks (two larger peaks on two sides, one smaller peak in the center) when the sensor passed through the subsurface defect area on the rail head, which indicated the position of the subsurface defect and the geometry changes inside the subsurface defect.

4.3.2. Subsurface Defect at Gauge Corner

Besides the rail head subsurface defect, a subsurface defect signal was also observed at the gauge corner of a rail sample as shown in Figure 18. The signal magnitude shows an obvious jump when the sensor head experienced the suspected subsurface defect location. The defect signal suggests a subsurface flaw within the range of the effective penetration depth.

4.3.3. Subsurface Defect at Gauge Corner

A subsurface defect at the rail web was also discovered, as illustrated in Figure 19. It can be observed that the signal magnitude changes and the waveform shows distinct behavior when compared with that of other types of defects.
From these measurements on subsurface defects, it can be found that both the real part and imaginary part of the impedance were changed when the sensor passed the subsurface flaw. The real part of the impedance signal represents a magnitude difference between 0.5–2.0 Ω, whereas the imaginary part of the impedance signal represents a magnitude difference between 1.0–2.5 Ω.

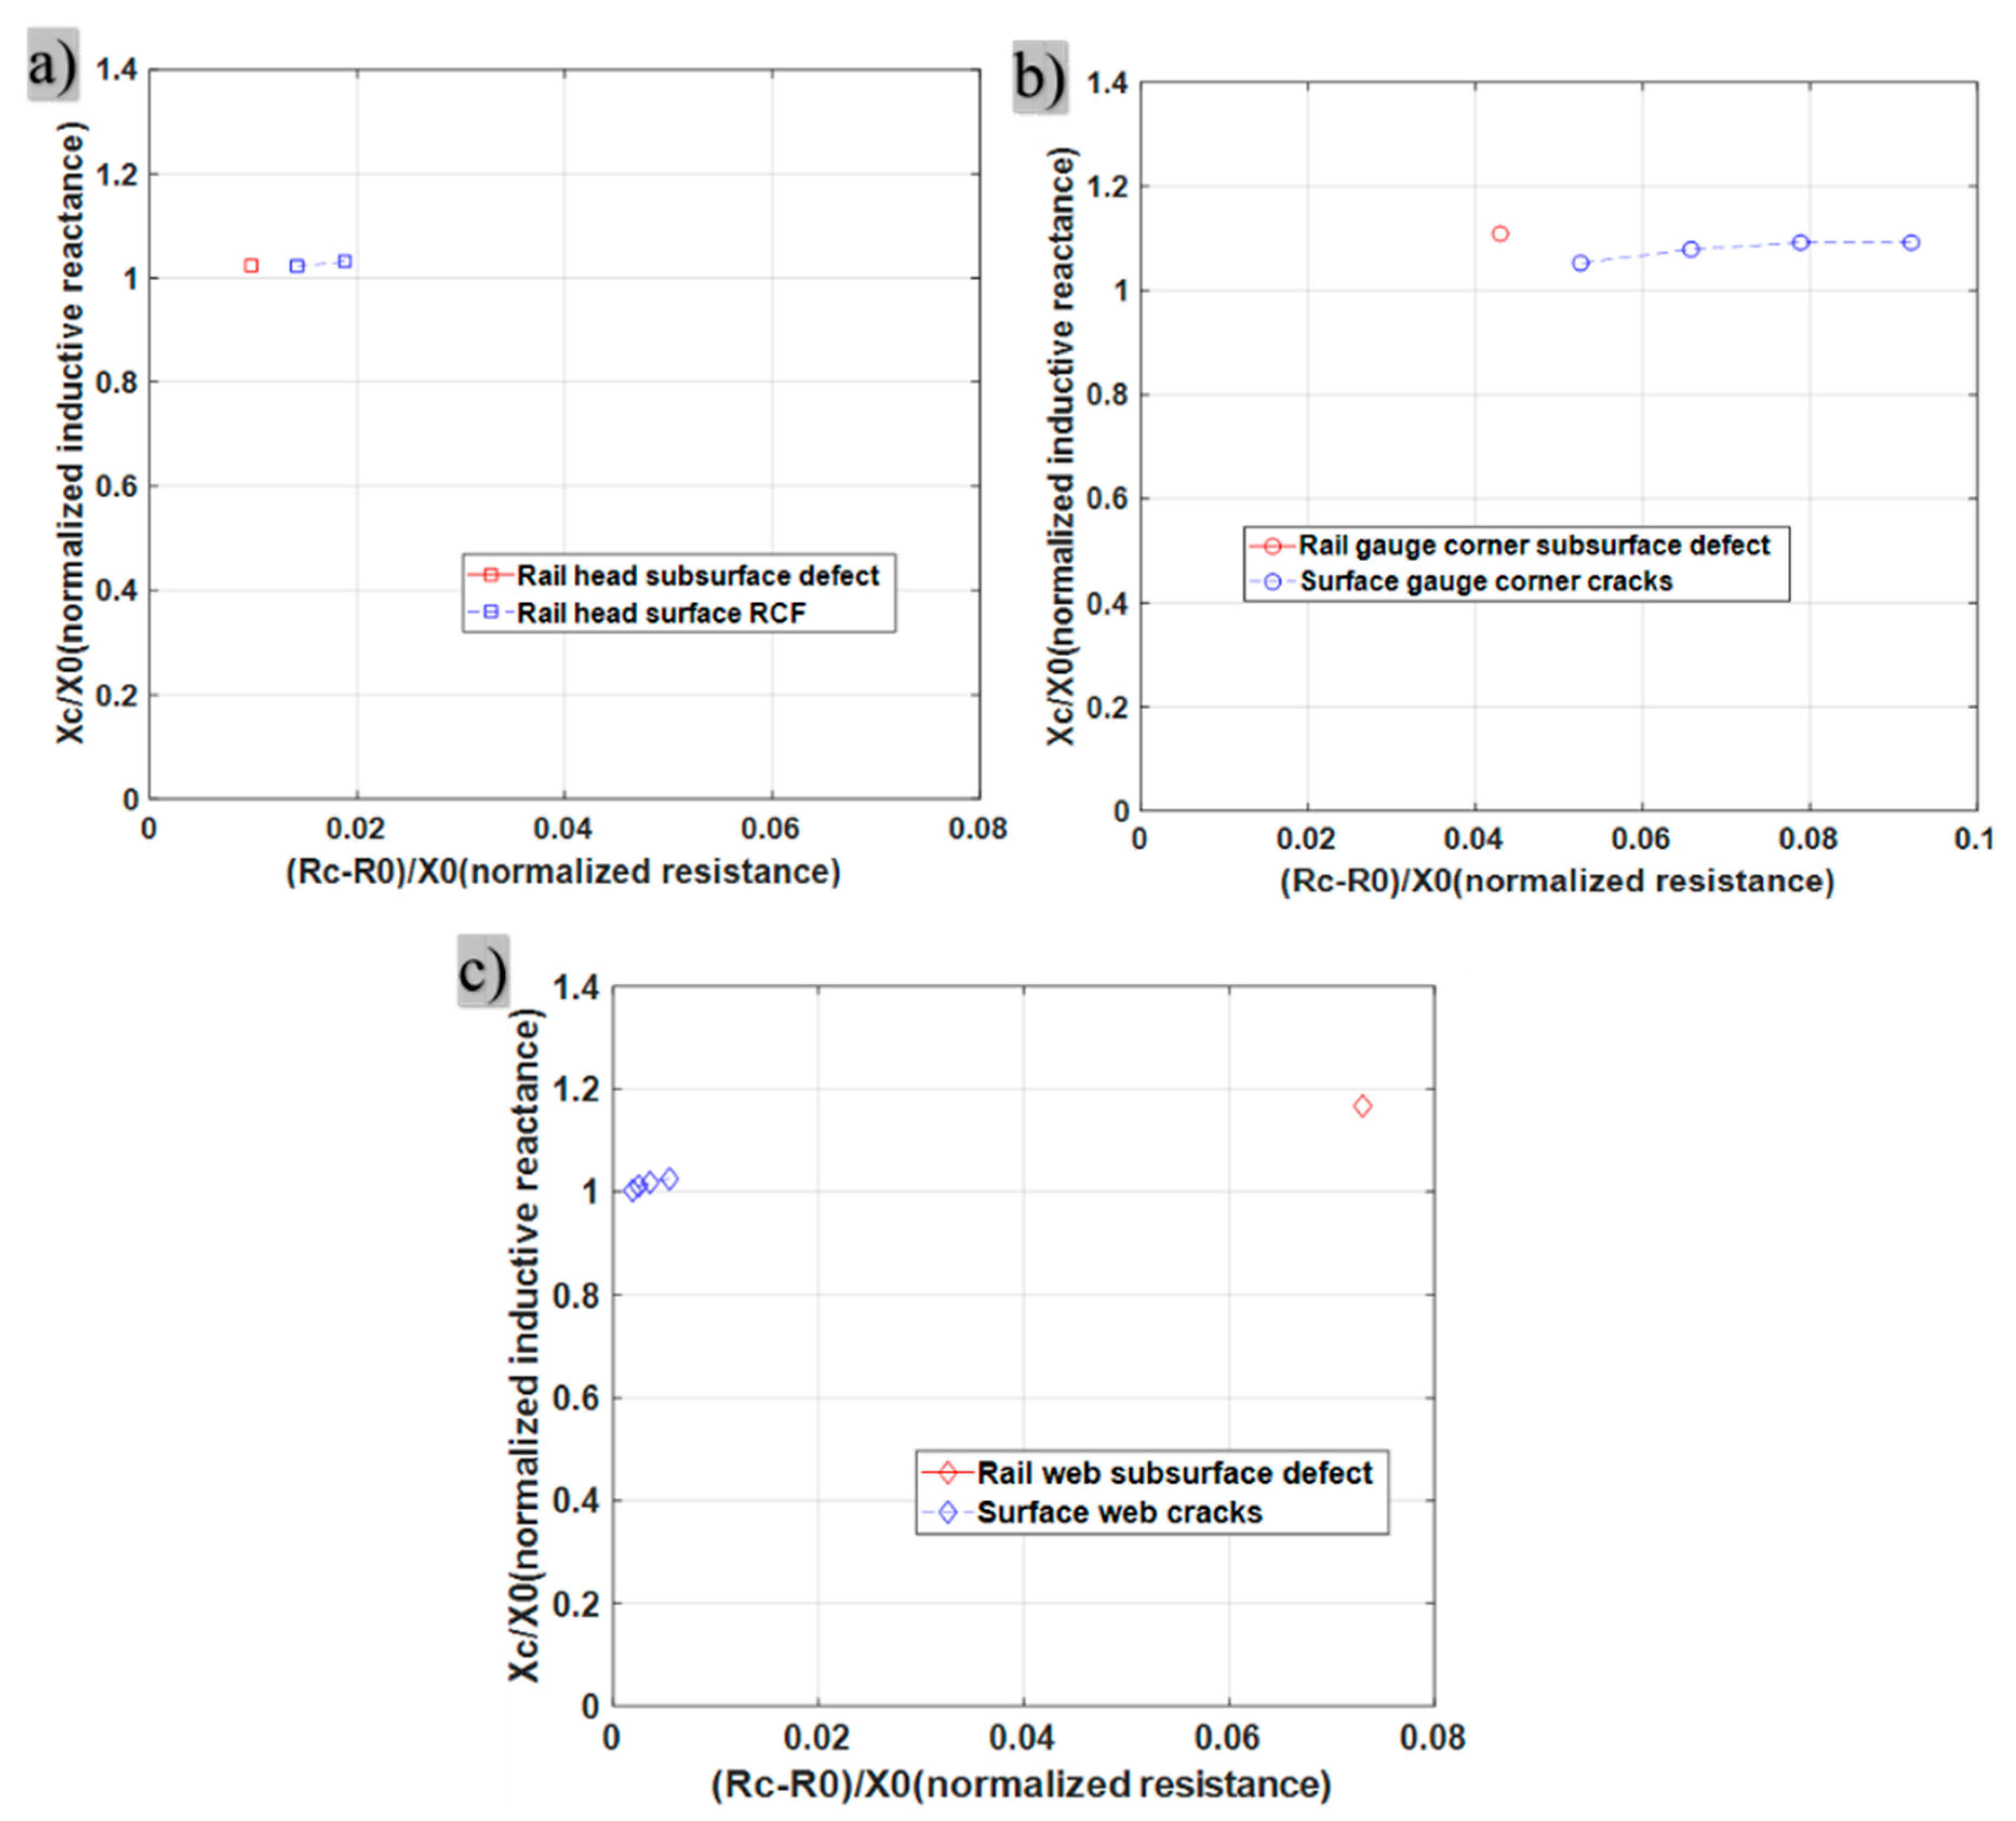
4.4. Distinguish of EC Signals for Subsurface and Surface Defects

The normalized impedance of surface and subsurface defect signals was first compared in the rail head, as shown in Figure 20a. At the rail head, the subsurface defect represented a decreased normalized resistance ( R c n ) than that of the rail head surface RCF, while the normalized reactance ( X c n ) is almost the same as that of the RCF. Similarly, as shown in Figure 20b, the normalized impedance of surface and subsurface defects in the gauge corner were compared. The subsurface gauge corner defect generated a reduced R c n and a slightly increased X c n compared to that of the surface gauge corner crack. These results indicate that the subsurface crack can contribute to the inductance. Since the EC signal is very sensitive to the surface layer, the surface geometry and smoothness of measured samples can also affect the impedance resistance changes.
The normalized impedance of surface and subsurface defect signals was demonstrated in the rail web, as shown in Figure 20c. The subsurface detection results show a larger R c n on the normalized impedance when compared to that of the web surface defect. In addition, the X c n of the subsurface defect was larger than the web surface defect. These defect signals also demonstrate that the subsurface defects can slightly increase the inductive reactance. However, the signal difference was more obvious in the rail web section, which may also be affected by the surface smoothness and welding at the web section, since the surface condition of the web section is generally not as consistent as that of the rail head and gauge corner.

5. Conclusions

Laboratory tests were used to demonstrate the crack identification ability of the developed EC system. Both machined steel blocks and rail samples with typical defects were investigated. The main conclusions can be summarized as follows:
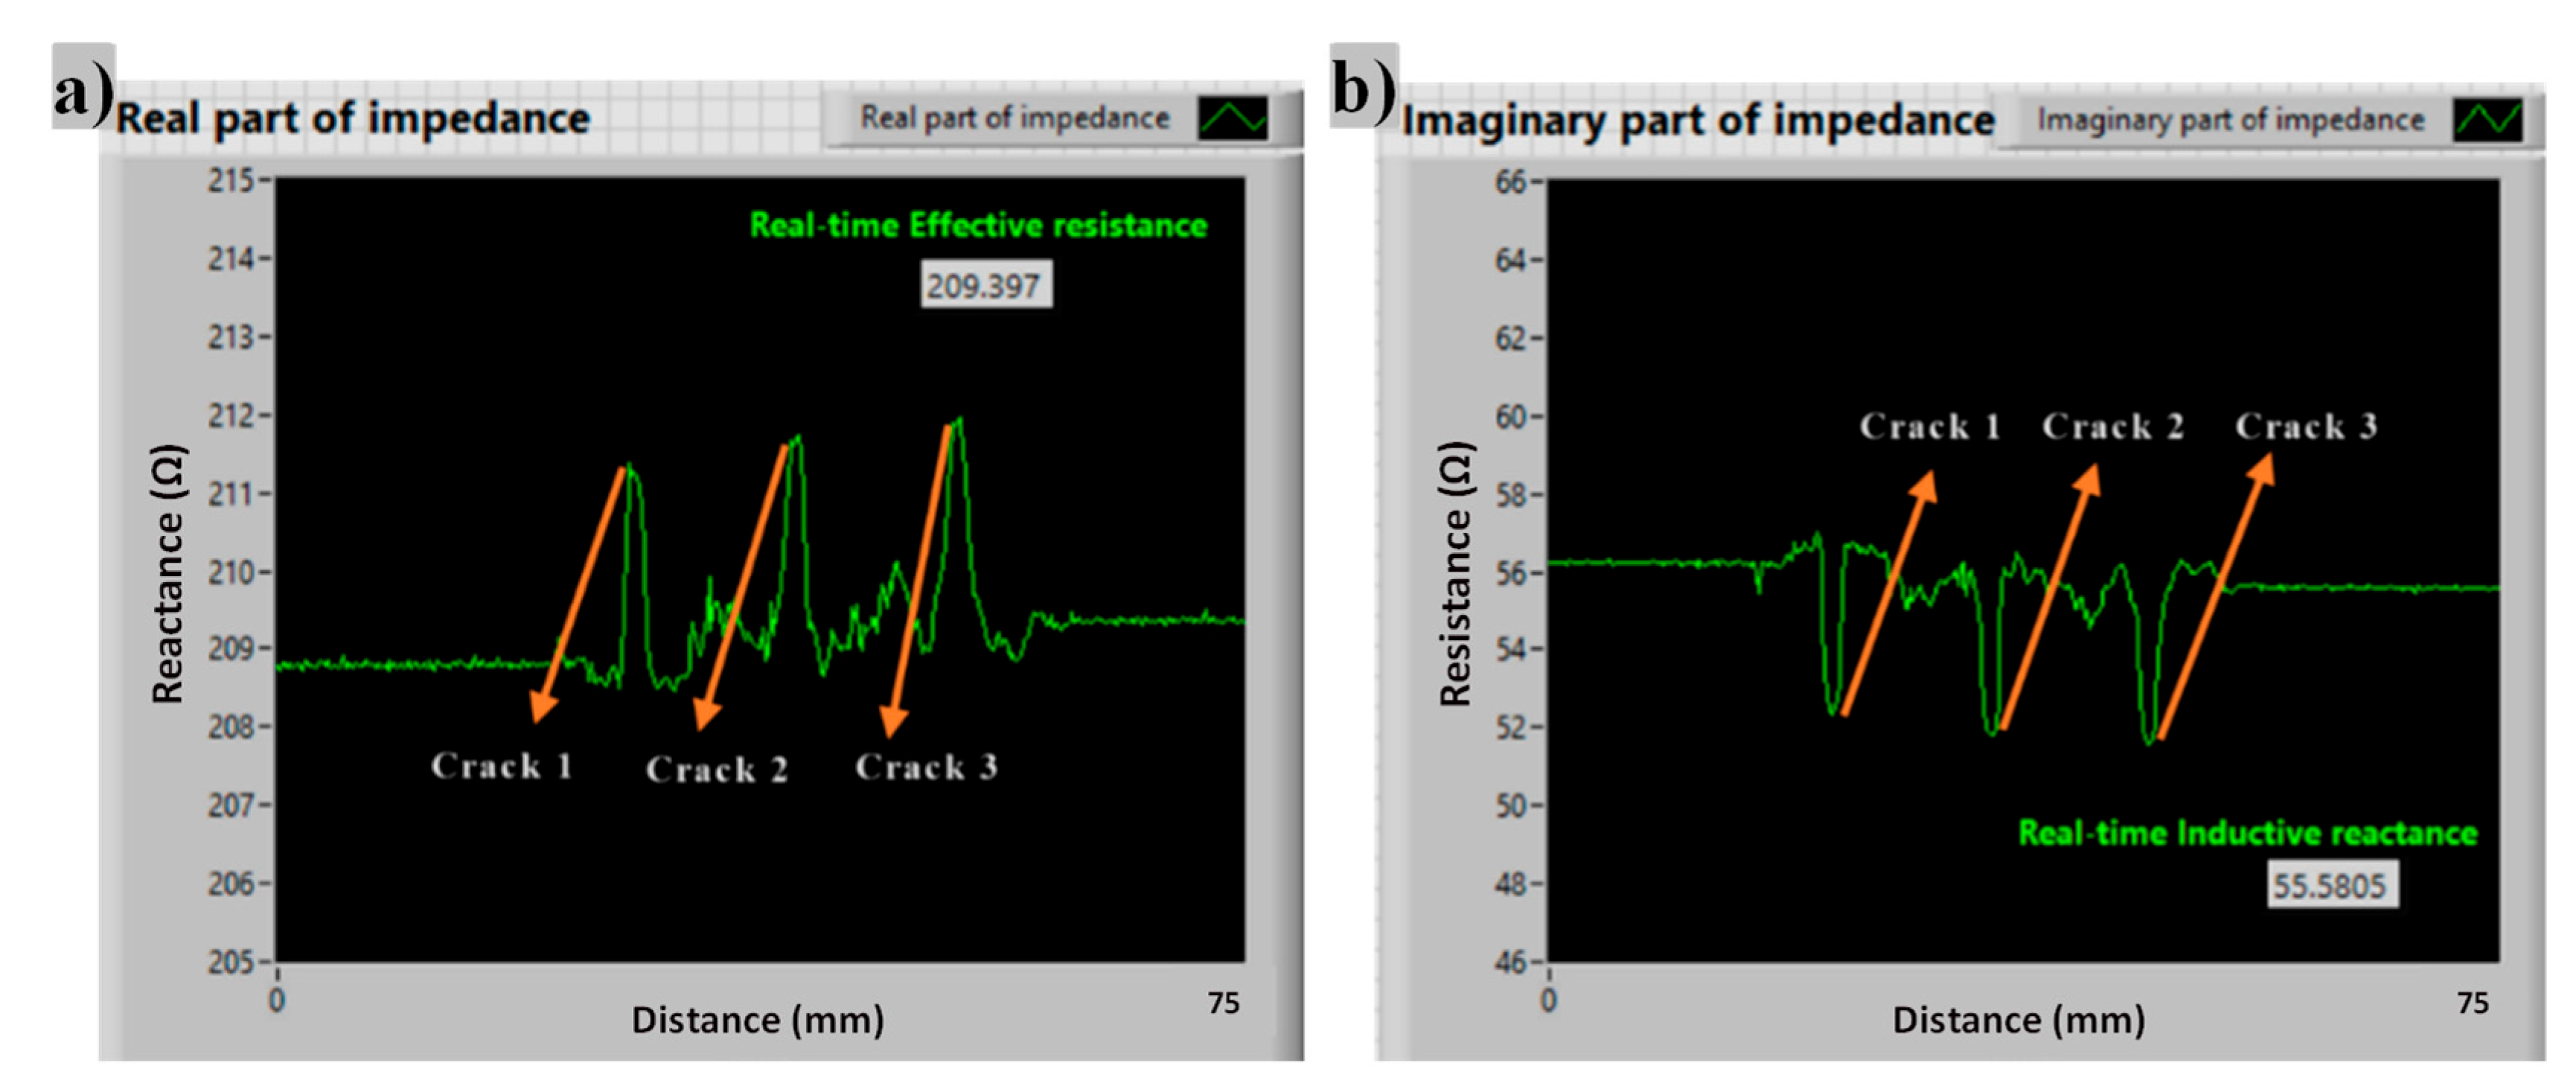
  • The expandable EC system was successfully established with the proposed circuit design and FFT algorithm in LabVIEW platform. The real-time impedance including the induction reactance and induction resistance signals of the EC probe were simultaneously obtained during the sensor movement, which can be further developed and utilized for specific detections.
  • The notched crack depth or angle changes can be represented by the sensor impedance changes with the integrated hardware and software system. The impedance magnitude and phase plots showed a consistent trend with the changed crack depths and sizes in machined samples. Both the normalized induction resistance Rcn and induction reactance Xcn were increased with crack severity.
  • The normalized impedance Zcn value was reduced by about 0.082, 0.089, and 0.109 when the notched crack depth changed to 4 mm, 8 mm, and 12 mm from the flawless surface, respectively. When the notched crack angle increased to 15 degrees, 45 degrees, 75 degrees, and 90 degrees, the Zcn value was reduced by 0.061, 0.082, 0.143, and 0.162 from the flawless surface, respectively.
  • The 15-degree crack generated the most considerable effect on the normalized impedance. When the crack direction approached the detection surface, more induced eddy currents were obstructed by the crack, generating greater effects on the impedance, since eddy current intensity decreases with depth.
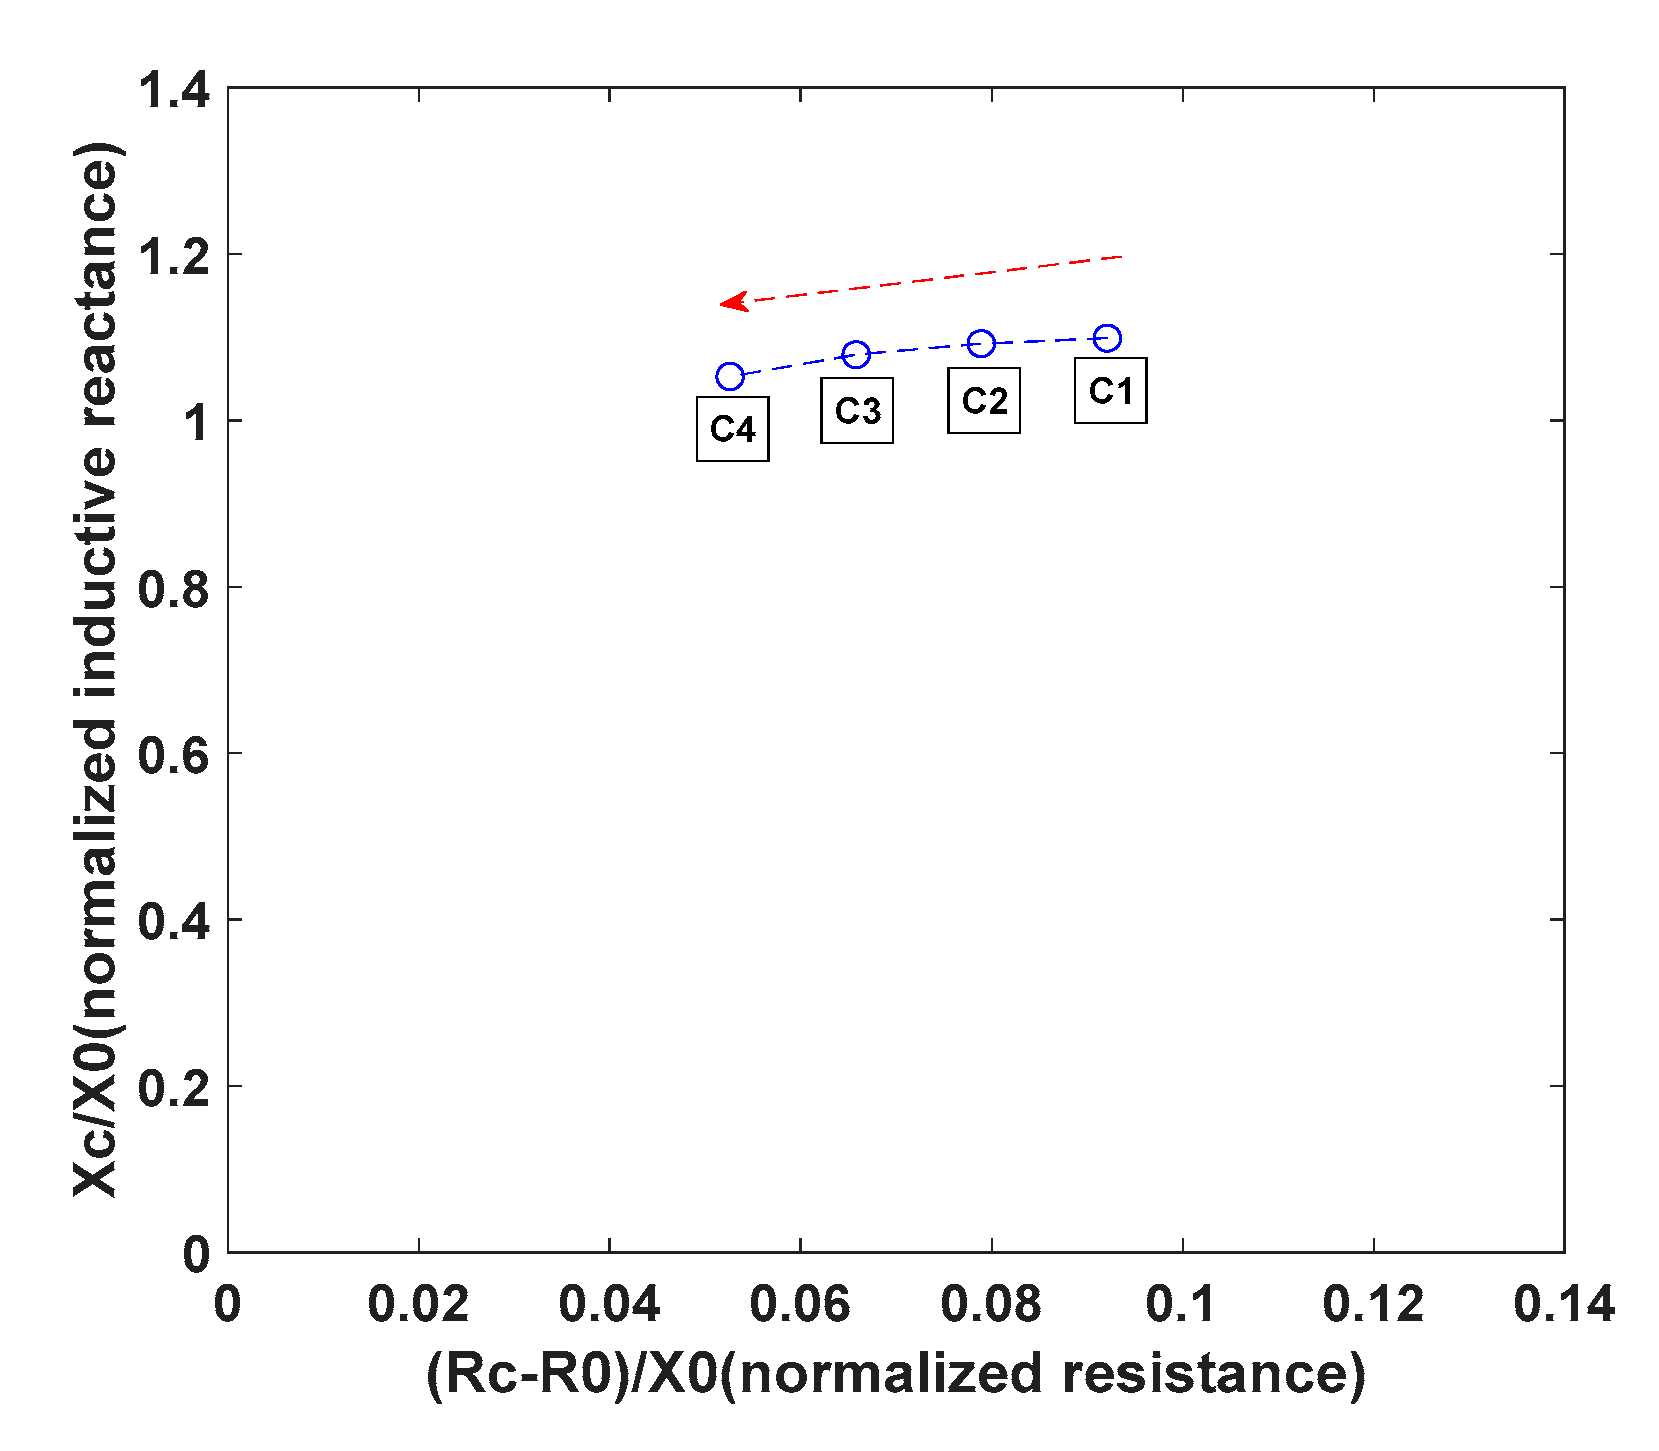
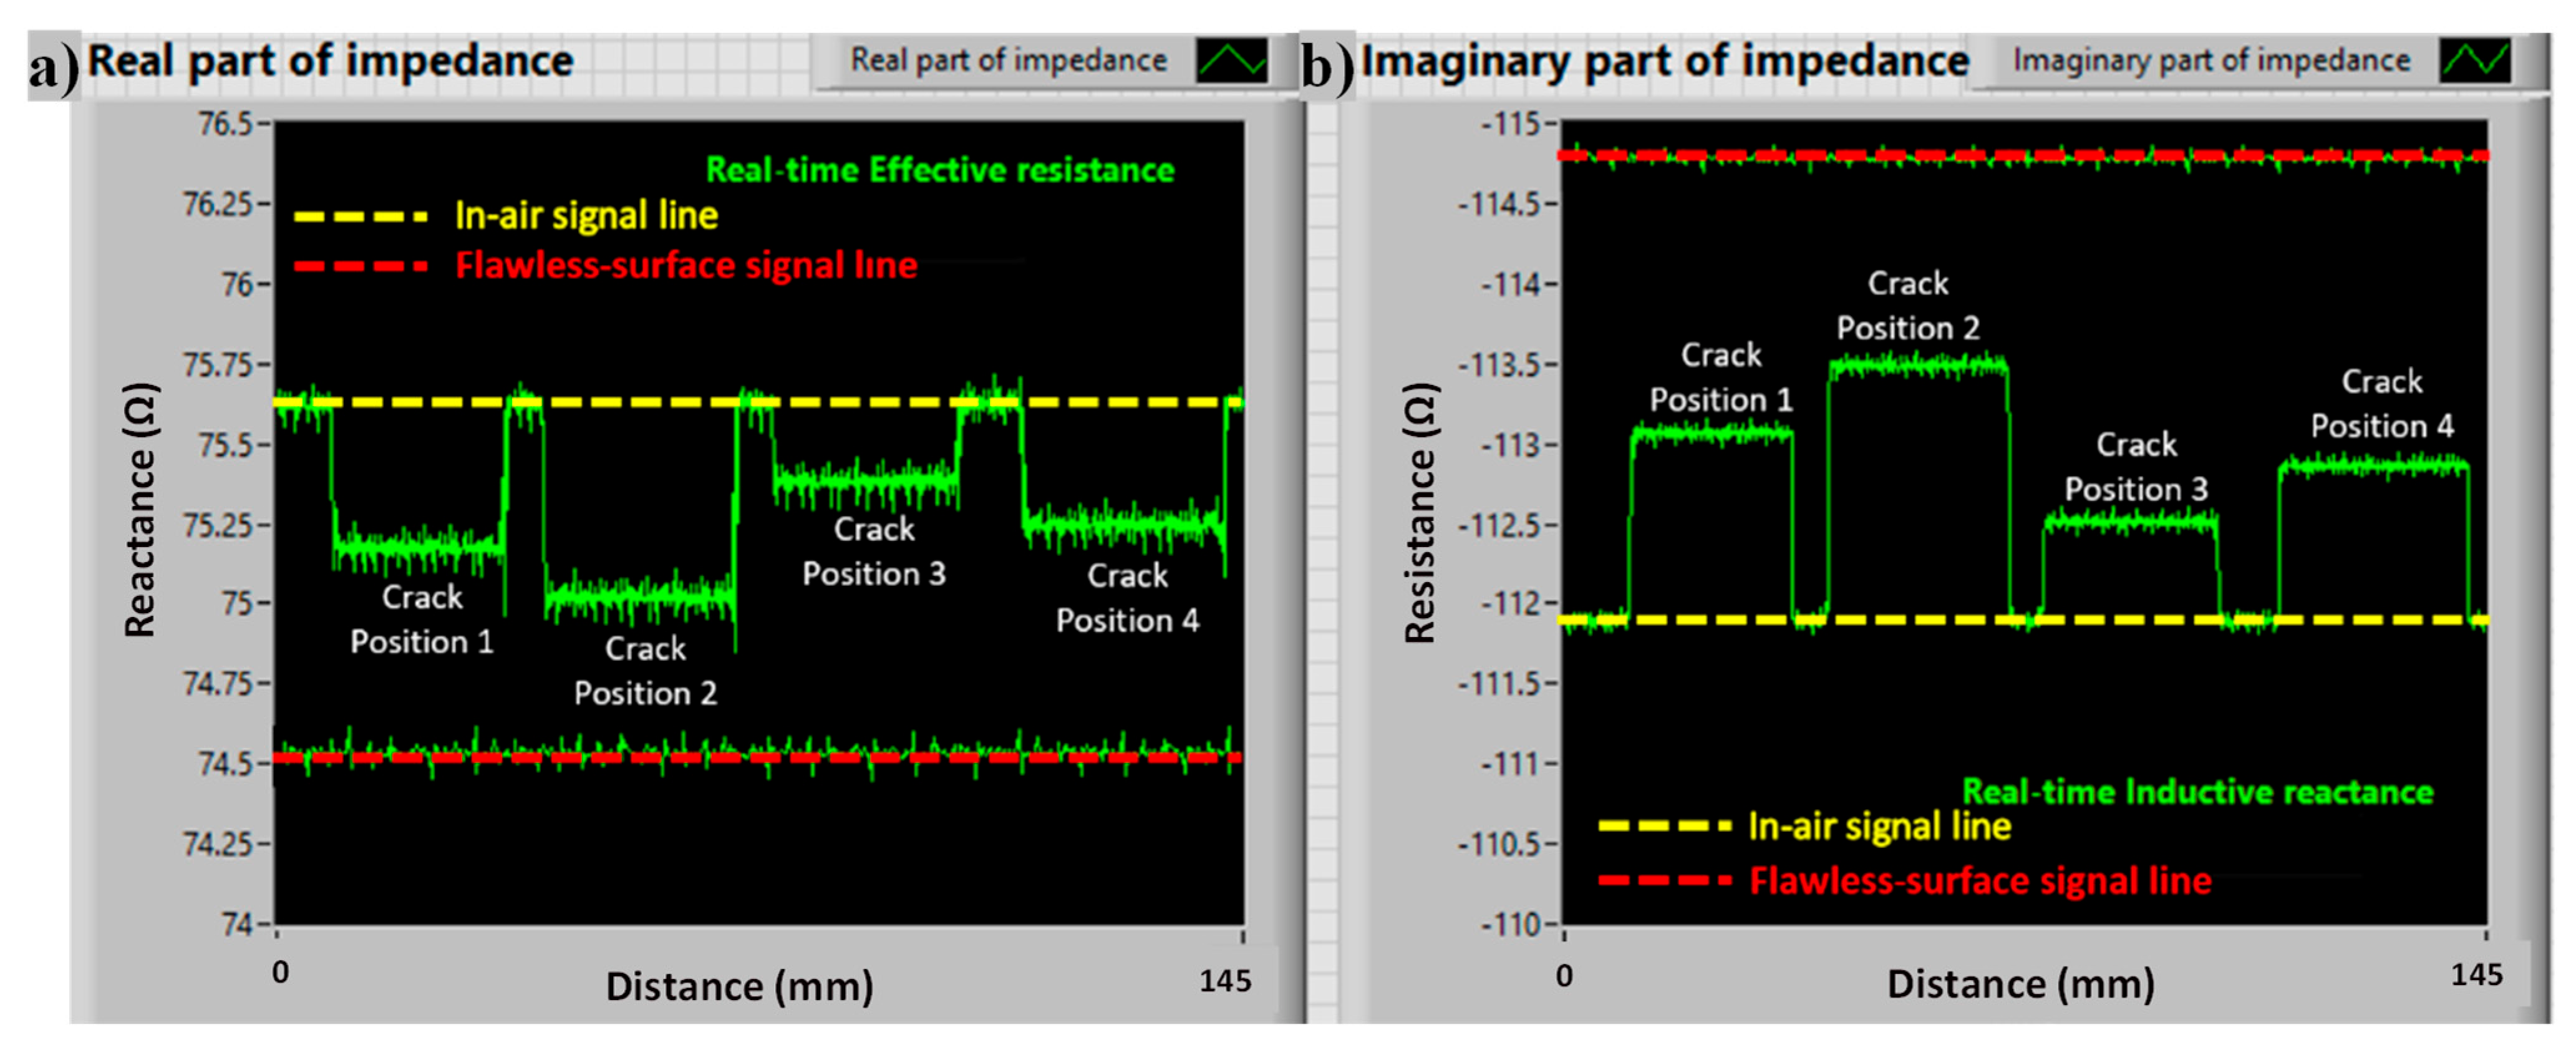
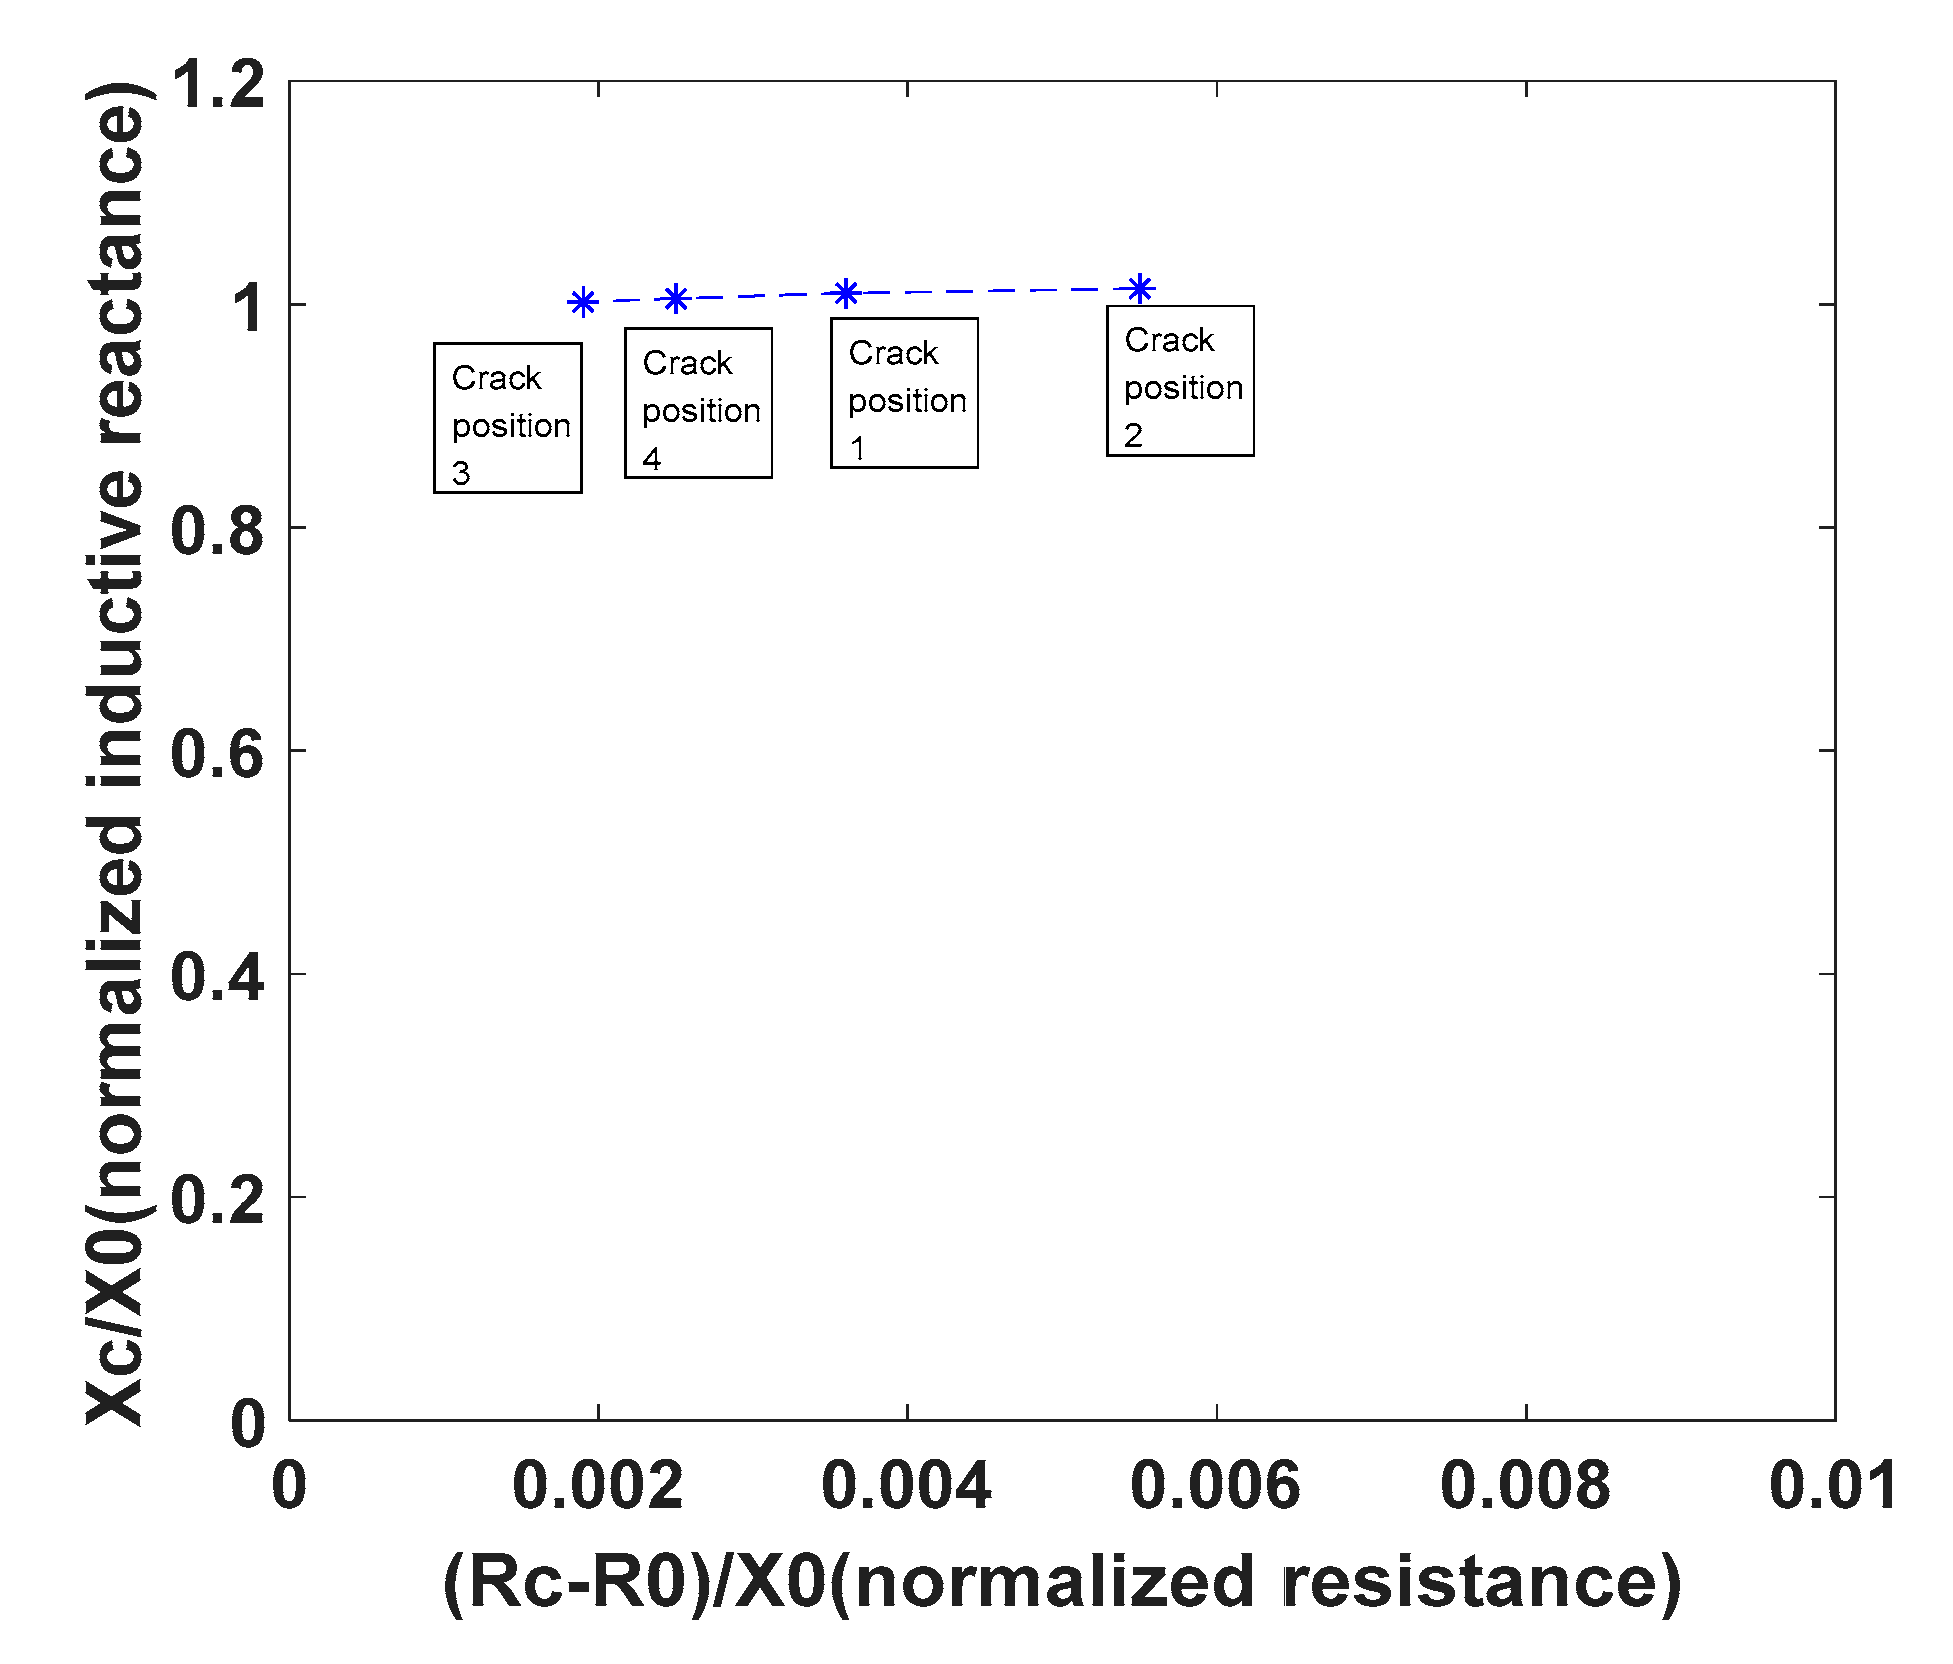
  • The real-time reactance and resistance were sensitive to the crack geometry changes as shown in the rail surface defect inspection, especially the resistance. The change of resistance varied from 0.5 to 2.6 on different crack types. It can be summarized that the normalized inductive reactance and inductive resistance were reduced with increasing crack width and depth. The normalized inductive reactance was reduced from 1.15 to 1.12 with the severity of the gauge corner surface crack changed.
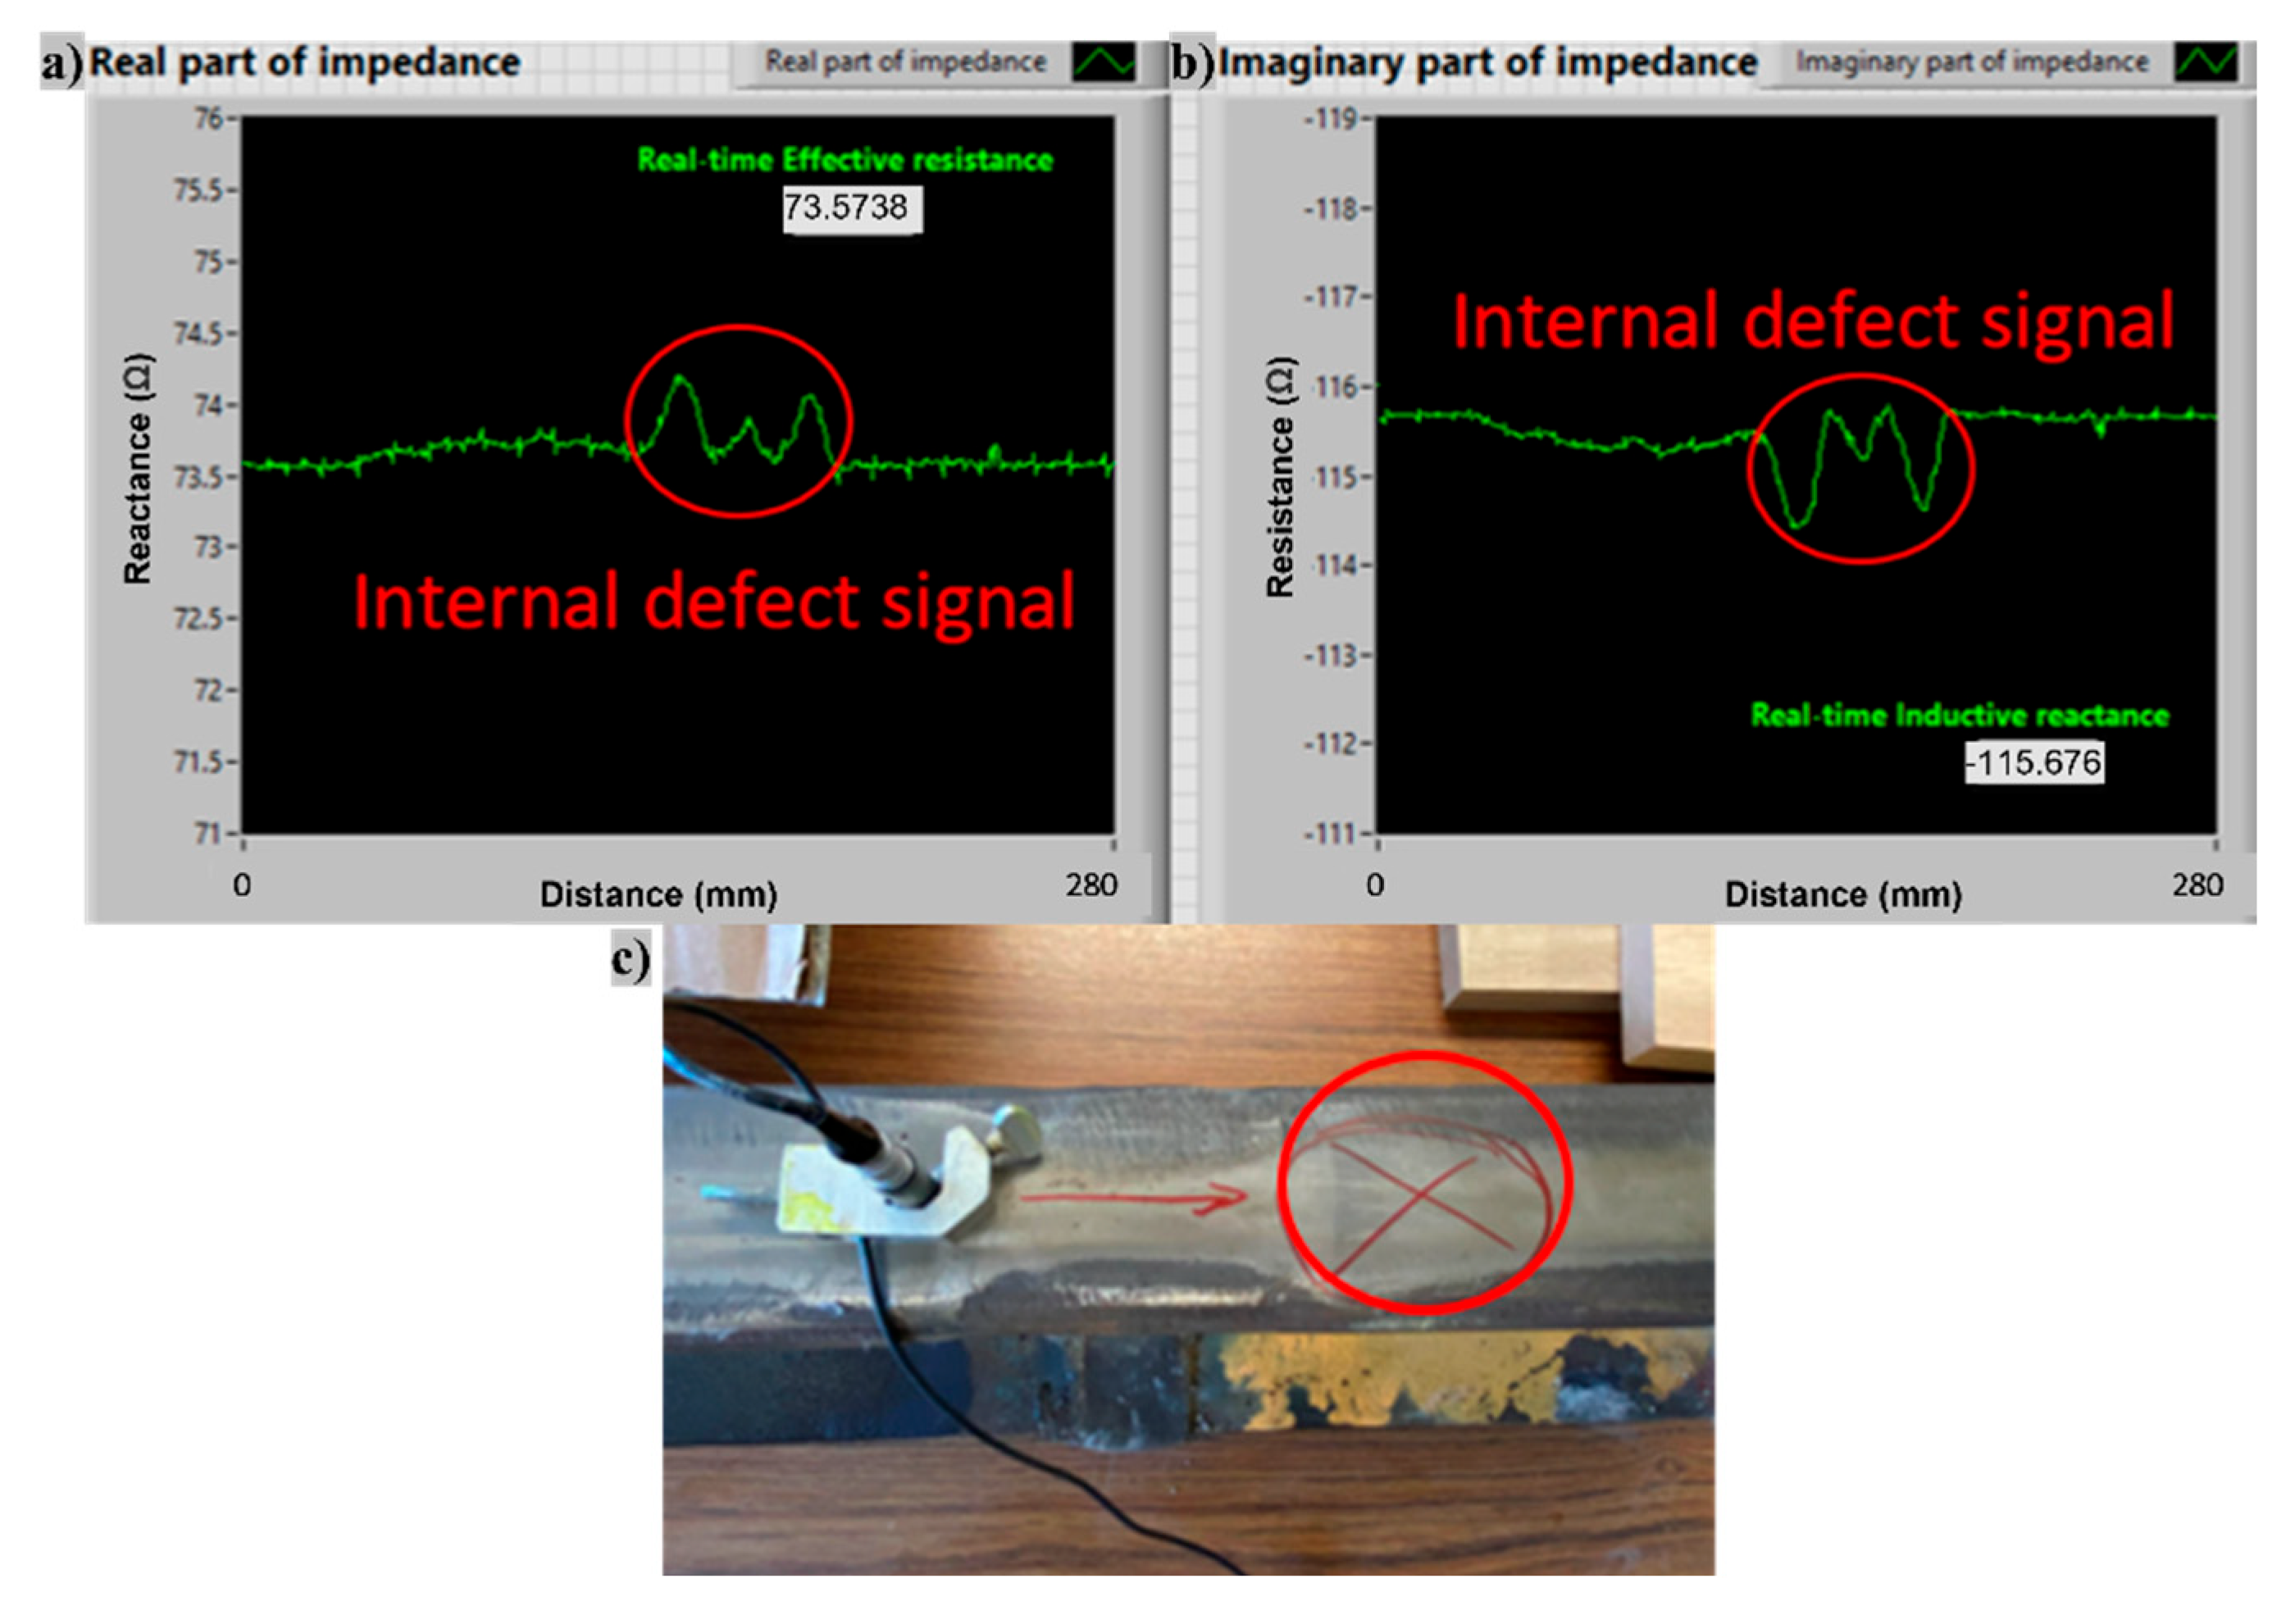
  • The subsurface defects were detected in the rail head, gauge corner, and rail web and their impedance phase plots were compared. The signal impedance resistance was affected more significantly by the surface texture and shapes. The signal inductive reactance of subsurface defects increased at different levels compared with that of surface defects. The phase comparison between surface and subsurface defects at different rail sections indicated the measurement results were affected by defect locations, surface shape, and textures.
Overall, the developed EC detection system achieved an adequate sensitivity for different defects when considering defect severity and geometry changes. Based on the results, the proposed LabVIEW platform and MATLAB post-processing codes could be used for real-time signal collection and crack severity identification, which could contribute to a sustainable rail health monitoring protocol.

6. Future Works

From this investigation, the notched cracks in steel samples and the surface and subsurface defects in rail samples were measured based on the expandable real-time EC inspection system. Recommendations for the future study include:
  • Subsurface defects can be detected with the improved EC system with a relatively large effective penetration depth at rail head, rail gauge corner, and rail web. In addition, the normalized impedance showed distinct characterizations compared with that of surface cracks at different locations. The comparison should be conducted within the rail section with similar flawless surface conditions. Some known steel samples will be collected to test the subsurface defects with the system. These results can potentially be used for the validation of subsurface defect detection.
  • The distance between the sensor and the measuring surface needs to be investigated with different excitation amplifier voltages. Even though the penetration depth is constant when the excitation voltage changes, the intensity of the eddy current magnetic field in the rail sample will be changed. The suitable sensor working distance should be selected to obtain the sensitive inductive signals with different excitation amplifier voltage levels. The working distance is also critical to avoid sensor damage with an uneven rail surface.
  • More rail sample measurements need be conducted to evaluate the capacity of the EC detection system on defect classification and geometry parameter identification.
  • The effect of local short-wavelength irregularities should be considered in the real field application; some artificial networks could be used for the post-processing of EC signals to filter the signal irregularities.
  • The plastic deformation of rails would also affect the signal changes; some adaptive sensor clamps can be innovated to facilitate high-speed inspection.

Author Contributions

J.W.: Conceptualization, methodology, software, and writing—original draft; Q.D.: validation and writing—review and editing; P.L.: resources and supervision. H.Y.: Review and editing; R.S.: Review and editing. All authors have read and agreed to the published version of the manuscript.

Funding

This research was funded by National University Rail Center, grant No. NURail2020-MTU-R18. This research was partially supported by the National Natural Science Foundation of China, grant No. 52108408, and the Natural Science Foundation of Jiangsu Province, grant No. BK20210617.

Institutional Review Board Statement

Not applicable.

Informed Consent Statement

Not applicable.

Data Availability Statement

All data can be requested from the corresponding author.

Acknowledgments

The authors would like to thank the financial support from National University Rail Center (Grant No. NURail2020-MTU-R18). The first author thanks the support from the National Natural Science Foundation of China (Grant No. 52108408) and the Natural Science Foundation of Jiangsu Province (Grant No. BK20210617). The authors would also like to appreciate the collaboration with Adam Sohasky from CN Railway for providing the rail samples for the investigation.

Conflicts of Interest

The authors declare no conflict of interest.

Appendix A

Illustrated below are the front panel and background flows of the developed LabVIEW EC rail inspection platform, which can be acquired from the authors on demand.
Sustainability 14 11568 g0a1aSustainability 14 11568 g0a1b

References

  1. Dong, H.; Zhao, B.; Deng, Y. Instability phenomenon associated with two typical high speed railway vehicles. Int. J. Non-Linear Mech. 2018, 105, 130–145. [Google Scholar] [CrossRef]
  2. Arastounia, M. Automated Recognition of Railroad Infrastructure in Rural Areas from LIDAR Data. Remote Sens. 2015, 7, 14916–14938. [Google Scholar] [CrossRef]
  3. Papaelias, M.; Roberts, C.; Davis, C.L. A review on non-destructive evaluation of rails: State-of-the-art and future development. Proc. Inst. Mech. Eng. Part F J. Rail Rapid Transit 2008, 222, 367–384. [Google Scholar] [CrossRef]
  4. Ghoni, R.; Dollah, M.; Sulaiman, A.; Ibrahim, F.M. Defect Characterization Based on Eddy Current Technique: Technical Review. Adv. Mech. Eng. 2014, 6, 182496. [Google Scholar] [CrossRef]
  5. European Union Agency for Railways. Railway Safety in the European Union: Safety Overview 2017; Publications Office of the European Union: Luxembourg, 2017. [Google Scholar]
  6. Lasisi, A.; Attoh-Okine, N. Machine Learning Ensembles and Rail Defects Prediction: Multilayer Stacking Methodology. ASCE-ASME J. Risk Uncertain. Eng. Syst. Part A Civ. Eng. 2019, 5, 04019016. [Google Scholar] [CrossRef]
  7. Ghofrani, F.; Pathak, A.; Mohammadi, R.; Aref, A.; He, Q. Predicting rail defect frequency: An integrated approach using fatigue modeling and data analytics. Comput. Civ. Infrastruct. Eng. 2020, 35, 101–115. [Google Scholar] [CrossRef]
  8. Luke, M.; Varfolomeev, I.; Lütkepohl, K.; Esderts, A. Fracture mechanics assessment of railway axles: Experimental characterization and computation. Eng. Fail. Anal. 2010, 17, 617–623. [Google Scholar] [CrossRef]
  9. Zhai, W.; Han, Z.; Chen, Z.; Ling, L.; Zhu, S. Train–track–bridge dynamic interaction: A state-of-the-art review. Veh. Syst. Dyn. 2019, 57, 984–1027. [Google Scholar] [CrossRef]
  10. Song, Y.; Wang, Z.; Liu, Z.; Wang, R. A spatial coupling model to study dynamic performance of pantograph-catenary with vehicle-track excitation. Mech. Syst. Signal Process. 2021, 151, 107336. [Google Scholar] [CrossRef]
  11. Liu, X.; Lovett, A.; Dick, T.; Saat, M.R.; Barkan, C.P.L. Optimization of Ultrasonic Rail-Defect Inspection for Improving Railway Transportation Safety and Efficiency. J. Transp. Eng. 2014, 140, 04014048. [Google Scholar] [CrossRef]
  12. Wu, F.; Li, Q.; Li, S.; Wu, T. Train rail defect classification detection and its parameters learning method. Measurement 2020, 151, 107246. [Google Scholar] [CrossRef]
  13. Li, Q.; Zhong, Z.; Liang, Z.; Liang, Y. Rail inspection meets big data: Methods and trends. In Proceedings of the 2015 18th International Conference on Network-Based Information Systems, Taipei, Taiwan, 2–4 September 2015; IEEE: Piscataway, NJ, USA, 2015. [Google Scholar]
  14. Gupta, M.; Khan, M.A.; Butola, R.; Singari, R.M. Advances in applications of Non-Destructive Testing (NDT): A review. Adv. Mater. Process. Technol. 2021, 1–22. [Google Scholar] [CrossRef]
  15. Rajamäki, J.; Vippola, M.; Nurmikolu, A.; Viitala, T. Limitations of eddy current inspection in railway rail evaluation. Proc. Inst. Mech. Eng. Part F J. Rail Rapid Transit 2016, 232, 121–129. [Google Scholar] [CrossRef]
  16. Zou, X.; Wang, L.; Wang, J.; Liu, J.; Ma, H.; Bao, Y. Nondestructive evaluation of carbon fiber reinforced polymer (CFRP)-steel interfacial debonding using eddy current thermography. Compos. Struct. 2021, 284, 115133. [Google Scholar] [CrossRef]
  17. Liu, Z.; Li, W.; Xue, F.; Xiafang, J.; Bu, B.; Yi, Z. Electromagnetic Tomography Rail Defect Inspection. IEEE Trans. Magn. 2015, 51, 1–7. [Google Scholar] [CrossRef]
  18. Xing, B.; Yu, Z.; Xu, X.; Zhu, L.; Shi, H. Research on a Rail Defect Location Method Based on a Single Mode Extraction Algorithm. Appl. Sci. 2019, 9, 1107. [Google Scholar] [CrossRef]
  19. Karakose, M.; Yaman, O.; Baygin, M.; Murat, K.; Akın, E. A New Computer Vision Based Method for Rail Track Detection and Fault Diagnosis in Railways. Int. J. Mech. Eng. Robot. Res. 2017, 6, 17–22. [Google Scholar] [CrossRef]
  20. Jiang, Y.; Wang, H.; Tian, G.; Yi, Q.; Zhao, J.; Zhen, K. Fast classification for rail defect depths using a hybrid intelligent method. Optik 2019, 180, 455–468. [Google Scholar] [CrossRef]
  21. Alahakoon, S.; Sun, Y.Q.; Spiryagin, M.; Cole, C. Rail Flaw Detection Technologies for Safer, Reliable Transportation: A Review. J. Dyn. Syst. Meas. Control. 2018, 140, 020801. [Google Scholar] [CrossRef]
  22. Al-Ali, A.; Elwakil, A.; Ahmad, A.; Maundy, B. Design of a portable low-cost impedance analyzer. In Proceedings of the International Conference on Biomedical Electronics and Devices, Porto, Portugal, 21–23 February 2017; SciTePress: Setúbal, Portugal, 2017. [Google Scholar]
  23. García-Martín, J.; Gómez-Gil, J.; Vázquez-Sánchez, E. Non-Destructive Techniques Based on Eddy Current Testing. Sensors 2011, 11, 2525–2565. [Google Scholar] [CrossRef] [Green Version]
  24. Arjun, V.; Sasi, B.; Rao, B.P.C.; Mukhopadhyay, C.; Jayakumar, T. Optimisation of pulsed eddy current probe for detection of sub-surface defects in stainless steel plates. Sens. Actuators A Phys. 2015, 226, 69–75. [Google Scholar] [CrossRef]
  25. Sophian, A.; Tian, G.Y.; Taylor, D.; Rudlin, J. Electromagnetic and eddy current NDT: A review. Insight 2001, 43, 302–306. [Google Scholar]
  26. He, Y.; Pan, M.; Luo, F.; Tian, G. Reduction of Lift-Off Effects in Pulsed Eddy Current for Defect Classification. IEEE Trans. Magn. 2011, 47, 4753–4760. [Google Scholar] [CrossRef]
  27. Beretta, S.; Carboni, M.; Fiore, G.; Conte, A.L. Corrosion–fatigue of A1N railway axle steel exposed to rainwater. Int. J. Fatigue 2010, 32, 952–961. [Google Scholar] [CrossRef]
  28. Gao, Y.; Tian, G.Y.; Li, K.; Ji, J.; Wang, P.; Wang, H. Multiple cracks detection and visualization using magnetic flux leakage and eddy current pulsed thermography. Sens. Actuators A Phys. 2015, 234, 269–281. [Google Scholar] [CrossRef]
  29. Song, Z.; Yamada, T.; Shitara, H.; Takemura, Y. Detection of Damage and Crack in Railhead by Using Eddy Current Testing. J. Electromagn. Anal. Appl. 2011, 3, 546–550. [Google Scholar] [CrossRef]
  30. Placko, D.; Dufour, I. Eddy current sensors for nondestructive inspection of graphite composite materials. In Proceedings of the Conference Record of the 1992 IEEE Industry Applications Society Annual Meeting, Houston, TX, USA, 4–9 October 1992; IEEE: Piscataway, NJ, USA, 2003. [Google Scholar] [CrossRef]
  31. Pohl, R.; Erhard, A.; Montag, H.-J.; Thomas, H.-M.; Wüstenberg, H. NDT techniques for railroad wheel and gauge corner inspection. NDT E Int. 2004, 37, 89–94. [Google Scholar] [CrossRef]
  32. Cohen, I.; Huang, Y.; Chen, J.; Benesty, J. Pearson Correlation Coefficient. In Noise Reduction in Speech Processing; Springer: Berlin/Heidelberg, Germany, 2009; pp. 1–4. [Google Scholar]
  33. Kapoor, A.; Salehi, I.; Asih, A.M.S. Rolling Contact Fatigue (RCF). In Encyclopedia of Tribology; Wang, Q.J., Chung, Y.-W., Eds.; Springer: Boston, MA, USA, 2013; pp. 2904–2910. [Google Scholar]
  34. Mayville, R.A.; Hilton, P.D.; Peirce, D.C. Investigation of Rail Bolt Hole Cracks. 1987. Available online: https://trid.trb.org/view/1501948 (accessed on 20 December 2021).
  35. Rifai, D.; Abdalla, A.N.; Khamsah, N.; Aizat, M.; Fadzli, M. Subsurface Defects Evaluation using Eddy Current Testing. Indian J. Sci. Technol. 2016, 9, 1–7. [Google Scholar] [CrossRef]
  36. He, Y.; Pan, M.; Tian, G.; Chen, D.; Tang, Y.; Zhang, H. Eddy current pulsed phase thermography for subsurface defect quantitatively evaluation. Appl. Phys. Lett. 2013, 103, 144108. [Google Scholar] [CrossRef]
Figure 1. The developed EC inspection system: (a) hardware devices; (b) circuit diagram of the established EC system.
Sustainability 14 11568 g001
Figure 2. The illustration of the steel bar with different notched cracks.
Sustainability 14 11568 g002
Figure 3. Test setup and inspection of notched cracks: (a) the operation direction of the EC sensor; (b) the EC sensor passed through different cracks.
Sustainability 14 11568 g003
Figure 4. The real-time impedance analyzer plot of notched cracks with different depths at 90 degrees: (a) real-time reactance; (b) real-time resistance.
Sustainability 14 11568 g004
Figure 5. The normalized impedance plane of notched cracks with different depths: (a) at 90 degrees; (b) at 75 degrees.
Sustainability 14 11568 g005
Figure 6. The normalized impedance plane of cracks with different angles: (a) at 4 mm depth; (b) at 8 mm depth.
Sustainability 14 11568 g006
Figure 7. The relationships between normalized impedance and crack geometries: (a) Zcn-Crack depth; (b) Zcn-Crack angle.
Sustainability 14 11568 g007
Figure 8. Locations of the RCF defects on the inspected rail samples.
Sustainability 14 11568 g008
Figure 9. Inspection of RCF cracks on the rail head with different depths: (a) real-time reactance; (b) real-time resistance; (c) illustration of measured RCF defects.
Sustainability 14 11568 g009
Figure 10. Inspection results of the bolt hole crack: (a) real-time reactance; (b) real-time resistance; (c) photo of the bolt hole crack.
Sustainability 14 11568 g010
Figure 11. Location of gauge corner surface crack.
Sustainability 14 11568 g011
Figure 12. The inspection results of the gauge corner surface crack: (a) real-time reactance; (b) real-time resistance; (c) the change of the gauge corner crack geometry.
Sustainability 14 11568 g012
Figure 13. The normalized impedance plane plot during the sensor movement.
Sustainability 14 11568 g013
Figure 14. The location of the split web crack.
Sustainability 14 11568 g014
Figure 15. The measurement results at four different locations of the longitudinal split web surface crack: (a) real-time reactance change; (b) real-time resistance change.
Sustainability 14 11568 g015
Figure 16. Normalized impedances at four different crack positions of the web surface split crack.
Sustainability 14 11568 g016
Figure 17. The detection results of the rail head subsurface defect: (a) real-time reactance; (b) real-time resistance; (c) the possible location of the subsurface defect.
Sustainability 14 11568 g017
Figure 18. Inspection results of the subsurface gauge corner defect: (a) real-time reactance; (b) real-time resistance; (c) the location corresponding to the signal change.
Sustainability 14 11568 g018
Figure 19. The inspection results of the rail web subsurface defect. (a) real-time reactance; (b) real-time resistance; (c) the location corresponding to the subsurface defect.
Sustainability 14 11568 g019
Figure 20. The comparison between surface cracks and subsurface defects: (a) defects at rail head; (b) defects at rail gauge corner; (c) defects at rail web.
Sustainability 14 11568 g020
Table 1. The profiles of the notched cracks.
Notch 1Notch 2Notch 3
Crack angle90°90°90°
Crack depth4 mm8 mm12 mm
Notch 4Notch 5Notch 6
Crack angle75°75°75°
Crack depth4 mm8 mm12 mm
Notch 7Notch 8Notch 9
Crack angle45°45°45°
Crack depth4 mm8 mm12 mm
Notch 10Notch 11Notch 12
Crack angle15°15°15°
Crack depth4 mm8 mm12 mm
Table 2. Pearson correlation coefficient statistic results.
Relation Types Correlation   Coefficient   ( ρ ) Degrees of Correlation
Zcn-Crack depth (75 degrees)−0.8969High-strong correlation
Zcn-Crack depth (90 degrees)−0.9043High-strong correlation
Zcn-Crack angle (4 mm)−0.9773High-strong correlation
Zcn-Crack angle (8 mm)−0.9798High-strong correlation
Publisher’s Note: MDPI stays neutral with regard to jurisdictional claims in published maps and institutional affiliations.

