Article

Digital Inclusive Finance, Agricultural Industrial Structure Optimization and Agricultural Green Total Factor Productivity

School of Economics, Guizhou University, Guiyang 550025, China
*
Author to whom correspondence should be addressed.
Sustainability 2022, 14(18), 11450; https://doi.org/10.3390/su141811450
Submission received: 26 July 2022 / Revised: 6 September 2022 / Accepted: 9 September 2022 / Published: 13 September 2022

Abstract

:
Based on the Peking University Digital Financial Inclusion Index and 2011–2018 provincial panel data, this paper discusses the mechanism of digital financial inclusion on agricultural green total factor productivity from both theoretical and empirical perspectives. The result shows that digital financial inclusion can significantly increase China’s agricultural green total factor productivity, and the optimization of the agricultural industry structure can bring a significant “structural growth effect”. A total of 8.42% of the positive effects of digital financial inclusion on agricultural green total factor productivity are realized through the intermediary effect of agricultural industrial structure optimization. Through further research, it is found that digital financial inclusion has regional heterogeneity in the improvement of agricultural green total factor productivity. At the same time, digital financial inclusion of different dimensions will also have a differential impact on the improvement of agricultural green total factor productivity. In order to promote the green development of agriculture, it is necessary to further improve the financial development environment, optimize the structure of the agricultural industry, and formulate development policies for digital inclusive finance in accordance with local conditions.

1. Introduction

Since the reform and opening up, China’s agricultural development has made remarkable achievements. The average annual growth rate of agricultural GDP has increased from 2.2% before the reform and opening up to 4.5% [1], but the ensuing agricultural pollution has become one of the most serious environmental problems we are currently facing, and agriculture and rural areas are increasingly serious environmental problems that seriously endanger the sustainable development of agriculture and the quality and safety of agricultural products. Since the 18th National Congress of the Communist Party of China, the CPC Central Committee and the State Council have attached great importance to green development. The No. 1 Central Document has proposed to promote the green development of agriculture for eight consecutive years. The green total factor productivity of agriculture is measured by including resources and environmental factors [2], which can better evaluate the agricultural productivity that meets the current agricultural economic growth standards and examine the process of agricultural green development. Therefore, improving the agricultural green total factor productivity (AGTFP) has become an important way to solve the dilemma of “resources-energy-environment-sustainable growth” in agriculture and realize the green development of agriculture [3].
With the rapid development of the economy, the negative impact of environmental pollution and ecological damage on society is becoming more and more serious. In the traditional calculation process of total factor productivity, it is only guided by the expected output and ignores the unexpected output such as pollution in the actual economic operation and production process, so the measurement results will inevitably be biased. Therefore, in order to calculate the total factor productivity more accurately and comprehensively, some scholars bring environmental factors into the traditional calculation of total factor productivity. Pittman [4] included environmental pollution into the undesirable output for the first time when calculating the total factor productivity of paper mills. Subsequently, Chung [5] proposed the Malmquist–Luenberger productivity index based on radial DEA. Due to radial and angle selection, the traditional DEA model will bring some calculation deviation. Therefore, Tone [6] constructed an SBM model based on relaxation variables in 2001. Domestic agricultural research on GTFP started late, mainly using the DEA method, namely the Malmquist index, ML index, SBM model, super-SBM model, and GML index to measure productivity [7,8,9,10,11,12,13].
Among the many factors that improve productivity, the level of financial development is an important factor [14,15,16]. As a scarce resource, the rational allocation of finance means that it needs to flow to efficient departments and enterprises. The allocation of financial resources in China presents the characteristics of low efficiency and unbalanced mismatch [17]. With the maturity of technologies such as the Internet and big data, the digital economy has flourished. General Secretary Xi Jinping emphasized the need to increase the emphasis on the digital economy. Compared with the traditional financial system, digital inclusive finance is a new digital financial model to achieve inclusive financial services, a financial system that can effectively and comprehensively provide services to all social strata and groups [18], significantly affect rural financial needs, and promote consumption [19]. Due to the “structural” driving effect of digital financial inclusion, it can effectively correct the problems of “attribute mismatch”, “domain mismatch” and “stage mismatch” in traditional finance [20]. The “partial environmental problem” formed by the conditions [21], and indirectly drives the level of regional innovation through technological innovation incentives and other means [22], reduces the degree of information asymmetry, and significantly promotes technological innovation [23,24], which has a profound impact on the upgrading and optimization of the industrial structure [25], thereby improving urban green total factor productivity [26].
The existing literature provides a good idea for this paper, but it has not yet revealed the mechanism of the effect of digital inclusive finance on agricultural green total factor productivity, and there are few empirical studies involving the effect of digital inclusive finance on agricultural green total factor productivity and heterogeneity. This paper conducts theoretical sorting and empirical analysis to further clarify the relationship between the two and provide new references for government decision-making. Firstly, this paper theoretically expounds on the relationship and transmission path between digital Inclusive Finance and agricultural green total factor productivity and puts forward the corresponding research hypotheses. Secondly, using the digital inclusive finance index of Peking University and the provincial panel data from 2011 to 2018, the super efficiency SBM-ML index is constructed to calculate the agricultural green total factor productivity, and various models are used to empirically verify the proposed theoretical hypothesis. Finally, it tests the heterogeneity theoretical hypothesis of digital inclusive financial development on agricultural green total factor productivity and provides empirical evidence for different regions to formulate differentiated agricultural green development policies. We believe that the possible marginal contributions of this paper are: firstly, it takes the optimization of agricultural industry structure as the mediating mechanism, which is a more innovative research perspective; secondly, it analyzes theoretically the impact and mechanism of digital inclusive finance on agricultural green total factor productivity, constructs a framework mechanism of digital inclusive finance, optimization of agricultural industry structure and agricultural green total factor productivity, and it expands the scope of research on digital inclusive finance and provides new evidence for green agricultural development and digital rural development.

2. Theoretical Mechanisms and Research Hypotheses

2.1. The Logic of the Impact of Digital Financial Inclusion on Agricultural Green Total Factor Productivity

The improvement of agricultural green total factor productivity is the key to realizing agricultural green development. The development of the financial system has a significant impact on the improvement of green total factor productivity by optimizing resource allocation and promoting technological innovation [27]. Digital inclusive finance combines digital technology with inclusive finance, drives the development of inclusive finance with the promotion of digital information technology, and opens up the “last mile” of rural financial services. The essence of digital inclusive finance is also finance. Therefore, digital inclusive finance can also promote the improvement of agricultural green total factor productivity.
First, digital inclusive finance improves agricultural green total factor productivity by accelerating rural financial efficiency, reducing rural financial costs, and increasing expected output. By breaking the time and space constraints [28], digital inclusive finance reduces transaction costs and financial service thresholds [29], establishes a point-to-point direct connection between financial providers and demanders, and accelerates the flow of funds, thereby improving financial efficiency. In this process, digital inclusive finance realizes business intelligence by using artificial intelligence, digitalization and other technologies, and ultimately reduces the operation and use costs of finance. Therefore, by giving play to the function of resource allocation, digital inclusive finance improves the allocation efficiency of capital use, improves the efficiency of the rural financial system, accelerates the speed of capital circulation, and tilts more capital to places with high agricultural production yields to improve agricultural production efficiency, thereby increasing the expected agricultural output, and ultimately improving agricultural green total factor productivity.
Second, digital inclusive finance improves agricultural green total factor productivity by easing financing constraints, improving the level of agricultural biotechnology, and reducing undesired outputs. By promoting consumption, digital inclusive finance alleviates the constraints of financing and liquidity [30,31], improves the allocation of regional credit resources, improves the quality of consumption, and then improves the ability of innovation [32,33]. The development of digital inclusive finance promotes the continuous development of agricultural science and technology. With the continuous progress of agricultural biotechnology, the consumption of chemical fertilizers, pesticides, and other resources and pollution emissions required by agricultural production will be reduced, so as to reduce the unexpected output of agriculture and finally improve the green total factor productivity of Agriculture.
Accordingly, this paper proposes research Hypothesis 1:
Hypothesis 1. 
The development of digital inclusive finance can significantly improve China’s agricultural green total factor productivity.

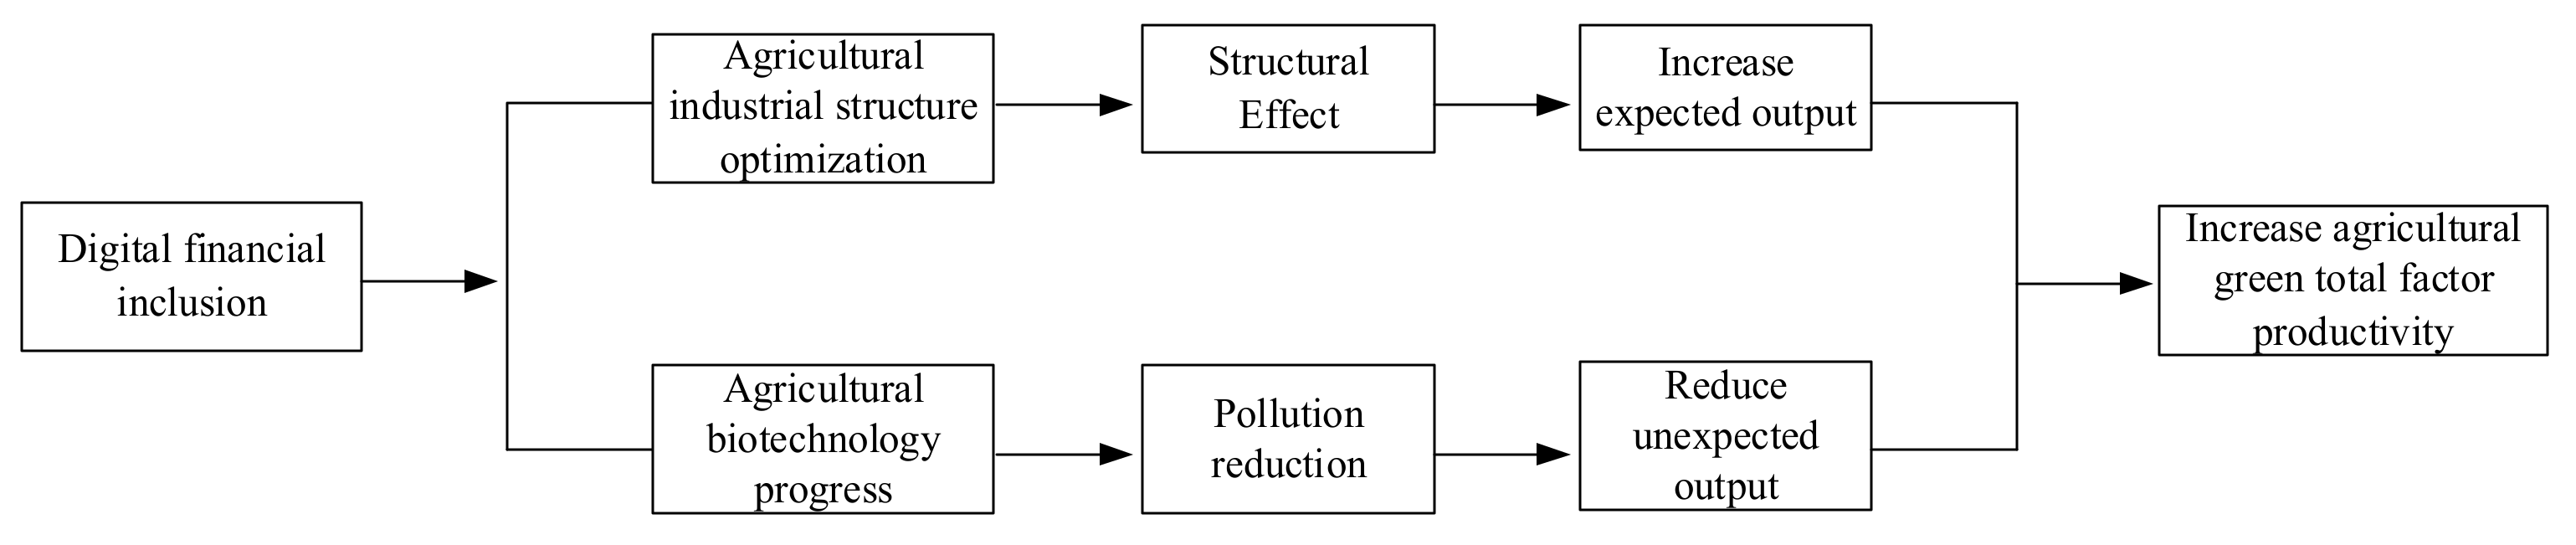
2.2. The Logic of Digital Inclusive Finance, Industrial Structure Optimization, and Agricultural Green Total Factor Productivity

The upgrading of industrial structure is one of the important factors of modern economic development [34,35]. The optimization of industrial structure mainly improves the quality of economic growth by driving independent innovation capability [36]. Capital is the key factor to promote the optimization of industrial structure. With the continuous development of the financial system, finance can more effectively solve the problems of information mismatch and transaction cost, promote scientific and technological innovation, and finally promote the optimization of industrial structure [37]. There are three main directions for the promotion of industry optimization and upgrading by digital inclusive finance. First, is the factor allocation effect. A good level of financial development improves the availability of resources [38], and financial institutions complete the formation and initial accumulation of capital through deposit-taking and adjust the number of factor inputs with respect to the optimal capital needed by enterprises to carry out production, which in turn strengthens the allocation function of resources, optimizes the allocation of credit funds among industries, and promotes industrial structure upgrading [39]. Digital inclusive finance, with its unique pioneering, extensive, universal, and targeted nature of modern financial capital flows, effectively promotes and guides the market competition and rational flow of production factors such as land, labor, and technology, improves the efficiency of agricultural resource allocation, promotes the rationalization of agricultural industrial structure, and can promote the development of agriculture from a higher level [40].
Second, is the consumption demand effect. Financial development not only promotes income growth, but also greatly stimulates the increase in national consumption demand, and the change in income elasticity among products also profoundly affects the consumption structure of residents [41]. The upgrading and change in the consumption structure of the population have continuously led to the optimization of the industrial structure on the demand side. Digital inclusive finance vigorously extends the breadth and depth of financial services through the use of network and digital technology and deeply stimulates the consumption demand of social groups regarding agricultural development, thus promoting the continuous optimization and upgrading of the industrial structure related to agricultural consumption demand, and ultimately enhancing the level of agricultural development.
Third, is the technological innovation effect. Innovation is the source of economic development [42]. Economic growth benefits from technological innovation and has a strong positive externality [43]. The intrinsic mechanism of technological innovation acting on industrial structure change is mainly through influencing the strong dynamics and specific paths of industrial structure optimization [44]. Digital inclusive finance, first of all, as modern finance, can organically participate in the process of industrial organization change, technological innovation, equipment improvement, and human capital transformation in agriculture promote the continuous development and growth of new intermediary industries such as agricultural social services, and improve the technological innovation, R&D investment and industrial total factor productivity of enterprises [45,46] so as to increase the endogenous dynamics of industrial structure change, promote the advanced development of agricultural industrial structure, and boost the high-quality development of the agricultural industry.
The growth rate of total factor productivity can be divided into two parts: technological progress and efficiency improvement. Efficiency improvement includes the rational allocation of resources caused by industrial structure adjustment and the progress of soft technologies such as agricultural operation and management technology [47]. Among them, the “structural effect” arising from the adjustment of industrial structure is the internal mechanism of improving total factor productivity [48,49,50,51,52,53]. With the continuous development of digital inclusive finance, the threshold of rural credit has been lowered, farmers can more easily obtain credit funds, the investment of agricultural resources and the degree of mechanization have been correspondingly improved, and the ability of professional division of labor has been continuously improved. In this process, such as labor capital and other agricultural production factors and resources are constantly transferred from sectors with low productivity and technology levels to sectors with high productivity and technology levels [54]. The proportion structure of different sub-sectors within agriculture (agriculture, forestry, animal husbandry, and fishery) has changed, forming a “structural growth effect”, and the expected output of agriculture has increased, Finally, improving agricultural green total factor productivity. The specific impact mechanism is shown in Figure 1 below.
Due to the obvious “digital divide” effect, and subject to the level of e-commerce and financial development, the development of digital financial inclusion in various regions in China has been significantly differentiated [29]. The development level of inclusive finance in the eastern region is significantly better than that in the central and western regions [55]. Therefore, there is a certain degree of heterogeneity in the effect of digital inclusive finance on agricultural green total factor productivity in different regions of China.
Accordingly, this paper proposes research Hypotheses 2 and 3:
Hypothesis 2. 
Digital financial inclusion can indirectly promote the improvement of agricultural green total factor productivity through the optimization of agricultural industrial structure.
Hypothesis 3. 
There is a certain degree of heterogeneity in the effect of the development of digital inclusive finance on agricultural green total factor productivity.

3. Models, Variables, and Data

3.1. Construction of Agricultural Green Total Factor Productivity Model and Description of Variables

3.1.1. Super Efficiency SBM-ML Model Based on Unexpected Output

Referring to the SBM model considering unexpected output proposed by tone and the “super efficiency” model further proposed by Andersen and Petersen [56], this paper calculates the agricultural green total factor productivity of 30 provincial units in China excluding Tibet. This paper takes each provincial unit as a decision-making unit, and the elements of each decision-making unit include input variables of agricultural production in each province, expected output, and unexpected output. The specific form of the model is shown as follows:
min ρ = 1 + 1 m i = 1 m s i x i k 1 1 s 1 + s 2 r = 1 s 1 s r y y r k + t = 1 s 2 s t u u t k
s . t . x j = 1 , j k n x i j λ j s i u t k j = 1 , j k n u t j λ j s t u 1 1 s 1 + s 2 r = 1 s 1 s r y y r k + t = 1 s 2 s t u u t k > 0 s , s y , s u , λ 0
Among them, i = 1 , 2 , , m ; r = 1 , 2 , q ; j = 1 , 2 , n ( j k ) . λ is the weight vector; x i k , y r k , u t k is the input, expected output, and undesired output elements; s , s y , s u is the relaxation variable; m , s 1 , s 2 is the quantity of input and output factors; ρ represents the point where the production decision-making unit is closest to the technological frontier, and the efficiency value calculated by this method can be greater than 1, so the accuracy of the calculation of agricultural green total factor productivity can be improved.
According to Chung et al. [5], the ML index from period t to t + 1 is calculated based on the super-efficient SBM model of undesired output, which is expressed as:
M L t t + 1 = 1 + D 0 t ( x t , y t , u t ; g t ) 1 + D 0 t ( x t + 1 , y t + 1 , u t + 1 ; g t + 1 ) × 1 + D 0 t + 1 ( x t , y t , u t ; g t ) 1 + D 0 t + 1 ( x t + 1 , y t + 1 , u t + 1 ; g t + 1 ) 1 / 2
If M L t t + 1 < 1 , it indicates that the expected output decreases and the unexpected output increases, and the agricultural green total factor productivity in the current period is lower than that in the previous period. On the contrary, it shows that the current agricultural green total factor productivity is improved. M L t t + 1 can be decomposed into green technology progress index M L T E C H t t + 1 and green efficiency improvement index M L E F F C H t t + 1 .
M L t t + 1 = M L T E C H t t + 1 × M L E F F C H t t + 1
M L T E C H t t + 1 = 1 + D 0 t + 1 ( x t + 1 , y t + 1 , u t + 1 ; g t + 1 ) 1 + D 0 t ( x t , y t , u t ; g t ) × 1 + D 0 t + 1 ( x t , y t , u t ; g t ) 1 + D 0 t ( x t + 1 , y t + 1 , u t + 1 ; g t + 1 ) 1 / 2
M L E F F C H t t + 1 = 1 + D 0 t ( x t , y t , u t ; g t ) 1 + D 0 t + 1 ( x t + 1 , y t + 1 , u t + 1 ; g t + 1 )
Among them, the green technology progress index M L T E C H t t + 1 refers to the progress speed of the green technology frontier, that is, the dynamic change of the outward expansion of the production possibility frontier. When M L T E C H t t + 1 > 1 , it indicates that green technology has made progress, otherwise, it indicates that it has regressed. The efficiency improvement index M L E F F C H t t + 1 measures the proximity of the actual production of the production unit to the maximum production output and reflects the speed at which the technologically backward catch up with the advanced. When M L E F F C H t t + 1 > 1 , it indicates that the efficiency of green technology has improved, on the contrary, it indicates retrogression.

3.1.2. Variable Description

  • Input variables
The input variables for each provincial unit are specified in Table 1 below.
  • Output variables
The output variables for each provincial unit are specified in Table 2 below.

3.2. Econometric Model Construction and Variable Description

3.2.1. Benchmark Model

This paper is based on provincial panel data from 2011–2018, which are short panel data and static panel models because the lag term of the dependent variable is not involved in the construction of the model. When estimating panel data, it is often assumed that individual regression equations have the same slope but can have different intercept terms to capture heterogeneity, and this model is called an “individual effects model.” Subsequently, a Hausman test is used to determine whether a fixed-effects model or a random effects model applies to the panel data. In order to explore the relationship between digital inclusive finance and agricultural green total factor productivity, regression estimation of both is required. Therefore, in this paper, a regression model with agricultural green total factor productivity as the explanatory variable and digital inclusive finance index as the core explanatory variable will be developed as follows:
A G T F P i t = α 0 + α 1 I n d e x i t + α C o n t r o l i t + ε i t
Among them, A G T F P i t represents the agricultural green total factor productivity of i provincial unit in year t, I n d e x i t represents the development level of digital inclusive finance, C o n t r o l i t represents the control variable, ε i t represents the random error term, and α 0 , α 1 , α 2 represents the coefficient to be estimated.

3.2.2. Mediating Effect Model

Digital inclusive finance may indirectly drive the improvement of agricultural green total factor productivity through the optimization of agricultural industry structure. This paper attempts to clarify this mechanism of action using the mediating effect model, with the following steps: first, the explanatory variable agricultural green total factor productivity is estimated by regression on the core explanatory variable digital inclusive finance, and if the core explanatory variable is significant, then the next step is carried out. Second, the mediating variable agricultural industry structure optimization is estimated by regression on the core explanatory variable digital inclusive finance, and if the core explanatory variable is significant, then the next step is, finally, the explained variable agricultural green total factor productivity is estimated by regression on the core explanatory variable digital inclusive finance and the mediating variable agricultural industry structure optimization, and if the core explanatory variable and the mediating variable are still significant, the mediating variable plays a partial mediation effect, and if the mediating variable is significant and the core explanatory variable is no longer significant, the mediating variable plays a full mediation effect.
In order to clarify whether digital inclusive finance influences agricultural green total factor productivity through a certain intermediary mechanism, this paper establishes the following model to test its intermediary effect and its mechanism by referring to the research method of Baron and Kenny [59].
A G T F P i t = β 0 + β 1 I n d e x i t + β C o n t r o l i t + ω i t
M e d i a t o r i t = γ 0 + γ 1 I n d e x i t + γ C o n t r o l i t + φ i t
A G T F P i t = θ 0 + θ 1 I n d e x i t + θ 2 M e d i a t o r i t + θ C o n t r o l i t + δ i t
Among them, M e d i a t o r i t is the intermediary variable and refers to the agricultural industrial structure optimization index (YH).

3.2.3. Variable Description

  • Explained variables
The explained variable used in this paper is agricultural green total factor productivity (AGTFP). The agricultural green total factor productivity index calculated above is the growth rate relative to the green total factor productivity of the previous year. In order to obtain the agricultural green total factor productivity for this year, it is necessary to use the method of Qiu [60] for reference to adjust the agricultural green total factor productivity index accordingly.
  • Core explanatory variables
This paper uses the China Digital Financial Inclusion Index (Index) jointly compiled by the Digital Finance Research Center of Peking University and Ant Financial Group as the core explanatory variable. The main use is the digital financial inclusion index of each provincial unit from 2011 to 2018. In addition, coverage, usage, and digital are also used to represent the coverage, depth of use, and degree of digitalization of digital inclusive financial services, respectively. This paper calculates the logarithm of the above results.
  • Control variables
According to the current stage of China’s agricultural development, the following control variables are selected in this paper, as shown in Table 3 below.
  • Mediating variables
This paper refers to the calculation of the optimization of the agricultural industrial structure by Kuang and Zhou [62] and uses the calculated agricultural industrial structure optimization index (YH) as the intermediary variable. Agricultural industrial structure optimization (YH) includes two dimensions: structural rationalization (TL) and structural advanced (H), which, respectively, account for 50% of the weight, and are specifically expressed as:
Y H = 0.5 × T L + 0.5 × H
The rationalization of industrial structure (TL) is a reflection of the coupling degree of factor input and output structure, which is usually calculated by the Theil index.
T L = i = 1 n Y i Y ln Y i L i / Y L
Considering the particularity of agriculture, the added value realized by intermediate consumption of agriculture, forestry, animal husbandry, and fishery units (added value/intermediate consumption) Y i / L i is selected to measure; Y i / Y is represented by the proportion of industries in the total agricultural output value.
The upgrading of industrial structure (H) includes the change of proportional relationship and the improvement of productivity.
H = v i t × L P i t
Among them, v i t refers to the proportion of the output value of industry i in time t, and L P i t is the labor productivity of industry i in time t. That is, v i t is represented by the proportion of the industrial output value in the total agricultural output value, and L P i t is represented by the added value achieved by the unit of intermediate consumption. Since labor productivity has dimension, then labor productivity is standardized with “0–1”.

3.3. Data Sources and Descriptive Statistics

The data in this paper are mainly from China Statistical Yearbook, China Rural Statistical Yearbook, China Digital Financial Inclusion Index, etc. In this paper, 30 provincial-level units in Mainland China except Tibet from 2011 to 2018 are taken as the research objects. According to the division method of the National Bureau of Statistics, the country is divided into four regions: eastern, central, western, and northeast. The descriptive statistics of samples are shown in Table 4 below.
According to Table 4, from 2011 to 2018, China’s average agricultural green total factor productivity was 1.0666 > 1, indicating that during this period, China’s overall agricultural green total factor productivity was in a state of progress. The average level in northeast China is the highest, followed by that in eastern China, both of which are better than that in central and western China. As for the digital inclusive finance development index, the average of China’s overall development is 5.0730, and the eastern region has the highest average development level by region. From the perspective of agricultural industrial structure optimization index, the overall agricultural industrial structure optimization index of China is 0.2678, and there is some regional heterogeneity in different regions, especially in the western region, the agricultural industrial structure optimization index is the highest. The other control variables also reflect certain regional differences, which may have a certain impact on agricultural green total factor productivity.

4. Analysis of Empirical Results

4.1. Analysis of Benchmark Regression Results

Considering that the possible outliers in the data will have an impact on the regression results, this paper first conducts 1% tail reduction on all variables to reduce the interference of extreme values and outliers on the regression results. Panel data are usually estimated using the fixed-effects model and the random effects model. The Hausman test for Model (7) shows that the null hypothesis is rejected at the significance level of 0.05, indicating that fixed effects should be selected for model analysis. The specific regression results are shown in Table 5 below.
According to the results of Regression (1), there is a positive correlation between agricultural green total factor productivity and digital inclusive financial index at the significance level of 1%, which means that the improvement of digital inclusive financial index is conducive to the improvement of agricultural green total factor productivity. Regression (2) and (3) added corresponding control variables on the basis of Regression (1), and the regression results all reflected a significant positive correlation between the digital financial inclusion index and agricultural green total factor productivity. This may be because the development of digital inclusive finance has provided convenient financial services for the development of agriculture and rural areas, promoted the consumption of regional agricultural products, and improved agricultural production technology, which in turn led to the growth of agricultural green total factor productivity. Therefore, hypothesis 1 has been verified, that is, the development of digital inclusive finance can significantly improve China’s agricultural green total factor productivity.
According to the regression results, the influence of control variables on agricultural green TFP mainly includes the following aspects: (1) agricultural structure. The results of Regressions (2) and (3) all show that agricultural structure has a significant positive impact on agricultural green total factor productivity, which means that when the ratio of agricultural structure increases, agricultural green total factor productivity will increase. When the proportion of agricultural added value is relatively large, it indicates that the expected output increases, thereby improving agricultural green total factor productivity. (2) Income distribution. The results of Regressions (2) and (3) show that there is a significant positive correlation between income distribution and agricultural green total factor productivity, that is, when the ratio of income distribution increases, agricultural green total factor productivity will increase accordingly. The narrowing of the urban–rural income gap means that the development conditions of agriculture are relatively good, thereby improving agricultural green total factor productivity. (3) Natural disasters. The Regression (2) results show that there is a significant negative correlation between natural disasters and agricultural green total factor productivity. When natural disasters occur frequently, the expected agricultural output and agricultural income will be affected, which will lead to a significant reduction in agricultural green total factor productivity.

4.2. Analysis of the Results of the Mediation Effect Model

Taking the agricultural industrial structure optimization index (YH) as the mediating variable, the mediation effect test of the Models (8), (9) and (10) is carried out. The empirical results are shown in Table 6 below.
Table 6 shows that digital financial inclusion index can promote the optimization of China’s agricultural industrial structure, and then improve agricultural green total factor productivity. The results of Regression (4) show that the direct effect of digital financial inclusion index on agricultural green total factor productivity is significantly positive. The Regression (5) results show that the digital financial inclusion index can significantly promote the optimization of the agricultural industrial structure. When the development level of digital inclusive finance is improved, agricultural industrial institutions will be optimized to a certain extent. The results of Regression (6) show that both digital financial inclusion index and agricultural industrial structure optimization index are significantly positively correlated, which indicates that the mediating effect plays a significant role. The proportion of the mediating effect in the total effect is ab/c = 0.0085 × 2.4852/0.2509 = 0.0842, which indicates that on the national scale, 8.42% of the positive effect of digital inclusive finance on agricultural green total factor productivity is realized through the intermediary effect of optimizing agricultural industrial structure. Therefore, Hypothesis 2 has been verified, that is, digital financial inclusion can indirectly promote the improvement of agricultural green total factor productivity through the optimization of agricultural industrial structure.

4.3. Robustness Test

In order to ensure the robustness of the empirical results, this paper uses the following two methods to test the robustness: (1) excluding municipalities directly under the central government. Due to the special economic and political status of municipalities directly under the central government, the ratio of agricultural production to economic development is low, which may have an impact on the measurement results. Therefore, this paper tests the robustness by excluding four municipalities directly under the Central Government: Beijing, Tianjin, Shanghai and Chongqing. (2) Instrumental variable method. Based on theoretical and practical judgments, there may be some endogeneity between digital inclusive finance and agricultural green total factor productivity. On the one hand, there may be a two-way causal relationship between digital inclusive finance and agricultural green total factor productivity. That is, while digital inclusive finance affects agricultural green total factor productivity, the improvement of agricultural green total factor productivity may also lead to changes in the development level of digital inclusive finance; on the other hand, the number of Internet websites was previously used as an instrumental variable in this paper, which may have endogeneity problems. Therefore, in order to better avoid the insurmountable “endogeneity” problem of the model, this paper chooses to use the one-period lagged variables of the digital inclusive finance index as the instrumental variables to weaken the interference caused by the two-way causality [63], and the spatial distance from the capital city to Hangzhou as the instrumental variable. This choice was made in order to better avoid the problem of “endogeneity” that may be difficult to overcome in the model [64]. The reason for choosing this instrumental variable is that, on the one hand, Hangzhou is the “digital finance capital” of China, and the degree of digital inclusive finance development is among the leading ones in China, and the closer the region is to Hangzhou, the stronger the radiation effect of Hangzhou will be, and the higher the degree of digital inclusive finance development will be; on the other hand, this instrumental variable does not change with time and economic development level, and will not affect agricultural green total factor productivity through some omitted variables, which meets the condition of exogeneity of the instrumental variable. Considering that the distance does not change with time, the product of the distance from each provincial capital city to Hangzhou and the digital financial inclusion index in that year is finally set as the instrumental variable. The specific regression results are shown in Table 7 below.
After excluding municipalities directly under the central government, Regression (7) shows that digital inclusive finance still has a significant positive impact on China’s agricultural green total factor productivity, and the estimation results are basically consistent with the benchmark regression estimation results above, indicating that the development level of digital inclusive finance can indeed promote the rise of agricultural green total factor productivity during the study sample period, which once again verifies the robustness of the test results. By selecting appropriate instrumental variables for regression analysis, Regressions (8) and (9) shows that the estimation coefficient of the digital inclusive financial index is positive and significant at the significance level of 5%, which is consistent with the above analysis results, indicating that the analysis results of this paper are robust and there is no endogenous problem.

5. Heterogeneity Discussion and Analysis

5.1. Discussion on the Heterogeneity of Different Dimensions of Digital Inclusive Finance

Digital inclusive financial services are mainly reflected in three aspects: coverage, usage, and digital. Coverage reflects the coverage of financial services. The depth of use mainly refers to the total amount of actual use and the activity of use. The degree of digitization considers factors such as convenience and cost. By discussing the influence of different dimensions on agricultural green total factor productivity, the advantages of digital inclusive finance can be more targeted. Specific regression results are shown in Table 8 below.
The results in Table 8 show that the coverage breadth, depth of use, and degree of digitalization of digital inclusive finance have a significant positive impact on China’s agricultural green total factor productivity. Regression (11) shows that the depth of the use of digital inclusive finance plays the most obvious and powerful role in promoting agricultural green total factor productivity, followed by the degree of digitization of digital inclusive finance, and finally the coverage of digital inclusive finance. When the coverage breadth is improved, it means that the coverage of digital inclusive finance will be larger in rural areas, and more and more people will enjoy the services of digital inclusive finance, thus improving agricultural green total factor productivity. When the depth of use is increased, users will be more active in the use of digital inclusive finance, and their dependence on digital inclusive finance will increase, thus increasing agricultural green total factor productivity. When the degree of digitalization increases, it indicates that the service of digital inclusive finance is more and more convenient and the cost is lower, which makes it easier for agriculture to obtain available funds, and then improves agricultural green total factor productivity.

5.2. Discussion on Regional Heterogeneity

The driving effect of digital inclusive finance on agricultural green total factor productivity may be significantly different due to different regional development conditions. From the perspective of economic and digital development, the development of different regions in China shows obvious differences. By discussing the impact of digital inclusive finance on agricultural green total factor productivity in different regions, this paper reveals the impact of regional differences on agricultural green total factor productivity. The specific regression results are shown in Table 9 below.
The results in Table 9 show that digital financial inclusion in the eastern, central, and western regions will significantly improve the level of agricultural green total factor productivity, and the relationship between digital financial inclusion and agricultural green total factor productivity in the northeast region is not significant. Among them, the role of the eastern region is the most significant, followed by the western region, and finally the central region. The reason is that compared with the central and western regions, the eastern region has a more complete financial infrastructure and a higher level of financial development. Digital inclusive finance and traditional finance can produce a better complementary relationship, provide better financial services, and then improve agricultural green total factor productivity. In addition, with the rise of central China and the implementation of the western development strategy in recent years, digital inclusive finance has developed rapidly in the central and western regions under the combined development of eastern regions and their own development, which has brought about the corresponding improvement of agricultural green total factor productivity. Due to the slow development of the financial market and lagging technological innovation in northeast China, digital inclusive finance has no significant impact on agricultural green total factor productivity. Therefore, hypothesis 3 is verified, that is, the development of digital inclusive finance has certain heterogeneity in its effect on agricultural green total factor productivity.

6. Conclusions and Policy Implications

To explore digital inclusive finance and the agriculture of the relationship between total factor productivity and mechanism, this paper, from the theoretical analysis of the digital inclusive finance impact on agricultural green total factor productivity mechanism, uses of Peking University digital inclusive finance index and 2011–2018 provincial panel data. The theoretical part puts forward the assumptions of empirical validation. Finally, the influence of digital inclusive finance on agricultural green total factor productivity in different regions is discussed. The research results show that, firstly, digital financial inclusion can significantly improve agricultural green total factor productivity nationwide, and the results are robust. Secondly, digital inclusive finance has significantly improved agricultural green total factor productivity by optimizing the agricultural industrial structure, and 8.42% of the positive effect of digital inclusive finance on agricultural green total factor productivity is achieved by optimizing the agricultural industrial structure. Thirdly, digital inclusive finance can significantly improve agricultural green total factor productivity in both eastern and western regions, and the eastern region has the most significant impact.
Based on the research conclusions of this paper, the following policy recommendations are proposed:
First, further improve the development environment of digital inclusive finance, and vigorously develop digital inclusive finance. In the context of vigorously promoting the green development of agriculture, in view of the fact that digital inclusive finance can significantly improve the green total factor productivity of agriculture, it is necessary to further improve the financial environment, promote the development of digital inclusive finance, and then realize the green development of agriculture and rural areas. Second, optimize the agricultural industry structure and promote the rational layout of the agricultural industry structure. Give full play to the positive role of digital inclusive finance in the optimization of the agricultural industrial structure, guide the flow of funds to emerging agricultural industries with high added value, improve the efficiency of factor allocation, promote the improvement of agricultural economic benefits, and ultimately achieve the growth of the green economy. Finally, digital inclusive financial policies should be formulated according to local conditions to better develop an agricultural green economy. According to the development characteristics and financial endowment of different regions, different development policies of digital inclusive finance should be constructed to give full play to the development advantages of digital inclusive finance and improve agricultural green total factor productivity.
Our study also has certain limitations. One is the limitation of research time, as this paper draws on the Digital Inclusive Finance Index jointly compiled by the Digital Finance Research Center of Peking University and Ant Financial Services Group, which spans only 2011–2018, resulting in the problem of a short research time interval. Second, is the limitation of the research scope. This paper only studied the impact of digital inclusive finance on agricultural green total factor productivity at a macro level and did not analyze and verify for microdata. Based on this, it is expected that we can try to draw on more indicators or construct more reasonable indicators to represent digital financial inclusion in the subsequent writing process in order to compensate for the limitation in time and to extend the study to microdata to further verify the findings of this paper.

Author Contributions

Conceptualization, M.T. and M.H.; methodology, M.T.; software, M.T.; validation, M.T., M.H. and J.W.; formal analysis, M.T.; investigation, J.W.; resources, M.T.; data curation, J.W.; writing—original draft preparation, M.T.; writing—review and editing, M.T.; visualization, J.W.; supervision, M.H.; project administration, M.H.; funding acquisition, M.H. and M.T. All authors have read and agreed to the published version of the manuscript.

Funding

This research was funded by the National Natural Science Foundation of China, grant number 72163003, and the Foundation of Postgraduate of Guizhou Province, grant number YJSKYJJ[2021]032.

Institutional Review Board Statement

Not applicable.

Informed Consent Statement

Not applicable.

Data Availability Statement

Publicly available datasets were analyzed in this study. The main data can be found here: China Statistical Yearbook: Available online: http://www.stats.gov.cn/english/Statisticaldata/AnnualData/ (accessed on 29 June 2022).

Acknowledgments

We thank the School of Economics of Guizhou University in China for its support.

Conflicts of Interest

The authors declare no conflict of interest.

References

  1. Huang, J. Forty Years of China’s Agricultural Development and Reform and the Way forward in the Future. J. Agrotech. Econ. 2018, 3, 4–15. [Google Scholar]
  2. Reinhard, S.; Lovell, C.; Thijssen, G. Econometric estimation of technical and environmental efficiency: An application to Dutch dairy farms. Am. J. Agric. Econ. 1999, 81, 44–60. [Google Scholar] [CrossRef]
  3. Guo, H.; Liu, X. Spatial and Temporal Differentiation and Convergence of China’s Agricultural Green Total Factor Productivity. J. Quant. Tech. Econ. 2021, 38, 65–84. [Google Scholar]
  4. Pittman, R. Multilateral productivity comparisons with undesirable outputs. Econ. J. 1983, 93, 883–891. [Google Scholar] [CrossRef]
  5. Chung, Y.; Färe, R.; Grosskopf, S. Productivity and undesirable outputs: A directional distance function approach. J. Environ. Manag. 1997, 51, 229–240. [Google Scholar] [CrossRef]
  6. Tone, K. A slacks-based measure of efficiency in data envelopment analysis. Eur. J. Oper. Res. 2001, 130, 498–509. [Google Scholar] [CrossRef]
  7. Li, G.; Chen, N.; Min, R. Growth and Sources of Agricultural Total Factor Productivity in China under Environmental Regulations. China Popul. Resour. Environ. 2011, 21, 153–160. [Google Scholar]
  8. Wang, Q.; Wang, H.; Chen, H. A Study on Agricultural Green TFP in China: 1992–2010. Econ. Rev. 2012, 5, 24–33. [Google Scholar]
  9. Liang, J.; Long, S. China’s Agricultural Green Total Factor Productivity Growth and Its Affecting Factors. J. South China Agric. Univ. Soc. Sci. Ed. 2015, 14, 1–12. [Google Scholar]
  10. Ge, P.; Wang, S.; Huang, X. Measurement for China’s agricultural green TFP. China Popul. Resour. Environ. 2018, 28, 66–74. [Google Scholar]
  11. Guo, H.; Zhang, Z.; Fang, L. Spatial and temporal variation and evolution of Green total factor productivity in Chinese agriculture. Mod. Econo. Res. 2018, 28, 85–94. [Google Scholar]
  12. Wang, L.; Yao, H.; Han, X. Carbon emissions, Green total factor productivity and agricultural economic growth. Inq. Econ. Issues 2019, 2, 142–149. [Google Scholar]
  13. Ma, G.; Tan, Y. Impact of Environmental Regulation on Agricultural Green Total Factor Productivity. J. Agrotech. Econ. 2021, 32, 77–92. [Google Scholar]
  14. Lian, J.; Sun, H.; Zhong, X. Financial Enterprise Cluster: Economic Nature, Efficiency Frontier and Competitive Advantage. J. Financ. Res. 2005, 6, 72–82. [Google Scholar]
  15. Iyare, S.; Moore, W. Financial sector development and growth in small open economies. Appl. Econ. 2011, 43, 1289–1297. [Google Scholar] [CrossRef]
  16. Greenwood, J.; Sanchez, J.; Wang, C. Quantifying the impact of financial development on economic development. Rev. Econ. Dyn. 2013, 16, 194–215. [Google Scholar] [CrossRef]
  17. Zhou, Y.; Zhang, S. Financial Misallocation, Asset Specificity and Capital Structure. Account. Res. 2014, 75–80, 97. [Google Scholar]
  18. Guo, F.; Wang, J.; Wang, F.; Kong, T.; Zhang, X.; Cheng, Z. Measuring China’s Digitial Financial Inclusion: Index Compilation and Spatial Characteristics. China Econ. Q. 2020, 19, 1401–1418. [Google Scholar]
  19. Sun, Y.; Zhang, T.; Wang, X.; Li, D. Status, Problems, and Prospects of Digital Inclusive Finance in China. J. Quant. Tech. Econ. 2021, 38, 43–59. [Google Scholar]
  20. Tang, S.; Wu, X.; Zhu, J. Digital Finance and Enterprise Technology Innovation: Structural Feature, Mechanism Identification and Effect Difference under Financial Supervision. Manag. World 2020, 36, 52–66. [Google Scholar]
  21. Ren, B.; Li, L. Does Digital Inclusive Finance Promote Inclusive Growth in Rural Areas? A Study on the Survey Data from 2114 Rural Residents in Beijing, Tianjin and Hebei Provinces. Mod. Financ. Econ.-J. Tianjin Univ. Financ. Econ. 2019, 39, 3–14. [Google Scholar]
  22. Wang, Y.; Ye, X.; Xu, L. Can Digital Finance Boost the Real Economy. Financ. Econ. 2020, 2020, 1–13. [Google Scholar]
  23. Demertzis, M.; Merler, S.; Wolff, G. Capital Markets Union and the fintech opportunity. J. Financ. Regul. 2018, 4, 157–165. [Google Scholar] [CrossRef]
  24. Zhao, X.; Zhong, S.; Guo, X. Digital inclusive finance development, financial mismatch mitigation and enterprise innovations. Sci. Res. Manag. 2021, 42, 158–169. [Google Scholar]
  25. Hou, C.; Li, B. Does Fintech Increase Total Factor Productivity?—Empirical Evidence from Peking University Digital Inclusive Financial Index. Financ. Econ. 2020, 2020, 1–12. [Google Scholar]
  26. Hui, X. Digital Financial Inclusion and Urban Green Total Factor Productivity: Inherent Mechanisms and Empirical Evidence. South China Financ. 2021, 2021, 20–31. [Google Scholar]
  27. Ni, Y.; Chen, B.; Wang, Y. Financial Development, Environmental Regulation and Green Total Factor Productivity—An Empirical Analysis Based on Spatial Durbin Model. J. Guizhou Univ. Financ. Econ. 2020, 38, 12–21. [Google Scholar]
  28. Lu, L. Promoting SME finance in the context of the fintech revolution: A case study of the UK’s practice and regulation. Bank. Financ. Law Rev. 2018, 33, 317–343. [Google Scholar]
  29. Xing, Y. “Dividend” and “Gap” of Rural Digital Inclusive Finance. Economist 2021, 2, 102–111. [Google Scholar]
  30. Yi, X.; Zhou, L. Does Digital Financial Inclusion Significantly Influence Household Consumption? Evidence from Household Survey Data in China. J. Financ. Res. 2018, 11, 47–67. [Google Scholar]
  31. Li, J.; Wu, Y.; Xiao, J. The impact of digital finance on household consumption: Evidence from China. Econ. Model. 2020, 86, 317–326. [Google Scholar] [CrossRef]
  32. Xu, Z.; Zhang, L.; Liu, Y. Does the Development of Digital Inclusive Finance Enhance Regional Innovation Capability? Financ. Econ. 2020, 11, 17–28. [Google Scholar]
  33. Yang, J.; Xiao, M.; Lv, P. Does Digital Inclusive Finance Promote the Technology Innovation of Small and Micro Enterprise? An Empirical Study Based on the data of China Small and Micro Enterprise Survey. J. Zhongnan Univ. Econ. Law 2021, 119, 131–160. [Google Scholar]
  34. Kuznets, S. Modern economic growth: Findings and reflections. Am. Econo. Rev. 1973, 63, 247–258. [Google Scholar]
  35. Syrquin, M.; Chenery, H. Three decades of industrialization. World Bank Econ. Rev. 1989, 3, 145–181. [Google Scholar] [CrossRef]
  36. Wu, F.; Liu, R. Industrial Upgrading and Independent Innovation Ability Construction—Empirical Research Based on China’s Provincial Panel Data. China Ind. Econ. 2013, 2013, 57–69. [Google Scholar]
  37. Chava, S.; Oettl, A.; Subramanian, A.; Subramanian, K.V. Banking deregulation and innovation. J. Financ. Econ. 2013, 109, 759–774. [Google Scholar] [CrossRef]
  38. Fisman, R.; Love, I. Trade credit, financial intermediary development, and industry growth. J. Financ. 2003, 58, 353–374. [Google Scholar] [CrossRef]
  39. Bruhn, M.; Love, I. The real impact of improved access to finance: Evidence from Mexico. J. Financ. 2014, 69, 1347–1376. [Google Scholar] [CrossRef]
  40. Luo, G.; Wang, H. The Impact of Digital Inclusive Finance on the High-Quality Development of Agriculture in China’s Main Grain Producing Areas. Econ. Rev. J. 2022, 2022, 107–117. [Google Scholar]
  41. Kongsamut, P.; Rebelo, S.; Xie, D. Beyond balanced growth. Rev. Econ. Stud. 2001, 68, 869–882. [Google Scholar] [CrossRef]
  42. Schumpeter, J.A. Business Cycles; Mcgraw-Hill: New York, NY, USA, 1939; pp. 161–174. [Google Scholar]
  43. Solow, R.M. Technical change and the aggregate production function. Rev. Econ. Statist. 1957, 39, 312–320. [Google Scholar] [CrossRef]
  44. Zhou, S.; Wang, W. Scientific—Technical Innovation; the Optimalization Upgrade of Industrial Structure. J. Manag. World 2001, 5, 1512–1529. [Google Scholar]
  45. Brown, J.; Martinsson, G.; Petersen, B. Do financing constraints matter for R&D? Eur. Econ. Rev. 2012, 56, 1512–1529. [Google Scholar]
  46. Sasidharan, S.; Lukose, P.; Komera, S. Financing constraints and investments in R&D: Evidence from Indian manufacturing firms. Quarterly Rev. Econ. Financ. 2015, 55, 28–39. [Google Scholar]
  47. Gong, B.; Zhang, S.; Wang, S. 70 Years of Technological Progress in China’s Agricultural Sector. Issues Agric. Econ. 2020, 2020, 11–29. [Google Scholar]
  48. Syrquin, M. Economic Structure and Performance; Academic Press: New York, NY, USA, 1984; pp. 75–101. [Google Scholar]
  49. Chenery, H.; Robinson, S.; Syrquin, M.; Feder, S. Industrialization and Growth; Oxford University Press: New York, NY, USA, 1986. [Google Scholar]
  50. Grossman, G.; Helpman, E. Innovation and Growth in the Global Economy; MIT Press: Cambridge, MA, USA, 1991. [Google Scholar]
  51. Lucas, R.E., Jr. Making a miracle. Econom. J. Econom. Soc. 1993, 61, 251–272. [Google Scholar] [CrossRef]
  52. Liu, W.; Zhang, H. Structural Change and Technical Advance in China’s Economic Growth. Econ. Res. J. 2008, 43, 4–15. [Google Scholar]
  53. Cai, Y.; Fu, Y. The Technical and Structural Effects of TFP Growth: Measurement and Decomposition Based on China’s Macro and Sector Data. Econ. Res. J. 2017, 52, 72–88. [Google Scholar]
  54. Huang, L.; Wang, X.; Liu, S.; Han, Y. Regional Interaction of Industrial Structure Change in China-Provincial Competition in Horizontal Direction and Local Follow-up in Vertical Direction. China Ind. Econ. 2015, 2015, 82–97. [Google Scholar]
  55. Lu, F.; Huang, Y.; Xu, P. Regional Differences and Influencing Factors of Inclusive Finance in China. Financ. Econ. Res. 2017, 32, 111–120. [Google Scholar]
  56. Andersen, P.; Petersen, N. A procedure for ranking efficient units in data envelopment analysis. Manag. Sci. 1993, 39, 1261–1264. [Google Scholar] [CrossRef]
  57. Huang, S.; Sun, S.; Gong, M. The Impact of Land Ownership Structure on Agricultural Economic Growth: An Empirical Analysis on Agricultural Production Efficiency on the Chinese Mainland (1949–1978). Soc. Sci. China 2005, 3, 38–47. [Google Scholar]
  58. Li, B.; Zhang, J.; Li, H. Research on Spatial-temporal Characteristics and Affecting Factors Decomposition of Agricultural Carbon Emission in China. China Popul. Resour. Environ. 2011, 21, 80–86. [Google Scholar]
  59. Baron, R.; Kenny, D. The moderator–mediator variable distinction in social psychological research: Conceptual, strategic, and statistical considerations. J. personal. Soc. Psychol. 1986, 51, 1173–1182. [Google Scholar] [CrossRef]
  60. Qiu, B.; Yang, S.; Xin, P. Research on FDI Technology Spillover Channels and China’s Manufacturing Productivity Growth: An Analysis Based on Panel Data. J. World Econ. 2008, 8, 20–31. [Google Scholar]
  61. Thomas, V.; Wang, Y.; Fan, X. Measuring education inequality: Gini coefficients of education for 140 countries, 1960–2000. J. educ. Plan. Adm. 2003, 17, 5–33. [Google Scholar]
  62. Kuang, Y.; Zhou, L. Research on the Industrial Structure Effect of Farmland Circulation. Economist 2016, 2016, 90–96. [Google Scholar]
  63. Sun, X.; Yu, T.; Yu, F. The Impact of Digital Finance on Agricultural Mechanization: Evidence from 1869 Counties in China. Chin. Rural Econ. 2022, 2022, 76–93. [Google Scholar]
  64. Fu, Q.; Huang, Y. Digital Finance’s Heterogeneous Effects on Rural Financial Demand: Evidence From China Household Finance Survey and Inclusive Digital Finance Index. J. Financ. Res. 2018, 11, 68–84. [Google Scholar]
Figure 1. Theoretical mechanism analysis diagram.
Sustainability 14 11450 g001
Table 1. The input variables.
Variable NameVariable CharacteristicsUnit
Land inputThe sown area of crops.Thousand hectares
Labor inputMultiplying the employment of the primary industry by the proportion of agricultural added value in the added value of agriculture, forestry, animal husbandry and fishery [57].Ten thousand people
Mechanical power inputThe total power of agricultural machinery.10,000 kilowatts
Draft animals’ inputThe number of large livestockMillion head
Irrigation inputEffective irrigated areaThousand hectares
Pesticide inputPesticide usage.Tons
Agricultural film inputThe amount of agricultural film used10,000 tons
Fertilizer inputThe pure amount of chemical fertilizer application.10,000 tons
Table 2. The output variables.
Variable NameVariable Characteristics
Expected outputIn order to eliminate the price factor, this paper selects the total agricultural output value of each provincial unit obtained by deflating 2011 as the base period, the unit is 100 million yuan.
Unexpected outputAgricultural undesired output refers to agricultural carbon emissions. Agricultural carbon emission mainly refers to the greenhouse gases directly or indirectly produced in the process of agricultural production due to chemical fertilizer, pesticides, energy consumption and land tillage. Based on the research of Li [58], taking agricultural carbon emission as the unexpected output, this paper selects six carbon sources of agricultural carbon emission in the process of agricultural production: chemical fertilizer, pesticide, agricultural film, diesel, tillage, and agricultural irrigation to calculate the total amount of agricultural carbon emission.
Table 3. Control variables.
Variable NameVariable CharacteristicsExpected Direction
Agricultural structure (STR)The proportion of the added value of agriculture in the added value of agriculture, forestry, animal husbandry and fishery.Positive
Income distribution (IND)The ratio of the per capita net income of rural households to the per capita disposable income of urban households.Positive
Degree of disaster (NAT)The proportion of the affected area to the total sown area of crops.Negative
Degree of agricultural mechanization (MEC)The total power of agricultural machinery per unit sown area.Uncertain
Education level (EDU)Drawing on existing research results, it is measured by the average years of education [61].Positive
Level of financial support to agriculture (FIN)The proportion of agricultural fiscal expenditure to total fiscal expenditure.Positive
Table 4. Descriptive statistical analysis.
VariableMeanStandard DeviationMeanStandard DeviationMeanStandard DeviationMeanStandard DeviationMeanStandard Deviation
NationalEasternCentralWesternNortheast
AGTFP1.06660.17041.07290.25971.03420.11511.06570.17711.11340.2640
Index5.07300.67005.23500.55315.03090.68594.96380.73395.01710.6858
Coverage4.90370.83225.14320.58374.81460.82954.74451.00104.86750.7180
Usage5.05780.64425.26500.51085.07570.59284.87890.72594.98720.6532
Digital5.39230.73355.35010.81945.39820.72095.42760.66105.39130.7479
STR0.57650.09000.53870.06390.56950.07010.61910.09690.56070.1107
IND2.67060.46902.39330.25162.59480.24613.08810.38922.21610.4570
NAT0.16070.11850.12190.12220.16390.09370.18780.12320.18360.1039
MEC0.63270.23560.80460.28690.63620.15180.50910.12650.50510.0899
EDU6.91470.09686.99400.09976.89650.05136.85320.07226.91270.0336
FIN0.11340.03080.08870.02940.11340.00810.13250.02310.12570.0319
YH0.26780.08130.25870.05990.25920.10730.28380.08830.25640.0429
Table 5. Benchmark regression results.
Fixed Effect (1)Fixed Effect (2)Random Effect (3)
Index0.2745 ***0.2509 ***0.2463 ***
(3.79)(4.17)(5.54)
STR 6.1386 **3.0952 **
(2.62)(2.05)
IND 0.5089 **0.2722 **
(2.29)(2.37)
NAT −0.4556 *−0.3072
(−1.7)(−1.02)
MEC 0.33790.2765
(1.06)(1.21)
EDU 2.41511.1590
(1.56)(0.82)
FIN 2.73481.7398
(0.57)(0.35)
-Cons −21.9347 *−10.6924
(−1.77)(−0.98)
N231210210
R 2 0.18540.34550.3189
Note: ① ***, **, * refer to the statistics being significant at the 1%, 5% and 10% levels, respectively. ② The brackets of regression (1) and (2) are the t-values of the coefficients, and the brackets of regressions (3) are the z-values of the coefficients.
Table 6. Regression results of mediation effect.
VariableBenchmark RegressionMediation Effect
AGTFP (4)YH (5)AGTFP (6)
Index0.2509 ***0.0085 *0.2385 ***
(4.17)(1.95)(4.22)
YH 2.4852 *
(1.78)
STR6.1386 **0.4056 ***5.3222 **
(2.62)(2.95)(2.53)
IND0.5089 **−0.00760.5528 **
(2.29)(−0.51)(2.43)
NAT−0.4556 *−0.0074−0.4215
(−1.7)(−0.37)(−1.53)
MEC0.3379−0.02720.4079
(1.06)(−0.87)(1.26)
EDU2.41510.05062.6195 *
(1.56)(0.34)(1.71)
FIN2.7348−0.2852 *3.0672
(0.57)(−1.90)(0.65)
-Cons−21.9347 *−0.2874−23.6824 *
(−1.77)(−0.27)(−1.93)
N210209206
R 2 0.34550.22100.3738
Note: ① ***, **, * refer to the statistics being significant at the 1%, 5% and 10% levels, respectively. ② The inside of regression parentheses are t values of coefficients.
Table 7. Regression results of robustness test.
Excluding Municipalities Directly under the Central Government (7)The Core Explanatory Variable with a Lag Period (8)Distance to Hangzhou City (9)
Index0.1818 ***0.2038 **0.3840 ***
(4.22)(2.16)(3.91)
STR6.2091 ***5.7614 ***5.0170 ***
(3.75)(4.98)(4.64)
IND0.3122 **0.23250.6452 ***
(2.21)(1.21)(2.69)
NAT−0.2444−0.3831−0.4683
(−1.19)(−1.35)(−1.63)
MEC0.28780.22180.2732
(1.41)(0.88)(1.06)
EDU0.98551.73870.8367
(0.79)(1.24)(0.64)
FIN0.53190.72811.8371
(0.12)(0.26)(0.47)
-Cons−11.0024−15.5710−10.9896
(−1.14)(−1.47)(−1.15)
N178184188
R 2 0.29630.81340.7455
Note: ① ***, ** refer to the statistics being significant at the 1% and 5% levels, respectively. ② The inside of regression parentheses are t values of coefficients.
Table 8. Analysis of regression results of heterogeneity in different dimensions.
Coverage (10)Usage (11)Digital (12)
Coverage0.1684 ***
(2.79)
Usage 0.21516 ***
(3.13)
Digital 0.1817 ***
(4.71)
STR4.9417 *5.4019 *4.9686 *
(1.81)(2.01)(1.84)
IND0.4415 *0.3801 *0.3892 **
(1.83)(1.70)(2.18)
NAT−0.3864−0.4080−0.4901 *
(−1.27)(−1.35)(−1.78)
MEC0.53850.53200.4455
(1.41)(1.39)(1.25)
EDU3.3934 *3.1668 *3.0471
(1.88)(1.81)(1.63)
FIN2.60132.37063.8853
(0.57)(0.25)(0.74)
-Cons−27.4989 *−26.2652 *−25.2074 *
(−1.98)(−1.92)(−1.72)
N214214214
R 2 0.29180.30210.3052
Note: ① ***, **, * refer to the statistics being significant at the 1%, 5% and 10% levels, respectively. ② The inside of regression parentheses are t values of coefficients.
Table 9. Analysis of regional heterogeneity regression results.
Eastern (13)Central (14)Western (15)Northeast (16)
Index0.3033 ***0.1563 *0.2249 *−0.0069
(3.92)(2.14)(2.09)(−0.02)
STR−2.52683.73340.716323.0129
(−1.55)(1.77)(0.18)(1.39)
IND0.02120.1629−0.5122−0.2295
(0.07)(0.99)(−0.79)(−0.67)
NAT−0.1660−0.0480−2.3790 *−0.0900
(−0.6)(−0.21)(−1.84)(−0.16)
MEC0.6337−0.2306−1.00191.1287
(1.05)(−1.44)(−0.79)(0.47)
EDU0.2924−1.4865−8.26800.8953
(0.12)(−1.84)(−1.18)(0.06)
FIN3.2511−5.7032−3.908620.7254
(0.63)(−1.24)(−0.77)(0.74)
-Cons−1.69428.925359.6202−19.7178
(−0.11)(1.44)(1.14)(−0.22)
N80488824
R 2 0.35090.47280.40280.5905
Note: ① ***, * refer to the statistics being significant at the 1% and 10% levels, respectively. ② The inside of regression parentheses are t values of coefficients.
Publisher’s Note: MDPI stays neutral with regard to jurisdictional claims in published maps and institutional affiliations.

