Article

Towards a Systematic Description of Fault Tree Analysis Studies Using Informetric Mapping

1
College of Quality and Safety Engineering, China Jiliang University, Hangzhou 310018, China
2
Faculty of Electrical Engineering, Automatics, Computer Science and Biomedical Engineering, AGH University of Science and Technology, 30-059 Kraków, Poland
*
Author to whom correspondence should be addressed.
Sustainability 2022, 14(18), 11430; https://doi.org/10.3390/su141811430
Submission received: 18 July 2022 / Revised: 25 August 2022 / Accepted: 8 September 2022 / Published: 12 September 2022

Abstract

:
Fault tree analysis (FTA) is one of the important analysis methods of safety system engineering commonly utilized in various industries to evaluate and improve the reliability and safety of complex systems. To grasp the current situation and development trend of FTA research and to further point out FTA’s future development directions, 1469 FTA-related articles from the literature were retrieved from the SCIE and SSCI databases. Informetric methods, including co-authorship analysis, co-citation analysis and co-occurrence analysis, were adopted for analyzing the cooperation relationship, research knowledge base, research hotspots and frontier in the FTA research field. The results show that China has the highest number of publications, and the Loughborough University of England has the highest number of publications of relevant institutions. Dynamic fault tree analysis, fuzzy fault tree analysis and FTA based on binary decision diagrams are recognized as the knowledge bases in FTA studies. “Reliability Engineering and System Safety”, “Safety Science” and “Fuzzy Sets and Systems” are the core journals in this field. Fuzzy fault tree analysis, dynamic fault tree analysis based on Bayesian networks and FTA combined with management factors may be both the main research hotspots and the frontiers. Then, by deriving the above results, this study can help scholars better master the current research status and frontiers of FTA to improve system reliability and safety.

1. Introduction

In modern industrial production, the widespread use of new technologies, equipment and materials has greatly improved production efficiency and saved production costs. In addition, due to the use of these new technologies, equipment and materials, many potential risks and uncertainties have also been introduced into the system, and the problem of system reliability and safety is becoming more prominent. Within the previous studies and applications, the common methods used for system reliability and safety analysis include FTA [1,2], failure mode and effect analysis [3,4] and event tree analysis [5]. Among them, FTA, as a deductive analysis method combining qualitative and quantitative analysis, can effectively evaluate and improve the reliability and safety of complex systems [6,7]. For a traditional fault tree, it mainly consists of event symbols and gate symbols. Event symbols represent various fault states or abnormal conditions in a fault tree, and gate symbols describe the logical relationships between various events in a fault tree, which are used for input and output events [8]. A diagram of a generic FTA is shown in Figure 1. When using the FTA method, we often start the analysis from the top event and search for the direct and indirect causes of the accident from top to bottom, layer by layer [9]. Then, the underlying causes of the accident are identified, and the logical relationships between the events are represented by a fault tree. This method was first introduced by Watson in 1961 and was successfully applied to the analysis and design of Minuteman missile launch control systems [10]. Since then, FTA has been widely used in reliability assessment and risk analysis [11,12]. For example, FTA is commonly applied to the reliability analysis of petrochemical plants [13,14], the identification and analysis of hazard sources in the environment [15], and the safety and accident evaluation of nuclear reactors [2]. These applications of FTA not only improve system safety and reliability but also have a positive significance in preventing environmental pollution and human life and health problems caused by accidents.
However, in practical applications, as large systems are becoming more dynamic and complex (e.g., repairable systems with redundancy and systems with sequential correlations), the limitations of the traditional FTA are becoming increasingly prominent. These limitations mainly include the inapplicability of traditional FTA to systems with large amounts of fuzzy uncertainty [16,17] and systems with dynamic stochastic faults [18,19]. Based on this limitation, many improvement methods have been introduced by different scholars. To solve the uncertainty of event probability in traditional FTA, Tanaka et al. [20] proposed fuzzy fault tree analysis by pioneering the introduction of fuzzy theory into FTA. After that, many scholars conducted in-depth analyses and research on fuzzy fault tree analysis and tried to apply it to solve reliability problems in engineering. Geymayr et al. [21] presented a fuzzy fault tree analysis to assess reliability and safety in industrial systems. By combining fuzzy set theory and expert elicitation, the reliability of robotic drilling systems was evaluated by Lin [22]. In addition, Shu et al. [23] also proposed an algorithm of the intuitionistic fuzzy fault tree analysis for the failure analysis problem of the printed circuit board assembly. Moreover, to overcome the limitation of the traditional FTA being unable to handle the system’s dynamic behavior, Dugan et al. [24,25] proposed dynamic fault tree analysis for the dynamic characteristics of the system failure process related to the failure time and sequence. They introduced four new dynamic logic gates, namely Priority-And Gate, Sequence-Enforcing Gate, Functional Dependency and Spare Gate, to describe the system’s dynamic behavior in the dynamic fault tree, which complements the FTA in the reliability safety evaluation of complex systems. In addition, in solving dynamic fault trees, Markov chains [26], Monte-Carlo-simulation-based methods [27,28] and Bayesian-network-based approaches [29,30] have been more widely used.
The literature mentioned above reflects that the basic theory of traditional FTA has been completed, and new studies about optimization and application are rapidly advancing. These achievements are accompanied by the research field’s continuous subdivision, which makes the evolution and frontiers of FTA studies more blurred, and it may bring the field to a standstill in the future. Therefore, work is necessary for the identification of evolutions and frontiers in the research field of FTA. In earlier research, such work was often conducted through literature reviews or through systematic monographs that senior scholars wrote. As the volume of scientific and technical text data explode in the information age, it becomes time-consuming and laborious to rely solely on experts’ works, and the personal limitations of experts may be integrated into the analysis. Fortunately, informetrics can be used to overcome these limitations. Informetrics has evolved from traditional bibliometrics and scientometrics [31]. Since the German scholar Professor Otto Nacke introduced the term informetrie in 1979, the field has rapidly attracted the eager exploration of intelligence scholars worldwide [32]. Now, it has developed into an interdisciplinary field that integrates mathematics, statistics and bibliography knowledge. With the help of informetrics, complicated research fields can be presented by data mining, information processing, knowledge measurements and graphical mapping [33,34]. Many scholars have already applied informetric methods to bibliometric studies [35,36,37], which provide a whole and critical reference for the specific research field. In this paper, we systematically analyze FTA’s research situation in the whole field from the perspective of informetrics by using knowledge mapping, which can help researchers of safety science and reliability technology master the discipline status and research priorities in the field. Moreover, this paper also analyzes the research hotspots and frontiers of FTA according to the theme terms’ changes in the time dimension and makes some suggestions for future research directions. This paper’s research results can positively affect system reliability and safety improvement. The specific questions for studying FTA using knowledge mapping are as follows:

2. Data and Methods

2.1. Data Sources and Distribution of Literature Types

Informetric studies demand reliable data as support. In this study, SCI-E and SSCI in the Web of Science were selected as the target database for literature retrieval. However, the different retrieval methods, the data volume of the retrieval results, and the different expressions of FTA may impact the study’s outcome. Therefore, we designed six retrieval strategies and established the retrieval data set for comparison, as shown in Table 1.
As can be seen from Table 1, the literature volume and retrieval formula in the data set A∪B is the most reasonable, and the ACI (Average Citations per Item) of the literature in the retrieval period is the highest. This indicates that the overall quality of the literature included in this data set is the highest. Therefore, the retrieval formula was finally set as TS = “fault tree analysis” OR “accident tree analysis”, and the retrieval time was from 1995 to 2021 (publication deadline 31 December 2021). Then, 1469 records were obtained, and the types of literature were shown in Table 2. The most frequent literature type in these records is articles (1419), accounting for 96.60%. The second and third positions are proceedings papers (137) and review articles (33), which account for 9.33% and 2.25%, respectively. Other literature types include early access (18), meeting abstracts (8), editorial material (3), letters (2), notes (2), corrections (1) and reprints (1).

2.2. Method

With the development of informetric theory and data visualization technology, scientific knowledge mapping applications have rapidly developed. A series of analysis software, such as VOSviewer [38] and Citespace, has become an essential method to study development trends in scientific fields. The knowledge map drawing procedure and visualization analysis is shown in Figure 2. After obtaining the data set A ∪ B, we first used VOSviewer 1.6.17 (Leiden University, Leiden, The Netherlands) to remove duplicates and to merge different variants. Then, the visual analysis was performed on the pre-processed literature data by VOSviewer and Scimago Graphica Beta 1.0.18 (SRG, Madrid, Spain) [39].
This paper’s visual analysis based on informetrics is composed of two main parts: (1) performance analysis and (2) research hotspots and frontiers analysis. In the first part, the co-authorship analysis in Section 3.2.1, Section 3.2.3 and Section 3.4 is carried out preliminarily to visualize the cooperative relationships among countries, institutions and scholars, respectively [40]. Then, in Section 3.5.1 and Section 3.5.2, the co-citation analysis is applied to analyze the co-cited reference and co-cited journals [41,42]. In Section 3.3, the citation analysis is conducted to examine the highly cited references and to identify the relationships between the currently highly cited papers. For the second part, in Section 3.6.1, the co-occurrence analysis [43] is first applied to carry out a static analysis of keywords to explain the keywords’ characteristics and meanings. Then, in Section 3.6.2, the dynamic co-occurrence map of keywords is also drawn, and the research evolution path and the changes in research hotspots are sorted out. Finally, in Section 3.6.3, based on the above research, a cluster analysis of the recent theme terms in the literature from 2012–2021 is performed to detect frontiers in FTA research.

3. Results and Discussion

3.1. Temporal Distribution Map of the Literature

3.1.1. Temporal Distribution of the Literature Globally

The distribution of the number of published literature and the frequency of citations per year are shown in Figure 3. Generally, the FTA research can be divided into three stages.
The first stage is the wave development stage (1995–2008). The amount of published literature in this stage was relatively small. From 1995 to 2008, the annual average amount of published literature did not exceed 45 per year, with no apparent fluctuations or growth trends. In addition, the high citation frequency of the literature in 2001 and 2004 indicates that the literature published in these two years laid some foundation for subsequent research.
The second stage is the stable development stage (2008–2018). The average annual amount of literature was shown to increase steadily during this stage due to the rapid increase in the number of Chinese publications. Fluctuations were presented in 2014 and 2018 but were minor compared to the annual amount of published literature, so they still showed a stable growth trend. Therefore, it can be considered that the study of FTA has become more mature and has started to enter a systematic study stage.
The third stage is the rapid development stage (2018-present). Compared with the previous stage, the amount of published literature in this stage showed rapid growth. A total of 34 more papers were published in 2019 than in 2018, which was the most significant increase over the past 12 years. This increasing phenomenon indicates that the research on FTA has attracted the wide attention of scholars, and in the future, the related research in this field will continue to develop with high enthusiasm.

3.1.2. Temporal Distribution of the Literature by Active Nations

The four most active countries in the FTA research field are regarded as China, the United States, the United Kingdom and South Korea. The temporal distribution of the literature originating from these countries was analyzed, as shown in Figure 4. From the figure, we can see in the research field of FTA that the United States started the earliest, but the quantity of published literature per year did not show a significant growth trend. China’s research in this field started the latest, but in 2009, China’s publishing volume surpassed that of the United States for the first time and then rose rapidly in this field. At this stage, research on FTA in China was often combined with engineering construction and accident analysis [44]. It also can be noticed that the quantity of published literature in England and South Korea was similar, with an overall increasing trend.

3.2. Spatial Distribution Map of the Literature

3.2.1. Country/Region Distribution

From the data set in Section 2.1, it can be seen that 68 countries have published literature related to FTA. The top 10 countries from the total number of publications were selected, as shown in Table 3, and the literature quantity and H-index were displayed on the map, as shown in Figure 5. In this table, quantity represents the number of publications in each country; percentage denotes its proportion in the total literature; H-index denotes the impact of a country’s publications; total link strength denotes the frequency of collaboration between countries; and ACI represents the average number of citations of literature published in a country, which reflects the average quality of a country’s publications.
As can be seen from the Table, China, the United States and the United Kingdom are ranked in the top three in quantity, H-index and total link strength, respectively. These countries have much international cooperation, high-impact papers and domination of the research field of FTA. The amount of literature published by Chinese scholars is the most, but the ACI is not as good, indicating that studies on FTA stay at the primitive stage. This situation may be related to the late start of studies in China. It also means that there is more space for studies of FTA development in China. In addition, from Table 3, we also can find that the number of publications, H-index and total link strength exhibit a positive correlation. It can be assumed that a relationship exists between the discipline’s influence, the number of publications and international collaborations.
The level of cooperation between countries and the influence in the relevant research field can be reflected by country co-authorship analysis. In this paper, VOSviewer was used to analyze the country collaborations. After excluding the countries with less than five articles, we obtained a partnership network consisting of 37 countries, as shown in Figure 6. The volume of articles and the level of research activity in different countries/regions are represented by the size of the nodes. We can find that the node representing China is the largest. It suggests that China has published the most articles in the field of FTA, and the research activity is the strongest. The distance between nodes and the thickness of the linkage represents the closeness of cooperation between countries. Thicker connection lines and closer distances between nodes represent closer cooperation between countries. From Figure 6, it can be noticed that the research cooperation on FTA is the closest between China, the United States and the United Kingdom. The different colors in Figure 6 were adopted to distinguish the different clusters between each country, and a total of three clusters were formed: red, green and blue. The results revealed that red and blue clusters dominate all clusters. Moreover, the blue and green clusters are dominated by Asian and European countries, respectively, which indicates geography’s existence in studying international cooperation on FTA.

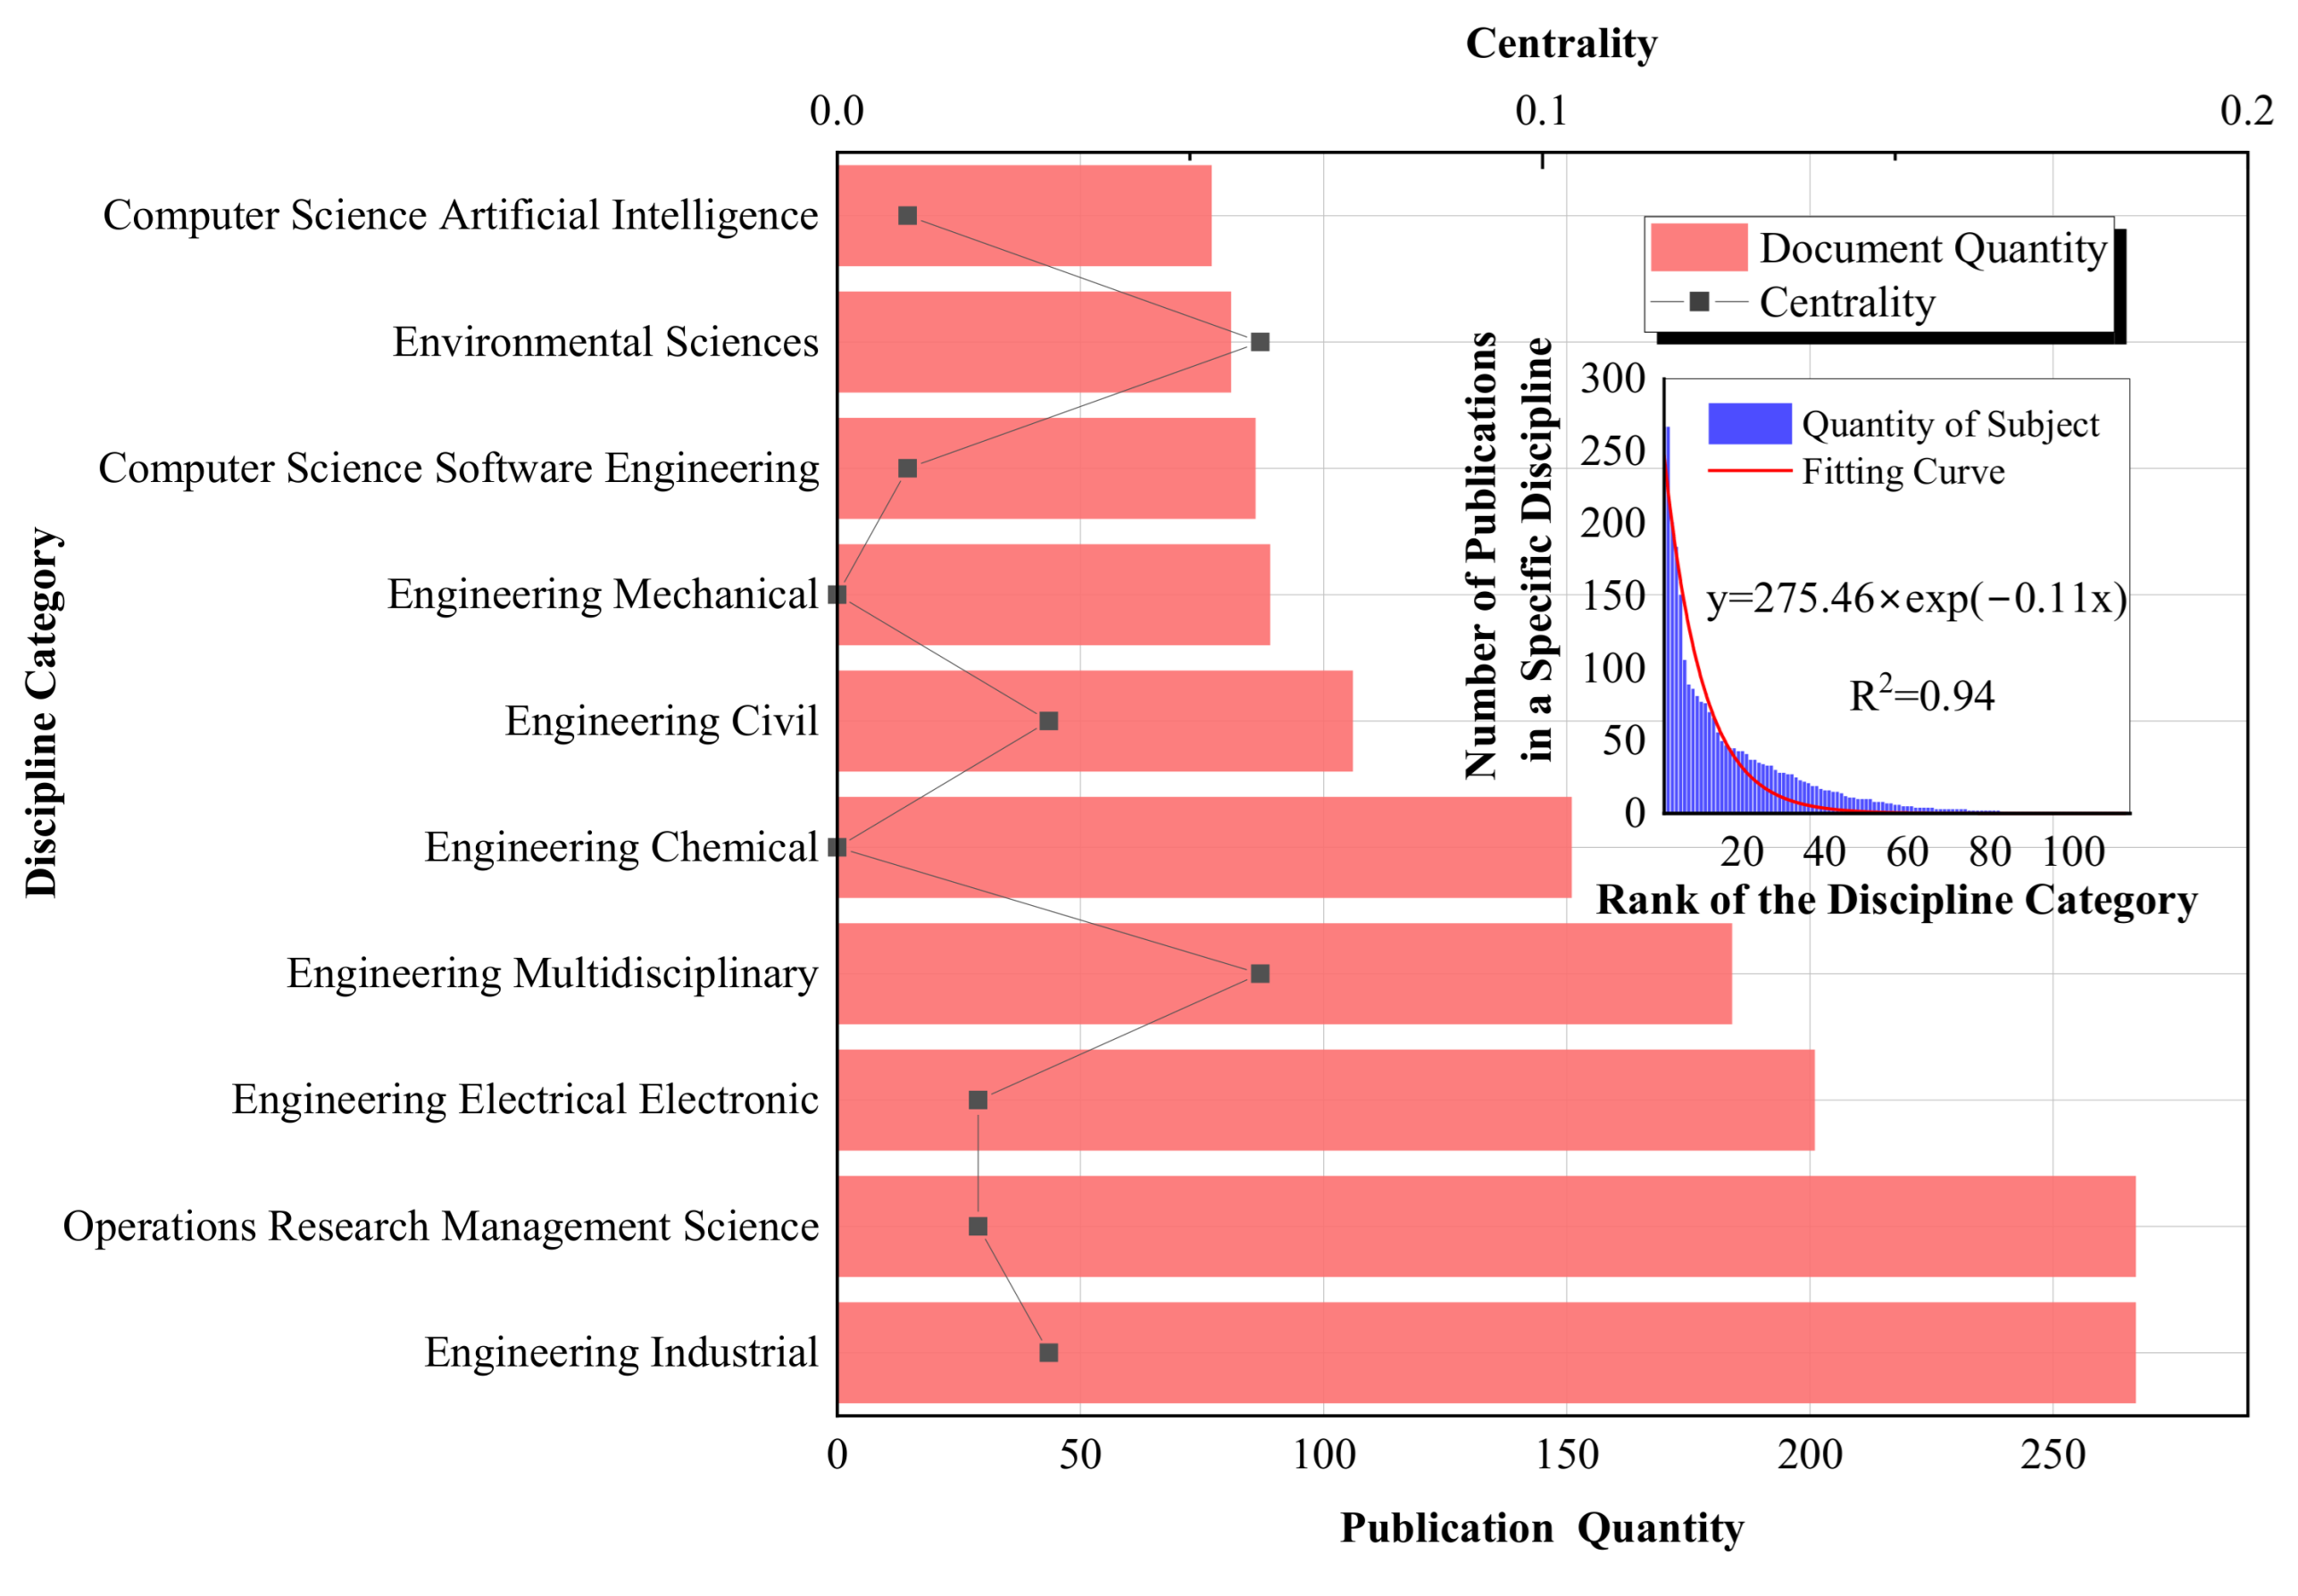
3.2.2. Disciplinary Distribution of the Literature

The disciplinary distribution of the literature can reveal the disciplinary structure of a research field. Therefore, the discipline distribution analysis results can help researchers grasp FTA’s main research objects and provide the basis for detecting research hotspots and frontiers in the later sections. In this paper, a search was conducted in WOS, and the descriptive statistic of the disciplinary literature’s distribution is illustrated in Figure 7. The results indicate that FTA involved a wide range of research fields, distributed over 113 different disciplines. However, this distribution trend was relatively unbalanced, with an overall negative exponential distribution (y = 275.46 × exp(−0.11x), R2 = 0.94). The volume of literature in different disciplines was sorted, and the top 10 disciplines are shown in Figure 7.
In all disciplines, the engineering industrial discipline and the operations research management science had the largest volume of publications, with 267 papers accounting for 18.18% of the total. Then, engineering electrical electronic ranked second, accounting for 13.68% of the total, followed by engineering multidisciplinary (12.52%) and engineering chemical (10.28%). Centrality is a commonly used index used to measure importance. If a discipline’s centrality value is not less than 0.1, it is assumed to be a key discipline in the FTA research field. It can be seen from the centrality data that engineering (0.78), computer science (0.23), environmental science ecology (0.09) and energy fuels (0.06) are the most central disciplines. Based on the above data, we can assume that the studies of FTA often involve engineering, computer science and other technical fields, which are often considered the research background of FTA. Moreover, the disciplinary distribution of operations research management science and environmental science ecology also suggests that research in FTA is a multidisciplinary field.

3.2.3. Institutional Distribution of the Literature

In this section, we analyzed core institutions and the cooperative relationships among institutions in the FTA research field. In addition, by combining the results of this section with the analysis of author cooperation in Section 3.4, the critical research groups in the FTA research field can be easily captured with their migrations in the temporal and spatial dimensions. According to the search results of the WOS core database, 1320 institutions have published literature related to FTA. Details of the 15 institutions with the largest number of publications are listed in Table 4.
Among the 15 institutions, Loughborough University (40), Memorial University of Newfoundland (31) and Korea Advanced Institute of Science and Technology (24) have the top three numbers of publications. Dalhousie University (89.00), Memorial University of Newfoundland (60.03) and Istanbul University of Science and Technology (40.36) have the top three ACI scores. From the table, we can see that Chinese institutions comprise the majority of the top 15 institutions, with 34.70% of the total publications. This indicates that Chinese scholars are relatively active in this field. However, the average ACI of 19.6 for institutions from China is lower than the average ACI of 28.91 for the top 15 institutions. Since the ACI represents a country’s average quality of publications, there is still great space for studies on FTA in China.
Institutions with no fewer than five publications were filtered out by VOSviewer, yielding 96 records. To better analyze the cooperative relationship between institutions, clusters below two institutions were removed, and 11 clusters were derived. We also introduced a time factor in the figure to study the evolution of the institutions’ cooperation, as shown in Figure 8. As we can see from this figure, the amount of literature is represented by node size, and different colors represent different clusters. Memorial University of Newfoundland, Loughborough University and Korea Advanced Institute of Science and Technology are the leading research institutions in FTA studies. From the active time of research institutions, it can be seen that FTA was studied the earliest by institutions in developed countries in Europe and North America. Then, with international academic cooperation, research in this field gradually expanded from Europe and the United States to other countries. For example, research groups led by Loughborough University and the Memorial University of Newfoundland have begun to cooperate with Chinese institutions in FTA studies in the last decade. It can be noticed that the University of Electronic Science and Technology of China has developed a sizeable academic influence in the field of FTA studies. This institution has conducted extensive research on the issue of uncertainty in FTA applications, and highly active research within this institution was conducted by Yang et al. In a study, they quantified and propagated the uncertainty and imprecision in FTA using evidential networks for an FTA of a damaged aircraft engine [45]. Moreover, Liu et al. [46] proposed an FTA algorithm that incorporates subjective information into imprecise reliability models of basic events for calculating the failure interval of lube oil warning systems in this institution. In addition, it can be noted from Figure 8 that there is a clear geographical feature of the cooperation between institutions studying FTA. For example, the University of Chinese Academy of Sciences, Beijing Institute of Technology and the China University of Petroleum are all from China and have cooperation relationships.

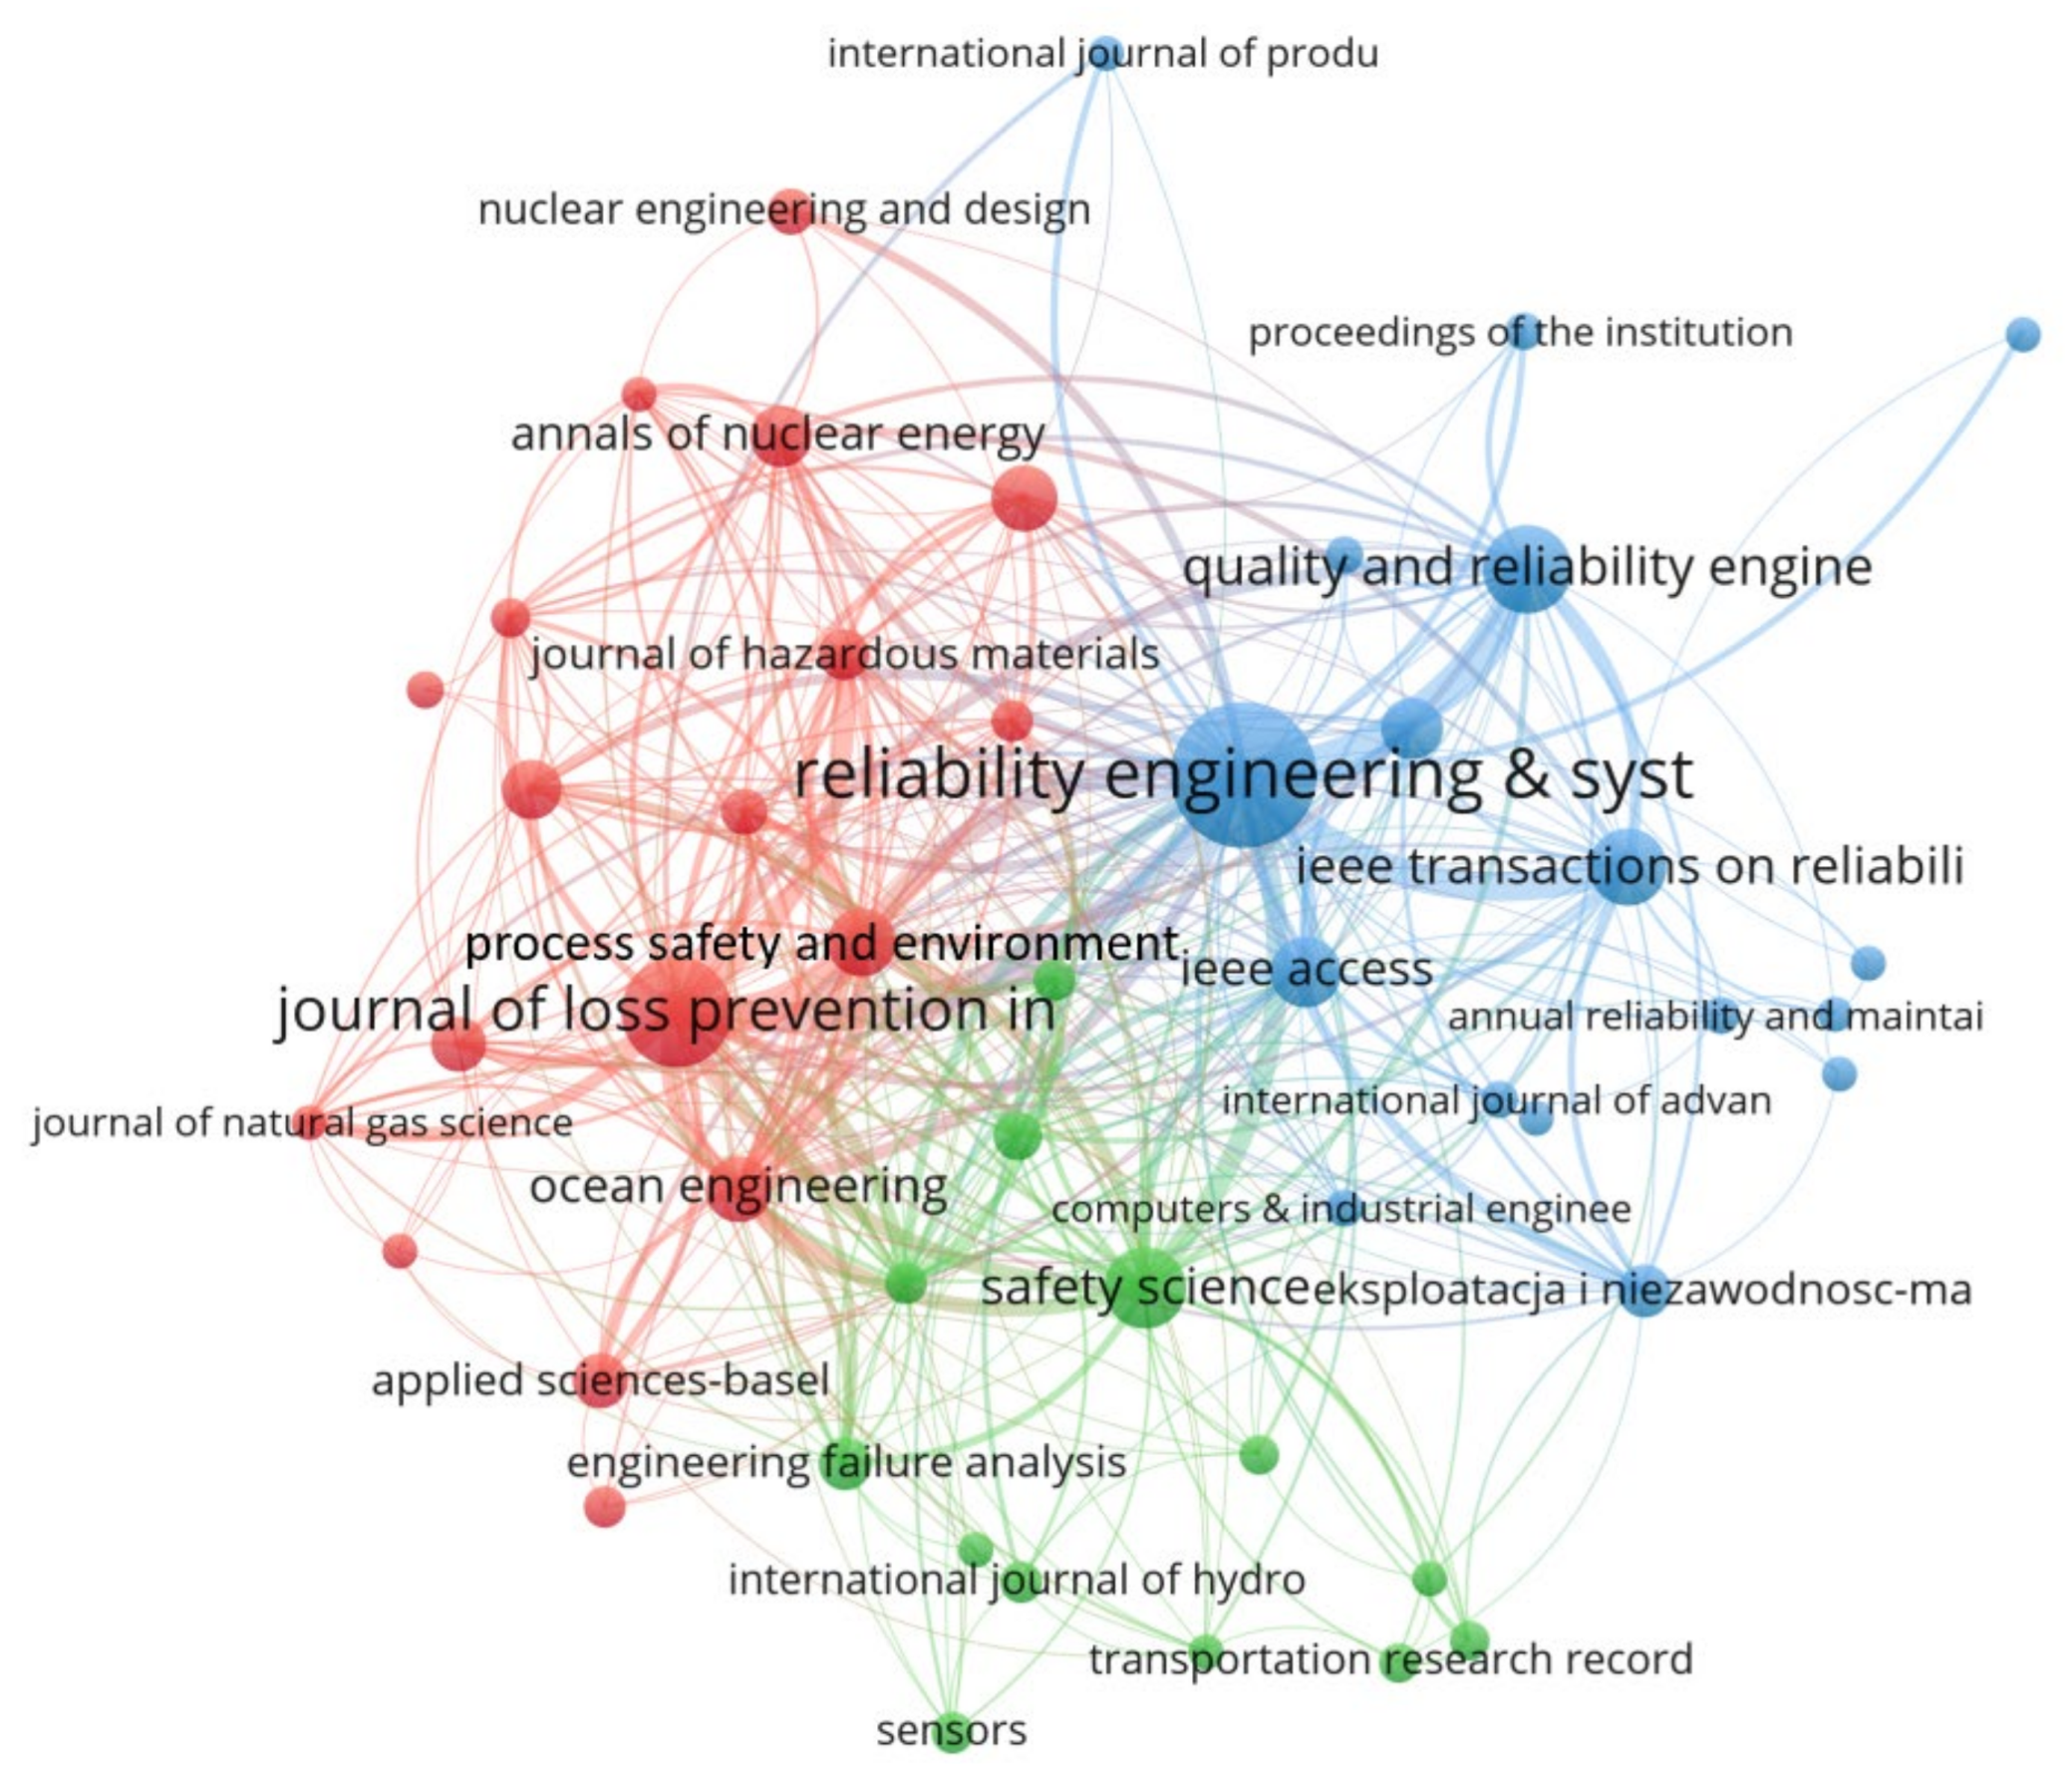
3.2.4. Journal Distribution

Academic journals are an essential information carrier for the communication of scientific results. In this section, we analyze the distribution of journals in FTA studies by VOSviewer, and the results show that 1469 papers originated from 474 journals. Journals with fewer than six publications were filtered out, and 48 records were obtained, forming a network of major journals, including three different clusters as shown in Figure 9. In the network diagram, each node represents a journal, and the node’s size represents the number of papers. The thickness of the connecting line represents the closeness of the connection between the journals. Among them, “Reliability engineering & system safety” (126), “Journal of loss prevention in the process industries” (70), and “Quality and reliability engineering International” (44) are the top 3 journals with the largest volume of publications in the field.
The leading position in the three clusters is occupied by the red cluster, with the greatest number of nodes. In this red cluster, the journal represented by the largest node is “Journal of Loss Prevention in the Process Industries”. The journals in the red cluster are mainly related to research in safety science, and the nodes in this cluster are very densely connected to other nodes. This suggests that research related to safety science is a highly essential part of the FTA research field. Many journals in the process industry are also included in this cluster, such as “Process Safety and Environmental Protection”. This is because FTA has been widely used to improve system safety in process industries. The blue cluster has the second highest number of nodes, and the core journal in this cluster is “Reliability Engineering & System Safety”. This cluster is related to the system reliability study, and there is a very dense connection with the red cluster. Therefore, we believe there is a close connection among FTA, system reliability and safety science. The node sizes are more evenly distributed in the green cluster, mainly composed of electronics reliability journals.
The top 10 publications’ titles, quantity, ACI, citation index and impact factors are listed in Table 5. The journals with the highest three average citations are “Process Safety and Environmental Protection”, “Reliability Engineering & System Safety” and “Safety Science”, with impact factors of 6.158, 6.188 and 4.877, respectively. The journals’ average citations and impact factors are plotted in Figure 10. We found that, except for “IEEE Access”, the average citations of other journals showed some positive correlation with the impact factor. This suggests that there is a link between a paper’s scholarship standard and the journal’s impact in which it is published.

3.3. Highly Cited Literature Analysis

Highly cited literature is generally recognized in a research field and often represents authoritative views. The analysis of highly cited literature in this section is essential for understanding the main research topics and knowledge base in the field of FTA. The top 10 cited papers were selected to characterize the high-impact papers in FTA studies, as shown in Table 6, which include the title, author, year of publication, co-authors’ number, citation frequency, etc. Then, we categorized the papers published into different periods. A total of 3 papers were classified in the fluctuating development stage, 7 were classified in the stable development stage, and no papers were classified in the rapid development stage. This result may be caused by the cited time lagging behind the published time. The spatial distribution of the papers was also analyzed, and 8 papers were accomplished through inter-institutional cooperation, which is common in FTA studies. However, only 3 papers were accomplished through international cooperation, so international communication among scholars requires strengthening. “Reliability Engineering & System Safety” can be regarded as an authoritative journal in FTA research, as half of the top 10 citations come from here.
The most frequently cited paper in Table 6 is “Improving the analysis of dependable systems by mapping fault trees into Bayesian networks”, published by Bobbio et al. [29] in “Reliability Engineering & System Safety”, with 516 citations. This paper shows that any fault tree can be directly mapped to a Bayesian network and that basic inference techniques on the latter may be used to obtain classical parameters computed from the former. A paper by García et al. [47] ranked second. They applied FTA to identify potential hazardous events during wind turbine failures and to assess those failures’ consequences and frequency. The third most cited paper is by Khakzad et al. [48], which focuses on comparing Bayesian networks with fault trees in safety analysis and demonstrates the application of Bayesian networks in the safety analysis of process systems. Trucco et al. [49] also published an equally well-cited article, in which they proposed an innovative approach to integrating human and organizational factors (HOF) into risk analysis. Then, a risk assessment model for the maritime transportation system is proposed by using a Bayesian Belief Network model and expert estimation to calculate the prior probability. After completing the analysis of the highly cited literature, we can tentatively divide the literature into three different directions. They are the research of fuzzy fault trees, dynamic fault trees analysis and the application of fault trees to assess reliability in engineering.

3.4. Co-Authorship Analysis

Co-authorship analysis helps researchers identify the current cooperative status and trends of the FTA research field [54]. It provides valuable information to researchers seeking cooperative opportunities by identifying the current existence of cooperative research groups [55]. In this paper, VOSviewer is used to analyze co-authorship with at least three papers. There are 73 clusters including 169 different authors, as shown in Figure 11. Each node represents an author, and the node’s size is positively correlated with the number of papers published by the author. The connecting lines represent the cooperation between authors, and a line’s thickness indicates their cooperation’s intensity. Therefore, we can find from the figure that the clusters are small, with only 6 clusters containing 5 or more authors, 31 authors in the form of separate clusters, and underdeveloped cooperative networks among the clusters. This means that some cooperation among scholars has appeared, but the cooperation scale is limited. There is less cooperation among different teams, and a well-established cooperation system has not been formed.
The 15 authors with the largest number of articles are shown in Table 7. Links in this represent the active level of cooperation among scholars, and we can find that the activeness of cooperation among scholars is low from this indicator. Andrews, J. D. published the most significant number of articles, with most discussing optimizing traditional FTA [56,57]. For example, the authors’ 1997 publication describes the use of binary decision diagrams in FTA and the method for their application in computers [58]. Khan from Memorial University, Newfoundland, has the second highest number of articles, with a high average citation count of 65.69. This scholar has studied reliability, risk and safety theory and its application in engineering for a long time [59,60]. This scholar’s paper, published in 2011, combines expert knowledge with fuzzy set theory and evidence theory to derive two different approaches to handling uncertainties in FTA and event tree analysis [61]. The third most published scholar is Huang from the University of Electronic Science and Technology of China, who formed a cooperation group with Liu et al. from the same institution, and their research scope is mainly related to the uncertainty problem in fault tree analysis [62]. For example, the posbist FTA model constructed by this scholar in the most highly cited article can be used to assess the failure probability of systems with scarce statistics or an extremely small probability of failure [63]. In addition, the parameter corresponding to the number of articles published is the average number of citations per article. In this table, the most cited scholar is Amyotte, with 94.78 citations per article. This scholar cooperates better with Khan et al. In a highly cited article, they proposed a methodology for a fuzzy-based computer-aided FTA tool [64]. This methodology was developed using a systematic approach to fault tree development, minimal cut sets determination and probability analysis. Moreover, the average citations per article published by Cepin are at the third highest level. The article of this scholar in the field of FTA is mainly related to the analysis of power system safety and reliability [65]. In addition, scholars from the University of Hull also have a high number of publications and citations per article, such as the work of Yazdi and Kabir [66], who proposed a methodology applicable to assessing process industrial risk under conditions of uncertainty and the statistical dependence of events. In this methodology, fuzzy set theory and expert knowledge are utilized to solve the uncertainty in the failure data, and the Bayesian network modeling is applied to capture dependency among the events.

3.5. Research Knowledge Base

Co-citation analysis is often used to explore the status and changes in scientific research, which can support some crucial decisions in science and technology. In co-citation analysis, the co-cited documents reflect the knowledge basis of the research field, and the journals collecting these documents are the carriers of the knowledge base. Moreover, highly co-cited journals also represent core journals at the forefront of research [67].

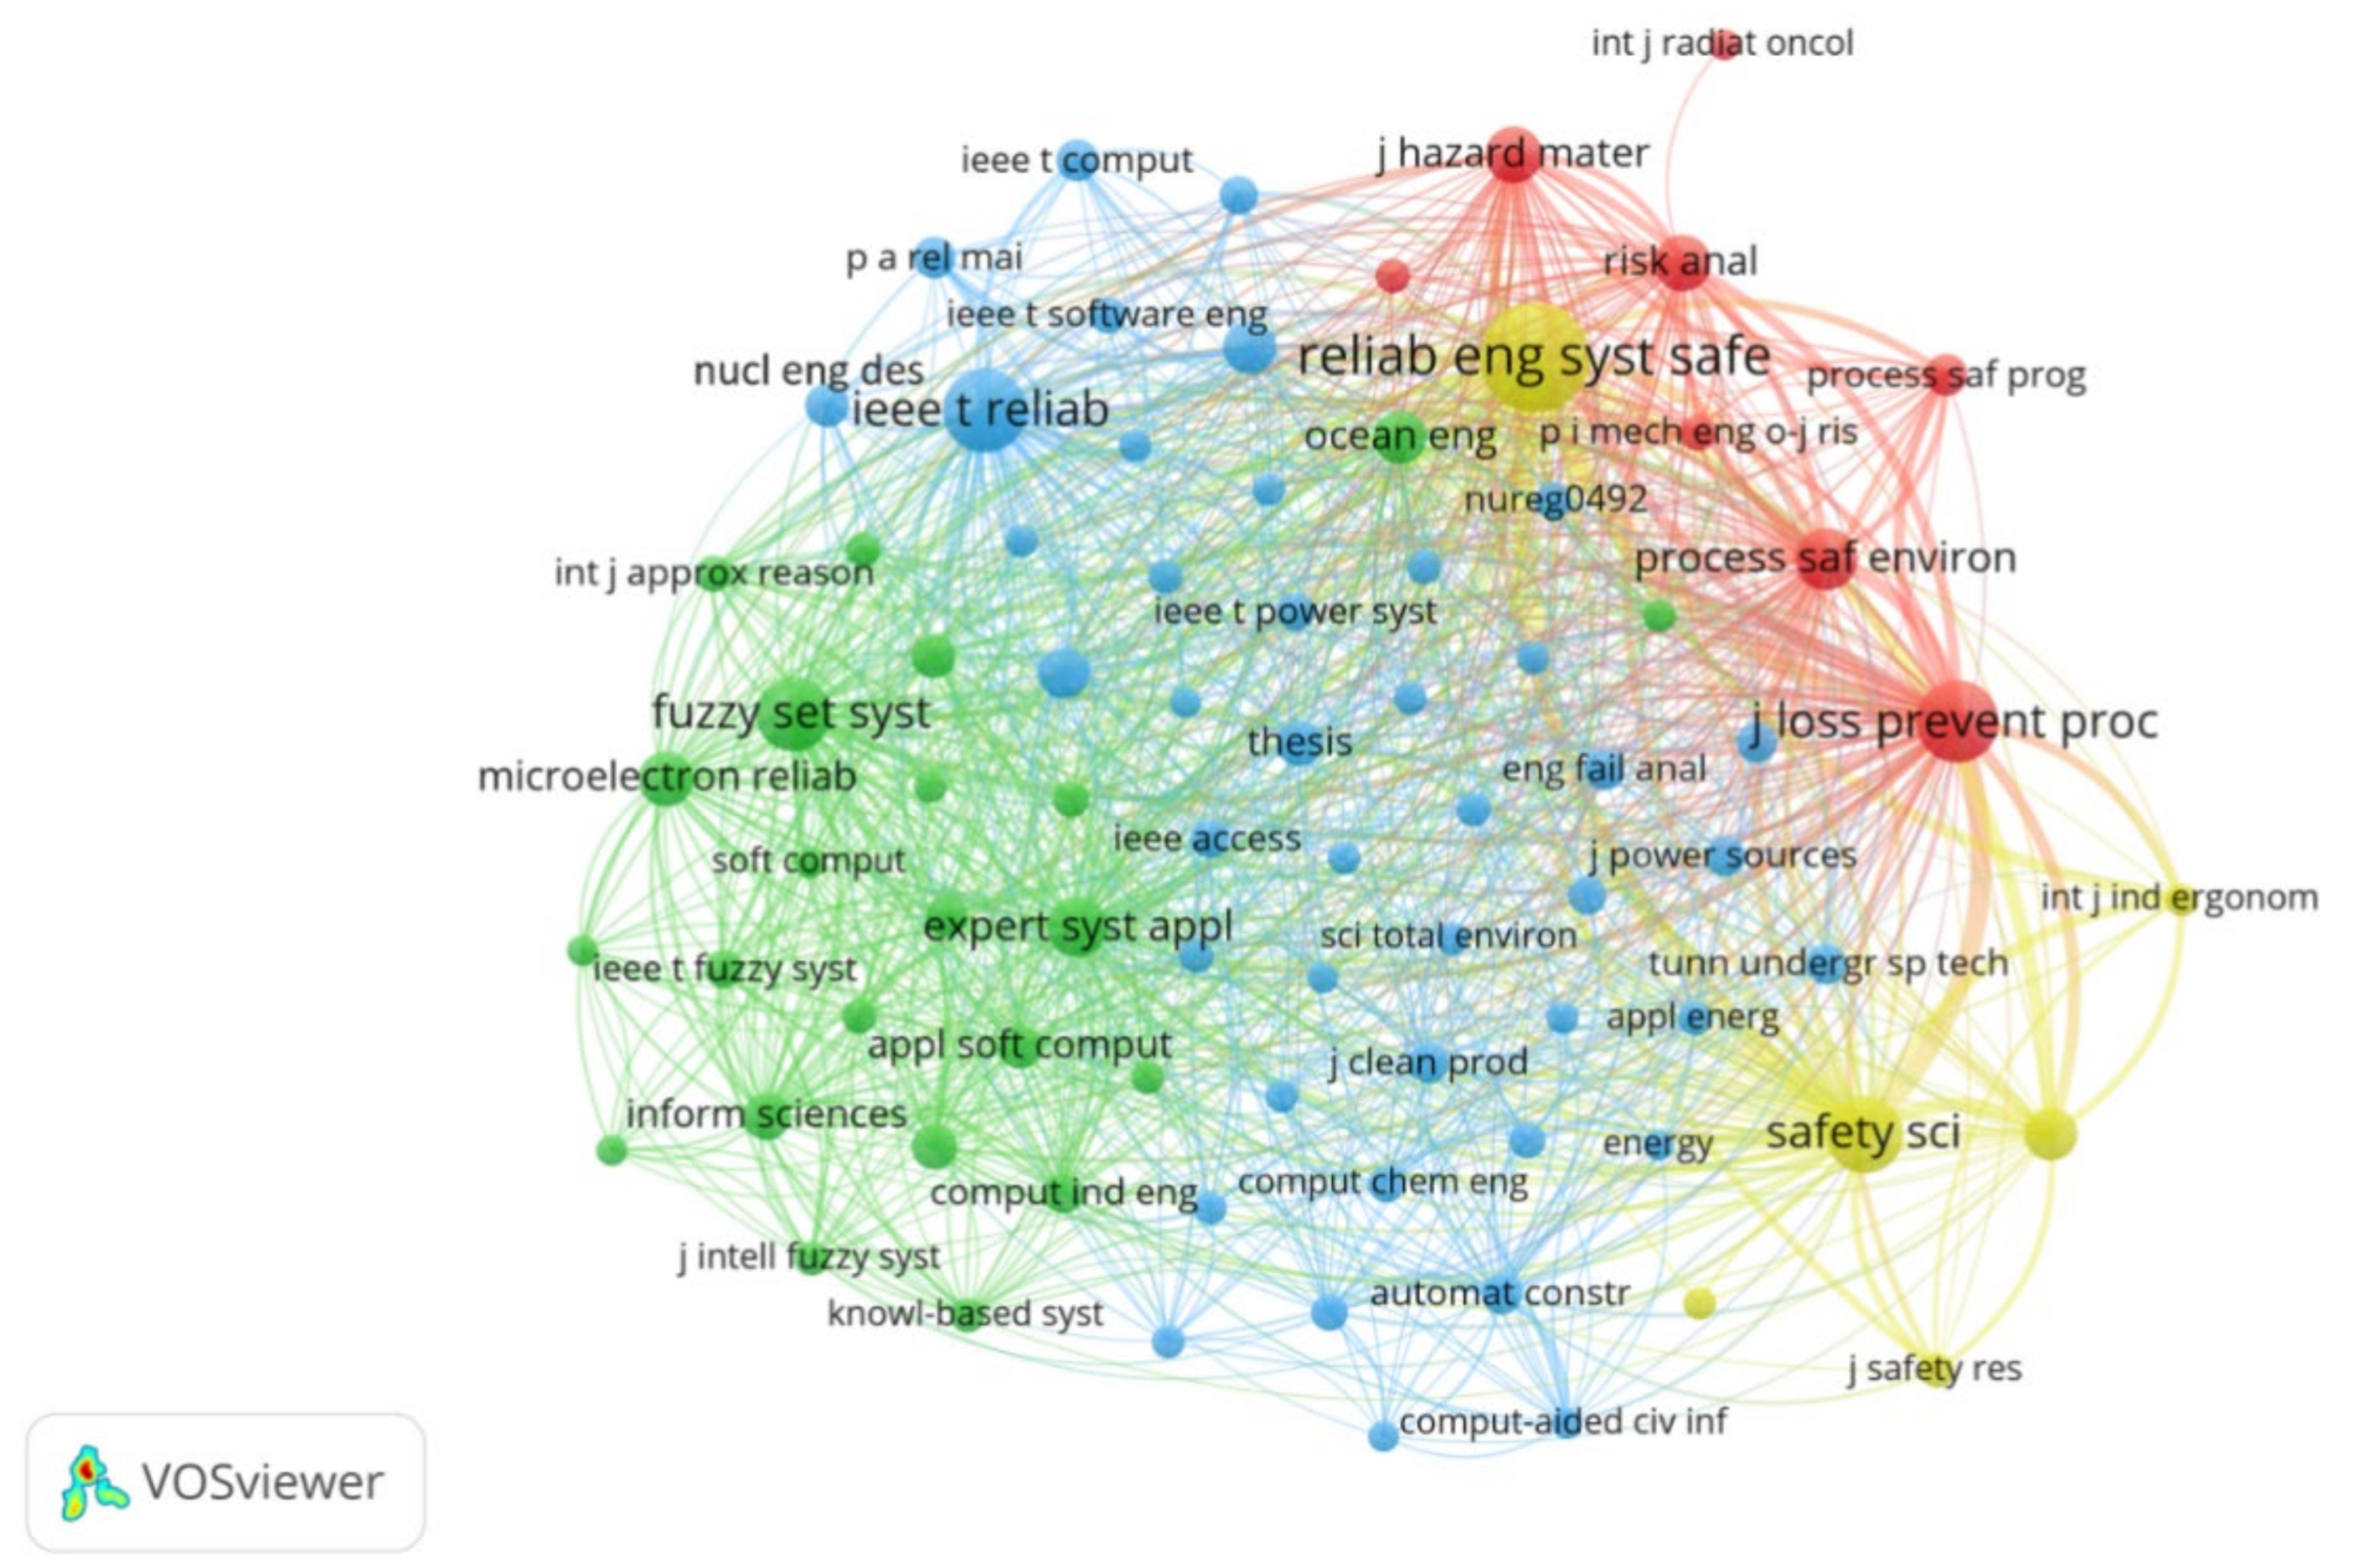
3.5.1. Reference Co-Citation Analysis

The co-citation relationship of articles reflects the correlation among articles. Two articles that are co-cited more frequently often show a stronger correlation in academic research directions. In this section, the co-citation analysis of the literature related to FTA can be applied to reveal the knowledge base of the research area, the research’s evolution as well as the literature that plays a vital role in the evolution process. VOSviewer was used to conduct a co-citation analysis. Articles that co-cited not less than 20 times were selected to draw the highly co-cited network, and 87 nodes were obtained, as shown in Figure 12. In this figure, the size of the node represents the article’s co-citation frequency. Closer distances between nodes reflect higher similarity in research directions. We also performed cluster analysis of different articles based on the similarity of their contents. In Figure 12, 87 nodes are classified into four clusters. It can be observed that the green cluster is the largest, containing 30 nodes, whereas the blue, red and yellow clusters contain 29, 18 and 10 nodes, respectively. This paper conducted a detailed analysis of these four clusters to analyze the research knowledge base of FTA.
Fuzzy fault tree analysis (red cluster, blue cluster): Traditional FTA fails to consider the uncertainty of failure rate and can hardly obtain accurate values of system components’ failure rates in practical applications due to human and environmental factors. In order to solve this problem, the fuzzy mathematic theory was introduced to carry out quantitative analysis in the fault tree based on the operational rule of fuzzy mathematics. In Figure 12, red and blue clusters are dominated by articles about fuzzy fault tree analysis, in which the red cluster and blue cluster consist of articles from earlier and recent studies, respectively. In the red cluster, the articles represented by larger nodes can be considered the basis of research in fuzzy fault tree analysis, such as articles published by Singer and Atanassov et al. Among them, Singer proposed an analytical method to describe the occurrence probability of a fault tree’s bottom and top events using triangular fuzzy numbers instead of exact probability values [68]. Atanassov, on the other hand, defined the concept of the intuitionistic fuzzy set and proved its various properties in his article [69]. Corresponding to articles in the red clusters, the articles in the blue clusters reflect the current status of research in the field of fuzzy fault tree analysis in recent years. Ding et al. [70] proposed a new method to evaluate event probability by expert elicitation with fuzzy set theories when assessing the failure probability of oil pipelines. Shu et al. [23] proposed an algorithm of intuitionistic fuzzy fault tree analysis for the failure analysis problem of the printed circuit board assembly.
Dynamic fault tree analysis (green cluster): The articles in this cluster are dominated by studies on dynamic fault tree analysis. The traditional fault tree fails to analyze dynamic failure behaviors of system components and their interactions when evaluating the reliability and safety of complex systems [71]. However, dynamic fault tree analysis can make dynamic expansion upon static FTA. It allows the fault tree to represent dynamic behaviors related to sequences when analyzing the reliability of dynamic systems [72]. In this clustering, the articles represented by the nodes with earlier years of appearance and a larger size can be considered fundamental research articles, such as Dugan’s dynamic fault tree model for fault-tolerant computational systems and fault trees, and the Markov model for fault-tolerant digital system reliability analysis [24,73]. The recent articles in this cluster, represented by larger nodes, were also extracted to reflect the research status. Čepin et al. [74] extended traditional FTA with the time requirements, and the results indicate that the dynamic fault tree can reduce system unavailability. Rao et al. [27] proposed a new method based on Monte Carlo simulations to solve the limitation of the Markov model in solving dynamic gates.
FTA based on binary decision diagram (yellow cluster): Traditional FTA is based on Boolean algebra, which often causes the combinatorial explosion problem when dealing with large and complex systems, and binary decision diagrams are one of the effective methods used to solve this problem [75]. Rauzy [76] first applied the binary decision diagram to FTA, featuring simple computing and minor errors. Since then, the application of binary decision diagrams to solve problems of FTA has gained significant concern. Many scholars started to use the binary decision diagram to improve the accuracy and efficiency of FTA. For example, Sinnamon et al. [77] described using the binary decision diagram method to evaluate the minimal cut sets of a fault tree efficiently and without the need to use approximations. Zhu et al. [78] quantitatively analyzed three main sources of laboratory explosion accidents through the combination of FTA and a binary decision diagram.

3.5.2. Journal Co-Citation Analysis

When different scholars research FTA, they need to support their research ideas and explain the research background, so they often form a co-citation network of journals with good authority. Therefore, the analysis of co-cited journals of FTA can help researchers quickly target core journals in the research field. In this paper, VOSviewer was used to map the co-cited journal network and to set the analysis category as “Co-citation” and the node type as “Cited sources”. After filtering, we obtained a co-cited journal network of 80 nodes, as shown in Figure 13. The node size indicates the number of citations in a co-citation journal. The distance between nodes represents the strength of the relationship between journals. As the distance becomes closer, the co-citation relationship of journals becomes stronger.
In Figure 13, the 80 journals were divided into four clusters, with green and blue clusters as the main ones. Red and yellow clusters are dominated by journals in safety science and system reliability. In this cluster, the top 3 cited journals include “Reliability Engineering & System Safety” (cited 3220 times), “Journal of Loss Prevention in The Process Industries” (cited 1300 times) and “Safety Science” (cited 1079 times). In addition, the nodes representing journals such as “Fuzzy Sets and Systems” (cited 999 times) and “Expert System with Applications” (cited 504 times) are more prominent in green clustering. It can be observed that the journals in this cluster often involve mathematical models and algorithms. Many nodes representing different disciplines are distributed in the blue clusters, and typical journals include “IEEE Transaction on Reliability” (cited 1432 times), “Nuclear Engineering and Design” (cited 189 times) and “Journal of Power Sources” (cited 140 times). Thus, there is a multidisciplinary crossover in this cluster. In terms of co-citations, “Reliability Engineering & System Safety”, “Safety Science” and “Fuzzy Sets and Systems” are regarded as core journals with different research fields.

3.6. Research Hotspots and Frontier Analysis

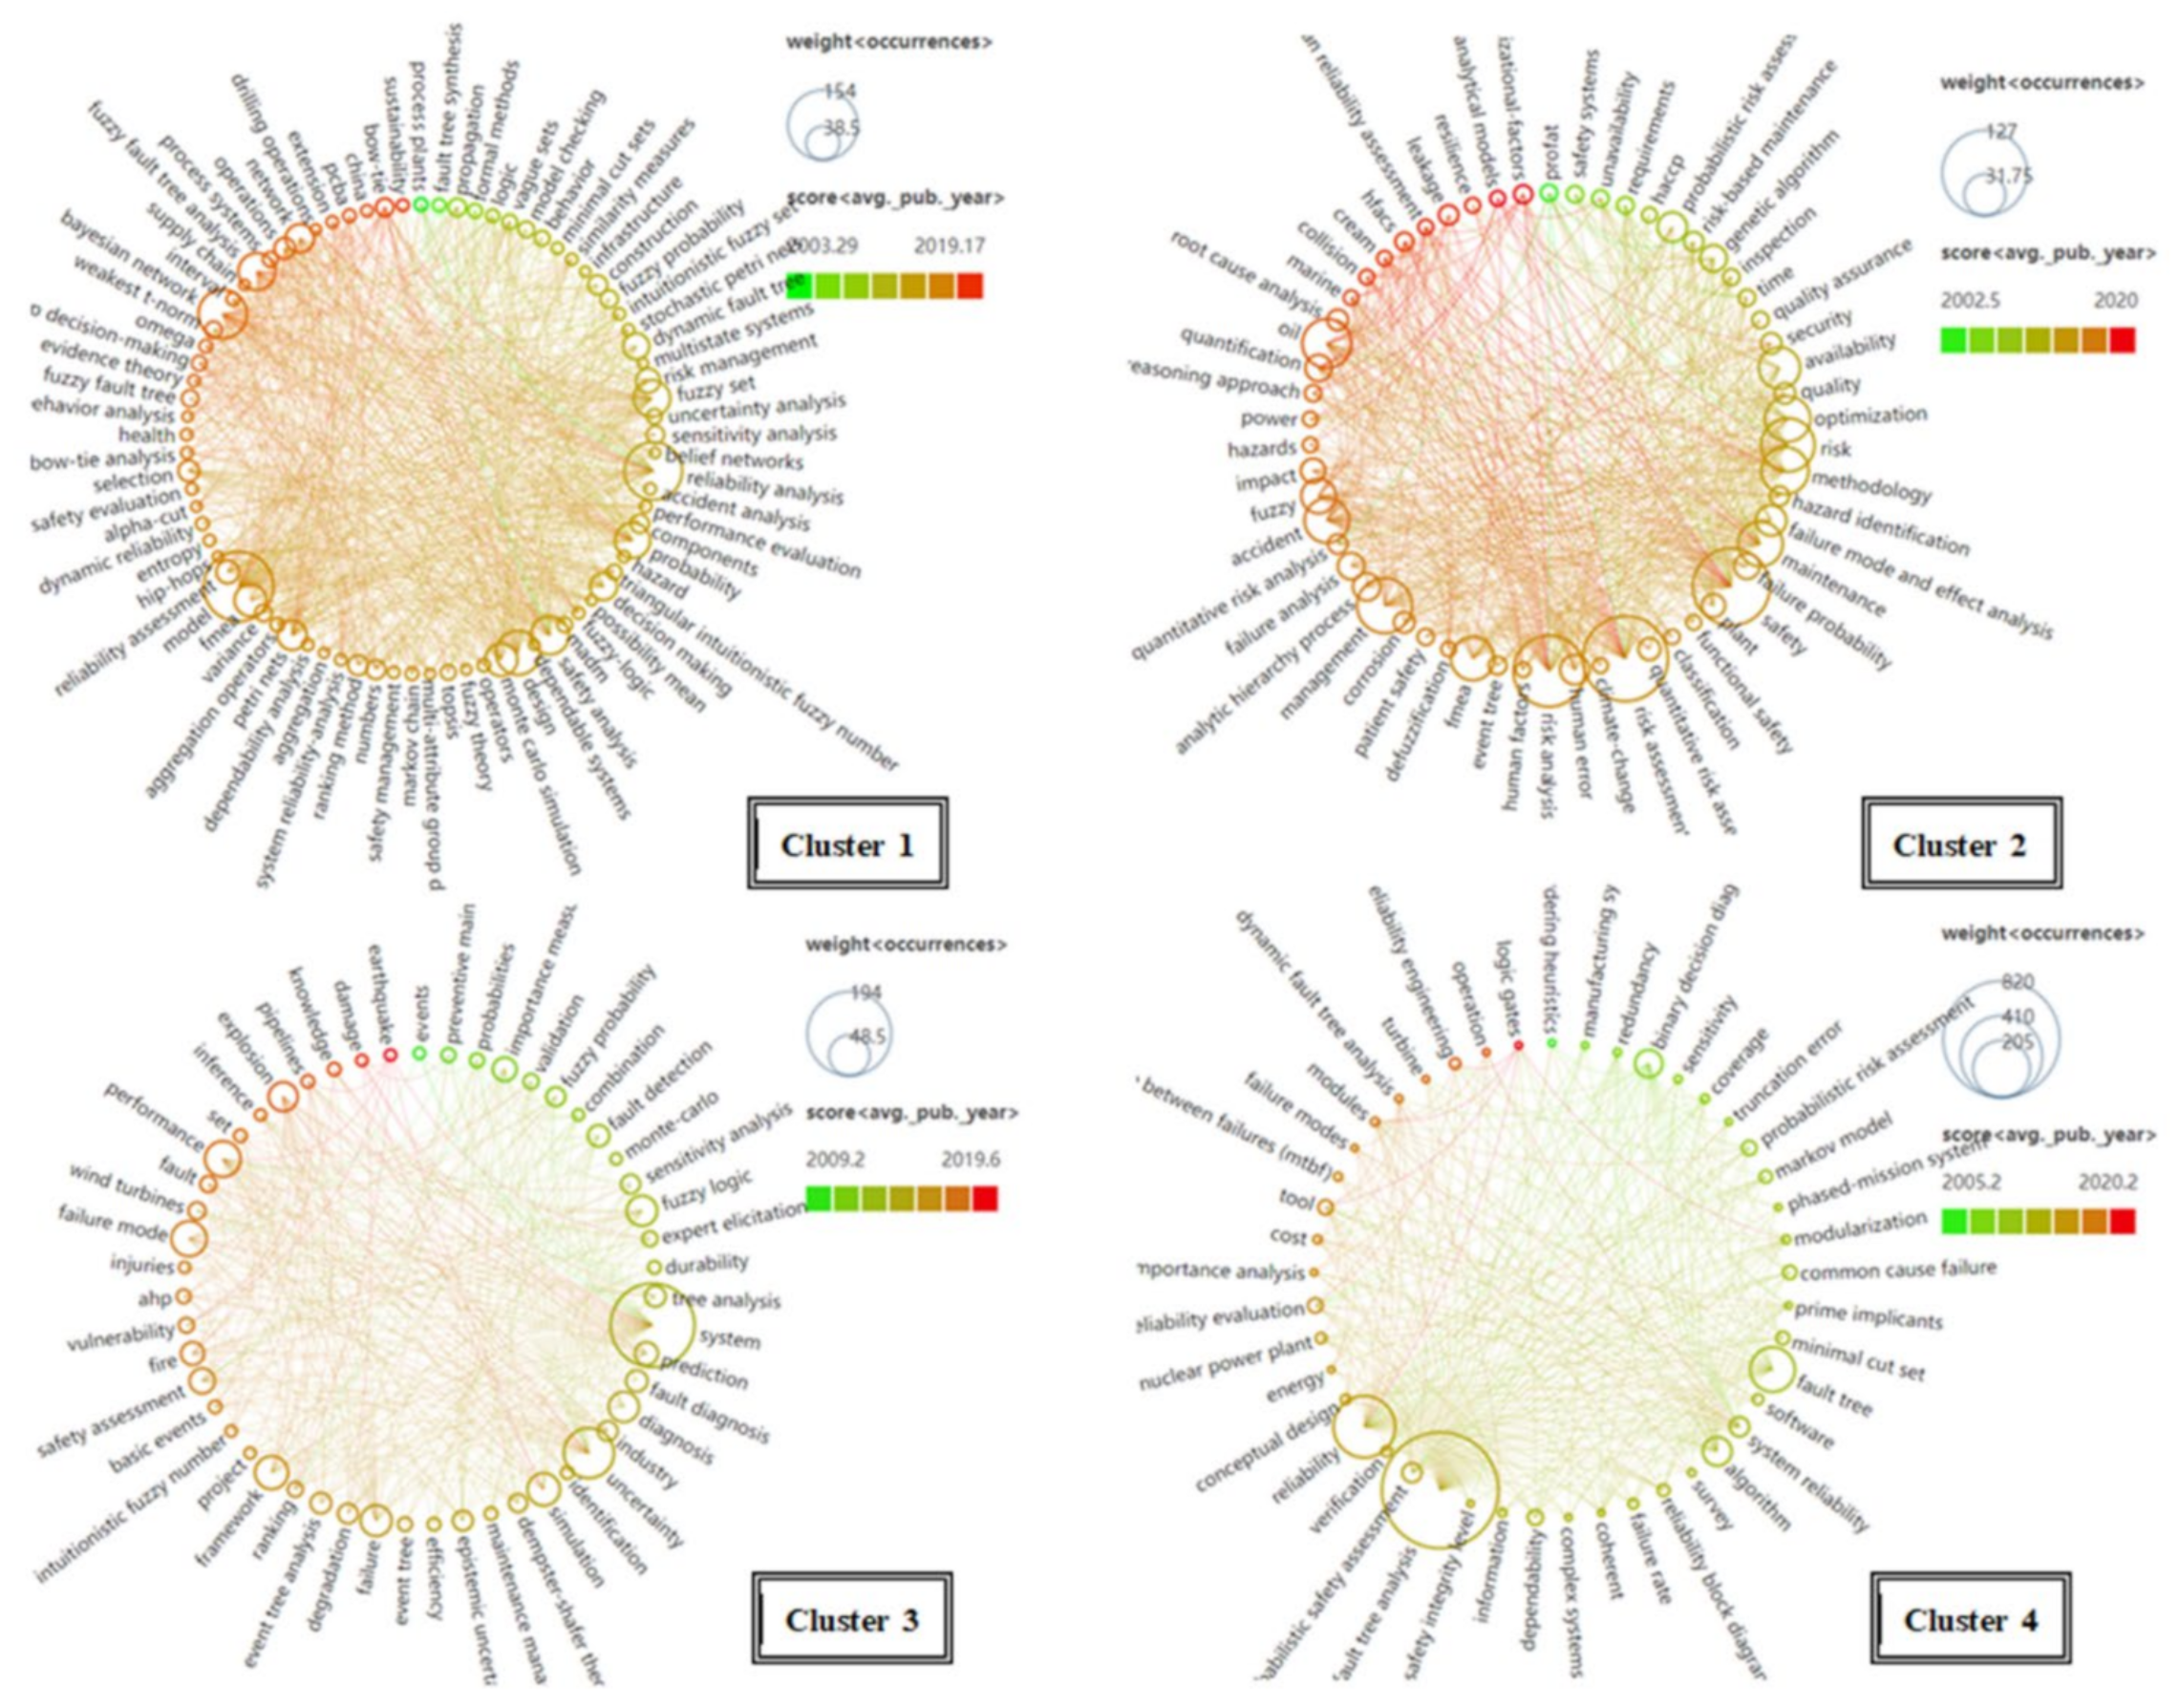
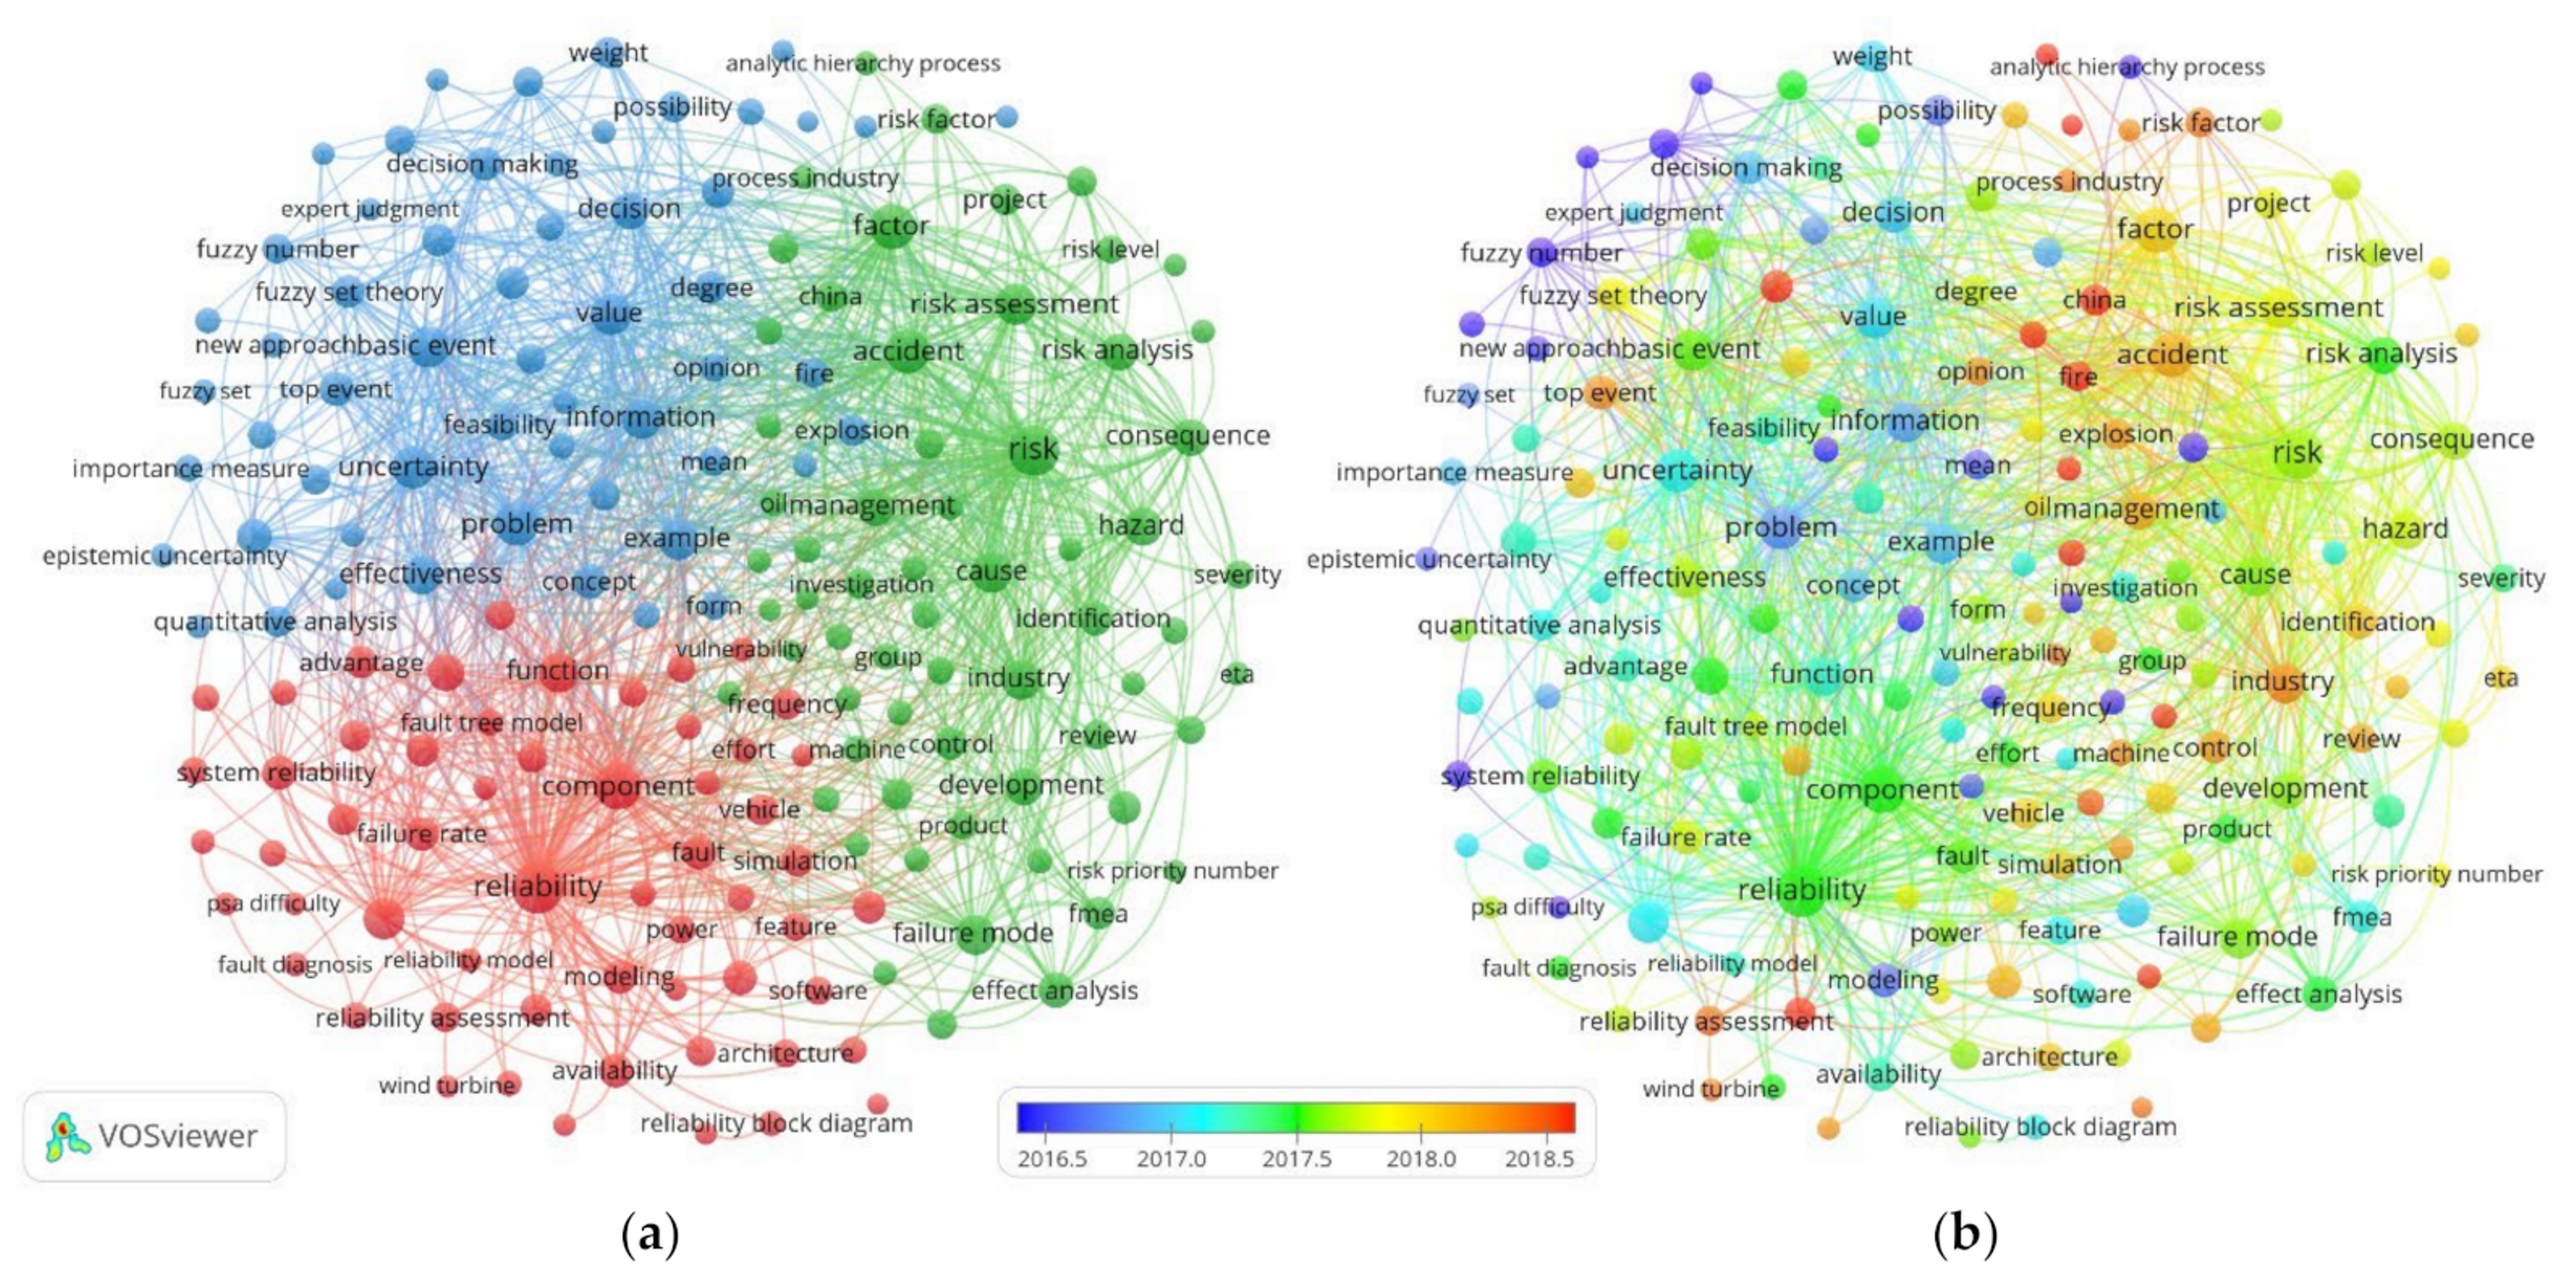
3.6.1. Static Preliminary Analysis of Research Hotspots

The core content of a paper is reflected by its keywords; therefore, the research hotspots in a specific field can be identified by keyword analysis. In order to study the relationship between keywords in papers, keyword co-occurrence analysis was carried out in VOSviewer. The keywords with a co-occurrence frequency no less than seven times were selected and edited appropriately. Finally, the co-occurrence network of 150 keywords and 4 clusters was generated, as shown in Figure 14. The red, green and blue clusters occupy the prominent positions in 4 clusters, and “fault tree analysis”, “risk assessment” and “reliability analysis” in these three clusters are regarded as the central words.
Optimization of traditional FTA (blue clustering): “fault tree analysis”, “model”, “design”, “algorithm” and “optimization” are keywords that co-occur more frequently, indicating that the blue cluster mainly reflects the study of the optimization of traditional FTA. Traditional FTA has limitations for complex system analysis due to its heavy workload and various uncertainties. To circumvent disadvantages, traditional FTA has been optimized by many scholars and thus has evolved into a research hotspot. The optimization directions can be roughly divided into two parts: the optimization of FTA itself and the coupling of FTA with other methods. The optimization of FTA itself mainly includes fuzzy fault tree analysis and dynamic fault tree analysis. The dynamic fault tree analysis is used for the quantitative analysis of dynamic system reliability, which is usually translated into equivalent Markov chains. In addition, the methods of Monte Carlo simulations, Petri nets and Bayesian networks are also frequently used for the quantitative analysis of dynamic fault trees. For fuzzy fault tree analysis, since Tanaka et al. proposed the fuzzy fault tree, many scholars have carried out further research on this basis. For example, a hybrid approach employing fuzzy set evaluation and probabilistic estimation for FTA was proposed by Lin et al. [22] to evaluate the safety problem of unexpected robot motion in an aircraft wing drilling system. Li et al. [79] suggested that, although dynamic fault tree analysis extends static FTA, it is difficult to accurately assess the system’s reliability due to limited data. For this reason, they proposed a fuzzy dynamic fault tree model. Kumar et al. [80] proposed an intuitionistic fuzzy fault tree analysis method based on the weakest t-norm to evaluate the system’s reliability and to identify the most critical components that affect the system’s reliability. The coupling of FTA with other methods includes failure modes and effect analysis, event tree analysis, etc., which is reflected in the co-occurrence of “fmea” and “failure analysis“ with “fault tree analysis”. In this research direction, Peeters et al. [81] proposed an analysis method that combines FTA and FMEA recursively to improve the efficiency of failure analysis. Moreover, Hosseini [82] introduced an analysis framework that combines the fault tree and event tree for a fire accident in a natural gas facility, and the path leading to the outcome event can be expressed visually.
System reliability analysis (red cluster): This cluster is extended to other keywords with “reliability analysis” as the core. “dynamic fault tree”, “component” and “operations” are considered to be popular keywords, and they also have a high frequency of co-occurrence with “reliability analysis”. These keywords reflect the application and research of FTA in the reliability field. In the energy field, to analyze power system reliability, a new method by using FTA was introduced by Volkanovski et al. [51]. This method is based on each load point’s fault tree and identifies the main contributors to power system reliability. In addition, in the field of transportation, to evaluate the reliability of traction substations, Chen et al. [83] concluded a method based on FTA and developed a dynamic reliability and life evaluation model.
Risk analysis and safety management (green cluster): The keywords that occur more frequently in the green cluster are recognized to be “risk assessment”, “risk analysis”, “accident” and “management”. Moreover, the clusters also contain keywords such as “explosion”, “fire”, “oil”, etc., with less frequent co-occurrence. Thus, we assumed that this cluster reflects FTA research in risk analysis and safety management, such as the work of Bhangu et al., who conducted a reliability and risk assessment with a thermal power plant [11]. In addition, Budiyanto et al. [84] used FTA to identify accidents and potential risks occurring in container terminals and introduced a risk control scheme to reduce the possibility of safety failures.

3.6.2. Dynamic Tracing of Evolutionary Paths and Research Hotspots

In Section 3.6.1, a co-occurrence analysis of keywords was conducted, and four clusters regarding the research field of FTA were formed. The static analysis of research hotspots based on the clusters and representative literature was conducted to achieve good results. However, this static analysis method has certain limitations, which cannot reflect the dynamic characteristics of the research hotspots in a time sequence. For this reason, we utilized Scimago Graphica to draw a keyword dynamic co-occurrence map. The research hotspots’ distribution and their evolution at the temporal level can be obtained from this map, as shown in Figure 15. In this figure, the four ring clusters are composed of keywords together, the circles’ sizes reflect the number of keyword co-occurrences, and the line between the circles reflects the co-occurrence relationship. The average year of keyword occurrences is displayed in different colors, and as color becomes closer to red, the current time becomes closer. It can be observed that ring cluster 1 has the highest number of keywords, and Ring Cluster 4 has the lowest number. The keywords with high co-occurrence frequency include: “fault tree analysis”, “reliability”, “safety”, “risk assessment” and “system”.
Ring Cluster 1: It can be noticed that the average year of keyword occurrence in this cluster started in 2003 and ended in 2019. The keywords represented by the larger circles include: “reliability analysis”, “fuzzy set”, “bayesian network” and “model”. Based on the results in Section 3.6.1, we can judge that the cluster is relevant to the optimization of traditional FTA. Keywords involved in the theme of fuzzy fault tree analysis can be traced back to “fuzzy probability” at the earliest, with the most numerous and uniform distribution on the ring cluster. Therefore, we can assume that the research related to fuzzy fault tree analysis has been the central part of traditional FTA optimization, and its research enthusiasm has been high. Notably, the keyword “fuzzy fault tree” with a large circle appeared around 2017, which means that enthusiasm for fuzzy fault tree analysis may have increased recently [85]. The keyword “Bayesian network” also appeared in a ring cluster with a larger circle around 2017, whereas the keywords “monte carlo simulation”, “petri net” and “markov chain” appeared in ring clusters around 2010. This phenomenon indicates that the research hotspot for dynamic fault tree analysis has shifted. The research of dynamic fault tree analysis based on the Bayesian network [86] has gradually become a research hotspot. Since around 2010, keywords such as “decision making” and “safety management” began to appear in the clusters. It is implied that the study of traditional FTA optimization has entered a systematic stage. In this stage, not only are the system components themselves focused on by scholars, but management factors are incorporated into the model of FTA. For example, Guo et al. [87] analyzed the influence of organizational and environmental factors on human errors in pilot flights with the application of Bayesian networks and FTA.
Ring Cluster 2: From this cluster, it can be found that the average year of keyword occurrence started in 2002 and ended in 2020. The larger circles in the cluster represent the following keywords: “risk assessment”, “risk analysis” and “safety”. Based on the conclusions drawn in Section 3.6.1, this cluster is mainly related to applying FTA in risk analysis and assessment. Interestingly, around 2013, keywords such as “corrosion”, “power” and “oil” appeared in the cluster, and the theme of these words pointed more clearly to the energy field. In addition, in this field, FTA is often related to analyzing risks in power systems [51] and oil and gas extraction and storage processes. In the field of oil extraction [88], due to the chronic lack of component failure rate data in the drilling industry, Lavasani et al. [89] used fuzzy fault tree analysis to quantify the risk of abandoned oil and natural gas well leakages. Therefore, we can assume that FTA has been widely applied to analyze risk in the energy field in the past decade and that it will be increasingly applied in the future.
Ring Clusters 3 and 4: In Ring Cluster 3, the average year of keyword occurrence started in 2009 and ended in 2019. The keywords “system”, “uncertainty”, “explosion” and “failure mode” are represented by larger circles, which mainly relate to accidents and failures. Moreover, we noticed that the words related to accidents in Ring Cluster 3 often symbolize catastrophic accidents, such as explosions in chemical plants, earthquakes, mine dust explosions [90], etc. Therefore, we can assume that FTA has often been used in recent years to prevent catastrophic accidents and to analyze the causes of accidents, such as that in the work of Ahn et al. [91], who used FTA to analyze factors that cause accidents of fire and explosions in tankers. The average year of the keywords in Cluster 4 started from 2005 and ended in 2020, and those that co-occurred more frequently are: “fault tree analysis” and “reliability”. After the analysis results in 3.6.1 are combined, Cluster 4 can be regarded as relevant to studies on system reliability, including the analysis, evaluation, prediction and enhancement of system reliability. Xu et al. [92] investigated the hardware reliability of a gas monitoring system by using fuzzy fault tree analysis. Knezevic et al. [93] used FTA to analyze turbocharger failures to estimate system reliability and predict the cause of failures.

3.6.3. Research Frontier Theme Detection

Through frontier analysis in this section, researchers can accurately grasp the research frontiers and the latest evolutions of FTA. In addition, this analysis result can also predict the direction of the development of FTA and the hot issues that need further research in the future, because the evolving trends of research themes and frontiers in a specific field are well reflected by the theme terms in papers’ titles and abstracts. We utilized VOSviewer to extract the theme terms in the titles and abstracts of papers from 2012 to 2021. After removing irrelevant terms and merging synonyms, the top 60% were further filtered, 176 terms were obtained, and their co-occurrence network is shown in Figure 16. The temporal overlay of theme terms was plotted and was used for comparison, as shown in Figure 16b. The nodes and clusters at the research frontiers are characterized, and colors from blue to red indicate changes in hot themes over time. On this basis, the ten most recent hot theme terms were extracted as a reference for frontier detection, as shown in Table 8, where APY is the average year of the term’s occurrence. The term APY is closer to the present, and the theme is likely to be a frontier in the research field of FTA [94].
As shown in Figure 16a, the green and red clusters contain more nodes and occupy the leading position among all clusters. The red cluster mainly revolves around the following theme terms: “reliability”, “algorithm”, “modeling” and “system reliability”. Therefore, we considered that the cluster embodied the theme of traditional FTA optimization and applied it to system reliability improvements. Moreover, in Figure 16b, there are more red and yellow nodes in this cluster, so the research on the optimization of traditional FTA is both a research hotspot and frontier. By combining this with the content in Section 3.6.2, we know that research on the optimization of traditional FTA mainly focuses on fuzzy fault tree analysis and dynamic fault tree analysis. These two research directions are not independent, and fuzzy fault tree analysis and dynamic fault tree analysis are often combined for research. In such studies, Kabir et al. [95] introduced a framework that combines intuitionistic fuzzy set theory and expert heuristics to quantitatively analyze temporal fault trees for dynamic systems with uncertain data. In addition, Zhang et al. [96] transformed the fault trees of risky events into fuzzy Petri nets (FPN) and combined the dynamic weighting fuzzy Petri net with FTA to establish the FPN–FTA model.
When compared to Figure 16a,b, most of the theme terms representing the more recent hotness (red and yellow nodes) appear in the green clusters, so this cluster represents the frontier research area. “risk”, “factor”, “accident” and “hazard” co-occur more times in this cluster. Thus, we can speculate that the theme of the cluster is to apply FTA to assess the system’s risk factors and to improve the safety ability of management. In order to identify workplace hazards and improve occupational health and safety in industrial production, Botti et al. [97] developed a holistic participatory approach based on FTA. Moreover, as can be seen from Table 8, the hot theme terms in this cluster also include “fire”, “ship”, “significance” and “explosion accident”. This suggests that evaluating and analyzing the risk of fires, explosions and shipping accidents may be one of the frontiers in the application and research of FTA. For instance, the hazardous cargo explosion accident in Tianjin port was systematically studied using FTA, and then management strategies were proposed [98]. Moreover, in shipping accidents, Sarıalioğlu et al. [99] used a hybrid method including the Human Factors Analysis and Classification System and fuzzy fault tree analysis to analyze fire–explosion accidents in ship engine rooms.

4. Discussion

This study reviews the research and application of FTA during 1995–2021 and sorts out the current research status and development trend from the following three aspects: (1) the spatial and temporal distribution of literature; (2) the knowledge base and research themes; and (3) research hotspots and frontiers. The first two aspects of the study reveal the cooperation, knowledge structure and research themes in FTA, which lay the foundation for analyzing the hotspots and development trends of FTA research. By analyzing the hotspots and frontiers, we found that the prevention of catastrophic accidents and risk analysis in the energy field are hotspots for applying FTA. Fires, explosions and shipping accidents may be important areas for FTA in the future. Fuzzy fault tree analysis and dynamic fault tree analysis are the hotspots and research frontiers.
There is no doubt that the frontier and hotspot detection of FTA in this study can point towards future applications in research with this method. The energy field has always been an essential focus for applying FTA. Its applications include power system fault diagnosis, oil pipeline leakage risk analysis, coal mine gas explosion accidents, etc. In addition, from the future trend of energy types, FTA should be applied to solve engineering problems in oil and gas fields, but it should also start to focus on system reliability and safety in non-traditional energy fields, such as hydrogen energy facility safety evaluations [100]. In addition, shipping accidents are likely to be an important field for the future research and application of FTA. This phenomenon may be related to increasingly active global trade, and applying FTA in shipping accidents may require the consideration of more environmental factors [101].
Dynamic fault tree analysis and fuzzy fault tree analysis are both simultaneously hotspots and frontiers in the FTA research field. During the development of dynamic fault tree analysis, Markov chains, Monte Carlo simulations, Petri networks and Bayesian networks have been well applied in dynamic fault tree analysis. In addition, among the above methods, except the Markov chain, all are based on the assumption that the basic events are not repairable. However, in reality, system components are generally repairable. Therefore, developing a repairable dynamic fault tree analysis calculation method is of great practical significance. The fuzzy fault tree analysis method is essentially a treatment of uncertainty problems; therefore, it can be considered in future development in combination with other uncertainty theories. In summary, from the development trend, the applied research of FTA will involve a series of new fields in the environment and personnel health [102]. From a methodological point of view, dynamic fault tree analysis and fuzzy fault tree analysis will likely become powerful methods to solve problems in these new fields.

5. Conclusions

In this study, an informetrics analysis was performed to analyze the relevant FTA research literature in SCIE and SSCI from 1995 to 2021. The main contents include temporal–spatial distributions, highly cited literature, co-authorship, the research knowledge base, research hotspots and frontiers. Three knowledge bases in this field were identified using a co-citation network. Research hotspots were identified through keyword co-occurrence, the evolutionary paths of research hotspots were dynamically analyzed, and research frontiers were identified by theme terms. The main conclusions obtained from this analysis are as follows:
(1)
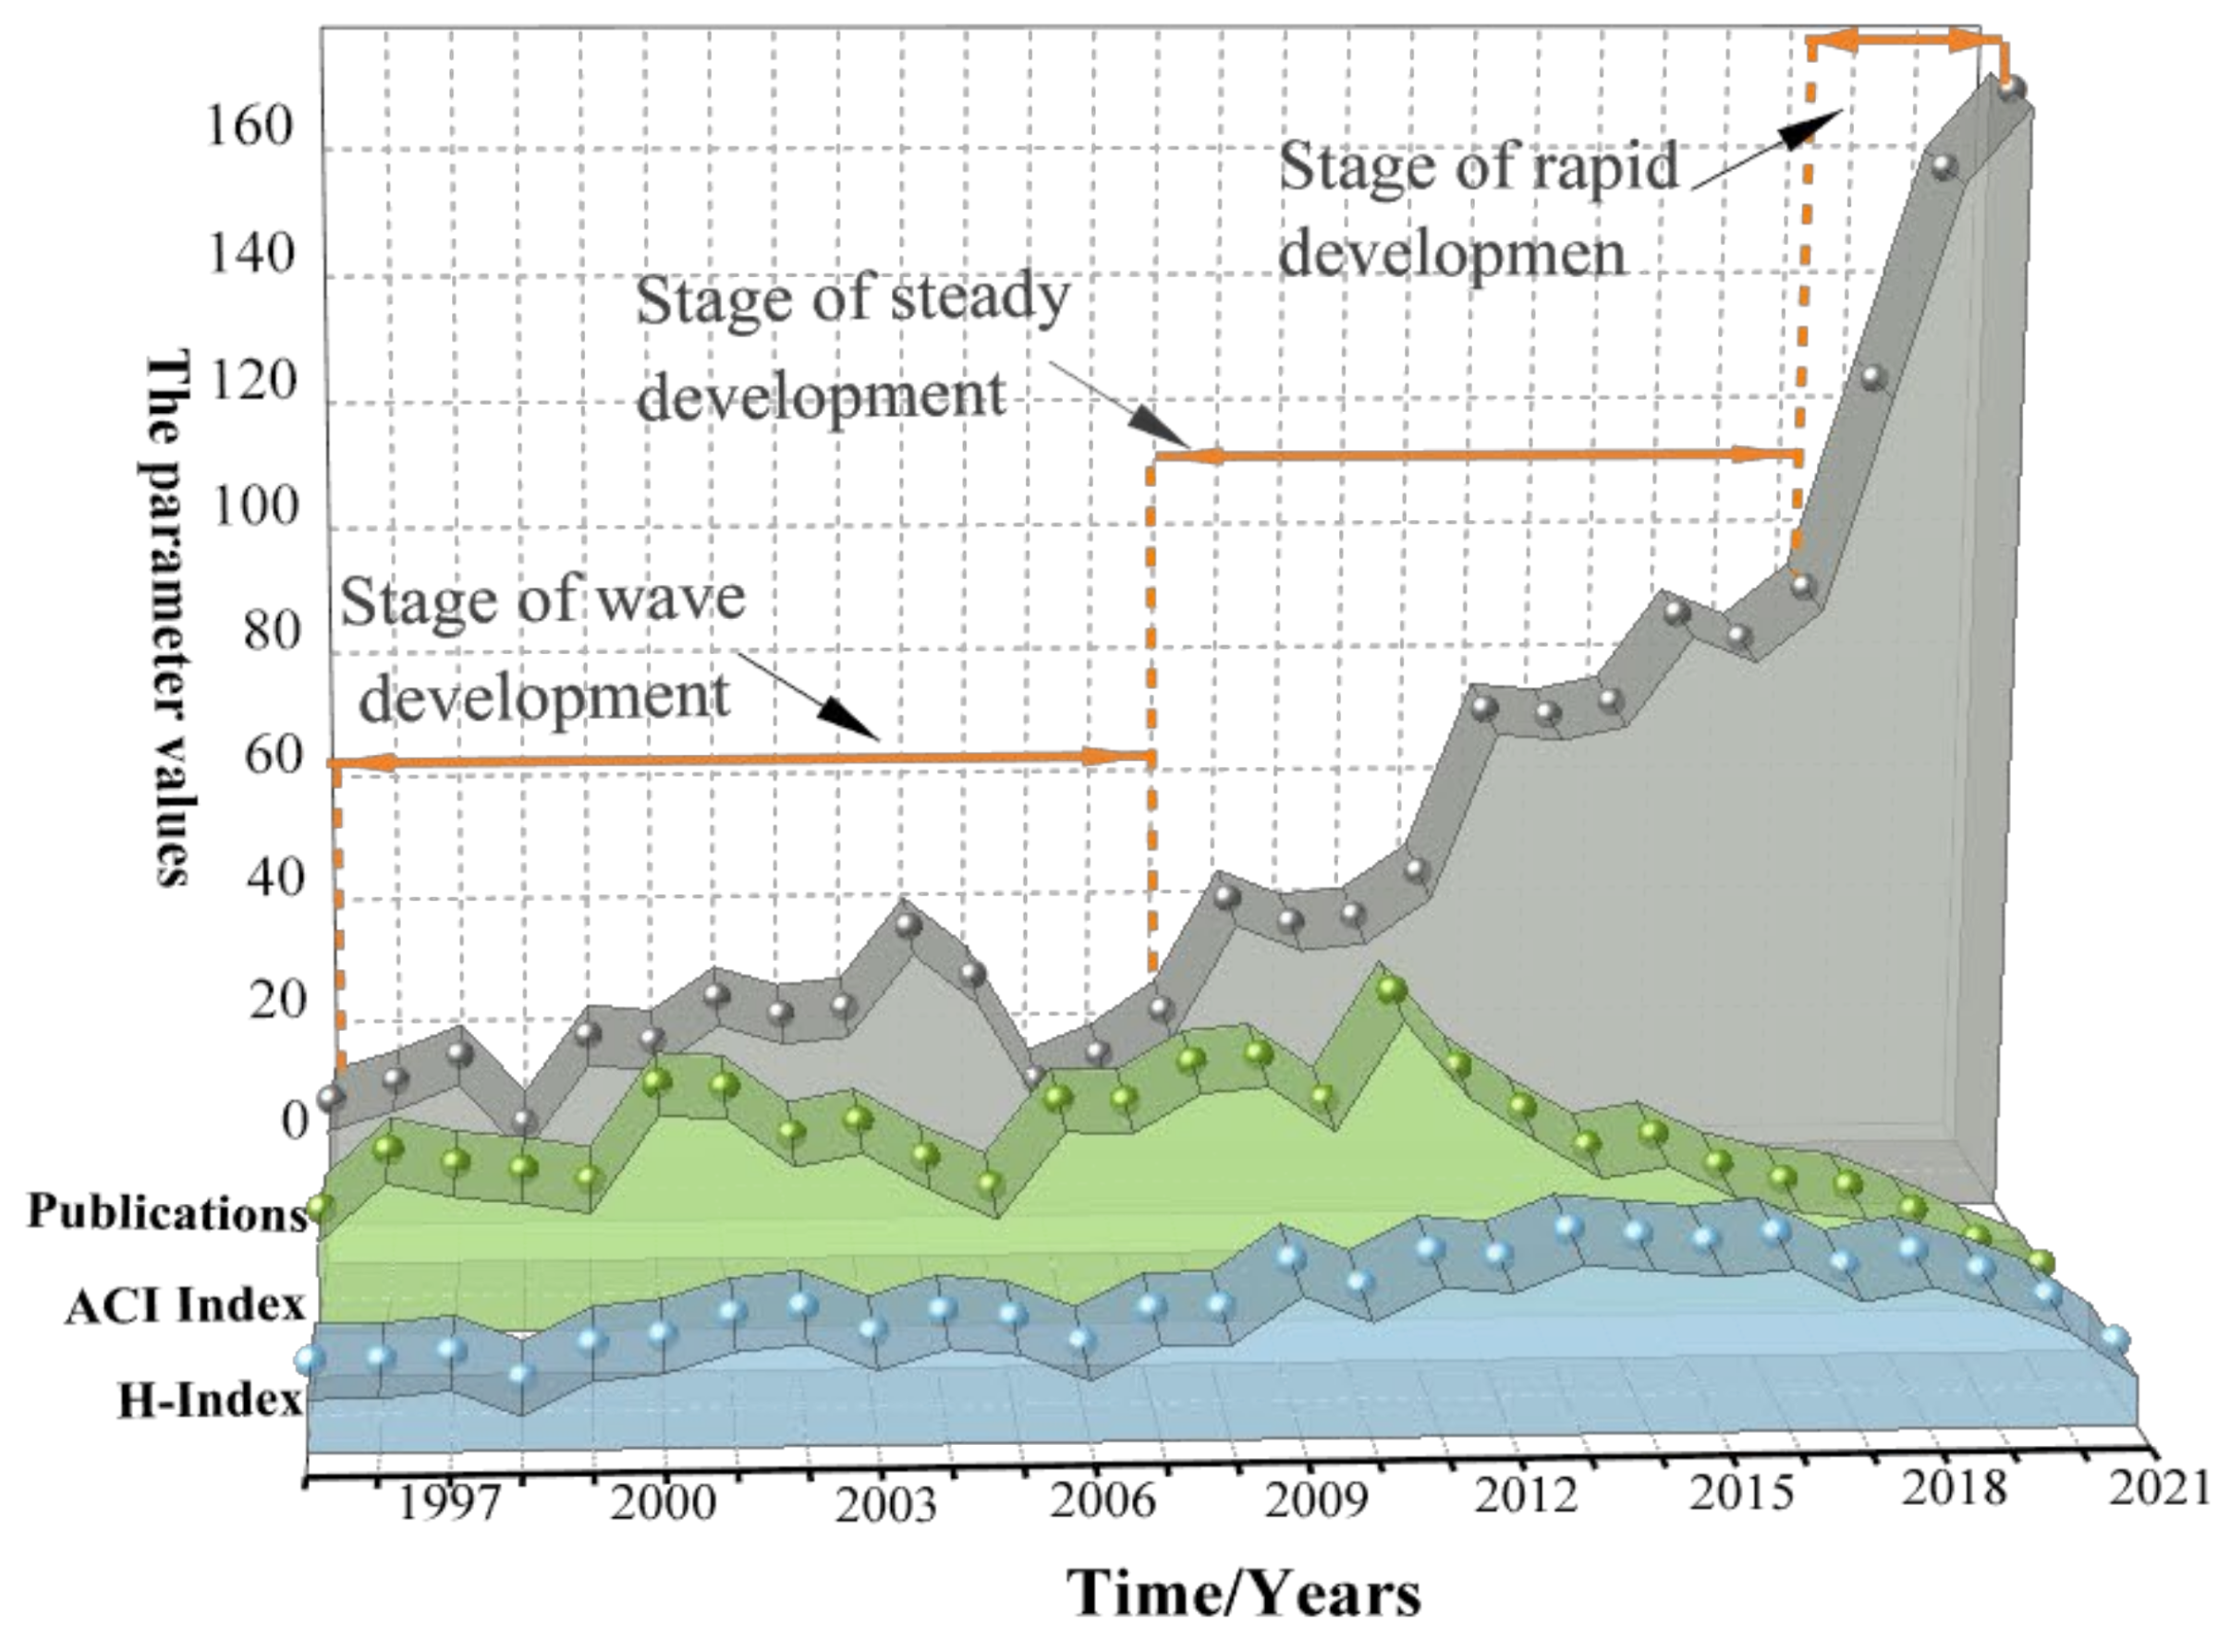
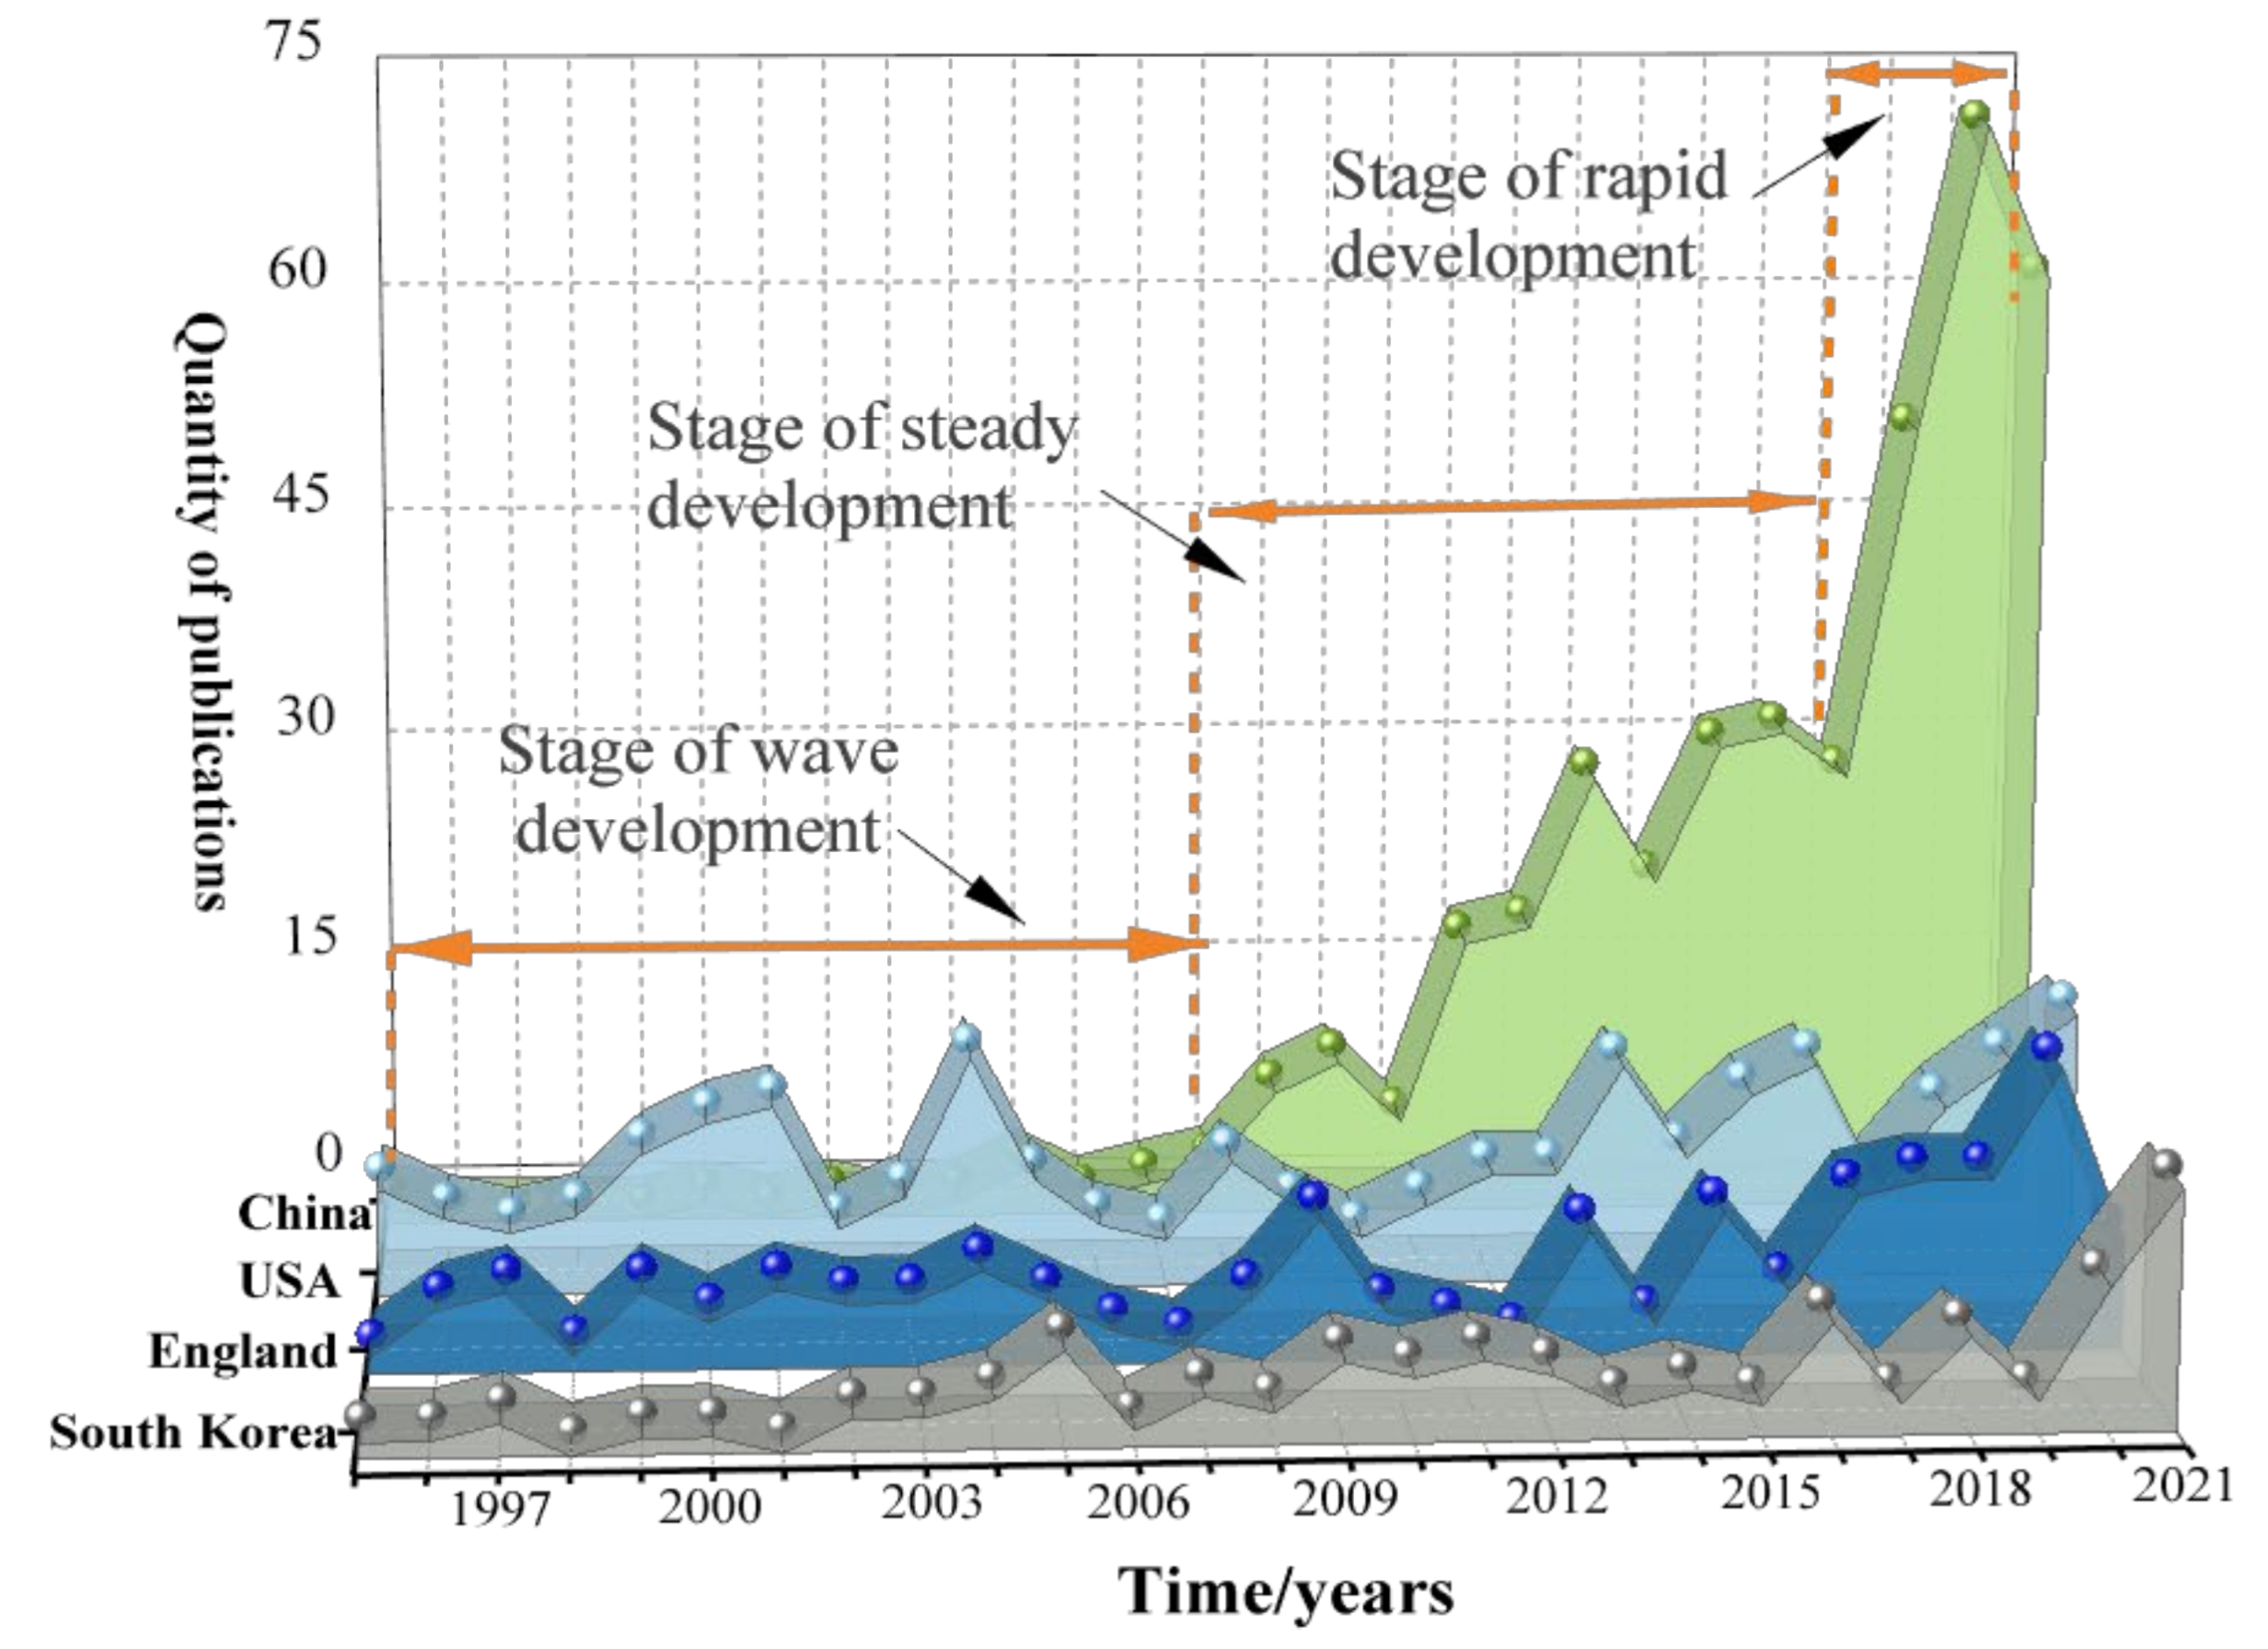
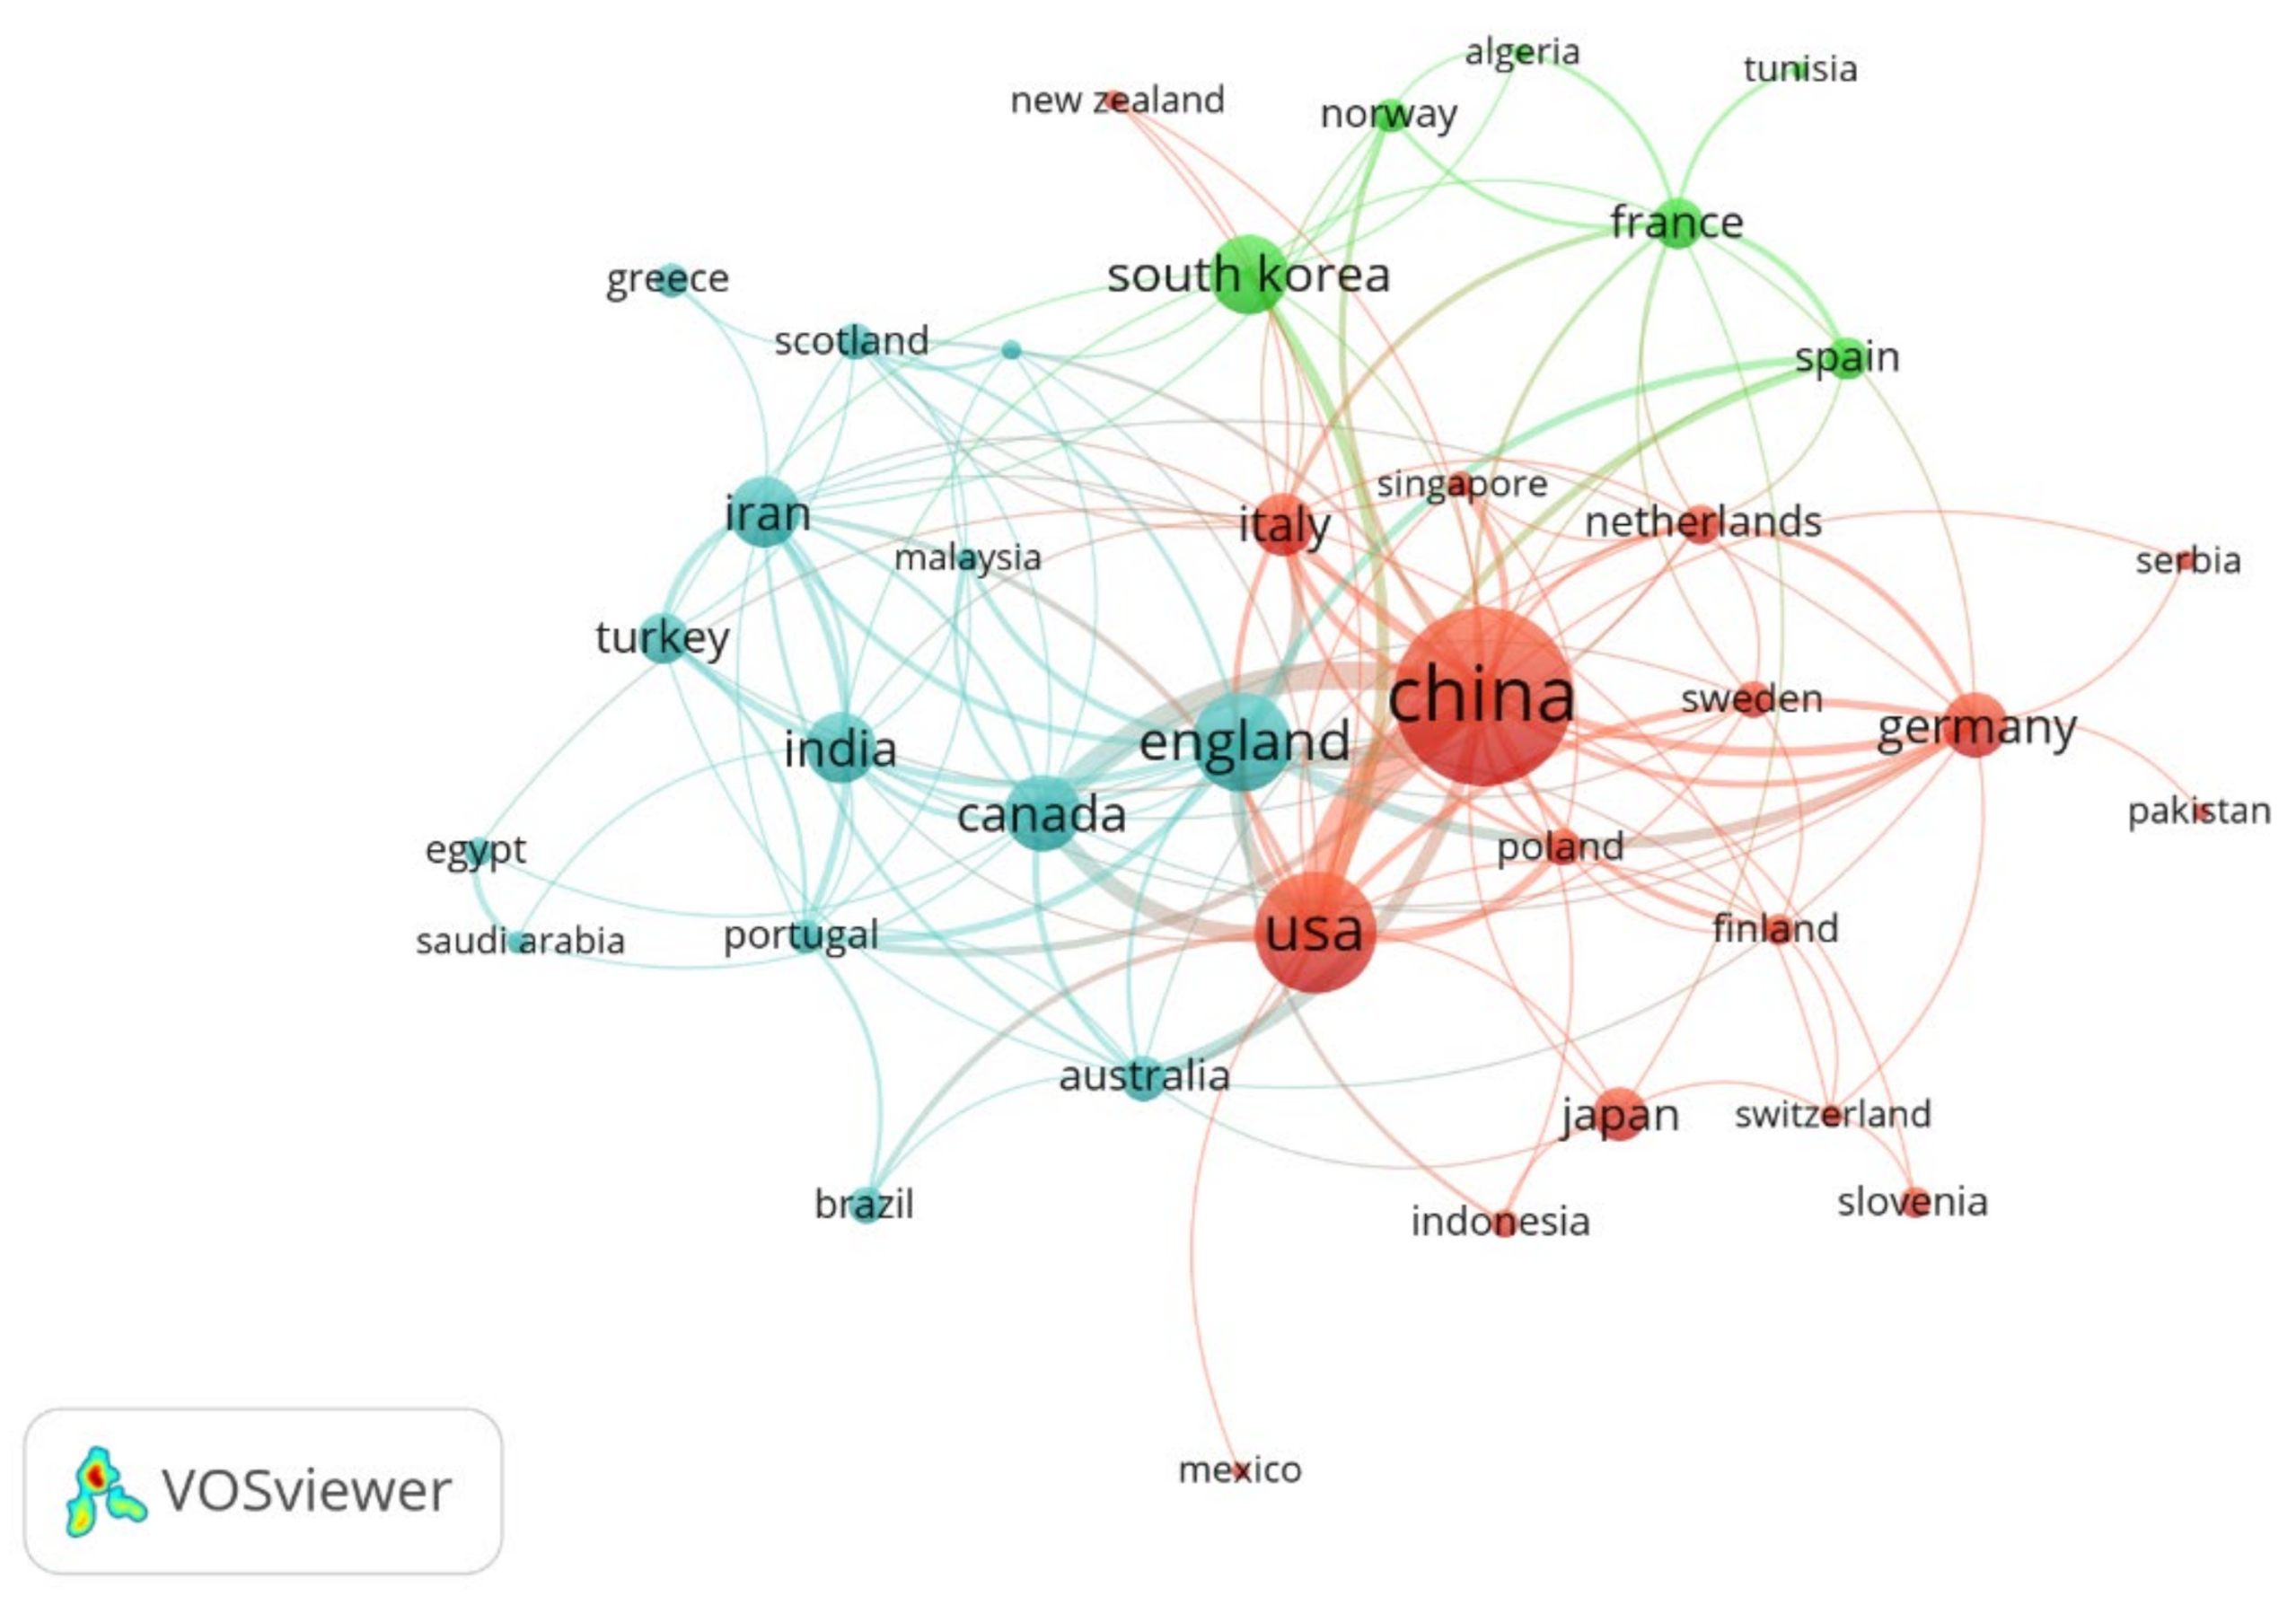
The evolution of FTA research can be divided into three stages: the wave development stage (1995–2008), the stable development stage (2008–2018) and the rapid development stage (2018-present). Before 2009, the United States was the world leader in the amount of literature published and had a comparatively high research level. China began late in this field but overtook the United States in the stable development stage, with the most publications. The distribution of disciplines reflects that FTA is a multidisciplinary research field based on engineering industrial, engineering chemical, engineering electrical electronic, computer science and management science. Research groups with distinct geographical characteristics have been formed. However, the cooperation is not close, and there is a tendency to extend the cooperation from developed to developing countries.
(2)
“Reliability Engineering & System Safety”, “Journal of Loss Prevention in the Process Industries, and “Quality and Reliability Engineering International” are the top three journals that published literature on FTA research. Fuzzy fault tree analysis, dynamic fault tree analysis and FTA based on binary decision diagrams are the knowledge bases of the FTA research field. The co-cited literature can be roughly divided into three categories: safety science, reliability engineering and mathematical models and algorithms, and the core journals of each category are “Safety Science”, “Reliability Engineering & System Safety” and “Fuzzy Sets and Systems”.
(3)
The fundamental theory and system of FTA research have been preliminarily constructed. The main research directions in the field of FTA are the optimization of traditional FTA, system reliability analysis, risk analysis and safety management. Risk analysis in the energy field, the prevention of catastrophic accidents and the enhancement of system reliability are the current application hotspots of FTA. Fuzzy fault tree analysis, dynamic fault tree analysis based on Bayesian networks and FTA combined with management factors may be the main research hotspots and the frontiers. Fires, explosions, and shipping accidents may become the frontier fields of the application of FTA.
In this paper, we conducted an informetrics analysis of the literature related to FTA and obtained valuable results, such as current research hotspots and frontiers. However, there are some limitations. First, the informetric analysis’s accuracy depends on the database’s comprehensiveness, which may lead to an incomplete collection of literature in this study. Secondly, although we have conducted the search using a reasonable search formula, there may still be poorly related literature, leading to discrepancies between the research topic and the collected literature. In future research, we can program to extract relevant literature to the research topic and expand the data sources reasonably to collect more convincing literature. Based on this, we will conduct an in-depth study of the important research directions in the FTA research field and further analyze its research status and development trends.

Author Contributions

Conceptualization, H.L. and K.P.; methodology, H.L., K.P.; software, K.P. and X.G.; validation, X.G., R.H., D.Y. and H.W.; investigation, H.L., K.P., A.G. and J.K.; writing—original draft preparation, K.P. and H.L.; writing—review and editing, H.L., R.H.; funding acquisition, H.L. All authors have read and agreed to the published version of the manuscript.

Funding

This work was supported in part by the Zhejiang Provincial Natural Science Foundation of China (No. LY22E040001) and the Fundamental Research Funds for the Provincial Universities of Zhejiang (Nos. 2021YW92 and 2022YW92).

Institutional Review Board Statement

Not applicable.

Informed Consent Statement

Not applicable.

Data Availability Statement

Not applicable.

Conflicts of Interest

The authors declare no conflict of interest.

References

  1. Bhattacharyya, S.K.; Cheliyan, A.S. Optimization of a subsea production system for cost and reliability using its fault tree model. Reliab. Eng. Syst. Saf. 2019, 185, 213–219. [Google Scholar] [CrossRef]
  2. Jung, S.; Yoo, J.; Lee, Y. A software fault tree analysis technique for formal requirement specifications of nuclear reactor protection systems. Reliab. Eng. Syst. Saf. 2020, 203, 107064. [Google Scholar] [CrossRef]
  3. Huang, J.; You, J.; Liu, H.; Song, M. Failure mode and effect analysis improvement: A systematic literature review and future research agenda. Reliab. Eng. Syst. Saf. 2020, 199, 106885. [Google Scholar] [CrossRef]
  4. Liu, P.; Li, Y. An improved failure mode and effect analysis method for multi-criteria group decision-making in green logistics risk assessment. Reliab. Eng. Syst. Saf. 2021, 215, 107826. [Google Scholar] [CrossRef]
  5. Piadeh, F.; Ahmadi, M.; Behzadian, K. Reliability assessment for hybrid systems of advanced treatment units of industrial wastewater reuse using combined event tree and fuzzy fault tree analyses. J. Clean. Prod. 2018, 201, 958–973. [Google Scholar] [CrossRef]
  6. Choi, I.; Chang, D. Reliability and availability assessment of seabed storage tanks using fault tree analysis. Ocean Eng. 2016, 120, 1–14. [Google Scholar] [CrossRef]
  7. Hu, Y. Research on the application of fault tree analysis for building fire safety of hotels. Procedia Eng. 2016, 135, 524–530. [Google Scholar] [CrossRef]
  8. Walker, M.; Papadopoulos, Y. Qualitative temporal analysis: Towards a full implementation of the Fault Tree Handbook. Control Eng. Pract. 2009, 17, 1115–1125. [Google Scholar] [CrossRef]
  9. Ruijters, E.; Stoelinga, M. Fault tree analysis: A survey of the state-of-the-art in modeling, analysis and tools. Comput. Sci. Rev. 2015, 15–16, 29–62. [Google Scholar] [CrossRef]
  10. Lee, W.S.; Grosh, D.L.; Tillman, F.A.; Lie, C.H. Fault tree analysis, methods, and applications-a review. IEEE Trans. Reliab. 1985, 34, 194–203. [Google Scholar] [CrossRef]
  11. Bhangu, N.S.; Pahuja, G.L.; Singh, R. Application of fault tree analysis for evaluating reliability and risk assessment of a thermal power plant. Energ. Sources 2015, 37, 2004–2012. [Google Scholar] [CrossRef]
  12. Yousfi Steiner, N.; Hissel, D.; Moçotéguy, P.; Candusso, D.; Marra, D.; Pianese, C.; Sorrentino, M. Application of Fault Tree Analysis to Fuel Cell diagnosis. Fuel Cells 2012, 12, 302–309. [Google Scholar] [CrossRef]
  13. Wu, Y.; Laiwang, B.; Shu, C. Investigation of an explosion at a styrene plant with alkylation reactor feed furnace. Appl. Sci. 2019, 9, 503. [Google Scholar] [CrossRef]
  14. Sano, K.; Koshiba, Y.; Ohtani, H. Risk assessment and risk reduction of an acrylonitrile production plant. J. Loss Prevent. Proc. 2020, 63, 104015. [Google Scholar] [CrossRef]
  15. Renjith, V.R.; Madhu, G.G.; Nayagam, V.L.G.; Bhasi, A.B. Two-dimensional fuzzy fault tree analysis for chlorine release from a chlor-alkali industry using expert elicitation. J. Hazard. Mater. 2010, 183, 103–110. [Google Scholar] [CrossRef]
  16. Mahmood, Y.A.; Ahmadi, A.; Verma, A.K.; Srividya, A.; Kumar, U. Fuzzy fault tree analysis: A review of concept and application. Int. J. Syst. Assur. Eng. 2013, 4, 19–32. [Google Scholar] [CrossRef]
  17. Purba, J.H.; Sony Tjahyani, D.T.; Ekariansyah, A.S.; Tjahjono, H. Fuzzy probability based fault tree analysis to propagate and quantify epistemic uncertainty. Ann. Nucl. Energy 2015, 85, 1189–1199. [Google Scholar] [CrossRef]
  18. Lindhe, A.; Norberg, T.; Rosén, L. Approximate dynamic fault tree calculations for modelling water supply risks. Reliab. Eng. Syst. Saf. 2012, 106, 61–71. [Google Scholar] [CrossRef]
  19. Kabir, S. An overview of fault tree analysis and its application in model based dependability analysis. Expert Syst. Appl. 2017, 77, 114–135. [Google Scholar] [CrossRef]
  20. Tanaka, H.; Fan, L.T.; Lai, F.S.; Toguchi, K. Fault-Tree analysis by fuzzy probability. IEEE Trans. Reliab. 1983, 32, 453–457. [Google Scholar] [CrossRef]
  21. Geymayr, J.A.B.; Ebecken, N.F.F. Fault-tree analysis: A knowledge-engineering approach. IEEE Trans. Reliab. 2015, 44, 37–45. [Google Scholar] [CrossRef]
  22. Lin, C.; Wang, M.J. Hybrid fault tree analysis using fuzzy sets. Reliab. Eng. Syst. Saf. 1997, 58, 205–213. [Google Scholar] [CrossRef]
  23. Shu, M.; Cheng, C.; Chang, J. Using intuitionistic fuzzy sets for fault-tree analysis on printed circuit board assembly. Microelectron. Reliab. 2006, 46, 2139–2148. [Google Scholar] [CrossRef]
  24. Dugan, J.B.; Bavuso, S.J.; Boyd, M.A. Dynamic fault-tree models for fault-tolerant computer systems. IEEE Trans. Reliab. 1992, 41, 363–377. [Google Scholar] [CrossRef]
  25. Dugan, J.B.; Sullivan, K.J.; Coppit, D. Developing a low-cost high-quality software tool for dynamic fault-tree analysis. IEEE Trans. Reliab. 2000, 49, 49–59. [Google Scholar] [CrossRef]
  26. Boudali, H.; Crouzen, P.; Stoelinga, M. A rigorous, compositional, and extensible framework for dynamic fault tree analysis. IEEE Trans. Dependable Secur. Comput. 2010, 7, 128–143. [Google Scholar] [CrossRef]
  27. Durga Rao, K.; Gopika, V.; Sanyasi Rao, V.V.S.; Kushwaha, H.S.; Verma, A.K.; Srividya, A. Dynamic fault tree analysis using Monte Carlo simulation in probabilistic safety assessment. Reliab. Eng. Syst. Saf. 2009, 94, 872–883. [Google Scholar] [CrossRef]
  28. Manno, G.; Chiacchio, F.; Compagno, L.; D’Urso, D.; Trapani, N. MatCarloRe: An integrated FT and Monte Carlo Simulink tool for the reliability assessment of dynamic fault tree. Expert Syst. Appl. 2012, 39, 10334–10342. [Google Scholar] [CrossRef]
  29. Bobbio, A.; Portinale, L.; Minichino, M.; Ciancamerla, E. Improving the analysis of dependable systems by mapping fault trees into Bayesian networks. Reliab. Eng. Syst. Saf. 2001, 71, 249–260. [Google Scholar] [CrossRef]
  30. Zhang, J.; Cao, W.; Park, M. Reliability analysis and optimization of cold chain distribution system for fresh agricultural products. Sustainability 2019, 11, 3618. [Google Scholar] [CrossRef] [Green Version]
  31. Wang, H.; Liu, H.; Yao, J.; Ye, D.; Lang, Z.; Glowacz, A. Mapping the knowledge domains of new energy vehicle safety: Informetrics analysis-based studies. J. Energy Storage 2021, 35, 102275. [Google Scholar] [CrossRef]
  32. Liu, H.; Yu, Z.; Chen, C.; Jin, K.; Yang, C. Visualization and bibliometric analysis of research trends on human fatigue assessment. J. Med. Syst. 2018, 42, 179. [Google Scholar] [CrossRef] [PubMed]
  33. Li, J.; Goerlandt, F.; Reniers, G. An overview of scientometric mapping for the safety science community: Methods, tools, and framework. Saf. Sci. 2021, 134, 105093. [Google Scholar] [CrossRef]
  34. Nobanee, H.; Al Hamadi, F.Y.; Abdulaziz, F.A.; Abukarsh, L.S.; Alqahtani, A.F.; AlSubaey, S.K.; Alqahtani, S.M.; Almansoori, H.A. A bibliometric analysis of sustainability and risk management. Sustainability 2021, 13, 3277. [Google Scholar] [CrossRef]
  35. Hong, R.; Xiang, C.; Liu, H.; Glowacz, A.; Pan, W. Visualizing the knowledge structure and research evolution of infrared detection technology studies. Information 2019, 10, 227. [Google Scholar] [CrossRef]
  36. Liu, H.; Chen, H.L.; Hong, R.; Liu, H.G.; You, W.J. Mapping knowledge structure and research trends of emergency evacuation studies. Saf. Sci. 2020, 121, 348–361. [Google Scholar] [CrossRef]
  37. Huang, R.; Liu, H.; Ma, H.L.; Qiang, Y.J.; Pan, K.; Gou, X.Q.; Wang, X.; Ye, D.; Wang, H.N.; Glowacz, A. Accident prevention analysis: Exploring the intellectual structure of a research field. Sustainability 2022, 14, 8784. [Google Scholar] [CrossRef]
  38. van Eck, N.J.; Waltman, L. Software survey: VOSviewer, a computer program for bibliometric mapping. Scientometrics 2010, 84, 523–538. [Google Scholar] [CrossRef]
  39. Hassan-Montero, Y.; Guerrero-Bote, V.P.; De-Moya-Anegón, F. Graphical interface of the SCImago Journal and Country Rank: An interactive approach to accessing bibliometric information. Prof. Inf. 2014, 23, 272–278. [Google Scholar] [CrossRef]
  40. Liu, H.; Hong, R.; Xiang, C.; Lv, C.; Li, H. Visualization and analysis of mapping knowledge domains for spontaneous combustion studies. Fuel 2020, 262, 116598. [Google Scholar] [CrossRef]
  41. Pilkington, A.; Meredith, J. The evolution of the intellectual structure of operations management—1980–2006: A citation/co-citation analysis. J. Oper. Manag. 2009, 27, 185–202. [Google Scholar] [CrossRef]
  42. Small, H. Co-citation in the scientific literature: A new measure of the relationship between two documents. J. Am. Soc. Inf. Sci. 1973, 24, 265–269. [Google Scholar] [CrossRef]
  43. Lang, Z.; Liu, H.; Meng, N.; Wang, H.; Wang, H.; Kong, F. Mapping the knowledge domains of research on fire safety—An informetrics analysis. Tunn. Undergr. Space Technol. 2021, 108, 103676. [Google Scholar] [CrossRef]
  44. Liu, P.; Yang, L.; Gao, Z.; Li, S.; Gao, Y. Fault tree analysis combined with quantitative analysis for high-speed railway accidents. Safety Sci. 2015, 79, 344–357. [Google Scholar] [CrossRef]
  45. Yang, J.; Huang, H.; Liu, Y.; Li, Y. Evidential networks for fault tree analysis with imprecise knowledge. Int. J. Turbo Jet-Engines 2012, 29, 111–122. [Google Scholar] [CrossRef]
  46. Liu, Z.; Li, Y.; He, L.; Yang, Y.; Huang, H. A new fault tree analysis approach based on imprecise reliability model. Proc. Inst. Mech. Eng. Part O J. Risk Reliab. 2014, 228, 371–381. [Google Scholar] [CrossRef]
  47. García Márquez, F.P.; Tobias, A.M.; Pinar Pérez, J.M.; Papaelias, M. Condition monitoring of wind turbines: Techniques and methods. Renew. Energ. 2012, 46, 169–178. [Google Scholar] [CrossRef]
  48. Khakzad, N.; Khan, F.; Amyotte, P. Safety analysis in process facilities: Comparison of fault tree and Bayesian network approaches. Reliab. Eng. Syst. Saf. 2011, 96, 925–932. [Google Scholar] [CrossRef]
  49. Trucco, P.; Cagno, E.; Ruggeri, F.; Grande, O. A Bayesian Belief Network modelling of organisational factors in risk analysis: A case study in maritime transportation. Reliab. Eng. Syst. Saf. 2008, 93, 845–856. [Google Scholar] [CrossRef]
  50. Li, D. A ratio ranking method of triangular intuitionistic fuzzy numbers and its application to MADM problems. Comput. Math. Appl. 2010, 60, 1557–1570. [Google Scholar] [CrossRef] [Green Version]
  51. Volkanovski, A.; Čepin, M.; Mavko, B. Application of the fault tree analysis for assessment of power system reliability. Reliab. Eng. Syst. Saf. 2009, 94, 1116–1127. [Google Scholar] [CrossRef]
  52. Khan, F.; Rathnayaka, S.; Ahmed, S. Methods and models in process safety and risk management: Past, present and future. Process Saf. Environ. Prot. 2015, 98, 116–147. [Google Scholar] [CrossRef]
  53. Marhavilas, P.K.; Koulouriotis, D.; Gemeni, V. Risk analysis and assessment methodologies in the work sites: On a review, classification and comparative study of the scientific literature of the period 2000–2009. J. Loss Prevent. Proc. 2011, 24, 477–523. [Google Scholar] [CrossRef]
  54. Hasana, U.; Swain, S.K.; George, B. A bibliometric analysis of ecotourism: A safeguard strategy in protected areas. Regional Sustainability 2022, 3, 27–40. [Google Scholar] [CrossRef]
  55. Gou, X.Q.; Liu, H.; Qiang, Y.J.; Lang, Z.H.; Wang, H.N.; Ye, D.; Wang, Z.W.; Wang, H. In-depth analysis on safety and security research based on system dynamics: A bibliometric mapping approach-based study. Saf. Sci. 2022, 147, 105617. [Google Scholar] [CrossRef]
  56. Reay, K.A.; Andrews, J.D. A fault tree analysis strategy using binary decision diagrams. Reliab. Eng. Syst. Saf. 2002, 78, 45–56. [Google Scholar] [CrossRef]
  57. Sinnamon, R.M.; Andrews, J.D. Improved accuracy in quantitative fault tree analysis. Qual. Reliab. Eng. Int. 1997, 13, 285–292. [Google Scholar] [CrossRef]
  58. Sinnamon, R.M.; Andrews, J.D. New approaches to evaluating fault trees. Reliab. Eng. Syst. Saf. 1997, 58, 89–96. [Google Scholar] [CrossRef]
  59. Khan, F.I.; Abbasi, S.A. Analytical simulation and PROFAT II: A new methodology and a computer automated tool for fault tree analysis in chemical process industries. J. Hazard. Mater. 2000, 75, 1–27. [Google Scholar] [CrossRef]
  60. Khan, F.I.; Haddara, M.R. Risk-based maintenance of ethylene oxide production facilities. J. Hazard. Mater. 2004, 108, 147–159. [Google Scholar] [CrossRef]
  61. Ferdous, R.; Khan, F.; Sadiq, R.; Amyotte, P.; Veitch, B. Fault and event tree analyses for process systems risk analysis: Uncertainty handling formulations. Risk Anal. 2011, 31, 86–107. [Google Scholar] [CrossRef]
  62. Liu, Y.; Li, Y.F.; Huang, H.Z.; Zuo, M.J.; Sun, Z.Q. Optimal preventive maintenance policy under fuzzy Bayesian reliability assessment environments. IIE Trans. 2010, 42, 734–745. [Google Scholar] [CrossRef]
  63. Huang, H.Z.; Tong, X.; Zuo, M.J. Posbist fault tree analysis of coherent systems. Reliab. Eng. Syst. Saf. 2004, 84, 141–148. [Google Scholar] [CrossRef]
  64. Ferdous, R.; Khan, F.; Veitch, B.; Amyotte, P.R. Methodology for computer aided fuzzy fault tree analysis. Process Saf. Environ. Prot. 2009, 87, 217–226. [Google Scholar] [CrossRef]
  65. Cepin, M. Advantages and difficulties with the application of methods of probabilistic safety assessment to the power systems reliability. Nucl. Eng. Des. 2012, 246, 136–140. [Google Scholar] [CrossRef]
  66. Yazdi, M.; Kabir, S. A fuzzy Bayesian network approach for risk analysis in process industries. Process Saf. Environ. Protect. 2017, 111, 507–519. [Google Scholar] [CrossRef]
  67. Liu, H.; Xie, Y.; Liu, Y.; Nie, R.; Li, X. Mapping the knowledge structure and research evolution of urban rail transit safety studies. IEEE Access 2019, 7, 186437–186455. [Google Scholar] [CrossRef]
  68. Singer, D. A fuzzy set approach to fault tree and reliability analysis. Fuzzy Sets Syst. 1990, 34, 145–155. [Google Scholar] [CrossRef]
  69. Atanassov, K.T. Intuitionistic fuzzy sets. Fuzzy Sets Syst. 1986, 20, 87–96. [Google Scholar] [CrossRef]
  70. Ding, Y.H.D.; Yu, D.T. Estimation of failure probability of oil and gas transmission pipelines by fuzzy fault tree analysis. J. Loss Prev. Process Ind. 2005, 18, 83–88. [Google Scholar]
  71. Kabir, S.; Walker, M.; Papadopoulos, Y.; Rude, E.; Securius, P. Fuzzy temporal fault tree analysis of dynamic systems. Int. J. Approx. Reason. 2016, 77, 20–37. [Google Scholar] [CrossRef] [Green Version]
  72. Amari, S.; Dill, G.; Howald, E. A new approach to solve dynamic fault trees. In Proceedings of the Annual Reliability and Maintainability Symposium 2003, Tampa, FL, USA, 27–30 January 2003; pp. 374–379. [Google Scholar]
  73. Dugan, J.B.; Bavuso, S.J.; Boyd, M.A. Fault trees and Markov models for reliability analysis of fault-tolerant digital systems. Reliab. Eng. Syst. Saf. 1993, 39, 291–307. [Google Scholar] [CrossRef]
  74. Čepin, M.; Mavko, B. A dynamic fault tree. Reliab. Eng. Syst. Saf. 2002, 75, 83–91. [Google Scholar] [CrossRef]
  75. Huang, H.Z.; Zhang, H.; Li, Y.F. A New Ordering Method of Basic Events in Fault Tree Analysis. Qual. Reliab. Eng. Int. 2012, 28, 297–305. [Google Scholar] [CrossRef]
  76. Rauzy, A. New algorithms for fault trees analysis. Reliab. Eng. Syst. Saf. 1993, 40, 203–211. [Google Scholar] [CrossRef]
  77. Sinnamon, R.M.; Andrews, J.D. Improved efficiency in qualitative fault tree analysis. Qual. Reliab. Eng. Int. 1997, 13, 293–298. [Google Scholar] [CrossRef]
  78. Zhu, C.; Tang, S.; Li, Z.; Fang, X. Dynamic study of critical factors of explosion accident in laboratory based on FTA. Saf. Sci. 2020, 130, 104877. [Google Scholar] [CrossRef]
  79. Li, Y.; Huang, H.; Liu, Y.; Xiao, N.; Li, H. A new fault tree analysis method: Fuzzy dynamic fault tree analysis. Eksploat. I Niezawodn.-Maint. Reliab. 2012, 14, 208–214. [Google Scholar]
  80. Kumar, M.; Yadav, S.P. The weakest t-norm based intuitionistic fuzzy fault-tree analysis to evaluate system reliability. ISA Trans. 2012, 51, 531–538. [Google Scholar] [CrossRef]
  81. Peeters, J.; Basten, R.J.; Tinga, T. Improving failure analysis efficiency by combining FTA and FMEA in a recursive manner. Reliab. Eng. Syst. Saf. 2018, 172, 36–44. [Google Scholar] [CrossRef]
  82. Hosseini, N.; Givehchi, S.; Maknoon, R. Cost-based fire risk assessment in natural gas industry by means of fuzzy FTA and ETA. J. Loss Prev. Process Ind. 2020, 63, 104025. [Google Scholar] [CrossRef]
  83. Chen, Y.; Tian, Z.; Roberts, C.; Hillmansen, S.; Chen, M. Reliability and life evaluation of a DC traction power supply system considering load characteristics. IEEE Trans. Transp. Electrif. 2020, 7, 958–968. [Google Scholar] [CrossRef]
  84. Budiyanto, M.A.; Fern, A.H. Risk assessment of work accident in container terminals using the fault tree analysis method. J. Mar. Sci. Eng. 2020, 8, 466. [Google Scholar] [CrossRef]
  85. Wang, H.; Li, J.; Wang, D.; Huang, Z. A novel method of fuzzy fault tree analysis combined with VB program to identify and assess the risk of coal dust explosions. PLoS ONE 2017, 12, e182453. [Google Scholar] [CrossRef] [PubMed]
  86. Yuan, C.; Cui, H.; Tao, B.; Ma, S. Cause factors in emergency process of fire accident for oil–gas storage and transportation based on fault tree analysis and modified Bayesian network model. Energy Environ. 2018, 29, 802–821. [Google Scholar] [CrossRef]
  87. Guo, X.Y.; Meng, B.; Liu, Y.W.; Lu, N.; Fu, S.; Si, Q.M. A human error mechanism for pilot based on fault tree analysis and Bayesian network. J. Intell. Fuzzy Syst. 2020, 38, 6863–6871. [Google Scholar]
  88. Cheliyan, A.S.; Bhattacharyya, S.K. Fuzzy fault tree analysis of oil and gas leakage in subsea production systems. J. Ocean. Eng. Sci. 2018, 3, 38–48. [Google Scholar] [CrossRef]
  89. Lavasani, S.M.; Ramzali, N.; Sabzalipour, F.; Akyuz, E. Utilisation of Fuzzy Fault Tree Analysis (FFTA) for quantified risk analysis of leakage in abandoned oil and natural-gas wells. Ocean Eng. 2015, 108, 729–737. [Google Scholar] [CrossRef]
  90. Shi, S.; Jiang, B.; Meng, X. Assessment of gas and dust explosion in coal mines by means of fuzzy fault tree analysis. Int. J. Min. Sci. Technol. 2018, 28, 991–998. [Google Scholar] [CrossRef]
  91. Ahn, Y.; Yu, Y.; Kim, J. Accident cause factor of fires and explosions in tankers using fault tree analysis. J. Mar. Sci. Eng. 2021, 9, 844. [Google Scholar] [CrossRef]
  92. Xu, J.; Yang, M.; Li, S. Hardware reliability analysis of a coal mine gas monitoring system based on Fuzzy-FTA. Appl. Sci. 2021, 11, 10616. [Google Scholar] [CrossRef]
  93. Knežević, V.; Orović, J.; Stazić, L.; Čulin, J. Fault tree analysis and failure diagnosis of marine diesel engine turbocharger system. J. Mar. Sci. Eng. 2020, 8, 1004. [Google Scholar] [CrossRef]
  94. Liu, J.; Li, J.; Wang, J. In-depth analysis on thermal hazards related research trends about lithium-ion batteries: A bibliometric study. J. Energy Storage 2021, 35, 102253. [Google Scholar] [CrossRef]
  95. Kabir, S.; Geok, T.K.; Kumar, M.; Yazdi, M.; Hossain, F. A method for temporal fault tree analysis using intuitionistic fuzzy set and expert elicitation. IEEE Access 2019, 8, 980–996. [Google Scholar] [CrossRef]
  96. Zhang, Q.; Zhuang, Y.; Wei, Y.; Jiang, H.; Yang, H. Railway safety risk assessment and control optimization method based on FTA-FPN: A case study of chinese High-Speed railway station. J. Adv. Transp. 2020, 2020, 3158546. [Google Scholar] [CrossRef]
  97. Botti, L.; Melloni, R.; Oliva, M. Learn from the past and act for the future: A holistic and participative approach for improving occupational health and safety in industry. Saf. Sci. 2022, 145, 105475. [Google Scholar] [CrossRef]
  98. Hua, W.; Chen, J.; Qin, Q.E.; Wan, Z.; Song, L. Causation analysis and governance strategy for hazardous cargo accidents at ports: Case study of Tianjin Port’s hazardous cargo explosion accident. Mar. Pollut. Bull. 2021, 173, 113053. [Google Scholar] [CrossRef]
  99. Sarıalioğlu, S.; Uğurlu, Ö.; Aydın, M.; Vardar, B.; Wang, J. A hybrid model for human-factor analysis of engine-room fires on ships: HFACS-PV&FFTA. Ocean Eng. 2020, 217, 107992. [Google Scholar]
  100. Al-Shanini, A.; Ahmad, A.; Khan, F. Accident modelling and safety measure design of a hydrogen station. Int. J. Hydrog. Energy 2014, 39, 20362–20370. [Google Scholar] [CrossRef]
  101. Aydin, M.; Camliyurt, G.; Akyuz, E.; Arslan, O. Analyzing human error contributions to maritime environmental risk in oil/chemical tanker ship. Hum. Ecol. Risk Assess. Int. J. 2021, 27, 1838–1859. [Google Scholar] [CrossRef]
  102. Jiskani, I.M.; Yasli, F.; Hosseini, S.; Rehman, A.U.; Uddin, S. Improved Z-number based fuzzy fault tree approach to analyze health and safety risks in surface mines. Resour. Policy 2022, 76, 102591. [Google Scholar] [CrossRef]
Figure 1. Diagram of traditional FTA.
Sustainability 14 11430 g001
Figure 2. Informetric analysis procedure of FTA studies.
Sustainability 14 11430 g002
Figure 3. Publication growth trend around the world of FTA studies, 1995–2021.
Sustainability 14 11430 g003
Figure 4. FTA study publication growth trends in four countries (China, USA, England and South Korea).
Sustainability 14 11430 g004
Figure 5. Literature quantity and H-index of the top 10 countries for FTA studies.
Sustainability 14 11430 g005
Figure 6. Cooperation among countries for FTA studies, 1995–2021.
Sustainability 14 11430 g006
Figure 7. Top 10 subject categories of FTA studies.
Sustainability 14 11430 g007
Figure 8. Institution cooperation network for FTA studies, 1995–2021.
Sustainability 14 11430 g008
Figure 9. Cooperation of main journals in FTA studies, 1995–2021.
Sustainability 14 11430 g009
Figure 10. Top 10 journals of FTA studies, 1995–2021.
Sustainability 14 11430 g010
Figure 11. Author cooperative network diagram of FTA studies, 1995–2021.
Sustainability 14 11430 g011
Figure 12. Reference co-citation network of FTA studies, 1995–2021.
Sustainability 14 11430 g012
Figure 13. Journal co-citation network of FTA studies, 1995–2021.
Sustainability 14 11430 g013
Figure 14. Keyword co-occurrence network of FTA studies, 1995–2021.
Sustainability 14 11430 g014
Figure 15. Keyword co-occurrence time series diagram of FTA studies, 1995–2021.
Sustainability 14 11430 g015
Figure 16. Term clusters of the FTA studies: (a) Distinguished clusters; (b) Term cluster by average year distribution.
Sustainability 14 11430 g016
Table 1. Data set establishment of FTA studies, 1995–2021.
No.Retrieval StrategiesData SetNumber of RecordsPeriodACIData Set Used in Each Section
1TS = “accident tree analysis”A21995–20219.00Not used
2TS = “fault tree analysis”B14681995–202118.71Not used
4TS = “fault tree analysis” OR “accident tree analysis”C1471970–199511.52Not used
5TS = “fault tree analysis” OR “accident tree analysis”D15301990–202118.27Not used
6TS = “fault tree analysis” OR “accident tree analysis”A∪B14691995–202118.69Section 3.1Section 3.6
A ∪ B dataset contains all the literature in A or B; ACI: Average Citations per Item.
Table 2. Literature types of FTA studies, 1995–2021.
No.TLTPSOTCCAProportion/%H-Index
1Articles141926,12316,56496.6074
2Proceedings Papers137189917129.3324
3Review Articles33123311702.2517
4Others351301292.385
TL: Type of Literature; TP: Total Publications; SOTC: Sum of Times Cited; CA: Citing Articles.
Table 3. Top 10 productive countries of FTA studies, 1995–2021.
RankCountryRegionQuantityPercentageACIH-IndexTotal Link Strength
1ChinaEast Asia44630.3615.6342107
2USANorth America21314.5019.053789
3EnglandWestern Europe1399.4624.853162
4South KoreaEast Asia906.1312.341814
5CanadaNorth America805.4539.262847
6IndiaSouthern Asia734.9726.412414
7IranWestern Asia724.9014.311625
8GermanyCentral Europe604.0817.531529
9ItalySouthern Europe573.8830.111632
10JapanEast Asia402.727.6096
ACI: Average Citations per Item.
Table 4. Top 15 institutions for FTA studies, 1995–2021.
NO.InstitutionCountryQuantityTotal Link StrengthSTCACI
1Loughborough UniversityEngland40278519.63
2Memorial University of NewfoundlandCanada3122186160.03
3Korea Advanced Institute of Science and TechnologyKorean241138916.21
4University of Electronic Science and Technology of ChinaChina241144318.46
5Korea Atomic Energy Research InstituteKorean201142421.20
6Beijing Jiaotong UniversityChina1841769.78
7University of HullEngland18772440.22
8University of Chinese Academy of SciencesChina172322613.29
9Islamic Azad UniversityIran1651086.75
10China University of PetroleumChina15333922.60
11University of StrathclydeScotland15433222.13
12Istanbul University of Science and TechnologyTurkey14456540.36
13Jiangxi University of Finance and EconomicsChina14341429.57
14Huazhong University of Science and TechnologyChina13631824.46
15Dalhousie UniversityCanada1214106889.00
STC: Sum of Times Cited; ACI: Average Citations per Item.
Table 5. Top 10 journals of FTA studies, 1995–2021.
NO.Journal TitleQuantityACICitation IndexImpact Factor (2021)
1Reliability Engineering & System Safety12637.05 SCIE7.247
2Journal of Loss Prevention in the Process Industries7030.74 SCIE3.916
3Quality and Reliability Engineering International4416.23 SCIE3.007
4Safety Science3633.78 SCIE6.392
5IEEE Transactions on Reliability3331.91 SCIE5.883
6IEEE Access275.89 SCIE3.476
7Process Safety and Environmental Protection2539.36 SCIE7.926
8Process Safety Progress236.57 SCIE1.294
9Ocean Engineering2322.78 SCIE4.372
10Annals of Nuclear Energy2012.55 SCIE1.810
Table 6. Top 15 papers with the most citations for FTA studies, 1995–2021.
NO.TitleJournalAuthorYearINCNACY
1Improving the analysis of dependable systems by mapping fault trees into Bayesian networksReliability Engineering & System SafetyBobbio et al. [29]20012124.45
2Condition monitoring of wind turbines: Techniques and methodsRenewable EnergyGarcía et al. [47]20122246.91
3Safety analysis in process facilities: Comparison of fault tree and Bayesian network approachesReliability Engineering & System SafetyKhakzad et al. [48]20112132.17
4A Bayesian Belief Network modelling of organisational factors in risk analysis: A case study in maritime transportationReliability Engineering & System SafetyTrucco et al. [49]20082219.67
5Using intuitionistic fuzzy sets for fault-tree analysis on printed circuit board assemblyMicroelectronics ReliabilityShu et al. [23]20062114.94
6A ratio ranking method of triangular intuitionistic fuzzy numbers and its application to MADM problemsComputers and MathematicsLi [50]20102116.92
7Dynamic fault tree analysis using Monte Carlo simulation in probabilistic safety assessmentReliability Engineering & System SafetyRao et al. [27]20093214.86
8Application of the fault tree analysis for assessment of power system reliabilityReliability Engineering & System SafetyVolkanovski et al. [51]20091114.64
9Methods and models in process safety and risk management: Past, present and futureProcess Safety and Environmental ProtectionKhan et al. [52]20151125.13
10Risk analysis and assessment methodologies in the work sites: On a review, classification and comparative study of the scientific literature of the period 2000–2009Journal of Loss Prevention in the Process IndustriesMarhavilas, et al. [53]20112116.75
STC: Sum of Times Cited; ACY: Average Citations per Year; IN: Institute Numbers; CN: Country Numbers.
Table 7. Top 15 authors of FTA studies, 1995–2021.
RankAuthorQuantitiesOrganizationCountryLinksACI
1Andrews, J. D.32Loughborough UniversityEngland1823.75
2Khan, Faisal29Memorial University NewfoundlandCanada4465.69
3Huang, Hongzhong13University of Electronic Science and Technology of ChinaChina3119.54
4Kabir, Sohag13University of HullEngland1748.54
5Li, Yanfeng13University of Electronic Science and Technology of ChinaChina3217.92
6Papadopoulos, Yiannis12University of HullEngland1331.83
7Yazdi, Mohammad11Memorial University NewfoundlandCanada833.36
8Xing, Liudong10University of Electronic Science and Technology of ChinaChina239.00
9Amyotte, Paul9Dalhousie UniversityCanada2194.78
10Bartlett, Lm9James Cook UniversityAustralia713.44
11Liu, Yu9University of Electronic Science and Technology of ChinaChina1823.22
12Wan, Shuping9Jiangxi University of Finance and EconomicsChina739.56
13Wang, Jin9Institute of Nuclear Energy Safety Technology, Chinese Academy of SciencesChina1627.56
14Cepin, Marko8University of LjubljanaSlovenia163.88
15Dugan, Jb8University of VirginiaUSA523.88
Table 8. Popular terms in recent years in FTA studies.
NO.TermClusterOccurrenceAPY
1shipblue cluster222019.05
2fireblue cluster452018.91
3significancegreen cluster332018.82
4explosion accidentblue cluster162018.81
5critical eventblue cluster152018.80
6subsystemred cluster492018.73
7lifegreen cluster302018.50
8applicabilityblue cluster612018.46
9failure analysisgreen cluster302018.40
10reliability assessmentred cluster442018.36
APY: Average Publication Year.
Publisher’s Note: MDPI stays neutral with regard to jurisdictional claims in published maps and institutional affiliations.

