Article

Examining the Factors Influencing Tourists’ Destination: A Case of Nanhai Movie Theme Park in China

1
School of Urban Culture, South China Normal University, Guangzhou 510631, China
2
School of Communication Studies, James Madison University, Harrisonburg, VA 22807, USA
*
Authors to whom correspondence should be addressed.
Sustainability 2022, 14(18), 11419; https://doi.org/10.3390/su141811419
Submission received: 2 August 2022 / Revised: 26 August 2022 / Accepted: 8 September 2022 / Published: 12 September 2022
(This article belongs to the Special Issue Tourist Satisfaction and Sustainable Destination Branding)

Abstract

:
The present study used a stimulus-organism-response (S-O-R) theoretical framework to examine the relationship between theme park tourists’ experience, brand identity, brand satisfaction, and brand loyalty in China. By using the structural equation model (CB-SEM), this paper illustrates the process of forming destination brand loyalty for sustainable tourism on theme parks. The results suggested a second-order structure of tourism experience. The first-order four factors have different impacts on the second-order tourism experience. Activity experience is the most important factor influencing tourism experience, followed by environment experience, then facility experience, and finally interaction experience. In terms of tourism experience, individual brand identity-brand satisfaction-brand loyalty is the most important path of a theme park on tourists’ behavioral intention, among which brand satisfaction plays the most significant partial mediation effect in the relationship between individual identity and destination loyalty. It is expected that the results of this study provide a reference for improving tourists’ brand loyalty to achieve sustainable development of theme parks.

1. Introduction

A theme park is an attraction encompassing all kinds of amusement activities under the umbrella of a single theme, thus creating fun for friends and families [1]. According to the 2019 TEA/AECOM Theme Index and Museum Index, the total number of tourists to the world’s top 10 theme park enterprises in 2019 was 521 million, which increased by 4% compared to 2018 [2]. Therefore, theme parks have been considered one of the most popular places of entertainment in the world [3]. As the most representative experiential tourism product [4,5], it has attracted scholarly attention from interdisciplinary areas to work on the tourists’ experiences of theme parks [6,7,8,9].
Theme park tourism does not only extend unique entertainment activities and experiences to the visitors but also adds tourism value that can ultimately affect their overall evaluation of the theme park brand [10]. The theme park enterprises such as Universal Studios, Disney, and other large international theme parks have captured the Chinese domestic market successfully. In addition, the current developments of China’s local theme park enterprises in recent years have added a plight to the survival of theme parks in the pandemic era [8]. In relation to sustainability, sustainable tourism requires ensuring the balance between the economic and social impact on the environment in which it takes place [11]. As they can consolidate and increase visitor flow, satisfaction and loyalty are usually important indicators of the sustainability of tourist destinations [12,13]. Hence, these enterprises are focusing on how to attract and revive tourists and to meet their tourism experience better so that they can ensure sustainable tourism on theme parks [14]. For instance, Milman and Tasci (2018) regarded satisfactory tourism experience provided for tourists as a crucial reason for success. Similarly, Tasci et al. (2007) suggested that brand loyalty of tourists to enterprises can be one of the effective tools to stimulate revisit intention for tourists. In this regard, this paper examines the formation mechanism between tourism experience and brand loyalty to provide reference suggestions for the sustainable development of theme parks.
Tourism experience emerges from the unconscious feeling and conscious perception of tourists during travel [15]. These feelings and perceptions are generated by encoding, conversion, and memory through the external environmental stimulation transmitted to the sensory organs of the human body [16]. Brand loyalty refers to the repeated commitment and behavior of consumers to the same brand over time [17]. Although the indirect and direct effect of the tourism experience on tourists’ loyalty has been obtained from numerous empirical studies [8,16,18,19], the literature related to theme parks lacks research on the relation between tourism experience and theme park brand, and other mediator variables need to be explored to clarify the influence path of tourism experience on destination.
Brand identity relies on the original social identity theory that emerged in sociology and psychology [20], which holds that the sense of identity comes from the perception of consistency formed by individuals and social groups. Brand identity plays a positive role in promoting enterprise development and is the foundation and core of establishing and managing a brand [21]. Prior studies have shown that brand identity has a significant positive impact on consumer satisfaction and brand loyalty [22,23,24]. What is more, brand identity is usually used as a mediator variable in the theoretical model of consumers’ brand behavior intention [23,25,26]. The significant positive effect of different types of consumer experience on brand identity has also been verified by previous scholars [25,27,28]. However, the impact of tourism experience on brand identity and brand identity on brand satisfaction remains to be explored. Based on the stimulus-organism-response (S-O-R) theory, this paper attempts to assume that the tourism experience of theme park tourists formed by external environmental stimuli will have an impact on the brand identity of the tourism destination and then driven by brand identity, the psychological emotion of theme park brand satisfaction, and the behavioral response of brand loyalty. This paper mainly achieves the following four objectives:
  • To examine the tourism experience components within the theme park context;
  • Explore the relationship between tourists’ experience and their brand identity of theme park;
  • Explain the influence path between brand identity and brand loyalty on theme park;
  • Explain the influence path between tourists’ tourism experience and their brand loyalty of theme park.
In order to achieve the above four objectives, the theoretical and management contributions of this study are as follows: First, using S-O-R theory, this study introduces brand identity and brand satisfaction as mediator variables to broaden the research the framework between tourism experience and destination brand loyalty and constructs the theoretical model of theme park “tourism experience–brand identity–brand satisfaction–brand loyalty.” Second, different from prior scholars’ enthusiasm for Pine and Gilmore’s (1998) tourism experience scale, which is mainly based on the psychological feelings of tourists’ tourism participation depth and degree [29,30], the dimensions of tourism experience in this study are based on the objective scenic spot environments, activities, facilities, and tourists’ interactions [18,31]. Through the construction of the second-order model of theme park tourism experience, the relative importance of each dimension to improving the tourism experience is clear. Third, by exploring the mediating effect of brand identity and brand satisfaction in the theoretical framework, this paper illustrates the process of forming destination brand loyalty for sustainable tourism on theme parks.

2. Literature Review and Theoretical Framework

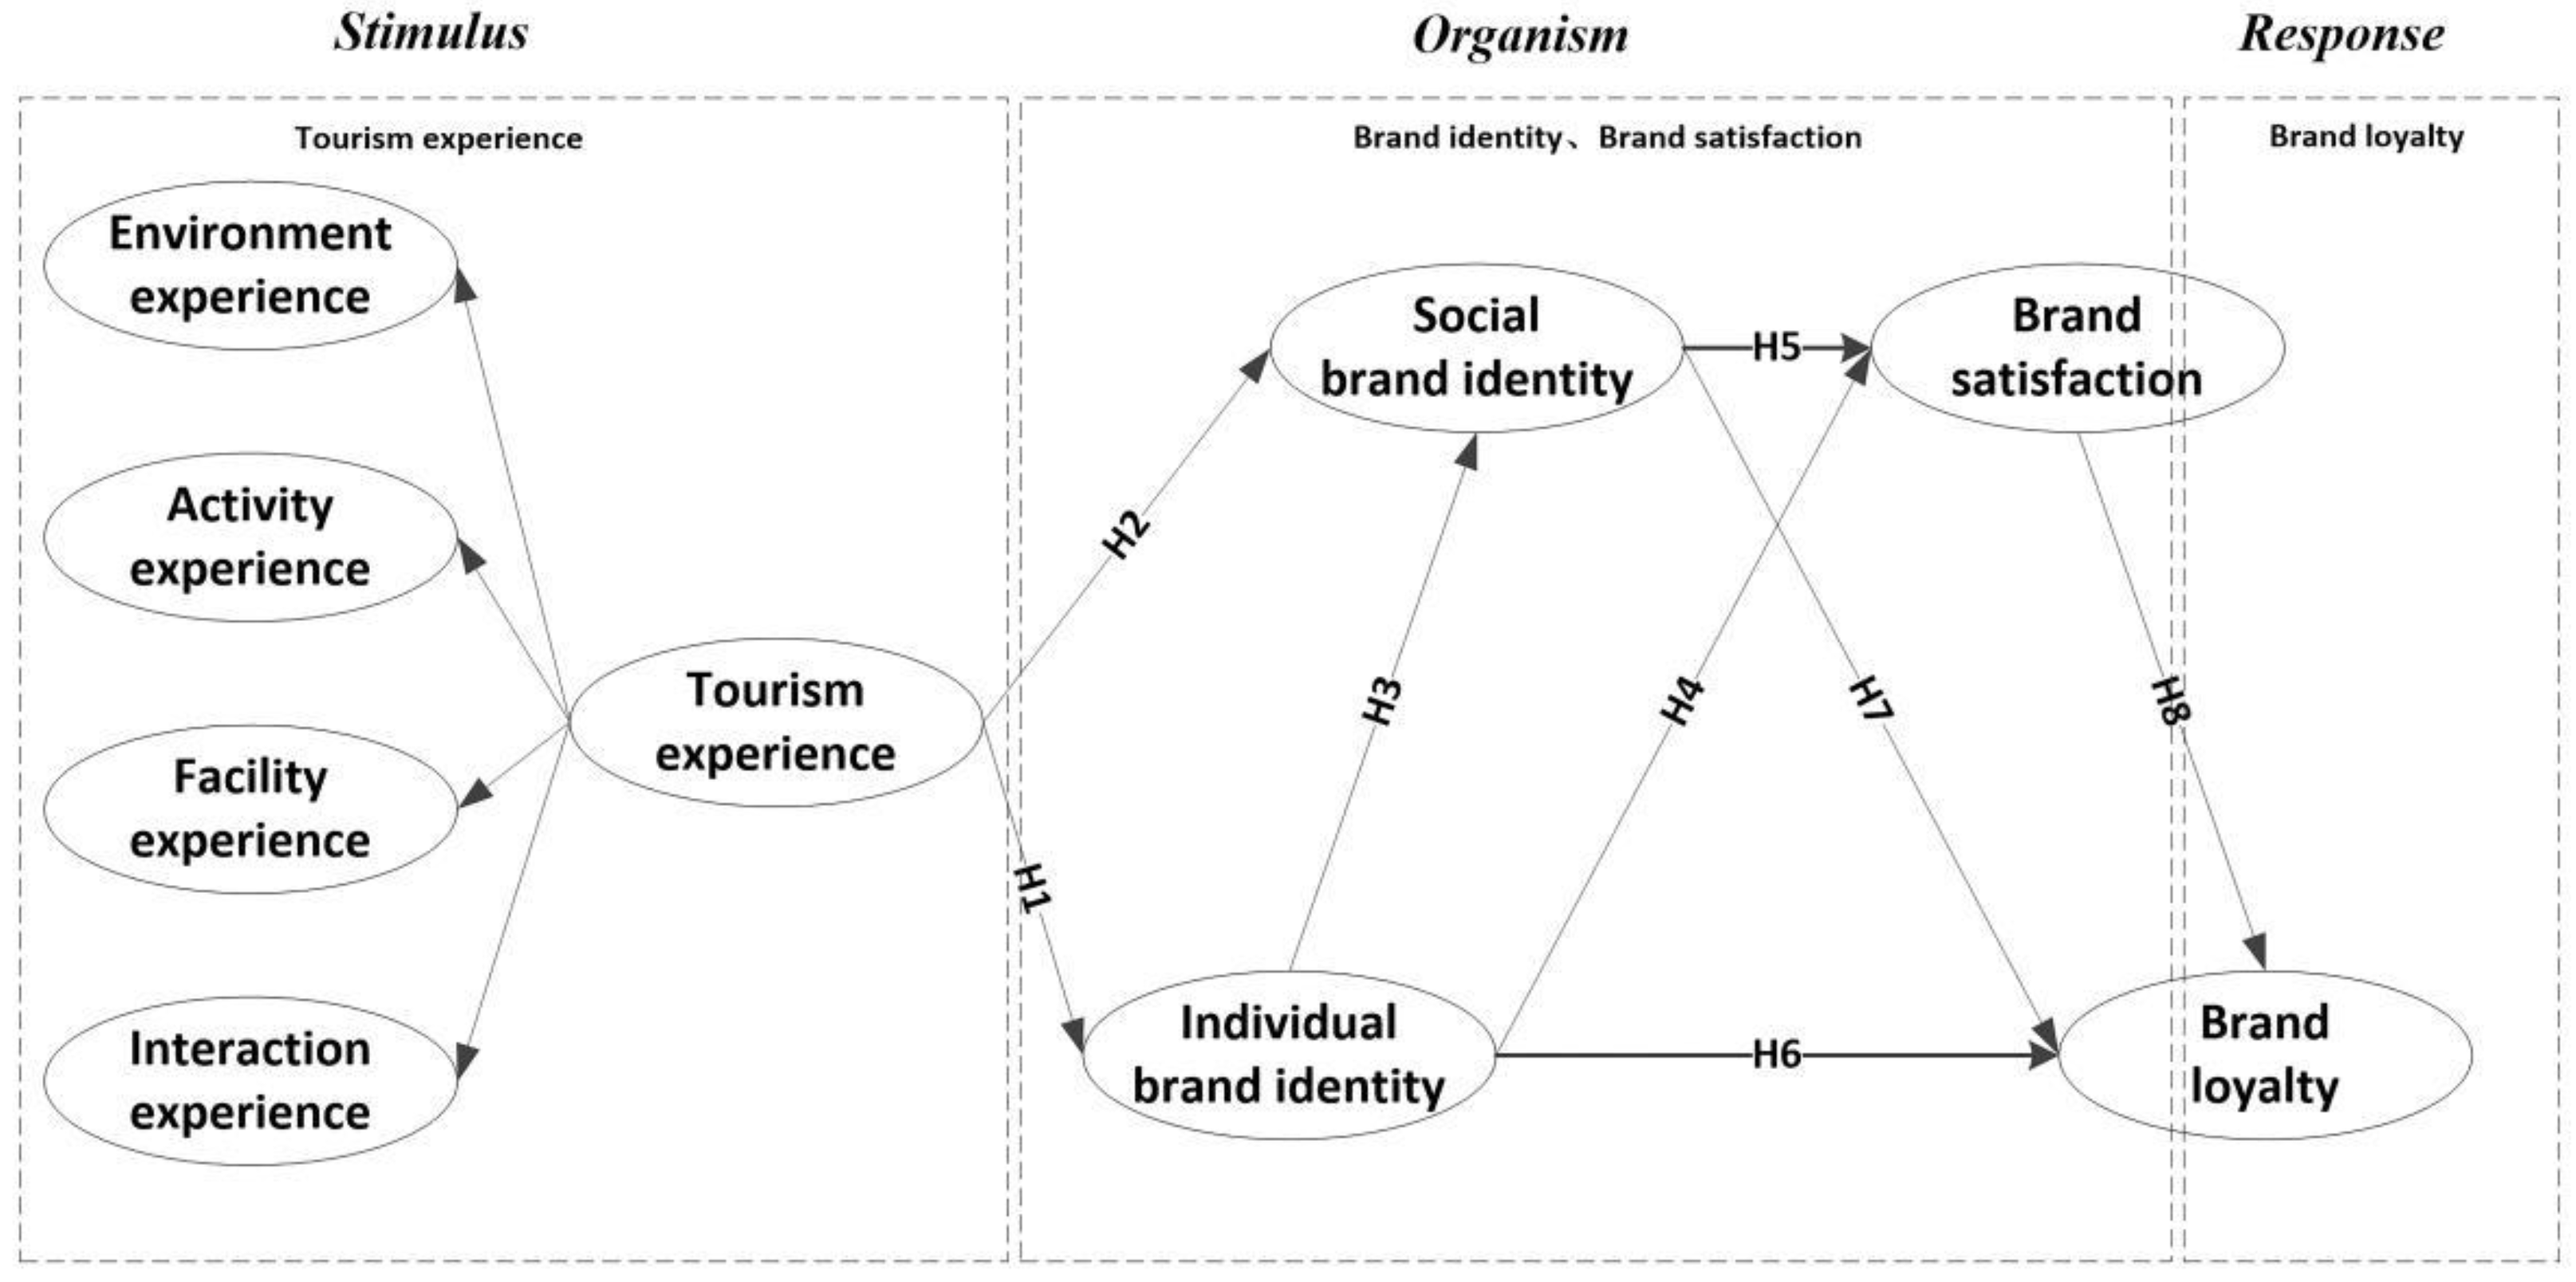
2.1. Stimulus-Organism-Response (S-O-R) Theory

The S-O-R theory was proposed by environmental psychologists Mehrabian and Russell in 1974. This theory explores the effects of various internal and external stimuli related to individuals’ cognitive or psychological responses and then predicts behavior [32]. S-O-R theory suggests that individual behavior is caused by stimulation [32,33,34]. This stimulation comes from the psychological factors inside the individual body and the external environment [35,36]. Those stimuli can affect the psychological cognition and responses of individuals toward products and services [37], thus enabling them to make decisions about which goods or services to buy or avoid [33].
In environmental psychology, S-O-R theory is important to understand the antecedents, intermediate regulation, and results of tourism activities [38]. This theoretical framework has frequently been used to study the environment stimulating tourists’ consumption behavior [38,39]. In addition, within the tourism research, the ability of tourism experience to stimulate individual emotions, cognitive mental states, and reactions is omnipresent [19,40,41]. However, few studies have been conducted to examine the relationship between theme park tourism experience and brand behavior response [3,42]. Many previous scholars have confirmed that tourists’ tourism experience indirectly affects behavioral intention or response through some intermediary variables [18,43,44]. What is more, there is almost no theoretical model of relevant research to confirm the direct impact of tourists’ “tourism experience” on destination “brand loyalty”. Therefore, in light of the important role of tourism experience in influencing individual cognitive mental states and reactions [19,40], this study believes that the application of S-O-R theory can lay a theoretical foundation for the mechanism of tourists’ “tourism experience” influencing brand behavior response through intermediate variables. Last but not least, Xin and Wang (2016) suggested that the impact of tourism destination brand image recognition elements on tourists’ behavior response is regulated by the mediating effect of brand identity, that further demonstrates the potential of the S-O-R theory to be applied in this field.
In this study, the stimulus variable mainly refers to the tourism experience generated by tourists [19]. Organism variables have been used to explain individuals’ cognition and emotion in previous studies [38]. This study suggests that tourists form psychological cognition and evaluation of the tourism destination brand after they form the tourism experience by external stimulation, and driven by brand identity and brand satisfaction, the behavioral response of brand loyalty is formed.

2.2. Tourism Experience

Tourism experience is a combination of commonness and individuality, which can be regarded as a feeling in tourists’ consciousness and an unforgettable experience obtained by tourists in a personalized way with specific emotional, intellectual, physical, and spiritual levels [5]. Regarding the components and dimensions of tourism experience, Schmitt (2000) proposed five types of experience: sense, think, feel, relate, and act [45]. Based on tourism experiences, Pine and Gilmore (1998) suggest that tourists’ perceptions can be categorized as an entertainment experience, education experience, escape experience, and estheticism experience [5]. In addition, the Memorable Tourism Experience (MTE) in recent years has further improved the dimension of the traditional tourism experience and is considered to be an enjoyable and valuable experience that a tourist actively recalls after traveling [46]. MTE uniquely consists of components such as hedonism, meaningfulness, involvement, novelty, and local culture [47]. Although the above tourism experience dimension classifications are widely used by scholars [29,48], which mainly focus on the psychological feelings of the depth and degree of tourism participation, its empirical results are difficult to help tourism destinations plan the tourism projects that tourists really need and explore the key factors to develop the tourist’ brand loyalty toward their tourism destination. Few studies explored the tourism destination experience elements and the theme park experience consumption model [18,48,49]. Chen and Cai (2016) suggests that the tourists’ experiences of theme parks are primarily based on four dimensions: environment experience, activity experience, service experience, and interaction experience. In another study, MTE is composed of “local culture, the variety of activities, hospitality, infrastructure, environment management, accessibility, the quality of service, physiography, place attachment and superstructure” [50]. Prior studies [18,50] combine the textual analysis results of semi-structured interviews and online comments of CTV Media Nanhai movie theme park tourists. This study classified the dimensions of tourism experience into environment experience, activity experience, facility experience, and interaction experience.

2.3. Brand Identity

The concept of brand identity is based on social identity theory, which mainly refers to consumers’ recognition of brand products or services and the value concept and orientation represented behind the brand [28]. Underwood et al. (2001) used the concept of self-concept in social identity theory to explain the motivation of consumers to identify with a particular brand. Self-concept refers to the individual’s views and feelings about the self, which includes two components of personal identity and social identity. Among them, consumers define their personal identity according to their own traits and characteristics and define their social identity according to the characteristics of the social group category to which they belong. Brands are usually representative and symbolic, and consumers rely on brands to demonstrate their self-concept [51]. Based on the related theory of brand identity and brand characteristics, this study defines tourism destination brand identity as a series of psychological states and processes of tourists’ feeling, cognition, and evaluation of the brand belonging to a specific tourism destination and the identity of the tourism destination brand is used to express one’s social identity and individual identity of self-concept.
Based on social identity theory, brand identity has become a new research stream and innovation path of brand marketing, which is often demonstrated together with the concepts of brand image and brand loyalty [21,24]. Some studies have used brand identity as a mediator variable of the model [23,25,26]. Based on the study of Underwood et al. (2001) and Jin (2006), our study divides the tourism destination brand identity into individual brand identity (personality, values, lifestyle represented, and the identity for tourism services provided) and social brand identity (social status, respect, differentiation among social groups, and social identity), respectively.
Prior studies on tourism experience conceptualize it as a stimulus for tourists’ behavioral response [19]. Regarding the impact of experience on brand identity, several studies have confirmed that brand experience, co-creation experience, and consumer experience have a significant positive effect on brand identity [25,27,28]. Although scholars have conducted studies on the antecedent variables of brand identity and brand loyalty [25,26,52], there is still a research gap in the causal relationship between tourism experience as an antecedent variable of destination brand identity and brand identity. Therefore, based on the S-O-R theory, this study takes brand identity as an organism variable between theme park tourists’ tourism experience and brand loyalty. In addition, Jin (2006) and Xu et al. (2021) have established that the individual dimension of brand identity has a positive impact on the social dimension. Based on previous studies, we propose the following hypotheses.
Hypothesis 1
(H1). Tourists’ tourism experience has a significant positive effect on individual brand identity.
Hypothesis 2
(H2). Tourists’ tourism experience has a significant positive effect on social brand identity.
Hypothesis 3
(H3). Tourists’ individual brand identity has a significant positive effect on social brand identity.

2.4. Brand Satisfaction and Brand Loyalty

Brand satisfaction refers to consumers’ inner emotional evaluation or happiness of a particular brand [53], while brand loyalty refers to the repeated commitment and behavior of consumers to the same brand over time [17]. Previous studies found a positive relationship between brand identity and brand loyalty [25,52] and a positive relationship between brand identity and satisfaction [24,54,55]. In addition, some scholars suggest that consumers’ higher identity of enterprises is more likely to form satisfaction with enterprises [56]. Consumers’ brand identity can lead to a more positive overall evaluation by improving their brand perceived value and emotional attachment, thus enhancing their psychological dependence on the brand [57]. Moreover, some studies suggest that brand satisfaction has a significant positive impact on brand loyalty [58,59]. Our study postulates that brand identity also has a significant positive effect on brand satisfaction and brand loyalty in the context of theme parks. The conceptual model is shown in Figure 1. Based on previous studies, we propose the following hypotheses.
Hypothesis 4
(H4). Tourists’ individual brand identity has a significant positive effect on brand satisfaction.
Hypothesis 5
(H5). Tourists’ social brand identity has a significant positive effect on brand satisfaction.
Hypothesis 6
(H6). Tourists’ individual brand identity has a significant positive effect on brand loyalty.
Hypothesis 7
(H7). Tourists’ social brand identity has a significant positive effect on brand loyalty.
Hypothesis 8
(H8). Tourists’ brand satisfaction has a significant positive effect on brand loyalty.

3. Methods

3.1. Study Site and Participants

China Television (CTV) Media Nanhai, a movie theme park located in Foshan, Guangdong Province, China, was used as a site for this study. The scenic spot of CTV Nanhai movie theme park is divided into four key themes, such as the Palace area of the Chinese Dynasty, the Small Water Towns of South China area, the Hong Kong and Macao cultural area, and the leisure and entertainment area. In addition to the CTV Nanhai movie theme park, the Wuxi movie theme park, which is the first of its kind in China, is another theme park operated by CTV Media. In recent years, the company has continuously improved the software and hardware facilities of the scenic spot and created a comfortable tourism environment for tourists. The two theme parks have successively passed the ISO9000 quality system and ISO14000 environmental system certification. Tangcheng scenic spot of CTV Wuxi movie theme park has become the first batch of national 3A scenic spots, Three Kingdoms Water Margin City of Wuxi movie theme park has become the first batch of national 5A scenic spots, and CTV Nanhai movie theme park has been rated as national 4A scenic spots, both of which have great popularity and influence in China. We examined the relationship between theme park tourists’ tourism experience, brand identity, brand satisfaction, and brand loyalty by taking the CTV Nanhai movie theme park as a case study. In view of the geographical principle and the convenience of research, this study selected tourists from the CTV Nanhai movie theme park in Foshan, Guangdong Province, to recruit as participants.

3.2. Measurement and Instrument Design

Based on the existing literature, this study developed a structured questionnaire comprised of 33 items on a 5-point Likert scale. The questionnaire consisted of three parts; (1) demographic information, (2) measure the degree of participation of tourists, and (3) the scale survey of tourism experience and destination brand, including tourism experience, destination brand identity, brand satisfaction, and brand loyalty. In addition, tourists’ tourism experience included four sub-dimensions; (1) environment experience, (2) facility experience, (3) activity experience, and (4) interaction experience.
The measurement items were mainly derived from the tourism experience scale [18,31,50,60], and we divided the brand identity into an individual brand identity and social brand identity, which were slightly modified the items based on theme park tourism [23]; the items of brand satisfaction [1,61]; and the items of the brand loyalty scale [62,63]. To ensure the reliability of the items, we floated a pilot survey to determine the final questionnaire contents. The pilot survey was distributed between 6 and 7 October 2021, and 83 valid questionnaires were collected through field distribution at the CTV Nanhai movie theme park. The Cronbach’s alpha of the eight scales ranges from 0.76 to 0.94.

3.3. Data Collection and Analysis

The authors administered the data collection on the scenic spot. The participants were introduced to the research project, and their participation was on a voluntary basis. To establish a criterion, we included only those visitors who stayed in the CTV Media Nanhai theme park for more than three hours, and the rest of the visitors were excluded. We prepared postcards and key chains with local characteristics for the interviewed tourists as gifts for participating in the study, and the tourists were asked if they had been in the CTV Media Nanhai theme park for more than three hours and if they would like to participate in our study. Once they responded positively, they were subsequently invited to participate in the survey. We collected the data from 10 October to 31 October 2021. At the CTV Nanhai theme park, we collected 320 questionnaires from tourists who had been in the theme park for more than three hours. Overall, we excluded 15 questionnaires based on the respondents’ filling attitudes, and the valid final data was (N = 305), with a response rate of 95.31%. The dataset meets the minimum sample size of structural equation modeling [64,65,66]. The authors used SPSS 23.0 and Amos 23.0 to analyze the data.
Before applying the SEM, the authors checked the data to ensure there were no missing values. In addition, it is necessary to test the basic hypothesis of multivariate normal distribution of sample data. Kline (2015) suggests that when the absolute value of skewness of the sample data is less than 3 and the absolute value of kurtosis is less than 10, it can be assumed that the sample data conform to the normal distribution. The absolute value of skewness of the sample data obtained in this study is 0.106~0.866, and the absolute value of kurtosis is 0.021~1.379, indicating that the sample data in this study have a normal distribution. Since each questionnaire in this study was tested by the same tourist in a self-reported manner, there may be some common method bias to some extent. Therefore, we used Harman’s single-factor approach to examine the common method bias (CMB) measured in this study. Based on this approach, we found that the variance explained by the first principal factor based on an unrotated exploratory factor analysis was 36.712%, which was below the recommended cut-off point of 50% [67]. Therefore, the method confirmed the absence of common methodological errors in the results. In addition, the standard deviation of all items of the questionnaire exceeded 0.6, which met the standard of the 5-level Likert scale. Table 1 presents the demographic information of the participants.

4. Results

4.1. Exploratory Factor Analysis

As a part of establishing the first-order and second-order factor measurement models, we first test the reliability and validity of the data of eight dimensions and then construct the second-order model. This study uses exploratory factor analysis to analyze the validity of the questionnaire. In exploratory factor analysis, eight common factors were extracted by the principal component method, rotated by the maximum variance method, and the items with an absolute value of the coefficient less than 0.5 were excluded. The cumulative variance contribution rate of eight principal components extracted by the exploratory factor analysis for the first time reached 73.697%. According to the results of factor analysis, the factors which do not meet the expectations were successively deleted, especially for their factor load in all components lower than 0.5 (EE4, AE4, IE5, BL1), and the exploratory factor analysis was conducted again according to the same method. The final cumulative variance contribution rate of eight principal components was 76.196% after 8 iterations converge. The KMO value (0.907) and the Bartlett test of sphericity (Sig. = 0.000) of this scale were used to indicate the validity of the questionnaire.

4.2. First-Order Confirmatory Factor Analysis

The indicators for testing the measurement model include mainly convergent validity and discriminant validity [68]. In this study, the maximum likelihood method was used to conduct confirmatory factor analysis on the constructed measurement model, and the convergent validity and discriminant validity of the measurement model were obtained according to the analysis results. The evaluation indexes of convergent validity mainly include factor loading, composite reliability (CR), and average variance extraction (AVE). During confirmatory factor analysis of the eight dimensions of the conceptual model, we found that the residuals of items EE5, AE5, IBI1, and SBI1 were strongly collinear with other measurement factors on the same structural plane, and the residuals of the item were not independent. If the correlation is set for the residuals, it violates the basic principle of residuals independence of the structural equation model [69], so the above four items are deleted. The results of confirmatory factor analysis are sorted in Table 2, which shows that the standardized factor load of all indicators is greater than 0.6 and significant, and the good convergent validity of the model can be indicated by the CR value and the AVE value for which are greater than 0.7 and 0.5, respectively.
This study used the variance extraction test method to test the discriminant validity of the questionnaire. That is, when the average variance extraction of a dimension of the questionnaire is greater than the correlation coefficient between this dimension and another dimension, it indicates that the questionnaire has discriminant validity [70]. As shown in Table 3, the value in the diagonal cell is the arithmetic square root of the AVE value. It can be seen that the correlation coefficients between the corresponding horizontal and vertical dimensions are all smaller than the arithmetic square root of the AVE values. Therefore, this questionnaire has great discriminant validity.

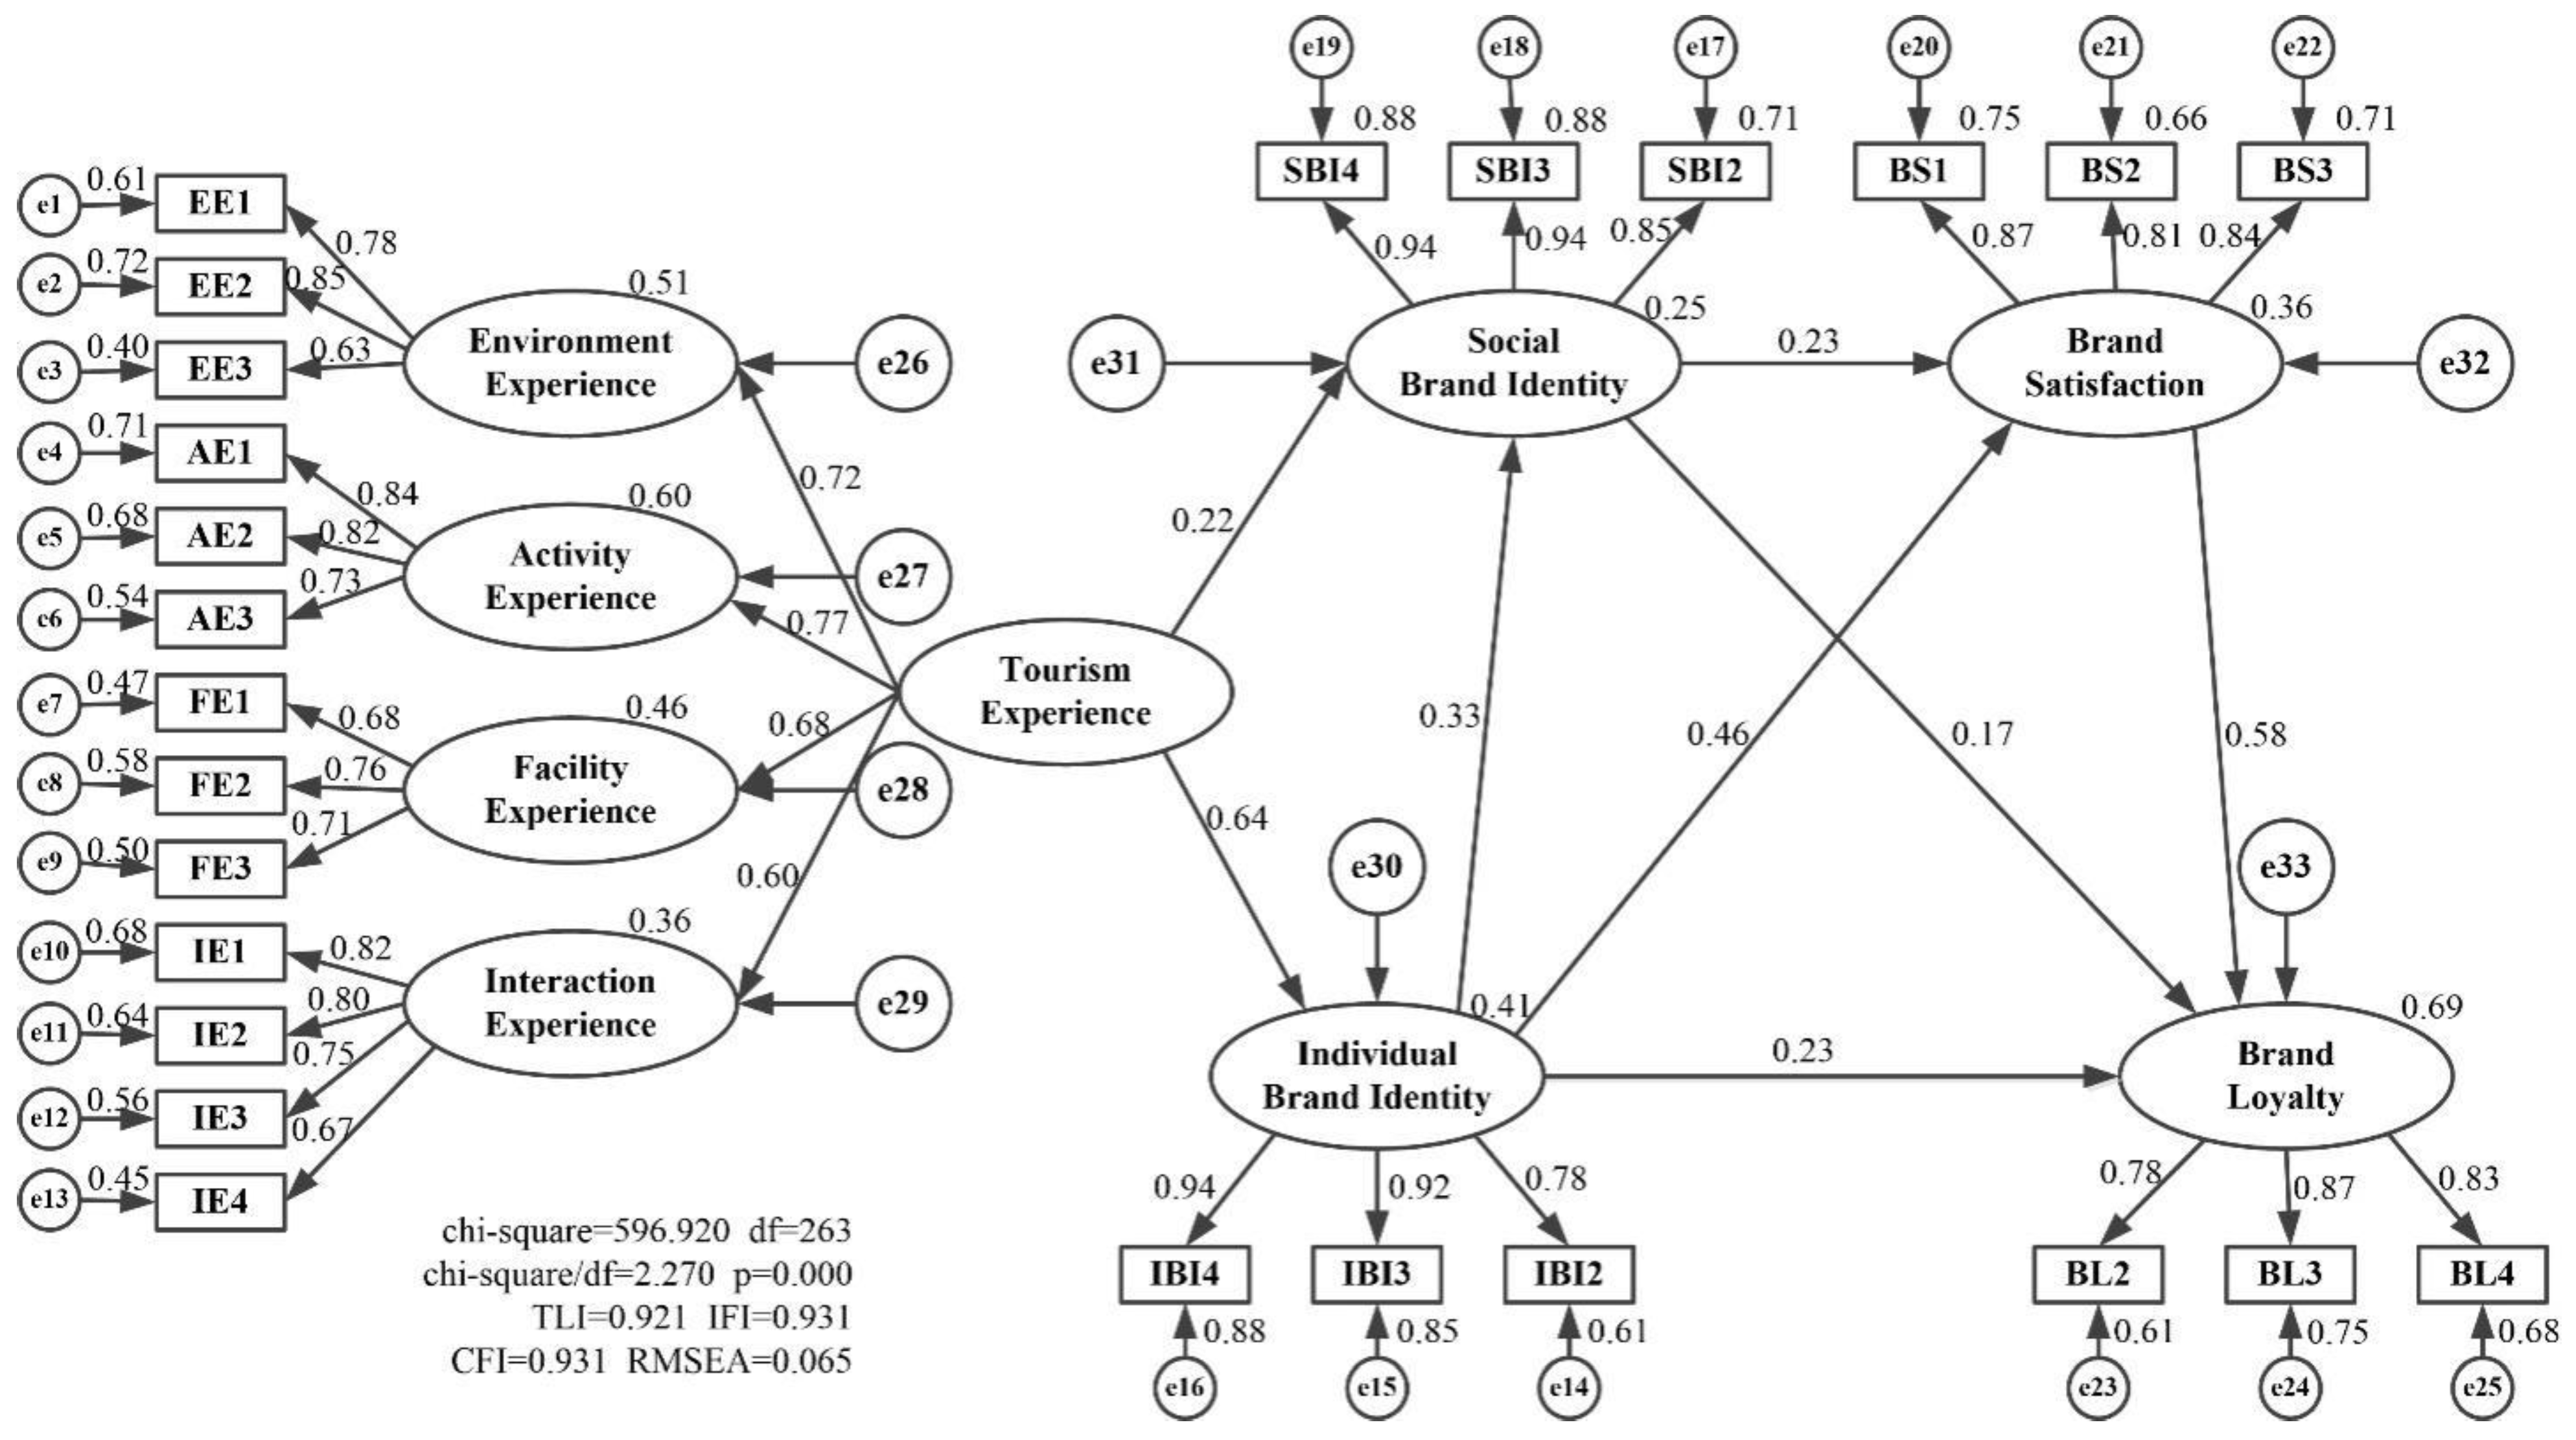
4.3. Second-Order Confirmatory Factor Analysis

Since this study puts the tourism experience as a whole into the SEM for analysis, it still needs to be tested to verify whether the tourism experience can be measured by the first-order variables, such as environment, activity, facility, and interaction experience as a second-order variable. After second-order confirmatory factor analysis, the standardization factor load of the four structural dimensions of tourism experience is between 0.67 and 0.88 except for “interaction experience” (0.45), and the residuals are all positive and significant without violation estimation. The CR value is 0.785, reaching the acceptable threshold of 0.7 and slightly lower than the ideal standard of 0.5; the convergent validity is 0.490, which is mainly due to the low standardization factor load of interaction experience. However, the factor load, CR value and AVE value of the interaction experience dimension are satisfactory (Table 2), and the convergent validity of the second-order dimension is still above the minimum standard of 0.36 [70], reaching the convergent and discriminant validity standard, so the fitness is acceptable. Taking the standardized factor load of tourism experience as the measurement standard, the impact of first-order variables on tourism experience are: activity experience (0.88), environmental experience (0.73), facility experience (0.66), and interaction experience (0.45).
We ensure the four dimensions of tourism experience are reasonable and necessary. The following model analysis should be carried out, including the first-order four-factor correlation model and the second-order factor model. Table 4 shows the Chi-square value/degree of freedom of the second-order factor model of tourism experience is equal to 2.173, less than 3, which has little difference from the Chi-square value/degree of freedom of the first-order four-factor correlation model, indicate that there is no significant difference between the first-order four-factor correlation model and the second-order factor model. Therefore, in this study, the second-order tourism experience meets the requirements of the theoretical model.
In addition, according to Marsh and Hocevar (1985), the target coefficient is the Chi-square value of the first-order factor divided by the Chi-square value of the second-order model [71]. The closer the target coefficient is to 1, the higher the second-order model explains the error variation of the first-order model. The results show that the target coefficient of this study is 0.956, indicating the second-order model of tourism experience can adapt well to the undertaken study. Thus, tourism experience as the second-order variable includes four first-order variables: environment experience, activity experience, facility experience, and interaction experience.

4.4. Structural Model Evaluation and the Research Hypotheses Testing

In terms of evaluation of the proposed conceptual model, we constructed SEM (Figure 2). Our results suggest that the model contains an acceptable statistical level of goodness of fit (χ2 = 596.920, df = 263, χ2/df = 2.270, RMSEA = 0.065, CFI = 0.931, IFI = 0.931, TLI = 0.921).
The results of path analysis of SEM (Table 5) indicate the significance of tourism experience on social brand identity is 0.021, less than 0.05. All other path coefficients are also significant at a level less than 0.001. Thus, hypotheses from H1 to H8 are supported, and the model setting is reasonable.
Table 5 indicates that tourists’ tourism experience has a significant positive effect on individual brand identity (0.643 ***) and social brand identity (0.217 *). Secondly, a significant positive effect (0.331 ***) between individual brand identity and social brand identity was found. Both individual brand identity (0.229 ***) and social brand identity (0.174 ***) have a significant positive effect on brand loyalty, and both of them also have a significant positive effect on brand satisfaction. In addition, brand satisfaction has a significant positive effect on brand loyalty (0.575 ***).

4.5. Mediating Effect Test

According to Figure 2 and Table 5, both social brand identity and brand satisfaction may be mediator variables between individual brand identity and brand loyalty, and there is a significant positive correlation between social brand identity and brand satisfaction. Therefore, the relationship between individual brand identity and brand loyalty may belong to a chain mediation model.
Table 6 reveals that the point estimate of the total indirect effect of individual brand identity on brand loyalty is 0.406 (SE = 0.071, z = 5.718 > 1.96), and the 95% confidence interval does not include the number 0. In addition, the point estimates of the three subdivision paths are 0.048, 0.064, and 0.294, respectively, and the 95% confidence interval does not include the number 0, indicating that the mediation effect of this chain mediation model is significant. Comparing three different mediation paths, the point estimation value of the mediating effect of the path “IBI–BS–BL” is the largest, which is 0.294, accounting for 72.41% of the total indirect effect, and the point estimation value of it is greater than the direct effect of individual brand identity on brand loyalty by 0.254. It can be seen that the 95% confidence interval of the comparison between the other two mediation paths and “IBI–BS–BL” does not include the number 0. Therefore, the path “IBI–BS–BL” is significantly different from the other two mediation effects. Thus, it can be assumed that brand satisfaction plays the most important role in promoting the positive impact of individual brand identity on brand loyalty.
According to the SEM (Figure 2), brand identity and brand satisfaction may be the complete mediator variables between tourism experience and brand loyalty. As brand identity is divided into individual brand identity and social brand identity, there may be multiple mediation effects between tourism experience and brand loyalty. Its mediation effects are tested with Amos 23.0 (IBM SPSS Statistics for Windows, Version 23.0. IBM Corp, Armonk, NY, USA).
Table 7 shows that individual brand identity, social brand identity, and brand satisfaction are the complete mediator variables between tourism experience and brand loyalty. In terms of comparison of the different mediation path effects between tourism experience and brand loyalty, it is found that the point estimation value of the path “TE–IBI–BS–BL” (0.286) is the largest. The point estimate values of paths “TE–SBI–BL”, “TE–IBI–SBI–BL”, “TE–SBI–BS–BL”, and “TE–IBI–SBI–BS–BL” are small, and 95% confidence interval between the comparison of the two different paths includes 0, indicating that there is no significant difference between the four-mediation effect. Therefore, it can be argued that the path “tourism experience–individual brand identity–brand satisfaction–brand loyalty” plays the most important complete intermediary role.

5. Discussion

Through first-order and second-order confirmatory factor analysis, this study confirms the existence of the second-order tourism experience model. In addition, similar to the positive impact of brand experience [28,72], co-creation experience [27], and customer experience [25] on brand identity, this study found that theme park tourism experience has a significant positive direct impact on tourists’ individual brand identity and social brand identity. It was also found that the good tourism experience generated by tourists in the theme park helps tourists form the brand identity of the tourism destination based on individual values, preferred lifestyle, and expected tourism services and respect from surrounding groups, distinguishing group preference types, and obtaining social identity. This finding fills a research gap on the influence of tourists’ tourism experience on the destination brand identity.
This study also confirms that tourists’ individual brand identity of theme parks has a significant positive effect on social brand identity. The results are aligned with previous studies [23,25,26] on tourism. For instance, Li and Li (2013) suggest that there is no significant correlation between social brand identity and brand loyalty [25], while Jin (2006) and Dai et al. (2021) suggest that there is a significant correlation between them [23,73]. Results of our study found that tourists’ individual brand identity and social brand identity of the theme park had a significant positive effect on brand loyalty, indicating that the brands with tourists’ individual and social identity had high brand value. Strengthening individual brand identity and social brand identity is an effective way to improve tourists’ brand loyalty to theme parks. Moreover, it is worth noting that individual brand identity has a greater positive impact on brand loyalty than social brand identity.
Further, our results indicate that tourists’ brand satisfaction with theme parks has a significant positive impact on brand loyalty which supports the findings of previous studies [58,59]. Both individual brand identity and social brand identity have a significant positive impact on brand satisfaction which confirms the claim of Rather et al. (2019) [24]. However, the novelty of this finding is that it refers to the research of Underwood et al. (2001) and Jin (2006), which divides brand identity into individual brand identity and social brand identity based on the level of organizational identity and it confirms the direct and positive relationship between brand identity and brand satisfaction from the perspective of tourism destination brand [20,23]. This study also verifies that “individual brand identity–social brand identity–brand satisfaction–brand loyalty” belongs to the chain mediation model. Because the indirect effect (0.294) of brand satisfaction is greater than the direct effect (0.254) of the chain mediation model, brand satisfaction plays the most important role in the positive impact of individual brand identity on brand loyalty. Therefore, the results suggest that brand identity is not the only emotional feeling that affects consumers’ brand loyalty; rather, brand identity leads to the behavioral response of brand loyalty mainly through arousing consumers’ brand satisfaction. The results of our study are significant supplements to the previous research framework of “brand identity-–brand loyalty” [21,22,24,74,75], thus, extending the scope of application of the S-O-R theoretical framework.
In addition, our results suggest that the tourism experience has an indirect impact on theme parks’ brand loyalty [8,16,18,19], and the intermediary variables in the conceptual model are explored [18,43,44]. Through the multi-mediation effect test, it is found that the path “tourism experience–individual brand identity–brand satisfaction–brand loyalty” plays a critically important mediating role. It can be seen that tourists’ identity with theme park brands is obviously subjective. In this regard, we provide the following explanation. First, when consumers form a high individual identity of the destination brand based on the destination tourism experience, they are likely to have a pleasant and satisfactory emotion, which makes repeated consumption, publicity, and recommendation [22]. Second, social brand identity is measured by the degree of “gaining respect, distinguishing social groups and obtaining social identity,” mainly, it belongs to the external influencing factors of identity and needs the internal promotion of individual identity to play a better role [25]. Therefore, social brand identity is less important to the formation of tourism destination brand satisfaction and brand loyalty, and it is reasonable for tourists’ individual brand identity to play a greater mediation role between tourism experience and brand loyalty.
Finally, this study expands the scholarly understanding of tourism destination brand management in the context of theme parks. Although theme parks are recognized as one of the most popular places of entertainment in the world [3], rare studies are available to provide empirical evidence on theme park brands [42]. Theme parks are facing severe survival difficulties in the post-epidemic era [8]. This study proposed some viable solutions not only to China’s domestic theme park enterprises but also to large-scale global theme park enterprises, intending to establish multiple theme parks with similar themes but different contents in different places.

6. Conclusions

Although the research on theme parks continues to attract scholarly attention, there is a lack of research on the relationship between theme park tourism experience, brand identity, brand satisfaction, and brand loyalty. In order to promote sustainable tourism in theme parks, this study constructs the conceptual model of “tourism experience–brand identity–brand satisfaction–brand loyalty,” and describes the mechanism of theme park tourism experience on the formation of tourists’ brand loyalty based on the S-O-R theoretical framework. In general, the results of this study have confirmed the mediation role of brand identity and brand satisfaction in the conceptual model, the second-order structure of tourists’ experience, and the mechanism that tourism experience has an impact on theme park brand loyalty. Similar to prior studies, we found that tourists generally formed a sense of experience with external stimuli such as the environment, facilities, activities, and interaction among tourists in theme parks [18,50]. In addition, compared with other types of destinations, the vast majority of theme parks are human-made tourist destinations and have marked brands. Hence, the findings of this study can help theme park enterprises understand which dimension of tourism experience is more important and how tourists can form destination brand loyalty through external stimuli so as to enhance better tourists’ experiences and promote sustainable tourism on domestic and foreign theme parks.
Specifically, the present study contributes to the literature in two ways; first, it helps us understand tourists’ satisfactory experience, and second, it strengthens our understanding of sustainable tourism in theme parks. For tourists, their tourism experience can be classified into four dimensions: environment experience, activity experience, facility experience, and interaction experience. When Hsu et al. (2021) studied the experience of food festival attendees, they suggested that aesthetic experience played the most important role in experiential value [38]. Hu et al. (2021) discussed AR experience in theatrical performances in the context of theme parks and suggested that escapism experience plays the most important role in the quality of AR experience. Different from the prior scholars’ tourism experience determinants which are mainly based on the psychological feelings of tourists’ tourism participation depth and degree [29,30], this study focuses on the experience with theme park objective projects, which can help tourism destinations plan the projects that tourists really need and explore the key factors to develop the brand loyalty toward their tourism destination. Through confirmatory factor analysis, we found that activity experience is the most important factor affecting tourists’ experience, followed by environment experience, then facility experience, and finally, interaction experience. For theme parks, improving the richness, creativity, and theme fit of activities is the primary measure to improve tourists’ tourism experience. In terms of the environment experience, the standardized factor load coefficient of cultural architecture is the highest. Thus, building characteristic cultural architecture plays a more significant role in improving tourists’ environment experience. In terms of facility experience, related enterprises can improve tourists’ tourism experience by improving leisure service facilities, tour guide supporting facilities, and creating characteristic souvenirs in line with their own IP. For example, Disney implements the concept of “Never finished Disney” in the environment, activity, and facility experience of the theme park, insists on eliminating one-third of the hardware equipment every year and building one-third of the new concept projects to continuously enhance the freshness and tourism experience of tourists, which makes Disney very popular among Chinese tourists. In terms of interaction experience, although interactive experience is less important to improve consumers’ tourism experience, a better interactive atmosphere among consumers is conducive to maintaining consumers’ pleasant mood, so that the theme park management department can take interaction experience as a hygiene factor to improve tourists’ tourism experience. While advocating civilized and appropriate tourism behavior, it also enables the activities provided themselves to promote better interaction between tourists’ families, couples or parents, and children.
In the era of the experience economy, cultivating consumers’ loyalty to brands by improving consumers’ consumption experience has become an important means for enterprises to reduce production costs, improve competitiveness, and promote their own sustainable development [25]. The results suggest that brand identity and brand satisfaction completely mediate the relationship between tourists’ tourism experience and theme park brand loyalty. Therefore, relevant enterprises should pay attention to providing high-quality tourism experience products and services with the times. In addition, the theme park enterprises can obtain consumers’ brand identity of tourism destination by virtue of consumers’ higher tourism experience and, finally, promote the transformation of consumers’ brand identity to brand satisfaction and brand loyalty. As individual brand identity and brand satisfaction play the most significant mediation role, tourism destination enterprises need to pay special attention to the positive impact of tourism experience on establishing individual brand identity if they want to realize consumers’ loyalty to the brand. The theme park enterprises should clarify the target consumer groups according to their own themes so as to make their tourism products better fit the values, lifestyles, and expectations of tourism services to these groups. Eventually, these theme park enterprises can transform individual brand identity into brand satisfaction by optimizing tourism experience services to realize consumers’ brand loyalty to tourism destinations better.

7. Limitations and Future Research

Due to the limitation of regional conditions, this study only takes samples from one tourism destination, thus lacking the comparative study of a different tourism destinations of the same brand. Tourists from the same country may have different individual brand identity and social brand identity between domestic and foreign theme park brands. Therefore, it is suggested that further research should be conducted from the comparative perspective of domestic theme parks and foreign brands’ theme parks to make the results more convincing and generalizable to tourists’ theme parks destination.
Based on the prior studies, there may be some limitations in selecting the variables included in the model. This study constructs a second-order tourism experience model to explore the existence and strength of the effects of different dimensions of tourism experience. We also suggest that this topic can be further explored by adding more mediator variables between brand identity and brand satisfaction or by embedding a psychological perspective to explain better the formation mechanism of tourists’ brand loyalty to the theme parks.

Author Contributions

Conceptualization and methodology, theoretical development, project administration, review and editing, L.Z.; Theoretical development, design of study, analysis of data and draft manuscript, F.O.; Acquisition data and draft manuscript, Y.L.; Acquisition data, J.Z.; Critical revision and editing, N.A.; Critical revision and editing, M.I. All authors were involved in developing, writing, commenting, editing, reviewing, and revising the manuscript. All authors have read and agreed to the published version of the manuscript.

Funding

This research was funded by General Projects of Guangdong Social Science Planning in 2021, grant number GD21CSH07. And the National Natural Science Foundation of China in 2020, grant number 71974189.

Institutional Review Board Statement

Not applicable.

Informed Consent Statement

Not applicable.

Data Availability Statement

The data presented in this study are available on request.

Conflicts of Interest

The authors declare no conflict of interest.

References

  1. Lee, W.; Sung, H.; Suh, E.; Zhao, J. The effects of festival attendees’ experiential values and satisfaction on re-visit intention to the destination: The case of a food and wine festival. Int. J. Contemp. Hosp. Manag. 2017, 29, 1005–1027. [Google Scholar] [CrossRef]
  2. Rubin, J. 2019 Tea/Aecom Theme Index and Museum Index. Available online: https://www.teaconnect.org/images/files/TEA_369_18301_201201.pdf (accessed on 21 November 2020).
  3. Cheng, Q.; Fang, L.; Chen, H. Visitors’ brand loyalty to a historical and cultural theme park: A case study of hangzhou songcheng, china. Curr. Issues Tour. 2016, 19, 861–868. [Google Scholar] [CrossRef]
  4. Geissler, G.L.; Rucks, C.T. The overall theme park experience: A visitor satisfaction tracking study. J. Vacat. Mark. 2011, 17, 127–138. [Google Scholar] [CrossRef]
  5. Pine, B.J.; Gilmore, J.H. Welcome to the experience economy. Harv. Bus. Rev. 1998, 76, 97–105. [Google Scholar] [PubMed]
  6. Cabanas, E. Experiencing designs and designing experiences: Emotions and theme parks from a symbolic interactionist perspective. J. Destin. Mark. Manag. 2020, 16, 100330. [Google Scholar] [CrossRef]
  7. Hu, R.; Wang, C.; Zhang, T.; Nguyen, T.; Shapoval, V.; Zhai, L. Applying augmented reality (ar) technologies in theatrical performances in theme parks: A transcendent experience perspective. Tour. Manag. Perspect. 2021, 40, 100889. [Google Scholar] [CrossRef]
  8. Milman, A.; Tasci, A.D.; Wei, W. Crowded and popular: The two sides of the coin affecting theme-park experience, satisfaction, and loyalty. J. Destin. Mark. Manag. 2020, 18, 100468. [Google Scholar] [CrossRef]
  9. Zhu, C.; Fong, L.H.N.; Shang, Z.; Gan, M. Rethinking the impact of theme park image on perceived value and behavioral intention: The case of chimelong ocean kingdom, china. Sustainability 2022, 14, 2349. [Google Scholar] [CrossRef]
  10. Zhang, D.; Du, H.; He, F. Research on brand promotion of theme park tourism enterprises based on lovemark theory. Enterp. Econ. 2021, 40, 152–160. [Google Scholar] [CrossRef]
  11. Štrba, Ľ.; Kolačkovská, J.; Kršák, B.; Sidor, C.; Lukáč, M. Perception of the impacts of tourism by the administrations of protected areas and sustainable tourism (un) development in slovakia. Sustainability 2022, 14, 6696. [Google Scholar] [CrossRef]
  12. Kim, J.-H. The impact of memorable tourism experiences on loyalty behaviors: The mediating effects of destination image and satisfaction. J. Travel Res. 2018, 57, 856–870. [Google Scholar] [CrossRef]
  13. Sánchez-Sánchez, M.-D.; Pablos-Heredero, C.D.; Montes-Botella, J.-L. The internal demand of cultural tourism: Understanding satisfaction and fidelity to destination in spain through a non-linear structural model. Sustainability 2021, 13, 13487. [Google Scholar] [CrossRef]
  14. Xu, H.; Li, Q.Y. Analysis of the evaluation dimensions and causal relationship on theme park visitors’ experience quality: Based on a c-trip comments review of disney and happy valley. Tour. Sci. 2017, 31, 57–68. [Google Scholar] [CrossRef]
  15. Volo, S. Conceptualizing experience: A tourist based approach. J. Hosp. Mark. Manag. 2009, 18, 111–126. [Google Scholar] [CrossRef]
  16. Kim, J.J.; Fesenmaier, D.R. Tourism Experience and Tourism Design. In Design Science in Tourism; Springer: Cham, Switzerland, 2017; pp. 17–29. [Google Scholar]
  17. Bloemer, J.M.; Kasper, H.D. The complex relationship between consumer satisfaction and brand loyalty. J. Econ. Psychol. 1995, 16, 311–329. [Google Scholar] [CrossRef]
  18. Chen, X.Q.; Cai, R.L. Analysis on the relationship between theme park consumption experience and tourism behavior intention. J. Commer. Econ. 2016, 23, 191–193. [Google Scholar] [CrossRef]
  19. Wu, W.Z.; Tang, P. The influencing mechanism of tourism experience quality on visitors’ destination loyalty. J. Anhui Univ. 2022, 46, 148–156. [Google Scholar] [CrossRef]
  20. Underwood, R.; Bond, E.; Baer, R. Building service brands via social identity: Lessons from the sports marketplace. J. Market. Theory Prac. 2001, 9, 1–13. [Google Scholar] [CrossRef]
  21. Stokburger-Sauer, N.; Ratneshwar, S.; Sen, S. Drivers of consumer–brand identification. Int. J. Res. Mark. 2012, 29, 406–418. [Google Scholar] [CrossRef]
  22. He, H.; Li, Y.; Harris, L. Social identity perspective on brand loyalty. J. Bus. Res. 2012, 65, 648–657. [Google Scholar] [CrossRef]
  23. Jin, L.Y. A brand equity driving model based on brand personality and brand identification. J. Beijing Technol. Bus. Univ. 2006, 38–43. [Google Scholar] [CrossRef]
  24. Rather, R.A.; Tehseen, S.; Itoo, M.H.; Parrey, S.H. Customer brand identification, affective commitment, customer satisfaction, and brand trust as antecedents of customer behavioral intention of loyalty: An empirical study in the hospitality sector. J. Glob. Sch. Mark. 2019, 29, 196–217. [Google Scholar] [CrossRef]
  25. Li, H.M.; Li, R. Study on the relationship during customer experience, brand identity and brand loyalty: The young customer experience of apple mobile phone as the example. Econ. Manag. 2013, 27, 65–71. [Google Scholar]
  26. Xin, L.Q.; Wang, X.Y. Effect tourism destination brand image recognition elements on tourists’ behavior intention: Mediated with brand identification. J. Bus. Econ. Manag. 2016, 88–97. [Google Scholar] [CrossRef]
  27. Ning, C.H.; Xue, Z. Customer perception support, co-creation experience and brand identity. Res. Financ. Econ. Issues 2016, 138–143. [Google Scholar] [CrossRef]
  28. Xu, X.L.; Meng, R.; Xu, J.Z. Research on the formation of brand fan effect in new media environment. Oper. Res. Manag. Sci. 2021, 30, 218–225. [Google Scholar] [CrossRef]
  29. Aml, A.; Cjs, B.; Pb, A. Domestic tourists’ experience in protected natural parks: A new trend in pandemic crisis? J. Outdoor Recreat. Tour. 2021, 35, 100398. [Google Scholar] [CrossRef]
  30. Schlesinger, W.; Cervera-Taulet, A.; Pérez-Cabañero, C. Exploring the links between destination attributes, quality of service experience and loyalty in emerging mediterranean destinations. Tour. Manag. Perspect. 2020, 35, 100699. [Google Scholar] [CrossRef]
  31. Light, D. Characteristics of the audience for ‘events’ at a heritage site. Tour. Manag. 1996, 17, 183–190. [Google Scholar] [CrossRef]
  32. Mehrabian, A.; Russell, J.A. An Approach to Environmental Psychology; MIT Press: Cambridge, UK, 1974; pp. 24–30. [Google Scholar]
  33. Eroglu, S.A.; Machleit, K.A.; Davis, L.M. Atmospheric qualities of online retailing: A conceptual model and implications. J. Bus. Res. 2001, 54, 177–184. [Google Scholar] [CrossRef]
  34. Jacoby, J. Stimulus-organism-response reconsidered: An evolutionary step in modeling (consumer) behavior. J. Consum. Psychol. 2002, 12, 51–57. [Google Scholar] [CrossRef]
  35. O’Brien, H.L. The influence of hedonic and utilitarian motivations on user engagement: The case of online shopping experiences. Interact. Comput. 2010, 22, 344–352. [Google Scholar] [CrossRef]
  36. Peng, C.; Kim, Y.G. Application of the stimuli-organism-response (sor) framework to online shopping behavior. J. Internet Commer. 2014, 13, 159–176. [Google Scholar] [CrossRef]
  37. Loureiro, S.; Ribeiro, L. The Effect of Atmosphere on Emotions and Online Shopping Intention: Age Differentiation. proceedings of the Australian and New Zealand Marketing Academy Conference, Perth, Australia, 28–30 November 2011. [Google Scholar]
  38. Hsu, F.C.; Agyeiwaah, E.; Lynn, I.; Chen, L. Examining food festival attendees’ existential authenticity and experiential value on affective factors and loyalty: An application of stimulus-organism-response paradigm. J. Hosp. Tour. Manag. 2021, 48, 264–274. [Google Scholar] [CrossRef]
  39. Hew, J.J.; Leong, L.Y.; Tan, G.W.H.; Lee, V.H.; Ooi, K.B. Mobile social tourism shopping: A dual-stage analysis of a multi-mediation model. Tour. Manag. 2018, 66, 121–139. [Google Scholar] [CrossRef]
  40. Torabi, Z.A.; Shalbafian, A.A.; Allam, Z.; Ghaderi, Z.; Murgante, B.; Khavarian-Garmsir, A.R. Enhancing memorable experiences, tourist satisfaction, and revisit intention through smart tourism technologies. Sustainability 2022, 14, 2721. [Google Scholar] [CrossRef]
  41. Wu, C.W. Destination loyalty modeling of the global tourism. J. Bus. Res. 2016, 69, 2213–2219. [Google Scholar] [CrossRef]
  42. Wang, J.; Choe, Y.; Song, H. Brand behavioral intentions of a theme park in China: An application of brand experience. Sustainability 2020, 12, 4500. [Google Scholar] [CrossRef]
  43. Huang, L.; Li, Q.G.; Jia, G.Q. Effects of tourist shopping experience elements on customer value, satisfaction, and the purchase intentions. Tour. Trib. 2009, 24, 41–45. [Google Scholar] [CrossRef]
  44. Liu, J.Y.; Jing, J.J. A study of the impacts of religious tourism experiences on the behavioral disposition of tourists: The mediating ef-fect of tourists’ mood. Tour. Sci. 2015, 29, 36–48. [Google Scholar] [CrossRef]
  45. Schmitt, B.H. Experimental marketing: How to get customers to sense, feel, think, act and relate to your company and brands. Eur. Manag. J. 2000, 18, 695. [Google Scholar]
  46. Kim, H.; Koo, C.; Chung, N. The role of mobility apps in memorable tourism experiences of korean tourists: Stress-coping theory perspective. J. Hosp. Tour. Manag. 2021, 49, 548–557. [Google Scholar] [CrossRef]
  47. Kim, J.H.; Ritchie, J.B.; McCormick, B. Development of a scale to measure memorable tourism experiences. J. Travel Res. 2012, 51, 12–25. [Google Scholar] [CrossRef]
  48. Milman, A.; Tasci, A.D. Exploring the experiential and sociodemographic drivers of satisfaction and loyalty in the theme park context. J. Destin. Mark. Manag. 2018, 8, 385–395. [Google Scholar] [CrossRef]
  49. Li, X.S.; Si, Y.H.; Li, H. Experience consumption model and implementation plan on the construction of theme parks. Urban Probl. 2008, 48–52. [Google Scholar] [CrossRef]
  50. Kim, J.-H. The antecedents of memorable tourism experiences: The development of a scale to measure the destination attributes associated with memorable experiences. Tour. Manag. 2014, 44, 34–45. [Google Scholar] [CrossRef]
  51. Bu, P.C.; Feng, Y.H. The interaction between brand identity, brand experience and customer loyalty. J. Commer. Econ. 2021, 1, 82–85. [Google Scholar] [CrossRef]
  52. Luo, X.; Jiang, M.H. Content marketing, brand identity and consumer brand loyalty. J. Commer. Econ. 2019, 23, 73–76. [Google Scholar] [CrossRef]
  53. Song, H.; Wang, J.; Han, H. Effect of image, satisfaction, trust, love, and respect on loyalty formation for name-brand coffee shops. Int. J. Hosp. Manag. 2019, 79, 50–59. [Google Scholar] [CrossRef]
  54. Martínez, P.; Del Bosque, I.R. Csr and customer loyalty: The roles of trust, customer identification with the company and satisfaction. Int. J. Hosp. Manag. 2013, 35, 89–99. [Google Scholar] [CrossRef]
  55. Rather, R.; Sharma, J. Customer engagement for evaluating customer relationships in hotel industry. Eur. J. Tour. Hosp. Recreat. 2017, 8, 1–13. [Google Scholar] [CrossRef]
  56. Bhattacharya, C.B.; Sen, S. Customer-company identification: A framework for understanding customers relationships with companies. J. Mark. 2003, 67, 76–88. [Google Scholar] [CrossRef]
  57. Chaudhuri, A.; Holbrook, M.B. The chain of effects from brand trust and brand affect to brand performance: The role of brand loyalty. J. Mark. 2001, 65, 81–93. [Google Scholar] [CrossRef]
  58. Li, J. Impact of tourists’ perceived value on brand loyalty: A case study of xixi national wetland park. Asia Pac. J. Tour. Res. 2021, 26, 262–276. [Google Scholar] [CrossRef]
  59. Mokha, A.K. Brand equity, brand satisfaction, and brand loyalty: A study of select e-commerce industry. Int. J. Online Mark. 2021, 11, 34–50. [Google Scholar] [CrossRef]
  60. Beeho, A.J.; Prentice, R.C. Conceptualizing the experiences of heritage tourists: A case study of new lanark world heritage village. Tour. Manag. 1997, 18, 75–87. [Google Scholar] [CrossRef]
  61. Yoon, Y.-S.; Lee, J.-S.; Lee, C.-K. Measuring festival quality and value affecting visitors’ satisfaction and loyalty using a structural approach. Int. J. Hosp. Manag. 2010, 29, 335–342. [Google Scholar] [CrossRef]
  62. Kim, M.J.; Lee, C.-K.; Chung, N.; Kim, W.G. Factors affecting online tourism group buying and the moderating role of loyalty. J. Travel Res. 2014, 53, 380–394. [Google Scholar] [CrossRef]
  63. Kim, J.W.; Lee, F.; Suh, Y.G. Satisfaction and loyalty from shopping mall experience and brand personality. Serv. Mark. Q. 2015, 36, 62–76. [Google Scholar] [CrossRef]
  64. Bagozzi, R.P.; Yi, Y.; Nassen, K.D. Representation of measurement error in marketing variables: Review of approaches and extension to three-facet designs. J. Econom. 1998, 89, 393–421. [Google Scholar] [CrossRef]
  65. Gorsuch, R.L. Factor Analysis, 2nd ed.; Erlbaum: Mahwah, NJ, USA, 1983. [Google Scholar]
  66. Weston, R.; Gore, P.A. A Brief Guide to Structural Equation Modeling. Couns. Psychol. 2006, 34, 719–751. [Google Scholar] [CrossRef]
  67. Podsakoff, N. Common method biases in behavioral research: A critical review of the literature and recommended remedies. J. Appl. Psychol. 2003, 88, 879–903. [Google Scholar] [CrossRef] [PubMed]
  68. Hulland, J. Use of partial least squares (pls) in strategic management research: A review of four recent studies. Strateg. Manag. J. 1999, 20, 195–204. [Google Scholar] [CrossRef]
  69. Landis, R.S.; Edwards, B.D.; Cortina, J.M. On the Practice of Allowing Correlated Residuals among Indicators in Structural Equation Models. In Statistical and Methodological Myths and Urban Legends: Doctrine, Verity and Fable in the Organizational and Social Sciences; Routledge: London, UK, 2009; pp. 193–214. [Google Scholar]
  70. Fornell, C.; Larcker, D.F. Structural equation models with unobservable variables and measurement error: Algebra and statistics. J. Mark. Res. 1981, 18, 382–388. [Google Scholar] [CrossRef]
  71. Marsh, H.W.; Hocevar, D. Application of confirmatory factor analysis to the study of self-concept: First-and higher order factor models and their invariance across groups. Psychol. Bull. 1985, 97, 562. [Google Scholar] [CrossRef]
  72. Underwood, R.L. The communicative power of product packaging: Creating brand identity via lived and mediated experience. J. Mark. Theory Prac. 2003, 11, 62–76. [Google Scholar] [CrossRef]
  73. Dai, Y.Q.; Chen, Y.Y.L.; Liu, X.G. The mechanism of the effect of clothing brand color salience on brand loyalty. J. Silk 2021, 58, 80–85. [Google Scholar] [CrossRef]
  74. Elbedweihy, A.M.; Jayawardhena, C.; Elsharnouby, M.H.; Elsharnouby, T.H. Customer relationship building: The role of brand attractiveness and consumer–brand identification. J. Bus. Res. 2016, 69, 2901–2910. [Google Scholar] [CrossRef]
  75. Kim, C.K.; Han, D.; Park, S.B. The effect of brand personality and brand identification on brand loyalty: Applying the theory of social identification. Jpn. Psychol. Res. 2001, 43, 195–206. [Google Scholar] [CrossRef]
Figure 1. Conceptual model.
Sustainability 14 11419 g001
Figure 2. Results of the structural model estimation.
Sustainability 14 11419 g002
Table 1. Demographics characteristics of participants.
VariableCategoryNPercentage
GenderMale11738.4
Female18861.6
Age18~259129.8
26~3513343.6
36~456019.7
46 and above216.9
OccupationStudent4414.4
Worker103.3
Company employee12741.6
Individual laborer4314.1
Enterprise management personnel93.0
Civil servant113.6
Education/health/scientific research practitioners299.5
Retiree93.0
Other practitioners237.5
Educational levelPrimary/Junior High school62.0
Senior high school/technical school/vocational school258.2
College6822.3
University18360.0
Graduate school and above237.5
Income (CNY)3000 and under4314.1
3001~65009832.1
6501~10,00012139.7
10,001 and above4314.1
Table 2. Measurement results.
ConstructLoadingAlphaCRAVE
Environment Experience
EE1 CTV Nanhai movie theme park has beautiful natural landscape0.787 ***0.7930.799 0.575
EE2 The cultural architecture of CTV Nanhai movie theme park has its own characteristics0.856 ***
EE3 CTV Nanhai movie theme park is clean and tidy0.611 ***
Activity Experience
AE1 The activities of CTV Nanhai movie theme park are rich and varied0.846 ***0.8390.843 0.642
AE2 The activities of CTV Nanhai movie theme park are creative0.834 ***
AE3 The activity scene design of CTV Nanhai movie theme park conforms to the theme0.717 ***
Facility Experience
FE1 The leisure service facilities of CTV Nanhai movie theme park are perfect0.620 ***0.7550.7660.529
FE2 The tour guide supporting facilities of CTV Nanhai movie theme park are perfect0.892 ***
FE3 CTV Nanhai movie theme park can provide characteristic tourist souvenirs0.639 ***
Interaction Experience
IE1 I get along well with other tourists in CTV Nanhai movie theme park0.834 ***0.8440.8460.581
IE2 I interact well with other tourists in CTV Nanhai movie theme park0.795 ***
IE3 I think the behavior of other tourists in CTV Nanhai movie theme park is civilized and appropriate0.740 ***
IE4 The activities of CTV Nanhai movie theme park can promote family/couple/parent-child interaction0.668 ***
Individual Brand Identity
IBI2 I agree with the values represented by the brand “CTV Media”0.780 ***0.9100.914 0.781
IBI3 I agree with the lifestyle represented by this brand0.946 ***
IBI4 I agree with the tourism services provided by this brand0.917 ***
Social Brand Identity
SBI2 Traveling in the theme parks of “CTV Media” can make me gain the respect of others0.841 ***0.9320.933 0.824
SBI3 Traveling in the theme parks of “CTV Media” can help me distinguish myself from different types of people0.938 ***
SBI4 Traveling in the theme parks of “CTV Media” helps me get social recognition0.941 ***
Brand Satisfaction
BS1 Generally speaking, I am very satisfied with the theme parks of “CTV Media”0.859 ***0.8780.881 0.711
BS2 Generally speaking, I feel happy to travel to the theme parks of “CTV Media”0.802 ***
BS3 I think it is a good decision to travel to the theme parks of “CTV Media”0.867 ***
Brand Loyalty
BL2 Instead of trying other unknown theme parks, I prefer to travel to the theme parks of “CTV Media”0.782 ***0.8640.865 0.682
BL3 I will continue to take “CTV Media” as the preferred tourism destination brand0.890 ***
BL4 I am willing to recommend the theme parks of “CTV Media” to the people around me0.802 ***
Note: *** Significance p < 0.001.
Table 3. Discriminant validity (Fornell and Larcker, (1981) [70] criteria).
BLBSSBIIBIIEFEAEEE
BL0.826
BS0.7820.843
SBI0.5360.4400.908
IBI0.6320.5520.4710.884
IE0.4440.5050.3840.6070.762
FE0.3750.5300.2950.3930.4130.727
AE0.3490.4880.2910.4040.3700.5790.801
EE0.3410.4940.2620.4260.3260.4470.6650.758
Note: BL—Brand loyalty; BS—Brand satisfaction; SBI—Social brand identity; IBI—Individual brand identity; IE—Interaction experience; FE—Facility experience; AE—Activity experience; EE—Environment experience. Bold font = square-root of the AVE.
Table 4. Tourism experience two model confirmatory factor model fitness index.
ModelChi-SquaredfChi-
Square/df
CFIGFIAGFIRMSEA
First-order four factor correlation model126.654592.1470.9600.9400.9080.061
Second-order factor model132.541612.1730.9570.9400.9100.062
Recommended valueThe smaller the betterThe bigger the better<3.000>0.900>0.900>0.900<0.080
Target coefficient = 126.654/132.541 ≈ 0.956.
Table 5. Conceptual model path coefficient test.
PathUnstd. Path
Estimate
S.E.t-ValuepStd. Path Estimate
TEIBI0.9730.14560.689***0.643
IBISBI0.5280.13330.969***0.331
TESBI0.5240.22620.3170.021 *0.217
IBIBS0.4290.06160.975***0.460
SBIBS0.1320.03630.708***0.226
IBIBL0.2540.06430.945***0.229
SBIBL0.1210.03530.438***0.174
BSBL0.6860.07880.828***0.575
Note: TE—Tourism experience; IBI—Individual brand identity; SBI—Social brand identity; BL—Brand loyalty; BS—Brand satisfaction. * Significance p < 0.05, *** Significance p < 0.001.
Table 6. Chain mediation model testing.
RelationshipPoint EstimationProduct of CoefficientsBias-CorrectedPercentile
SEZLowerUpperLowerUpper
Direct effect
IBI→BL0.2540.07830.2560.1090.4150.1040.411
Indirect effect
① IBI→SBI→BS→BL0.0480.01920.5260.0190.0990.0130.085
② IBI→SBI→BL0.0640.02820.2860.0210.1360.0130.122
③ IBI→BS→BL0.2940.06440.5940.1900.4430.1860.433
Indirect total effect0.4060.07150.7180.2870.5730.2740.553
Comparison of chain mediating effects
② vs. ①0.0160.0290.552−0.0310.088−0.0380.078
③ vs. ①0.2460.06630.7270.1310.3930.1310.394
③ vs. ②0.2300.07330.1510.0970.3830.1010.391
Note: The above chain mediating effect test uses bootstrap sampling test, with 5000 sampling times, and both bias-corrected and percentile adopt 95% confidence interval.
Table 7. The multi-mediation effect test between tourism experience and brand loyalty.
Effect TypePoint EstimationProduct of CoefficientsBias-CorrectedPercentile
SEZLowerUpperLowerUpper
Mediation effect test between tourism experience and brand loyalty:
Total effect0.7530.17440.3280.49610.1810.49610.181
Direct effect0.0000.000-----
Indirect effect0.7530.17440.3280.49610.1810.49610.181
Comparison of mediation effect between tourism experience and brand loyalty:
① TE→ISI→BL0.2470.08420.9400.1080.4450.1030.434
② TE→SBI→BL0.0640.04310.4880.0100.1930.0050.172
③ TE→IBI→SBI→BL0.0620.02820.2140.0230.1440.0150.120
④ TE→SBI→BS→BL0.0480.04210.1430.0030.1600.0020.158
⑤TE→IBI→SBI→BS→BL0.0470.01920.4740.0210.0980.0140.086
⑥ TE→IBI→BS→BL0.2860.09620.9790.1520.5330.1490.527
① vs. ②0.1840.08820.0910.0250.3750.0190.368
① vs. ③0.1850.08820.1020.0310.3800.0340.385
① vs. ④ 0.2000.09120.1980.0390.4000.0230.380
① vs. ⑤0.2010.08820.2840.0490.4000.0490.401
① vs. ⑥−0.0390.120−0.325−0.3300.151−0.3150.157
② vs. ③0.0010.0530.019−0.0940.120−0.0890.131
② vs. ④0.0160.0330.485−0.0380.097−0.0600.076
② vs. ⑤0.0170.0500.340−0.0490.157−0.0530.144
② vs. ⑥−0.2230.098−20.276−0.459−0.072−0.454−0.068
③ vs. ④0.0150.0600.250−0.1050.115−0.1290.102
③ vs. ⑤0.0160.0280.571−0.0300.084−0.0370.076
③ vs. ⑥−0.2240.10020.240−0.466−0.082−0.473−0.084
④ vs. ⑤0.0010.0450.022−0.0520.107−0.0480.123
④ vs. ⑥−0.2390.094−20.543−0.485−0.099−0.454−0.086
⑤ vs. ⑥−0.2400.096−20.500−0.475−0.105−0.478−0.106
Note: The above multi-mediation effect test uses bootstrap sampling test, with 5000 sampling times, and both bias-corrected and percentile adopt 95% confidence interval.
Publisher’s Note: MDPI stays neutral with regard to jurisdictional claims in published maps and institutional affiliations.

